[Ne v] emission from a faint epoch of reionization-era galaxy: evidence for a narrow-line intermediate mass black hole
Abstract
Here we present high spectral resolution JWST NIRSpec observations of GN 42437, a low-mass (log(M), compact (pc), extreme starburst galaxy at with 13 emission line detections. GN 42437 has a low-metallicity (5-10% Z⊙) and its rest-frame H equivalent width suggests nearly all of the observed stellar mass formed within the last 3 Myr. GN 42437 has an extraordinary 7 significant [Ne v] 3427 Å detection. The [Ne v] line has a rest-frame equivalent width of Å, [Ne v]/H, [Ne v]/[Ne iii] 3870Å , and [Ne v]/He ii 4687Å . Ionization from massive stars, shocks, or high-mass X-ray binaries cannot simultaneously produce these [Ne v] and other low-ionization line ratios. Reproducing the complete nebular structure requires both massive stars and accretion onto a black hole. We do not detect broad lines nor do the traditional diagnostics indicate that GN42437 has an accreting black hole. Thus, the very-high-ionization emission lines powerfully diagnose faint narrow-line black holes at high-redshift. We approximate the black hole mass in a variety of ways as log(M. This black hole mass is consistent with local relations between the black hole mass and the observed velocity dispersion, but significantly more massive than the stellar mass would predict. Very-high-ionization emission lines may reveal samples to probe the formation and growth of the first black holes in the universe.
keywords:
galaxies: high-redshift – galaxies: evolution – galaxies: formation1 Introduction
JWST observations have discovered a rich and ubiquitous population of super massive black holes (SMBH) in fainter galaxies at higher redshifts than previously known (Brinchmann, 2023; Furtak et al., 2023; Goulding et al., 2023; Greene et al., 2023; Harikane et al., 2023; Kocevski et al., 2023; Kokorev et al., 2023; Labbé et al., 2023; Larson et al., 2023; Maiolino et al., 2023; Matthee et al., 2023; Onoue et al., 2023; Scholtz et al., 2023; Übler et al., 2023; Kokorev et al., 2024; Lambrides et al., 2024). These recently detected black holes have masses that range up to M⊙ only a few 100 Myr after the Big Bang. Energy and momentum from these intrinsically luminous sources may impact the formation and evolution of their host galaxies (Gebhardt et al., 2000; Ferrarese & Merritt, 2000). Fully accounting for the energy and momentum that accretion onto early black holes injects into the gas within galaxies requires revealing the population demographics of black holes in the early universe.
Combined with observations of UV-bright quasars (Becker et al., 2001; Fan et al., 2006; Willott et al., 2010; Jiang et al., 2016; Bañados et al., 2018; Matsuoka et al., 2018, 2019; Eilers et al., 2023; Yang et al., 2023), these observations have firmly established the existence of SMBHs at , but theory still debates how these SMBHs formed. The age of the universe is just 1 Gyr at . If black holes start as stellar mass black holes ( M⊙), Eddington-limited accretion just barely grows the black hole to 108 M⊙ in the age of the universe (Haiman & Loeb, 2001; Bromm & Larson, 2004). This leaves little time for the universe to expand and sufficiently cool to form the first black holes without super-Eddington accretion prescriptions (Madau et al., 2014; Schneider et al., 2023).
Alternatively, the first black holes in the early universe may have formed as intermediate mass black holes (IMBHs; 103-6 M⊙; Greene & Ho, 2004; Mezcua, 2017; Greene et al., 2020). These larger seeds start closer to the observed mass of SMBHs, partially relieving the pressure to accrete so rapidly to become a SMBH. Heroic effort has attempted to uncover IMBHs in the local universe, revealing limited robust detections (e.g. Gebhardt et al., 2005; Izotov et al., 2007; Greene et al., 2008; Noyola et al., 2010; Lützgendorf et al., 2013; Moran et al., 2014; Reines & Volonteri, 2015; Nguyen et al., 2017; Lin et al., 2018; Nguyen et al., 2019; Pechetti et al., 2024). As such, observations still have not provided the crucial link between stellar mass black holes and SMBHs.
In the local universe, SMBHs are distinguishable from star-forming galaxies using the ratio of strong optical emission lines (Baldwin et al., 1981; Veilleux & Osterbrock, 1987; Kewley et al., 2001; Kauffmann et al., 2003) or broad ( km s-1) Balmer emission lines (Osterbrock et al., 1976). Galaxies with broad Balmer lines are often called broad-line Active Galactic Nuclei (AGN), or Type i AGN. The broad-lines provide direct kinematic evidence for the sphere of influence of the black hole and enable robust black hole mass estimates (MBH; Vestergaard & Peterson, 2006; Greene & Ho, 2007; Shen & Kelly, 2012; Padovani et al., 2017). The other type of AGN, Type ii, are galaxies where ratios of their optical emission lines indicate the presence of a black hole, but the emission lines are narrow ( km s-1). Emission line ratios have uncovered significant populations of Type ii AGN in the local universe (Heckman et al., 2004; Kauffmann & Heckman, 2009; Liu et al., 2009; Heckman & Best, 2014; Moran et al., 2014; Hickox & Alexander, 2018).
Low-redshift methods to distinguish AGN have challenges at high-redshift, where galaxies have lower masses and metallicities (Groves et al., 2004; Kewley et al., 2013; Dors et al., 2024). Most high-redshift SMBHs have been classified based on the presence of broad Balmer emission lines (Greene et al., 2023; Harikane et al., 2023; Kocevski et al., 2023; Larson et al., 2023; Maiolino et al., 2023; Matthee et al., 2023). However, high-redshift black holes are likely significantly lower mass. The expected broad-line Gaussian velocity widths () reduce from km s-1 for SMBHs to 20–250 km s-1 for IMBHs. These narrow line widths are similar to H ii regions within low-mass star-forming galaxies, making IMBHs challenging to spectroscopically tease out. Extremely high spectral resolution observations of these intrinsically faint sources must detect the relatively narrow emission lines. As cosmological dimming makes more distant galaxies increasingly fainter, determining the kinematic properties of IMBHs becomes increasingly challenging. While most of the high-redshift SMBHs have been discovered using broad-lines, only about one-quarter to a half of the low-redshift AGN are Type i (Ho et al., 1997; Ho, 2008). To fully characterize the high-redshift AGN population a complete census of Type ii AGN are required.
Unfortunately, metal-poor stars have extremely hard ionizing spectra (Leitherer et al., 1999; Schaerer, 2002; Eldridge et al., 2017; Chisholm et al., 2019; Telford et al., 2023), which can mimic the ionizing spectral shapes of accretion disks onto black holes. Low-metallicity massive stars and IMBHs have similar ionizing slopes and shapes up to 54 eV (Feltre et al., 2016). These harder spectra ensure that low-metallicity star-forming galaxies have similar [O iii]/H ratios as high-metallicity AGN. Additionally, the hard-ionizing spectra of low-metallicity stars can fully ionize low-ionization gas ([N ii] 6585 Å, [S ii] 6718,6733 Å, [O i] 6300 Å). Low-metallicity AGN and star-forming galaxies reside in nearly the same locations in the traditional diagnostic diagrams (Shirazi & Brinchmann, 2012; Moran et al., 2014; Reines & Volonteri, 2015). A different diagnostic is required to reveal narrow-line AGN in low-metallicity systems.
Stellar ionizing spectra do not extend much below the second helium ionization edge (54 eV), except at zero metallicity (Tumlinson & Shull, 2000; Schaerer, 2002). Metal poor stars cannot produce very-high-ionization gas phases, which are defined as having ionization potentials greater than 54 eV (Leitherer et al., 1999; Izotov et al., 2004; Thuan & Izotov, 2005; Eldridge et al., 2017; Stanway & Eldridge, 2019; Berg et al., 2021; Olivier et al., 2022). Meanwhile, the ionizing spectrum of accretion disks around black holes extends to these ionization energies (Cann et al., 2018, 2019; Satyapal et al., 2021; Richardson et al., 2022; Hatano et al., 2023), and very-high-ionization emission lines are commonly observed in the spectra of AGN at low-redshift (Osterbrock, 1989; Zakamska et al., 2003; Dasyra et al., 2008; Gilli et al., 2010). Therefore, very-high-ionization emission lines promise to robustly separate low-metallicity star-forming galaxies and IMBHs. Powerful diagnostics using C iv 1550 Å (with an ionization energy of 64 eV), He ii 1640 Å (with an ionization energy of 54 eV), [Ne iv] 2423 Å (with an ionization energy of 97 eV), and N iv 1720 (with an ionization energy of 77 eV) have been proposed to separate low-metallicity star-forming galaxies from AGN (Shirazi & Brinchmann, 2012; Feltre et al., 2016; Berg et al., 2018; Nakajima et al., 2018; Senchyna et al., 2020; Schaerer et al., 2022; Olivier et al., 2022).
Here, we present JWST NIRSpec high-spectral resolution observations of a low-mass, extreme starburst galaxy, hereafter called GN 42437, at that has a strong [Ne v] 3427 Å detection. Ionizing gas from the [Ne iv] to the [Ne v] state requires photons with energy above 97 eV, energies that even the most massive stars cannot produce. In section 2 and section 3 we introduce the observations and data reduction. We use these observations in section 4 and section 5 to determine the galaxy properties and emission line characteristics. We discuss the very-high-ionization emission lines (section 6), the full nebular structure (subsection 7.1), and how a black hole is the most likely source of the observed very-high-ionization emission lines (subsection 7.2). In section 8 we discuss the properties of the black hole in GN 42437. IMBHs during the early stages of the universe are discussed in section 9 and we conclude in section 10.
Throughout this paper, we use a cosmology with H, and (Planck Collaboration et al., 2020), such that 0.1” corresponds to 600 pc at . All magnitudes are AB magnitudes. Solar metallicity is defined as 12+log(O/H (Asplund et al., 2009). All rest-frame wavelengths of emission lines are given as Angstroms (Å) in the vacuum-frame using the National Institute of Standards and Technology (NIST) database (Kramida et al., 2018).
2 Observations
We obtained JWST (McElwain et al., 2023; Rigby et al., 2023) NIRSpec (Böker et al., 2023) G235H/F170LP and G395H/F290LP observations of 20 galaxies in the GOODS-North (GN) field (JWST Project ID: 1871, PI: Chisholm) using the Multi-Slit Array (MSA; Ferruit et al., 2022) on February 10, 2023. The main goal of this project is to measure both the production and escape of ionizing photons from a sample of galaxies during the epoch of reionization. We selected the high-resolution grating configuration to obtain velocity-resolved profiles of the Mg ii emission lines. Mg ii profiles offer crucial clues for the neutral gas column density (Henry et al., 2018; Chisholm et al., 2020; Xu et al., 2023). Detecting faint Mg ii emission requires deep observations. Additionally, weak Balmer emission lines measure the dust attenuation and nebular properties (Stephenson et al. in preparation) of the individual galaxies. The Mg ii results will be featured in Gazagnes et al. (in preparation), while here we focus on the [Ne v] 3427 Å emission from a galaxy in the MSA footprint, GN 42437.
We centered the MSA footprint on a well-known, bright, Ly emitter in the GN field (Finkelstein et al., 2013; Hutchison et al., 2019; Jung et al., 2020). We used the deep Hubble Space Telescope (HST) H-band observations to provide possible targets with spectroscopically confirmed (Jung et al., 2020) or photometrically suggested redshifts greater than 5. We created a catalog of 1,036 possible sources from Finkelstein et al. (2015) and Bouwens et al. (2015) and used the 100 mas pixel-scale Complete Hubble Archive for Galaxy Evolution (CHArGE; Fujimoto et al., 2022)111https://s3.amazonaws.com/grizli-stsci/Mosaics/index.html?222https://gbrammer.github.io/projects/charge/ HST F160W imaging to define the source locations. CHArGE aligns all of the HST images onto Gaia DR2 reference frames and, pre-JWST imaging, provided the highest spatial resolution and most accurate source locations. From the catalog of 1,036 candidates, we selected 20 sources within one MSA footprint of the bright Ly emitter. We required these targets to have F160W magnitudes less than 28 mag and Spitzer 4.5 m detections. This ensured that the targeted galaxies resembled star-forming galaxies within the epoch of reionization that were sufficiently bright to detect Mg ii and other nebular emission lines. The full galaxy sample will be discussed in an upcoming paper (Saldana-Lopez et al. in preparation). Here we focus on GN 42437, which was designated as source "63" in the MSA planning tool because it was the 63rd source drawn from the Finkelstein et al. (2015) catalog (see Table 1 for the Right Ascension, Declination, and properties of GN 42437).
| Property | Value |
|---|---|
| Right Ascension [J2000] | 189.17219 deg |
| Declination [J2000] | 62.30564 deg |
| -19.1 mag | |
| SFR | M⊙ yr-1 |
| LX [2–10 keV] | erg s-1 |
| log(/M⊙) | 7.9 |
| log(M⊙) |
Importantly, GN 42437 was selected as one of the faintest galaxies in the sample (F160W magnitude of 27.6 mag; Table 1) with a photometric redshift of 5.813 (Finkelstein et al., 2015). This galaxy was not selected specifically based on any of its rest-frame FUV or optical properties. We selected it only because it was within one NIRSpec MSA footprint of the main target, its photometric redshift suggested it was in the tail-end of the epoch of reionization, and the HST and Spitzer observations suggested it was sufficiently bright for NIRSpec to detect rest-frame optical emission lines.
We used the Skelton et al. (2014) catalog to define five reference stars for MSA alignment. These five sources were distributed in three of the MSA quadrants. We estimated the expected JWST colors of these reference stars using the HST photometry (Documentation, 2016). We included two of these reference stars on the MSA slit design to aid in flux and wavelength calibration. For the target acquisition, we used the MSATA method with the F140X filter and the NRSRAPIDD6 readout pattern. The acquisition used three groups per integration and four total integrations for a total exposure time of 687 s. We then took a final confirmation image with one exposure and 30 groups per integration with the NRSIRS2RAPID readout pattern for a total time of 452 s.
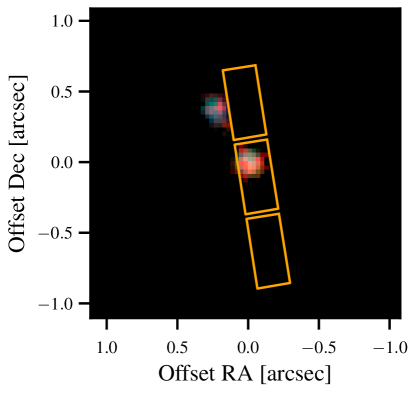
The science observations were split between the G235H and G395H grating configurations. The G235H observations typically cover rest-frame wavelengths between 2550–3500 Å for galaxies within the epoch of reionization (). This wavelength range contains the intrinsically weak Mg ii emission lines and the [Ne v] 3427 Å line. Thus, we prioritized the G235H grating with longer total exposure times. For the G235H observations, we exposed using the NRSIRS2 readout mode for 20 groups per integration with 6 integrations per exposure and 36 total exposures for a total integration time of 53,044 s, or 14.7 hours. The G395H observations cover rest-frame optical emission lines that are brighter than Mg ii and require significantly shorter integration times. For the G395H grating we observed using the NRSIRS2 readout mode with 22 groups per integration and two integrations per exposure with 6 total integrations for a total exposure time of 9716 s, or 2.7 hours. We observed with the standard three shutter nod pattern for background subtraction. These three NIRSpec MSA shutters are overlaid on the NIRCam image of GN 42437 in Figure 1. The background shutters (upper and lower rectangles) do not contain any discernible galaxy emission. We intentionally designed the MSA configurations to include all of the crucial rest-frame optical and NUV lines of GN 42437, including H, H, and [O iii] 4363 Å. However, the slight difference between the photometric and spectroscopic redshift ( versus ) meant that some of these lines fell in the detector gaps or between the two gratings.
NIRCam (Rieke et al., 2023) imaging of the GN field was taken with the First Reionization Epoch Spectroscopically Complete Observations (FRESCO; Oesch et al., 2023). These observations included medium-band observations with the F182M and F210M bands in the short-wavelength channel, and F444W observations in the long-wavelength channel. The FRESCO imaging was designed to reach the significance for a 28.2 mag source in each filter with 4456, 3522, and 934 s of total exposure time for the F182M, F210M, and F444W filters, respectively. GN 42437 is significantly detected in all FRESCO images (see subsection 3.1). The GN field has a rich data set in multi-wavelength observations, including deep HST observations. We also used the Chandra Deep Field-North Survey (Alexander et al., 2005) to provide X-ray information on GN 42437. We use these NIRCam and Chandra images to verify the NIRSpec data reduction and to infer the properties of GN 42437.
| Filter | NIRSpec | HST or NIRCam | r | ||
|---|---|---|---|---|---|
| [nJy] | [nJy] | [arcsec] | |||
| ACS/F606W | |||||
| ACS/F775W | |||||
| ACS/F814W | |||||
| ACS/850LP | |||||
| WFC3/F105W | |||||
| WFC3/F125W | |||||
| F182M | 0.0648 | 9.9 | 0.63 | ||
| F210M | 0.1044 | 5.6 | 0.04 | ||
| F444W | 0.0525 | 9.9 | 0.32 | ||
| F250M | |||||
| F335M | |||||
| F360M | |||||
| F410M |
3 Reduction
Here we describe the reduction of the JWST NIRCam (subsection 3.1) and JWST NIRSpec (subsection 3.2) data.
3.1 NIRCam Data Reduction
We reduce the FRESCO NIRCam imaging following the methods outlined in Endsley et al. (2023), utilizing both custom scripts as well as the JWST Science Calibration Pipeline333https://jwst-pipeline.readthedocs.io/en/latest/index.html (v1.11.3). We use custom snowball and wisp subtraction scripts, that incorporate sky flats and wisp templates constructed from public data, and adopt the photometric zeropoints from Boyer et al. (2022) as part of the jwst_1106.pmap reference file. We subtract noise and the 2D background from the *_cal.fits files on an amplifier-by-amplifier basis using the sep package (Barbary, 2016). Each *_cal.fits file is individually aligned to the Gaia astrometric frame using the CHArGE HST WFC3/F160W reductions of the GN field. All NIRCam mosaics are resampled onto the same World Coordinate System with a scale of 30 mas pixel-1 during the final stage of the pipeline. The individual images are convolved to the point-spread function (PSF) of the F444W filter (the longest wavelength filter) using empirically defined PSFs from within the FRESCO mosaics. Figure 1 shows the FRESCO three-color PSF-convolved NIRCam image of GN 42437 with the 3-shutter NIRSpec MSA pattern overlaid. GN 42437 has an obvious red color from a F444W excess.
3.2 NIRSpec Data Reduction
As in-flight reference files have been added to the NIRSpec reduction pipeline, significant improvements have been made to the data quality. We used the reference files designated as jwst_1174.pmap, which were released on the CDRS website444https://jwst-crds.stsci.edu/ on December 14, 2023. These updated reference files include in-orbit dark, mask, and bias files that were taken between July 2022 and December 2022. The improvement from the reference files has dramatically changed the delivered data quality since the observations were initial taken. These latest reference files significantly impact both the relative and absolute fluxing of the NIRSpec data as well as the outlier rejection. Previous reductions using older reference files produced significantly non-physical Balmer decrement values and contained a large number of flux spikes that compromised the interpretation of the faint emission lines presented here.
We reduced the NIRSpec data using msaexp v06.17 (Brammer, 2023). msaexp is a publicly available555https://github.com/gbrammer/msaexp python code that acts as a wrapper for the default Space Telescope Science Institute data reduction pipeline, while providing a few additional steps. In particular, msaexp uses the grizli code (Brammer, 2019) to drizzle and combine the individual exposures. We further augment the msaexp pipeline using the residual 1/f-noise correction NSClean which was recently released by Space Telescope Science Institute (Rauscher, 2023). We used the Space Telescope Science Institute default pathloss correction algorithm, assuming a point source. The NIRCam imaging of GN 42437 suggests that it is near the diffraction limit of the NIRSpec system (Table 2). Figure 1 also suggests that the object is well-captured by the MSA slit but slightly off-center. Comparisons between the NIRCam and NIRSpec fluxes (see below) suggest that this NIRSpec reduction process accurately reproduces the NIRCam fluxes of GN 42437.
For each of the 20 sources that we opened MSA slits for, we manually set the initial location, size, and shape of the spectral extraction trace in msaexp based on a by-eye assessment of the source location and then fit for the optimal extraction from the rectified spectra. The final spectrum for GN 42437 was extracted from a location 3.5 pixels below the center of the slit using an optimal extraction with an initial guess at the width of 1 pixel for both grating configurations. We visually inspected all of the individual exposures for contamination and shutter malfunctions, which we did not find, and included all exposures of GN 42437 in the final co-addition of the data.
The final data product of msaexp is a two-dimensional and one-dimensional extracted flux and error spectra of each configuration. We compared the continuum standard deviation to running medians of the estimated from the msaexp pipeline. We found that the noise estimates accurately reproduced the variability in the continuum. Therefore, we did not scale the uncertainties further.
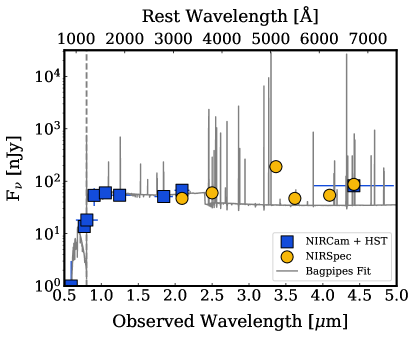
Previous NIRSpec programs have normalized the NIRSpec data to the observed NIRCam observations to finalize the NIRSpec absolute flux calibration. In the past this has been done to correct for uncertain flux calibration or for aperture losses. The FRESCO NIRCam imaging provides three separate wavelength regimes to compare both the relative and absolute fluxing of the NIRSpec data. We computed synthetic magnitudes using synphot (STScI Development Team, 2018, 2020) in the respective FRESCO filters. The three upper panels of Table 2 tabulates the synthetic NIRSpec flux values in the second column and compares them to the NIRCam aperture photometry. We found excellent (within 2 significance) agreement at all wavelengths for the NIRSpec and NIRCam flux densities (see the comparison of the gold and blue points in Figure 2). The F182M synthetic NIRSpec photometry has a larger uncertainty because the NIRSpec F182M synthetic magnitude contains the NRS detector gap. This reduces the total number of NIRSpec data points. The NIRSpec and NIRCam observations have consistent fluxing both within individual gratings (a comparison of the F182M and F210M flux densities tests the G235H relative fluxing) and between gratings (comparing the F210M and F444W flux densities tests the G235H and the G395H). Thus, we do not observe the tendency for NIRSpec grating observations to have systematically higher flux density values than NIRCam observations (e.g., Bunker et al., 2023; Cameron et al., 2023). When we use older reference files, we did measure significant flux density discrepancies between NIRSpec and NIRCam, suggesting that the updated reference files produce more reliable NIRSpec absolute and relative flux calibration.
4 Galaxy properties
Using the NIRCam and NIRSpec data, we constrain the properties of GN 42437. We detect both the continuum (Table 2) and emission lines (Table 3) in the NIRSpec observations. This is emphasized in Figure 2 where some of the gold points include emission lines from the underlying SED fit in gray, but some of the NIRCam and NIRSpec points only probe the galaxy continuum. This disentangles the contribution of the high equivalent width emission lines to the integrated photometry. In Figure 2 we highlight that the observations probe light as red as 4.98 m (rest-frame 7500 Å), suitable to measure stellar masses (M∗) and star formation histories (SFHs). We infer M∗ and the SFH of GN 42437 by fitting both the NIRCam imaging and the NIRSpec spectra with the Bayesian Analysis of Galaxies for Physical Inference and Parameter EStimation (bagpipes; Carnall et al. 2018) code. bagpipes uses the updated Bruzual & Charlot (2003) stellar population synthesis templates, the Kroupa & Boily (2002) stellar initial mass function, and includes nebular continuum and emission by processing the stellar emission through cloudy v17.00 (Ferland et al., 2017). In fitting the data, we adopt the “bursty continuity” SFH prior of Tacchella et al. (2022) motivated by the large equivalent widths of GN 42437. We allow for a wide range of stellar masses, metallicities, and ionization parameters, adopting log-uniform priors for all three physical properties. To measure the M∗ and SFH, we focus on data that constrain the underlying rest-frame UV through optical continuum, as well as the strength of strong optical lines ([O iii] and H). An AGN may contribute to a fraction of the strong optical nebular lines (see subsection 7.2), but we are unable to provide strong constraints on the AGN contamination from the photometry. Indeed, the SED is well-fit by a template that only includes massive stars, as is common for Type ii AGN. We thus use the three FRESCO photometric measurements, as well as the NIRSpec spectroscopic redshift (zspec), NIRSpec narrowband synthetic photometry, and observed nebular emission lines to estimate the stellar continuum and nebular emission lines.
With bagpipes, we infer log(/) = 7.90.2. This is consistent with the typical stellar mass of Lyman-break galaxies at in Endsley et al. (2023) inferred using similar SFH assumptions. The SFR over the past 3 Myr inferred from the photometry plus spectra bagpipes fitting is 30 yr-1, while the average SFR over the past 3–10 Myr is 0.2 yr-1. We do not observe significant stellar mass formed beyond 10 Myr. Over 3 Myrs, 30 M⊙ yr-1 is roughly consistent with the SFR of 11 M⊙ yr-1 averaged over 10 Myr estimated from the attenuation-corrected H flux and the Kennicutt & Evans (2012) conversion (Table 1). This suggests that nearly all of the observed stellar light within GN 42437 has formed in the past 3 Myr. The extremely high [O iii] 5008 Å and H equivalent widths (1644260 and 901145 Å, respectively) can only be explained by very young bursts of star formation (Leitherer et al., 1999). These extreme [O iii] equivalent widths are 3 times larger than the typical Lyman-break galaxy (Endsley et al., 2023).
The Chandra imaging tests whether there is a strong AGN within GN 42437, but we do not detect X-ray emission from the galaxy. We calculated the upper-limit on the 2–10 keV flux in the 2 Ms combined event image using the CIAO tools function aprates Fruscione et al. (2006). The flux upper-limit is found to be erg s-1 cm-2. We then calculated the X-ray 2–10 keV luminosity (LX) using the X-ray flux upper-limit and the spectroscopic redshift, and found erg s-1 (Table 1).
The NIRCam imaging in Figure 1 shows an apparent companion to the North East of GN 42437. The SED fitting with the full HST + JWST observations puts a nearly equal probability that the companion source is at and . This is largely because there is a 3 detection in the HST/ACS F606W filter ( nJy). F606W probes rest-frame Å at , an unlikely wavelength to detect a galaxy. Unlike GN 42437, the apparent companion does not have a FRESCO grism detection (Oesch et al., 2023). The bagpipes posterior suggests that the H flux of the companion would be between 1-8 erg s cm-2. There is a significant probability that the companion is too faint to be detected with FRESCO grism observations. The companion has a NIRSpec slit placed on it as part of the JWST Program 1211 (PI: Luetzgendorf). This data will stringently test whether this apparent companion galaxy is at a similar redshift as GN 42437.
| Line | Iλ/IHα | Iλ/IHβ | |
|---|---|---|---|
| 3426.8 Å | 0.041 0.006 | 0.044 0.007 | 0.121 0.018 |
| 3727.1 Å | 0.032 0.008 | 0.034 0.009 | 0.094 0.024 |
| 3729.9 Å | 0.027 0.009 | 0.029 0.009 | 0.079 0.026 |
| H9 3836.5 Å | 0.045 0.007 | 0.047 0.007 | 0.130 0.020 |
| 3869.9Å | 0.158 0.012 | 0.168 0.012 | 0.460 0.034 |
| H8 3890.2+He i 3889.8 Å | 0.047 0.009 | 0.050 0.010 | 0.136 0.026 |
| 3968.6 Å | 0.037 0.008 | 0.039 0.008 | 0.107 0.023 |
| H7 3971.2 Å | 0.058 0.011 | 0.062 0.012 | 0.169 0.032 |
| H 4102.9 Å | 0.091 0.009 | 0.096 0.010 | 0.264 0.026 |
| He ii 4687.0 Å | 0.036 0.014 | 0.037 0.014 | 0.102 0.039 |
| 4960.3 Å | 0.683 0.021 | 0.702 0.021 | 1.924 0.058 |
| 5008.2 Å | 2.015 0.042 | 2.069 0.043 | 5.673 0.119 |
| Å | 0.018 | 0.018 | 0.049 |
| H 6564.6 Å | 1.000 0.025 | 1.000 0.018 | 2.742 0.048 |
| Å | 0.021 | 0.021 | 0.057 |
| Å | 0.017 | 0.017 | 0.048 |
| Å | 0.040 | ||
| 572 10 | |||
| 901 145 | |||
| 1644 260 | |||
| 11 2 | |||
| 4.49 0.09 | |||
| E(B-V) | 0.03 0.01 |
| Ratio | Linear | Log |
|---|---|---|
| O32 = [O iii]5008/[O ii]3727,3730 | 33 14 | 1.5 0.2 |
| O3Hb = [O iii]5008/H | 5.7 0.1 | 0.75 0.01 |
| Ne3O2 = [Ne iii] 3870/[O ii] 3727,3730 | 3 1 | 0.4 0.2 |
| Ne5Ne3 = [Ne v] 3427/[Ne iii] 3870 | 0.26 0.04 | -0.6 0.1 |
| R23 = ([O iii]5008,4960+[O ii]3727,3730)/H | 0.89 0.01 | |
| Ne5He2 = [Ne v] 3427/He ii 4687 | 1.2 0.5 | 0.1 0.1 |
| He2Hb = He ii4687/H | 0.10 0.04 | -1.0 0.2 |
| N2Ha = [N ii]6585/H | 0.021 | -1.7 |
| S2Ha = [S ii]6718,6733/H | ||
| O1Ha = [O i]6302/H | 0.018 | -1.8 |
5 Emission line measurements
In the top panel of Figure 3 we show the fully extracted one-dimensional spectrum of GN 42437. There are many strong emission lines at 4.32, 3.3, 3.2, and 2.55 m. We fit these lines using the Astropy python package SpecUtils (Astropy Collaboration et al., 2013, 2018, 2022). We assume a single constant local continuum (using an average continuum band-pass of 0.02 m, or 200 Å) for each line and fit for the Gaussian line properties. For most spectral features we use a single Gaussian, but the high-resolution G235H+G395H observations resolve many interesting lines (for instance the [O ii] 3727, 3730 Å doublet in the middle left panel of Figure 3). We set upper limits to non-detected lines (such as [O i] 6300 Å and [N ii] 6583 Å) by integrating the error spectrum over km s-1 around the expected line center. This is a conservative upper limit because the full extent of the lines are typically 300-400 km s-1.
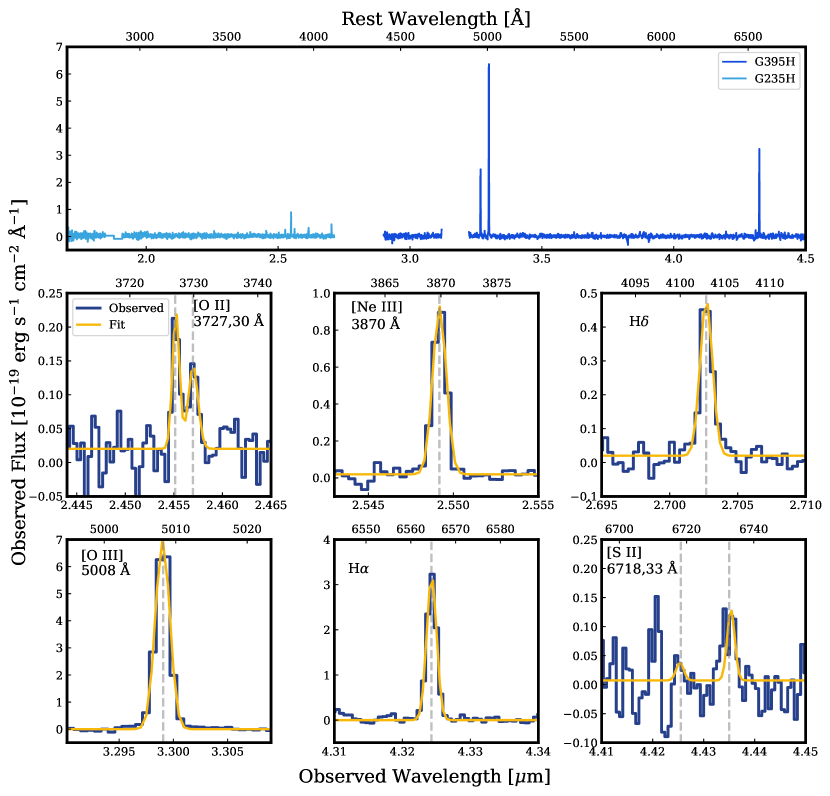
We fit the Gaussian line width () of the strong H emission line observed at 4.325 m and find that it is 50 km s-1. The publicly available python package msafit666https://github.com/annadeg/jwst-msafit/tree/main (de Graaff et al., 2023) estimates the spectral resolution at the observed wavelength of the H emission line using the measured size of the source, the location of the source in the MSA array (quadrant 1, , ), and the positioning of the object within the slit to be 35 km s-1. This suggests that the H emission is spectroscopically resolved with an intrinsic Gaussian width () of 36 km s-1. The H line is well-fit by a single Gaussian profile (see discussion in section 8) and we do not detect a fainter broad emission component in any emission line (Saldana-Lopez et al. in preparation).
We assume that all of the observed nebular emission lines originate in the same nebular region and fix the velocity width of each line to the observed velocity width (intrinsic plus instrumental broadening) of H for each line using msafit (de Graaff et al., 2023). This improves the detection reliability of extremely faint lines. The lower right panel of Figure 3 shows the [S ii] 6718,6733 Å spectral region (considered a non-detection). The redder 6733 Å [S ii] line appears to have a significantly broader profile than the H emission line (compare the gold fit to the blue observations). If we did not fix the [S ii] 6733 Å line width, we would find a 3.6 significant [S ii] 6733 Å total integrated line flux, but a line width that is more than twice the H line width. Combined with the fact that we do not detect significant [S ii] 6718 Å flux, we consider [S ii] 6733 Å to be heavily contaminated by noise. We fix the [S ii] 6733 Å line velocity width to that of H and conclude that the [S ii] 6733 Å lines are not significantly detected. This highlights the benefit of constraining the velocity widths of weaker lines. We tested whether this assumption holds for other strong lines in the spectrum of GN 42437. We find that every line is well-fit with a Gaussian that has an intrinsic velocity width of 36 km s-1, except for [Ne v] 3427 Å. We return to the velocity width of [Ne v] in section 8.
We detect 13 nebular emission lines at the 3 significance (Table 3). These lines range from [Ne v] 3427 Å in the blue portion of the spectrum (and highest ionization state) to a strong H in the red portion. Table 3 also lists a few upper-limits for lines that are below our detection threshold. The observed fluxes in the second column of Table 3 are given relative to the strong H emission line (), along with the errors on the line ratios by propagating the uncertainty of the H integrated flux. We give the integrated fluxes relative to H instead of the canonical H line because the H line falls in the gap between the two NRS detectors. We estimate the equivalent widths (EW) of certain lines using the integrated line flux and the continuum estimated from the spectrum in mock JWST medium band filters using stsynphot (STScI Development Team, 2018, 2020) in adjacent regions to the emission lines of interest: F210M (for [Ne v] 3427 Å), F360M (for [O iii] 5008 Å), and F410M (for H; Table 2). The integrated H fluxes and EWs are placed in the rest-frame using the estimated redshift and tabulated in the lower portion of Table 3.
We detect 5 Balmer emission lines with a signal-to-noise ratio greater than 5 (Table 3). We used pyneb (Luridiana et al., 2015) to determine the nebular reddening (E(B-V)) to be 0.031 mag using the observed H/H ratio, the Cardelli et al. (1989) attenuation law, the electron density measured from the [O ii] doublet of 2033 cm-3 (Stephenson et al. in preparation), and an assumed electron temperature of K. The largest source of uncertainty in this measurement is not the error on the H/H ratio (which has a 10% error), but rather the unknown electron temperature. A robust electron temperature could be estimated using the temperature-sensitive [O iii] 4363 Å auroral line, but [O iii] 4363 Å is in the gap between the two gratings. We estimate the uncertainty on by taking the variation of possible values using temperatures of (0.009 mag) and (0.033 mag). This estimates an E(B-V) uncertainty of 0.013 mag. The H7/H ratio is more uncertain than the H/H ratio (a 15% error), but both the H/H and H7/H ratios provide consistent E(B-V) values using K and the measured density. In the third column of the upper panel of Table 3 we provide the attenuation-corrected line ratios relative to H (), and the forth column gives these attenuation-corrected line ratios relative to the unobserved, but more common, H line (assuming an electron temperature of K and density of 2033 cm-3). Table 4 lists the attenuation-corrected line ratios used throughout the paper with both linear and logarithmic values.
The observed-frame wavelength of the four strongest emission lines in the spectrum ([O iii] 5008 Å, H, [O iii] 4960 Å, and [Ne iii] 3870 Å) define the spectroscopic redshift () of GN 42437. These four emission lines are all observed on the NRS2 detector, but are found in both the G235H and G395H gratings. Regardless, the median of these four lines gives extremely consistent estimates for GN 42437 of , where the error is the standard deviation of the four individual estimates. In fact, of all four lines agrees to within 0.2% (5 km s-1). This velocity accuracy remains consistent both within the G395H grating (where there are three lines) and between the G235H and G395H grating. This 5 km s-1 is about one-third the quoted high-resolution grating accuracy (15 km s-1; Böker et al., 2023). Most of the discussion in section 8 centers around the very-high-ionization [Ne v] 3427 Å line which has a velocity offset of km s-1 from the median of the four strong emission lines. This high-quality wavelength consistency illustrates the exquisite delivered velocity accuracy of the high-resolution JWST gratings.
In subsection 3.2 we found excellent agreement between the synthetic NIRSpec magnitudes and the observed NIRCam magnitudes. The fluxing can also be tested using emission doublets that have emissivity ratios set by atomic physics. We find that the attenuation-corrected [O iii] 5008/4960 intensity ratio (observed in the G395H grating) of is easily within 1 of the emissivity ratio (calculated using pyneb to be 2.98). Similarly, the attenuation corrected [Ne iii] 3870/3969 ratio (observed in the G235H grating and spectroscopically deblended with the high-resolution) is , consistent within 1 of the emissivity ratio (3.31). Thus, the relative and absolute fluxing of both NIRSpec gratings agree within 1 of the expectations from atomic physics.
| Line | ||||
|---|---|---|---|---|
| [m] | [km s-1] | [km s-1] | [km s-1] | |
| 3427 | 0.000597 0.000110 | 79 15 | 32 | 73 15 |
| 3870 | 0.000397 0.000016 | 47 2 | 33 | 33 2 |
| 5008 | 0.000654 0.000010 | 59 1 | 42 | 41 1 |
| H 6565 | 0.000725 0.000013 | 50 1 | 35 | 36 1 |
6 Unprecedented Very-High-ionization Emission Line Strengths
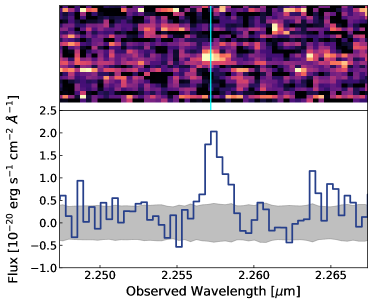
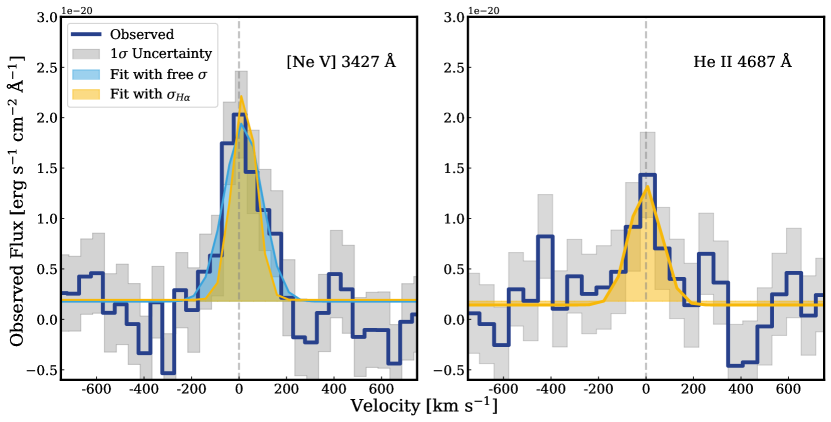
The very-high-ionization emission lines (transitions arising from gas with ionization potentials greater than 54 eV) uniquely distinguish GN 42437’s spectrum. The [Ne v] 3427 Å and He ii 4687 Å are detected at the 6.8 and 3 significance, respectively. The higher significance of the [Ne v] emission is largely accounted for by the fact that the G235H observations have 5.4 times longer integrations than the G395H observations. The 2-dimensional [Ne v] 3427 Å line profile has a slightly extended spatial and spectral morphology (upper panel of Figure 4) that is at the same spatial (y-axis in Figure 4) location with a similar spatial morphology as other bright lines on the G235H spectrum. The [Ne v] line profile is spectroscopically resolved by the G235H observations with more than 8 spectroscopic pixels above the local noise level. The line peaks km s-1 from the rest-frame wavelength set by the other strong emission lines (see cyan line in Figure 4). Figure 5 shows both of these very-high-ionization lines. He ii 4687 Å has a lower significance, but the line peaks exactly at the expected rest-frame wavelength and has multiple pixels significantly above the noise level.
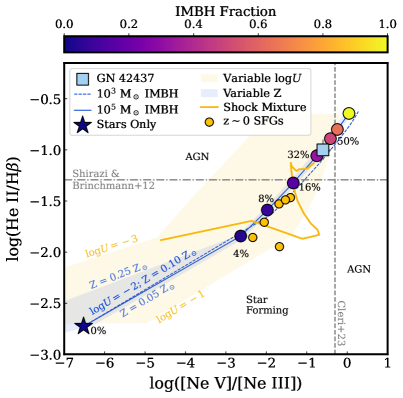
GN 42437 has unprecedented [Ne v] strength compared to local star-forming galaxies of similar stellar mass (108 M⊙). The [Ne v]/H (or [Ne v]/H) is (). This [Ne v]/H is 14 times larger than the median value from Izotov et al. (2021) and seven times larger than the largest in that sample. The Izotov et al. (2021) sample is one of the largest samples of [Ne v] emitting galaxies in low-metallicity star-forming galaxies in the local universe. GN 42437 has extreme rest-frame equivalent widths of many lines (H is 901 Å), but the [Ne v] rest-frame equivalent width of Å is 4 times larger than in Tol 1214-277. Tol 1214-277 is often used as the local example of a low-mass, star-forming galaxy with extreme [Ne v] emission (Izotov et al., 2004). The [Ne v] equivalent width is more consistent with values of 6–21 Å from z AGN (e.g., Gilli et al., 2010; Mignoli et al., 2013; Cleri et al., 2023a). Using these AGN, Ne5Ne3 = [Ne v]3427/[Ne iii] 3870 has been suggested as a relatively metallicity-insensitive AGN diagnostic that tests the shape of the very-high ionizing spectrum (see subsection 7.2 below; Abel & Satyapal, 2008; Cleri et al., 2023b). Ne5Ne3 values greater than 0.5, the gray dashed line in Figure 6, have been suggested to indicate the presence of pure AGN ionization (Cleri et al., 2023b). In Figure 6, we show the Ne5Ne3 value for GN 42437 as the light-blue square and the Izotov et al. (2021) sample as the gold circles. GN 42437 has a Ne5Ne3 that is 13 times larger than the median of the low-redshift low-mass star-forming galaxies (Izotov et al., 2021). While GN 42437 has [Ne v] 3427 Å flux ratios and an equivalent width similar to local AGN, the [Ne v] line width is only 73 km s-1, a factor of 5 smaller than the 400 km s-1 typically observed from Type ii AGN (see section 8; Mignoli et al., 2013). This [Ne v] line width is narrower than the typical AGN at low-redshifts (e.g., Greene & Ho, 2004; Mullaney et al., 2013; Kormendy & Ho, 2013).
The He ii/H ratio of is similarly extreme, although with larger uncertainties, compared to local star-forming galaxies with similar stellar mass. This He ii/H ratio puts GN 42437 in the AGN portion of the Shirazi & Brinchmann (2012) diagram (horizontal gray dashed line in Figure 6). While these He ii/H values typically indicate AGN, the Shirazi & Brinchmann (2012) demarcation does not differentiate between other hard-ionizing sources such as high-mass X-ray binaries (HMXBs) or Ultra-luminous X-ray Sources ULXs (see subsection 7.2). The He ii/H from GN 42437 is five times stronger than the largest value in the low-mass low-redshift sample of Berg et al. (2019), and 1.4 times larger than the largest local value recorded in Thuan & Izotov (2005). The [Ne v]/He ii ratio of is higher than all but one galaxy in the Izotov et al. (2021) [Ne v] sample, J12223602 (also discussed in Izotov et al., 2007). J12223602 is the only low-mass galaxy that Izotov et al. (2021) suggest harbors an AGN.
A final component of the high ionization structure of GN 42437 is the X-ray non-detection. X-ray detections are strong indicators of HMXBs and Compton-thin AGNs. Using the archival Chandra observations, we find that GN 42437 has a 2-10 keV X-ray Luminosity () upper-limit of erg s-1, an /SFR upper limit of erg s-1M⊙yr-1, and the upper limit of . The X-ray non-detection rules out the presence of a luminous AGN, but it does not rule out a lower luminosity or a Compton thick AGN.
While local galaxies with similar stellar mass have strong [Ne v] and He ii emission, the strength of the very-high-ionization emission in GN 42437 exceeds all of these examples. The very-high-ionization emission lines of GN 42437 are most comparable to local AGN.
7 A unified ionization structure for GN 42437
GN 42437 has an impressive array of observed and stringent upper-limits of a vast array of nebular emission lines (Table 3). These observations probe the classical low and mid-ionization zones (e.g. [S ii] 6733 Å and [O ii] 3727,3730), to the high-ionization (typically defined by [O iii] 5008 Å). However, what sets GN 42437 apart from most observations of either low or high-redshift star-forming galaxies is the detection of the very-high-ionization zone that is defined by the He ii 4687 Å and [Ne v] 3427 Å detections described above. Here we walk through the full ionization structure of the galaxy, looking for a single simplified model that explains all of the nebular emission within GN 42437. The most robust way to do this is to compare the ratios of nebular emission lines to photoionization models. The goal is to reproduce as many of the emission lines as possible with a single theoretical model. We start in subsection 7.1 with the low to high-ionization zones ([S ii] to [O iii]) because these are commonly observed in star-forming galaxies across all redshifts and provide a baseline to compare to GN 42437. We then move on to the very-high-ionization zone and explore whether any single model explains the unprecedentedly strong [Ne v] 3427 Å emission (subsection 7.2).
7.1 Low to high-ionization zones resemble a low-metallicity star-forming galaxy
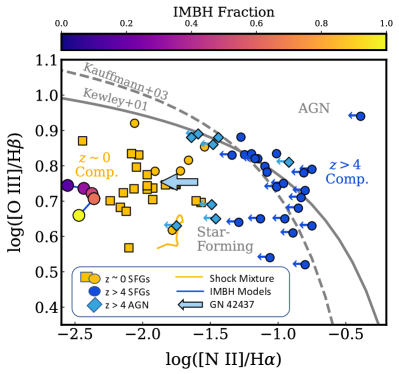
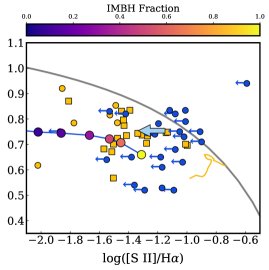
Many of the nebular emission line strengths and ratios of GN 42437 look like a typical low-metallicity star-forming galaxy. In Figure 7 we plot the [O iii]/H ratio versus the [N ii] 6585 Å/H (left panel) and the [S ii] 6718+6733/H (right panel). As a reminder, the H flux used for the [O iii]/H ratio here, and elsewhere in the text, has been extrapolated from the attenuation-corrected H emission because H fell between the NRS1 and NRS2 detectors (see section 5). Both [N ii] and [S ii] have detection significance less than 3 (Table 4) and we only mark their upper-limits on Figure 7. Regardless, the upper-limits place GN 42437 within the "star-forming" locus of the classical Baldwin, Phillips and Terlevich (BPT; Baldwin et al., 1981) diagrams (Kewley et al., 2001; Kauffmann et al., 2003). GN 42437 resides in a similar location as other star-forming galaxies in the BPT diagrams (dark-blue points; Cameron et al., 2023; Sanders et al., 2023). The upper limits of GN 42437 also place it in a similar location in the BPT as local galaxies that have very-high-ionization emission lines such as [Ne v] and He ii (Izotov et al., 2004; Thuan & Izotov, 2005; Izotov et al., 2007; Shirazi & Brinchmann, 2012; Kehrig et al., 2015; Feltre et al., 2016; Senchyna et al., 2017; Berg et al., 2018, 2019; Izotov et al., 2021). These upper limits place strong physical constraints on the low- and high-ionization emission within GN 42437.
The comparison in section 6 of [Ne v] and He ii in GN 42437 to local galaxies suggested that GN 42437 likely hosts an AGN, but the low ionization lines traditionally used to separate AGN from star-forming galaxies indicate that GN 42437 could be a star-forming galaxy (GN 42437 is well-within the star-forming locus in Figure 7). A similar conclusion is found when considering the [O i] 6300 Å non-detection. However, Figure 7 also includes the broad-line selected (Type i) AGN from Maiolino et al. (2023) as light-blue diamonds. These AGN have strong-line ratios indistinguishable from GN 42437 or star-forming galaxies at either low- or high-redshift. As discussed further in subsection 7.2, this strongly cautions against using the traditional strong-line diagnostics to separate AGN and star-forming systems in low-metallicity, low-mass, strongly star-forming systems with either high- or low-redshift observations (Groves et al., 2004, 2006; Kewley et al., 2013; Reines & Volonteri, 2015; Scholtz et al., 2023; Dors et al., 2024).
The observed strong-lines provide constraints on the metallicity and ionization of GN 42437. While the temperature-sensitive [O iii] 4363 auroral line falls between the G235H and G395H grating configuration, the R23, Ne3O2, and O32 strong-line ratios can approximate the 12+log(O/H). Using the recent calibrations with JWST data from Sanders et al. (2023), we estimate 12+log(O/H) to be 7.36, 7.19, and 7.31 (% Z⊙) using these three different line ratios, respectively. A recent calibration of local high-ionization emission-line galaxies that uses O32 from Izotov et al. (2024) predicts a slightly higher 12+log(O/H), or 7% Z⊙. This implies a low, but non-zero, metallicity of 5-7% Z⊙ for GN 42437.
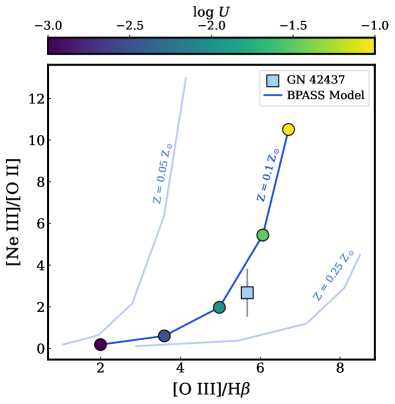
However, strong-line metallicity calibrations typically fail to accurately estimate the metallicity of AGNs (Groves et al., 2006). This is largely because the traditional strong-line calibrations do not include very-high-ionization states that contain a large fraction of the total metal emission. In these situations models of the nebular structure provide a better handle on the full ionization structure and metallicity of the gas. We use photoionization models from Richardson et al. (2022)777https://github.com/crichardson17/richardson_2022 to simultaneously test the ionization and metallicity of GN 42437. These models are largely used because they also include contributions from an intermediate mass black hole (IMBHs), which we will use in subsection 7.2 to explain the [Ne v]. These models use CLOUDY v17.00 (Ferland et al., 2017) and stellar population synthesis models from BPASS v2.0 (Eldridge & Stanway, 2009; Stanway et al., 2016; Eldridge et al., 2017) that include binary synthesis stellar evolution, a 20 Myr instantaneous burst stellar population with a Kroupa initial mass function (Kroupa, 2001), and a high-mass cutoff at 300 M⊙. We tested a larger grid of these models tailored to GN 42437, but that expanded grid does not significantly alter the results discussed here. The models include metallicities in 11 steps that have the Nicholls et al. (2017) solar abundance pattern. The stellar and nebular abundances are forced to match each other. We use the intrinsic fluxes, a closed geometry, and a constant density of 100 cm-3. In this section, all models have no contributions from intermediate mass black holes. We discuss models with IMBHs in the next section.
Figure 8 shows the [Ne iii]/[O ii] line ratio versus the [O iii]/H line ratio for the photoionization models using three different metallicities (0.05, 0.1, 0.25 Z⊙). Each point corresponds to a changing ionization parameter (log), as highlighted by the 0.1 Z⊙ track. This diagram is a function of both ionization and metallicity, with four independent emission lines. The observations of GN 42437 (light blue square) are consistent with the 0.1 Z⊙ and log to model. This model also satisfies the upper limits on the low-ionization emission lines in the optical BPT (Figure 7). The inferred log is very similar to the value found for other low-redshift very-high-ionization emission line galaxies (Berg et al., 2021). For the rest of this paper we use these parameters as our “default” nebular properties because it robustly matches the low-ionization structure. While the low-ionization and high-ionization lines can be reproduced with a stellar population-only model, in the next section we show that these models under produce the very-high-ionization lines, like [Ne v], by six orders of magnitude. Reproducing the very-high-ionization emission lines in low-metallicity star-forming galaxies has historically been theoretically challenging (Izotov et al., 2004; Thuan & Izotov, 2005; Shirazi & Brinchmann, 2012; Senchyna et al., 2017; Schaerer et al., 2019; Berg et al., 2021; Izotov et al., 2021; Olivier et al., 2022).
7.2 Source of full ionization structure
The nebular structure of GN 42437 is characterized by very-high-ionization [Ne v] and He ii, but also with relatively typical lower ionization emission lines. Can we explain both with a single self-consistent model? subsection 7.1 showed that stellar-population-only photoionization models can reproduce the low and high-ionization emission lines with a metallicity between 5-10% Z⊙ and log between -2 and -1.5. To test whether massive stars produce the observed very-high-ionization emission lines, we show the very-high-ionization emission line diagnostic of [Ne v]/[Ne iii] versus He ii/H in Figure 6. The blue star shows a photoionization model that only uses a massive star population as the ionizing source of the gas. The stellar population-only model fails to generate the observed [Ne v]/[Ne iii] in GN 42437 (light blue square) by over six orders of magnitude. Metallicity (blue shaded region) and log (gold shaded region) changes the predicted very-high-ionization line ratios, but no massive star only model gets closer than 5 orders of magnitude below the observations. If massive stars are the only ionizing source within this galaxy, we should not detect He ii or [Ne v] 3427 Å at any significance (Izotov et al., 2004; Thuan & Izotov, 2005; Shirazi & Brinchmann, 2012; Feltre et al., 2016; Senchyna et al., 2017; Schaerer et al., 2019; Berg et al., 2021; Izotov et al., 2021; Olivier et al., 2022; Feltre et al., 2023; Garofali et al., 2024). Yet GN 42437 has a 7 [Ne v] detection that is 4% of the flux of the H emission. What could possibly produce these extreme very-high-ionization emission lines?
High-mass X-ray Binaries (HMXBs) are one of the most compelling very-high-ionization photon sources (HMXBs; Fragos et al., 2013; Schaerer et al., 2019; Senchyna et al., 2020; Simmonds et al., 2021; Garofali et al., 2024; Lecroq et al., 2024). HMXBs are approximately stellar mass (e.g., 10–100 M⊙) black holes that are in a binary pair with a star. Mass-transfer from the star to the black hole heats gas to extreme temperatures and produces prodigious amounts of hard-ionizing and X-ray photons. These hard-ionizing photons are usually, but not always, produced with a temporal lag after the onset of star formation because massive stars must first evolve through their lives and explode as supernovae to create the black hole in the binary pair. This is why there is usually a correlation of the HMXB LX and stellar age or H equivalent width (Schaerer et al., 2019; Senchyna et al., 2020; Garofali et al., 2024). The extreme H equivalent width ( Å; Table 4) and young SED fit to the JWST + HST observations suggest that GN 42437 is too young to have a significant HMXB population. Finally, the [Ne v]/[Ne iii] and He ii/H values are more extreme than HMXB models can produce even at older ages (20Myr; Garofali et al., 2024; Lecroq et al., 2024). Thus, the strength of the [Ne v] relative to other emission lines strongly suggests that HMXBs are unlikely to generate the observed very-high-ionization emission.
Shocks have been invoked to explain the strong He ii and [Ne v] emission in lower redshift galaxies (Thuan & Izotov, 2005; Izotov et al., 2012, 2021). Supernovae or stellar winds drive gas faster than the sound speed into adjacent gas. The fast moving gas creates a shock wave that develops thin and dense layers of gas that emits high-energy ionizing photons as a precursor to create high-ionization gas within the galaxy. The kinetic energy of the shock is radiated away in both the dense low-ionization gas in the shock front and the low-density highly-ionized precursor gas (Dopita et al., 2002).
We use the shock plus precursor models of Allen et al. (2008) to test whether shocks could create the observed ionization structure. We use the lowest available metallicity (the SMC; 20% Z⊙) and a wide range of shock velocities. Shocks do produce significant very-high-ionization emission, with He ii/H and [Ne v]/[Ne iii] emission line ratios approaching the observed values if the shock has a velocity near 600 km s-1. This velocity is broadly consistent with previous studies of low-redshift low-metallicity galaxies (Izotov et al., 2012, 2021).
While fast radiative shocks could explain the He ii/H and [Ne v]/[Ne iii] ratios, the dense shocked regions produce significant lower ionization emission. The shock models predict that we should have strongly detected both [N ii]6585 Å and [S ii]6718+6733 Å emission. The shock models with a velocity of 600 km s-1 that reproduce the strong [Ne v]/[Ne iii] predict log([S ii]/H). This is 0.8 dex above the upper-limits of the observations. A similar over-prediction of the low-ionization emission lines occurs to drive down in Figure 9. We observe an ratio of , but the 600 km s-1 shock model predicts much lower ionization of .
To reduce the strong low-ionization lines, some studies have suggested that only a fraction of the nebular emission lines come from a spatially distinct radiative shock and another fraction comes from gas ionized by massive stars. If we assume that 30% of the nebular emission comes from the 600 km s-1 radiative shock and the rest from the default photoionization model of subsection 7.1, we find that log([S ii]/H) decreases to -0.9. We show this model in Figure 7 and it is still 0.2 dex above the [S ii]/H upper-limits. Similarly, the gold line on Figure 9 shows that this shock and stellar population mixture rises from O to 14. While these mixture models still produce too much low-ionization emission (e.g. is below the observations), the mixture also produces too little [Ne v] compared to our observations. This is shown by the gold lines in Figure 6 and Figure 9. For instance, the [Ne v]/[Ne iii] ratio of the fastest shock plus massive star mixture model is 0.15, nearly a factor of two below the observations of GN 42437. The low-ionization lines and O32 ratio requires even lower shock fractions that would reduce the very-high-ionization emission features even further below the observations. It could be possible that the shocks are driven into already ionized gas (Izotov et al., 2021) or that lower metallicity shock models could reproduce the line ratios, but the O32 ratio will still be too large. There is not a combination of current shock and massive star models that match the full nebular structure.
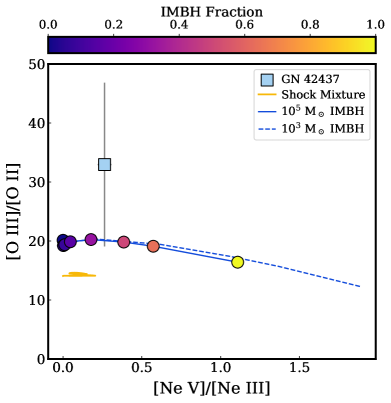
Finally, we are left with the contributions from accretion onto a black hole. GN 42437 has a low stellar (107.9 M⊙) and dynamical mass (10M⊙). Any black hole in GN 42437 is unlikely to be M⊙, or a supermassive black hole (see section 8). Rather the black hole is likely on the order of 104-7 M⊙. These black holes are called intermediate mass black holes (IMBH; Greene et al., 2020). We use the photoionization models discussed in subsection 7.1 from Richardson et al. (2022) to test whether IMBHs create the nebular structure. These models include the “qsosed” model for the IMBH SED (Kubota & Done, 2018) that uses a self-consistent prescription for a 105 M⊙ IMBH that accretes at sub-Eddington (0.1 Medd) with a dimensionless spin parameter of . IMBHs and massive stars can both contribute to the total number of ionizing photons of the models. We use models with IMBHs contributing 0, 4, 8, 16, 32, 50, 75, and 100% of the hydrogen ionizing photons (different point colors in Figure 6).
The IMBH models successfully reproduce the entire ionization structure of GN 42437 using an IMBH fraction near %, log near -2, and 0.1 Z⊙. The blue line in Figure 6 shows the rise of the very-high-ionization lines ([Ne v] and He ii) along log-log tracks that depend on the fraction of hydrogen ionizing photons from the IMBH. This emphasizes that the [Ne v]/[Ne iii] ratio largely tracks the fraction of ionizing photons arising from the IMBH (a similar trend is also found from super massive black holes in Abel & Satyapal, 2008). These tracks in the [Ne v]/[Ne iii] versus He ii/H plane are largely insensitive to metallicity: populations with 0.05 Z⊙ and 0.25 Z⊙ are indistinguishable from the default 0.1 Z⊙ case (compare the blue shaded region). The gold shaded region illustrates the impact of log on the ratios: log generates larger [Ne v]/[Ne iii] at lower He ii/H, while lower log produces less [Ne v]/[Ne iii] at higher He ii/H. This is because He ii has a lower ionization potential that can be produced at lower log than [Ne v]. Unlike the BPT diagnostics discussed in subsection 7.1, the [Ne v]/[Ne iii] versus He ii/H diagram strongly diagnoses the contribution of AGNs even at low-metallicity.
The IMBH plus massive star photoionization models matches more than just the very-high-ionization lines. The IMBH models match the upper-limits of the low-ionization emission lines, such as [N ii]6585/H and [S ii] 6718+6733 Å/H (see the points in Figure 7). Even the observed ratio, shown in Figure 9, is consistent with a model where IMBHs contribute approximately 30% of the hydrogen ionizing photons. The IMBH plus massive star model is the only model tested that matches the full ionization structure of GN 42437.
The Richardson et al. (2022) models include multiple prescriptions for the IMBH ionizing spectrum, all of which are consistent with the observations of GN 42437. For instance, the dashed lines in Figure 6 and Figure 9 show a 103 M⊙ black hole mass (MBH) model instead of a 105 M⊙ model. The 103 M⊙ model with the default log and metallicity is 0.4 dex larger in [Ne v]/[Ne iii] than the observations of GN 42437. The Richardson et al. (2022) models also include a disk plus power law (“disk-plaw”) model that takes a disk model from Mitsuda et al. (1984) with a temperature set by the mass of the black hole (Peterson, 1997), and combines it with a power-law with an exponent of 2.1. These models also match the full ionization structure of GN 42437 with the same default parameters, but an IMBH fraction of 16%.
Here, we have tested the ionizing source of the entire ionization structure of GN 42437. We have ruled out HMXBs as the dominate source of very-high-ionization photons because of the large H equivalent widths, the large He ii/H, and the elevated [Ne v]/H ratios. Shock models can produce very-high-ionization emission lines, but shocks over-predict the low-ionization emission lines by 0.8 dex. Models that require approximately 30% of the ionizing photons from an intermediate mass black hole and 70% from a massive star population reproduce the full nebular structure of GN 42437 without any more fine-tuning. Thus, we conclude that the combination of a burst of young stars and accretion onto an IMBH is the most likely origin of the strong very-high-ionization emission lines in GN 42437.
8 Black Hole Mass Constraints
In the previous section we discussed how a combination of ionizing photons from a massive star population and a black hole matches both the very-high-ionization emission and low-ionization emission of GN 42437. Now that we have revealed that GN 42437 hosts a black hole, we can ask: what are the properties of the black hole in GN 42437? The most fundamental parameter of a black hole is its mass (MBH). Stellar and gaseous kinematics trace MBH because black holes have large gravitational potentials that cause significant high-velocity motions. In Saldana-Lopez et al. (in preparation) we explore the broad emission lines in the entire NIRSpec sample. We find that all of the emission lines in GN 42437 except [Ne v] 3427 Å are narrow. Even the strong [O iii] 5008 Å (or H) line has no detectable secondary broad component (see Figure 3). The Akaike Information Criterion (AIC; Akaike, 1974) changes by less than 10 when including a second component. This suggests that there is less than a 2.5 change in the residuals when adding a broader component. We do not detect a broad H component that would typically indicate the broad-line region of a Type i AGN.
| Method | Observable | Value | Transformation | log | log(M) |
|---|---|---|---|---|---|
| M | km s-1 | – | |||
| M | km s-1 | – | |||
| L/3 | erg s-1 | Low | |||
| L/3 | erg s-1 | L | High | ||
| LHβ/3 | erg s-1 | L | Low | ||
| LHβ/3 | erg s-1 | L | High | ||
| LX | erg s-1 | L | – |
The non-detection of the broad-line region means that GN 42437 can be considered a narrow-line AGN, or Type ii AGN, within the Epoch of Reionization. At lower redshift Type ii AGN are usually separated using the traditional BPT diagrams. However, Figure 7 strongly shows that using the BPT diagrams will not be possible for all AGN at high-redshift. This is emphasized by the fact that both GN 42437 and many of the Type i AGN from the literature occupy the star-forming locus of the diagram. Rather, very-high-ionization line ratios, such as [Ne v]/[Ne iii] and He ii/H, are required to cleanly separate the AGN population at high-redshift (Figure 6). As with local Type ii AGN, it is challenging to robustly estimate MBH of GN 42437 because we do not have a direct probe of the sphere of influence of the black hole in GN 42437. Here, we explore a variety of different methods to approximate MBH in GN 42437 and Table 6 summarizes these different approximations.
The dynamical mass (Mdyn) puts a fairly strict upper-limit on the total mass of the galaxy and the black hole itself. Using the intrinsic H line width (Table 5), the F444W size of the galaxy (the filter with H; Table 2), and equation 2 from Maiolino et al. (2023) that assumes a Sérsic profile (Cappellari et al., 2006), we estimate . This is the maximum amount of mass possible within the MSA slit. We have already used the NIRSpec and NIRCam data to estimate that GN 42437 has a stellar mass of log(M, or about 25% of the dynamical mass. Nearly all of the observed stellar mass has formed within the last 3 Myr, indicating that the gas mass likely significantly contributes to the total mass. If we make the assumption that the local Kennicutt-Schmidt law holds for this galaxy (Kennicutt, 1998; Gao & Solomon, 2004; Kennicutt & Evans, 2012) and use the observed star formation rate surface density ( 10 M⊙ yr-1 kpc-2), we obtain an order of magnitude estimate of the gas mass in the 300 pc observed region of GN 42437 to be near M⊙. One-third to an entirety of the dynamical mass is likely in gas. This means that the combination of the approximated gas mass and stellar mass in GN 42437 is at least two-thirds and up to 100% of the estimated dynamical mass of the galaxy. Therefore, the estimated Mdyn, M∗ and gas mass limits the MBH to be no more than a few times 107 M⊙.
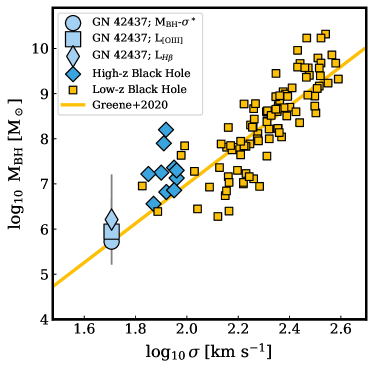
The black hole masses of narrow-line AGN at low-redshifts are usually estimated using the correlation between MBH and the stellar velocity dispersion of the central bulge ( ; Gebhardt et al., 2000; Ferrarese & Merritt, 2000; Kormendy & Ho, 2013; Greene et al., 2020). This M relation has been used to estimate MBH from thousands of Type ii AGN in the low-redshift universe (Heckman et al., 2004; Kauffmann & Heckman, 2009; Greene et al., 2020). The high spectral resolution of the G395H grating allows us to spectroscopically resolve the H line. The intrinsic H velocity dispersion of 36 km s-1 estimates the velocity dispersion of the gas. However, there is a statistical offset between the velocity dispersion of the gas and the stars. We follow Übler et al. (2023) to correct for the stellar velocity dispersion by multiplying it by a factor of 1.4 (Bezanson et al., 2018) to estimate km s-1. The left panel of Figure 10 shows local observations of the M in gold points and the gold line shows the best-fit relation from Greene et al. (2020) that uses a large compilation of local black holes and upper-limits from local galaxies (the “All, limits” relation). We use this relation and the relation from Kormendy & Ho (2013) to estimate MM and 5.9 respectively. We include the Greene et al. (2020) estimate in the left panel of Figure 10 as a light-blue circle.
The intrinsic [Ne v] 3427 Å line width is km s-1 and 2.5 broader than the H emission line (Table 5). The left panel of Figure 5 shows two Gaussian fits to the [Ne v] line: (1) fixing the [Ne v] velocity width to that of the H velocity width that has been corrected for the wavelength-dependent spectral resolution changes (gold region; de Graaff et al., 2023), and (2) an unconstrained velocity-width (light blue region). The light blue line fits the observed wings of the [Ne v] line better at the 2.5 significance. This suggests that the [Ne v] emission line is broader than the other observed emission lines.
Only the hard ionizing photons from the black hole accretion disk can produce [Ne v]. Observations of local AGN show that the line widths of very-high-ionization (e.g. [Ne v]) emission lines increase with increasing ionization potential (Dasyra et al., 2008, 2011). Additionally, [Ne v] 3427 Å has a larger critical density than other optical emission lines (107 cm-3 for [Ne v] and 105 cm-3 for [O iii] 5008 Å, for instance). This suggests that [Ne v] may originate closer to the black hole than other rest-frame forbidden optical emission lines (Dasyra et al., 2008, 2011; Netzer, 2013; Negus et al., 2021, 2023). Dasyra et al. (2008) and Dasyra et al. (2011) find that the width of the mid-infrared [Ne v] line scales significantly, but with appreciable scatter, with MBH for local AGN. We use the [Ne v] intrinsic km s-1 and equation 1 in Dasyra et al. (2008) to approximate the black hole mass to be log(M (Table 6). This is consistent with the estimate from the M above.
The final method to estimate MBH is to assume that accretion onto the black hole creates a hot accretion disk that produces the observed emission in GN 42437. If we can estimate the total luminosity, or bolometric luminosity (), of the accretion disk, we can assume that is near the Eddington Luminosity (). is the luminosity at which the outward force of radiation pressure due to electron scattering is equal to the inward pull of gravity. This is defined as
| (1) |
such that if we assume we can estimate MBH. There are two challenges here: (1) GN 42437 has significant light from the burst of star formation and (2) the high ionization parameter (log) of GN 42437 makes it challenging to compare to lower redshift AGN that have lower log. For the first challenge, we use the finding in subsection 7.2 that the black hole contributes approximately one-third of the ionizing photons to correct for the contribution from star-formation.
We first estimate Lbol using one-third of the reddening corrected [O iii] 5008 Å luminosity (L). Low-redshift L conversion factors are typically 600 (Kauffmann & Heckman, 2009; Liu et al., 2009). Using this estimate leads to a log(M, which is allowed by the Mdyn of the system but an order of magnitude above the local M relation.
These L corrections are made for local AGN that have significantly lower ionization parameters than GN 42437. Netzer (2009) shows that the local bolometric corrections can be obtained with photoionization models and relatively low log parameters of . When we estimate using the Netzer (2009) low log corrections of 891 we obtain log(M (see Table 6). The Netzer (2009) photoionization models also include a higher log model, which is more similar to the log inferred for GN 42437 above. At higher log a larger fraction of the total light is emitted as nebular emission lines, such that the L is lower. With the extreme [O iii] equivalent widths, this high log is more appropriate for GN 42437. The higher log models estimate log(M (light-blue square in Figure 10). The higher log bolometric correction is consistent with the estimate using the local M relation.
The photoionization models of Netzer (2009) also suggest that the H luminosity is less sensitive to the log of the AGN. Dividing the H luminosity by a factor of three to account for the impact of the starburst, we estimate log(M and 6.3, for high and low log nebulae. The high-ionization H estimate is shown on Figure 10 as a light-blue diamond. This highlights the consistency of using H as a bolometric calibrator for high-ionization AGN. However, these photoionization models assume a solar metallicity and large dust obscuration. Both of these properties appear untrue for GN 42437. High-redshift Type ii AGN likely require new bolometric corrections to accurately estimate . This is beyond the scope of this paper.
Finally, we can use the upper-limit of the X-ray Luminosity LX to put an upper-limit of the MBH to be less than log(M using the L relations from (Duras et al., 2020). The estimate from LX is roughly consistent with the previous estimates. Other estimates from the rest-frame optical continuum emission or mid-infrared colors could also be made, but these are challenging to separate the star-forming from black hole components in Type ii AGN.
We also include an error bar on the H estimate in Figure 10 with the upper-bound corresponding to a black hole accreting at 10% LEdd and the lower bound for a black hole accreting at 3LEdd. This range on LEdd roughly covers the expected range of accretion rates for low-mass black holes, and suggest that the black hole mass range is likely log(M. These approximated MBH satisfy the constraints from the observed Mdyn, M∗, and estimated gas mass.
The black hole in GN 42437 is possibly an intermediate mass black hole and among the lowest masses observed at either high or low-redshift. Figure 10 shows some of the previously measured black holes as light-blue diamonds (Furtak et al., 2023; Goulding et al., 2023; Kokorev et al., 2023; Übler et al., 2023; Maiolino et al., 2023; Lambrides et al., 2024). The left panel of Figure 10 shows that the high-redshift black holes generally follow the local M relation (Maiolino et al., 2023). GN 42437 is no exception. The range of MBH estimates that do not use the M relation are generally within the scatter of the local M relation. This suggests that the fundamental local relation between MBH and the gravitational potential of the galaxy may be in place as soon as .
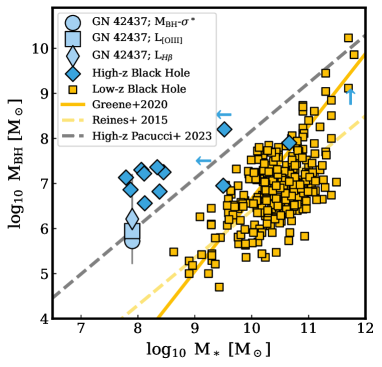
However, the MBH for GN 42437 is nearly two orders of magnitude larger than the extrapolated local M relation (right panel of Figure 10; Reines & Volonteri, 2015; Greene et al., 2020). This extreme offset is similar, but slightly less, than other recently observed black holes (Furtak et al., 2023; Goulding et al., 2023; Kokorev et al., 2023; Maiolino et al., 2023; Übler et al., 2023). It is possible that the first black holes discovered at with JWST may be an extremely biased sample. However, a recent reanalysis of the M relation using the high-redshift stellar mass function agrees with the inferred of GN 42437 and possibly indicates that this offset is physical (gray line in Figure 10; Pacucci et al., 2023). This hints that the build-up of stellar mass lags behind the growth of the black hole, possibly because black hole growth occurs before the stellar mass growth. This early black hole growth may be naturally explained by the formation of a heavy black hole seed in the early universe (see below; Bhowmick et al., 2024). Future consumption of cold gas, either from gas that is already in the galaxy (Maiolino et al., 2023) or that will be accreted onto the galaxy, will likely preferentially grow the stellar mass of GN 42437 rather than black hole. This may naturally evolve GN 42437 back towards the local M relation at later times.
9 Narrow-line IMBHs in the early Universe
Above we have shown that the strong very high-ionization emission lines are consistent with % of the ionizing photons coming from an IMBH. GN 42437 is reminiscent of lower redshift narrow-line, or Type ii, AGN, where the black hole is revealed using emission line ratios rather than from broad emission lines. Importantly, GN 42437 does not appear to be an AGN from the classic low-redshift diagnostics (Figure 7). While previous studies have found significant populations of Type i super massive black holes at (Labbé et al., 2023; Kocevski et al., 2023; Matthee et al., 2023; Harikane et al., 2023; Larson et al., 2023; Kokorev et al., 2024), there may be an even larger population of undiagnosed Type ii AGN with very-high-ionization emission lines waiting to be discovered in the epoch of reionization (Gilli et al., 2022; Scholtz et al., 2023).
Unlike low-redshift Type ii AGN which are separated from star-forming galaxies using metal emission lines that are 10s of percent the strength of H (e.g. [N ii]/H), the very-high-ionization emission lines that reveal the Type ii AGN in GN 42437 are much fainter and much narrower. The very-high-ionization emission lines in GN 42437 are extreme compared to local star-forming galaxies, but [Ne v] only has a rest-frame equivalent width of 11 Å. The 15 hour integration times in the high-resolution G235H configuration was required to detect this faint line. Additionally, with line widths of only 73 km s-1, this narrow line would not likely be detected with similar integration times at lower spectral resolution. Observations covering very-high-ionization forbidden (e.g., [Ne v]) and permitted FUV lines (He ii, N v 1238+1242 Å, C iv 1548+1550, for example) must be used to describe the full IMBH population at high-redshift (e.g., Feltre et al., 2016). Establishing these samples will reveal the population demographics of black holes in the first billion years of cosmic history and describe the formation and growth of the first black holes.
We observe GN 42437 only 1 Gyr after the Big Bang. What formed the IMBH so early in cosmic time? GN 42437 is a unique galaxy and some of the observations presented here may provide clues for the origin of the IMBH. The H equivalent width suggests that in the last 3 Myr GN 42437 has undergone a significant burst of star-formation. This means that the galaxy has formed M⊙, or 25% of its dynamical mass, in the past 3 Myr. As we discussed in section 8, the observed M∗ plus a rough estimate of the gas mass is consistent with the estimated Mdyn. For there to be an unobserved, older stellar population (Papovich et al., 2023), it must be within a factor of a few from the observed M∗, or we are significantly under-estimating the Mdyn.
What caused such a burst of star formation? The NIRCam imaging of GN 42437 suggests that there is a potential companion a few kpc from GN 42437 (Figure 1). If this apparent companion is confirmed to be at , it is possible that the interaction has triggered a significant amount of cold gas to collapse to form one of the first major generations of stars in GN 42437. It is possible that the interaction either formed or has strongly fed the IMBH. The strong feeding of the IMBH is likely why we detect the [Ne v] and are able to characterize GN 42437 as an AGN. Without this strong burst we would likely characterize GN 42437 as a star-forming galaxy.
There are broadly three main formation mechanisms of IMBHs: steady growth by accretion of a stellar mass black hole, a large gas mass directly collapsing into a black hole without forming a star, and runaway stellar mergers within a dense cluster leading to a super massive star (Greene et al., 2020, and references within). Stellar mass black holes (10–100 M⊙) are unlikely to grow sufficiently fast with Eddington-like accretion to match the observations of GN 42437 (Haiman & Loeb, 2001; Bromm & Larson, 2004; Madau et al., 2014). The black hole would need 300 Myr of constant Eddington accretion to grow from 100 M⊙ to 105 M⊙ (Madau et al., 2014). While this is possible within the age of the Universe, it would require the black hole to accrete at Eddington for 30% of the age of the Universe without forming an observable mass of stars before the past 3 Myr. If there is sufficient gas to constantly feed the black hole at Eddington for 300 Myr it is likely that some of the gas would collapse into a population of stars that we would observe. Thus, the star formation history of GN 42437 suggests that it is unlikely that the IMBH grew from a stellar mass black hole seed.
The ongoing burst of star-formation could have also directly collapsed a large amount of gas into the IMBH. Metal-free gas clouds do not fragment into smaller clouds, like higher metallicity clouds. This creates a monolithic super massive (105 M⊙) gas cloud without any force to counteract gravity. The entire 105 M⊙ then directly collapses into a single IMBH without producing significant amounts of other stars or metals (Loeb & Rasio, 1994; Bromm & Loeb, 2003; Begelman et al., 2006; Mayer et al., 2010). This scenario could explain the IMBH in GN 42437, but we detect significant oxygen and neon emission lines. For the IMBH in GN 42437 to be formed through direct collapse, metals must have been synthesized by a now invisible and earlier massive star population. It is possible that this first generation of stars is no longer observable because it has already exploded as supernovae and injected the metals into the ISM. Observations with MIRI searching for an older stellar population could shed light on this scenario (Papovich et al., 2023). The direct collapse scenario is a possibility and does not contradict with any GN 42437 observations.
Finally, if the current burst of star-formation in GN 42437 formed a very dense star cluster, it is possible that many of these massive stars could collide to form a single super massive star (M⊙) that collapses to form an IMBH. This “runaway merger” process may naturally explain the presence of the IMBH, the sharp burst of star formation, and the higher observed metallicity of GN 42437 (Portegies Zwart & McMillan, 2002; Gieles et al., 2018). N-body simulations suggest that if there are a large number of initial stars (106-7) then a single super massive star can grow to 105 M⊙ in just 2 Myr (Gieles et al., 2018).
Once a super massive star forms, the only support against collapse into an IMBH is hydrogen fusion in its core. Once the helium abundance in the core raises significantly, fusion ceases to counteract gravity and the super massive star collapses into an IMBH (Denissenkov & Hartwick, 2014). The super massive star is fully convective and efficiently mixes the helium fused in its core with the photospheric hydrogen. The luminosity of super massive stars exceeds the Eddington luminosity by Thomson scattering, which drives a helium and neutron capture element enriched stellar wind (Denissenkov & Hartwick, 2014). This enrichment process is actually quicker than enrichment by supernovae because it occurs during the life time of the massive star. These super massive stars produce significant amounts of helium and lighter metals (e.g., N and C), including oxygen (Nagele & Umeda, 2023). Just one 104 M⊙ super massive star injects 133 M⊙ of oxygen into the ISM in 105 years. This modest oxygen production by a single super massive star could account for significant portion of the observed metal enrichment within GN 42437. Thus, the formation of the super massive star, the metal enrichment of the ISM, and the presence of an IMBH can occur in the ongoing 3 Myr burst of star formation.
This runaway merger and eventual super massive star scenario has been proposed to explain the abundance patterns of globular clusters (Carretta et al., 2009; Piotto et al., 2015) and the nitrogen enhancement of GNz-11 (Charbonnel et al., 2023; Marques-Chaves et al., 2024). If the IMBH in GN 42437 did form through gravitational runaway and the formation of a super massive star, this may suggest that gravitational runaway and super massive stars crucially drive the chemical, stellar, and mass evolution of the early universe.
The three formation mechanisms would likely lead to different relationships between M and M (Greene et al., 2020). Steady accretion near Eddington requires a nearly constant source of cold gas that would likely fragment into stars. If the black hole in GN 42437 grew due to smooth accretion, the M∗ would likely grow in tandem with the MBH. This is inconsistent with the current observations where black holes preferentially grow before their stellar mass (right panel of Figure 10). Both gravitational runaway or direct collapse would likely lead to preferential black hole growth, and are therefore both consistent with the observed M and M relations (Bhowmick et al., 2024; Natarajan et al., 2024). Further observations of black hole masses in the early universe are required to reveal a full, unbiased population of early black hole to trace the origin of these trends.
Ultimately we cannot definitively distinguish the exact formation mechanism of the IMBH in GN 42437. Future evidence is required to solidify our understanding of the formation and evolution of the IMBH in GN 42437. First, for a direct collapse scenario, we would likely expect MIRI observations to reveal the first generation of stars that likely enriched the ISM to the observed level (Papovich et al., 2023). For the runaway merger scenario, super massive star models predict elevated helium, carbon, and nitrogen abundances (Denissenkov & Hartwick, 2014; Nagele & Umeda, 2023). GN 42437 does present abnormally strong He i (3187 Å and 5875 Å) and He ii emission lines (Stephenson et al. in preparation). While we do not detect [N ii] 6585 Å, GN 42437 is very highly ionized such that we might expect the FUV N and C lines to be very strong (Bunker et al., 2023; Isobe et al., 2023; Marques-Chaves et al., 2024; Topping et al., 2024). Rest-frame FUV observations of the C iii], C iv, N iii], and N iv] could shine light on the chemical abundances of GN 42437. These abundances would test whether gravitational runaway or a direct collapse created the observed IMBH in GN 42437.
10 Conclusions
Here we presented JWST NIRSpec high-resolution G235H and G395H observations of an extreme starburst galaxy at called GN 42437. The rest-frame optical spectra have high rest-frame equivalent width emission lines (H and [O iii] 5008 equivalent width of and Å) that indicate that the galaxy is currently undergoing a significant starburst. We measure 13 nebular emission lines at 3 significance within the spectra (Table 3, Figure 3) and place strong constraints on the emission line ratios within the galaxy (Table 4). The ratios of strong emission lines in GN 42437 (such as [O iii] 5008 Å/H and [N ii] 6585 Å/H) suggest that GN 42437 has similar low- and high-ionization emission lines as both star-forming galaxies and Type i (broad-line) AGN at (Figure 7).
GN 42437 has remarkable very-high-ionization emission lines (ionization potentials above 54 eV). [Ne v] 3427 Å ( significance; Figure 4 and Figure 5) and He ii 4687 Å ( significance; Figure 5) exceed the strength of typical low-redshift star-forming galaxies and are reminiscent of local AGN (Figure 6). The [Ne v] rest-frame equivalent width is Å, the [Ne v] flux is the [Ne iii] 3870 Å flux, and the [Ne v]/H ratio is .
[Ne v] and He ii require energies above 97 and 54 eV, respectively, and cannot be produced by massive star populations alone (Figure 6). Neither shocks nor X-ray binaries match the weak low-ionization emission lines and very-high-ionization ratios (Figure 7 and Figure 9). Using the [Ne v]/[Ne iii] versus He ii/H diagram in Figure 6 we suggest that a combination of accretion onto an intermediate mass black hole (IMBH) and massive stars can reproduce the entire ionization structure of GN 42437. The models with IMBHs and massive stars can reproduce all of the emission lines observed in GN 42437. These models suggest that a significant fraction of the ionizing photons must come from accretion onto a black hole.
The line widths of GN 42437 are spectroscopically resolved with intrinsic line widths near 36 km s-1 for the strong H and [O iii] 5008 Å (Table 5). We do not detect broad components from either the H or [O iii] 5008 Å emission lines (Figure 3), nor do we detect low-ionization emission line ratios that traditionally indicate an AGN at lower redshifts and higher metallicities. The common AGN diagnostics fail to reveal the presence of the IMBH. GN 42437 resembles a narrow-line AGN selected by the presence of its very-high-ionization emission lines, unlike low-redshift narrow-line galaxies that are selected based upon their low-ionization emission lines (e.g. [N ii]/H). High-ionization emission lines may reveal the full population of AGN at high-redshift.
We estimate the black hole mass (MBH) using a variety of different methods (Table 6) with the inferred log(M. This range of MBH is broadly consistent with the local M using the spectroscopically resolved velocity dispersion (left panel of Figure 10), but the black hole is orders of magnitude larger than expected from the stellar mass of the galaxy (right panel of Figure 10). This may suggest that high-redshift black holes preferentially grow before the stars in the galaxy.
We discuss various formation mechanisms of the IMBH (section 9). While we cannot definitively determine the formation mechanism, we speculate that runaway mergers of massive stars or a direct collapse black hole could have produced the IMBH within GN 42437.
The [Ne v] 3427 Å emission line has the power to diagnose the population demographics of IMBHs in the early universe. Deep high spectral resolution observations are required to determine the occurrence of IMBHs in the early universe and how they shaped the evolution of the first galaxies. Deep surveys using the G235H grating may enable a powerful census of IMBHs in the early universe that will describe how these early black holes grew into the super massive black holes we observe in the local universe.
Acknowledgements
This work is based on observations made with the NASA/ESA/CSA James Webb Space Telescope. The data were obtained from the Mikulski Archive for Space Telescopes at the Space Telescope Science Institute, which is operated by the Association of Universities for Research in Astronomy, Inc., under NASA contract NAS 5-03127 for JWST. These observations are associated with program #01871. Support for program #01871 was provided by NASA through a grant from the Space Telescope Science Institute, which is operated by the Association of Universities for Research in Astronomy, Inc., under NASA contract NAS 5-03127.
We thank Karl Gebhardt for insightful conversations on the evolution of IMBHs. CTR acknowledges support from the Elon University Japheth E. Rawls Professorship. SRF acknowledges support from NASA/FINESST grant number 80NSSC23K1433. NGG and YII acknowledge support from the National Academy of Sciences of Ukraine by its project no. 0123U102248 and from the Simons Foundation. ASL acknowledges support from Knut and Alice Wallenberg Foundation
Data Availability
All data presented here are publicly available. Reasonable requests for the data to the authors will be accommodated.
References
- Abel & Satyapal (2008) Abel N. P., Satyapal S., 2008, ApJ, 678, 686
- Akaike (1974) Akaike H., 1974, IEEE Transactions on Automatic Control, 19, 716
- Alexander et al. (2005) Alexander D. M., Bauer F. E., Chapman S. C., Smail I., Blain A. W., Brandt W. N., Ivison R. J., 2005, ApJ, 632, 736
- Allen et al. (2008) Allen M. G., Groves B. A., Dopita M. A., Sutherland R. S., Kewley L. J., 2008, ApJS, 178, 20
- Asplund et al. (2009) Asplund M., Grevesse N., Sauval A. J., Scott P., 2009, ARA&A, 47, 481
- Astropy Collaboration et al. (2013) Astropy Collaboration et al., 2013, A&A, 558, A33
- Astropy Collaboration et al. (2018) Astropy Collaboration et al., 2018, AJ, 156, 123
- Astropy Collaboration et al. (2022) Astropy Collaboration et al., 2022, ApJ, 935, 167
- Bañados et al. (2018) Bañados E., et al., 2018, Nature, 553, 473
- Baldwin et al. (1981) Baldwin J. A., Phillips M. M., Terlevich R., 1981, PASP, 93, 5
- Barbary (2016) Barbary K., 2016, The Journal of Open Source Software, 1, 58
- Becker et al. (2001) Becker R. H., et al., 2001, AJ, 122, 2850
- Begelman et al. (2006) Begelman M. C., Volonteri M., Rees M. J., 2006, MNRAS, 370, 289
- Berg et al. (2018) Berg D. A., Erb D. K., Auger M. W., Pettini M., Brammer G. B., 2018, ApJ, 859, 164
- Berg et al. (2019) Berg D. A., Chisholm J., Erb D. K., Pogge R., Henry A., Olivier G. M., 2019, ApJ, 878, L3
- Berg et al. (2021) Berg D. A., Chisholm J., Erb D. K., Skillman E. D., Pogge R. W., Olivier G. M., 2021, ApJ, 922, 170
- Bezanson et al. (2018) Bezanson R., et al., 2018, ApJ, 868, L36
- Bhowmick et al. (2024) Bhowmick A. K., et al., 2024, arXiv e-prints, p. arXiv:2402.03626
- Böker et al. (2023) Böker T., et al., 2023, PASP, 135
- Bouwens et al. (2015) Bouwens R. J., et al., 2015, ApJ, 803, 34
- Boyer et al. (2022) Boyer M. L., et al., 2022, Research Notes of the American Astronomical Society, 6, 191
- Brammer (2019) Brammer G., 2019, Grizli: Grism redshift and line analysis software, Astrophysics Source Code Library, record ascl:1905.001 (ascl:1905.001)
- Brammer (2023) Brammer G., 2023, msaexp: NIRSpec analyis tools, Zenodo, doi:10.5281/zenodo.7299500
- Brinchmann (2023) Brinchmann J., 2023, MNRAS, 525, 2087
- Bromm & Larson (2004) Bromm V., Larson R. B., 2004, ARA&A, 42, 79
- Bromm & Loeb (2003) Bromm V., Loeb A., 2003, ApJ, 596, 34
- Bruzual & Charlot (2003) Bruzual G., Charlot S., 2003, MNRAS, 344, 1000
- Bunker et al. (2023) Bunker A. J., et al., 2023, arXiv e-prints, p. arXiv:2306.02467
- Cameron et al. (2023) Cameron A. J., et al., 2023, A&A, 677, A115
- Cann et al. (2018) Cann J. M., Satyapal S., Abel N. P., Ricci C., Secrest N. J., Blecha L., Gliozzi M., 2018, ApJ, 861, 142
- Cann et al. (2019) Cann J. M., Satyapal S., Abel N. P., Blecha L., Mushotzky R. F., Reynolds C. S., Secrest N. J., 2019, ApJ, 870, L2
- Cappellari et al. (2006) Cappellari M., et al., 2006, MNRAS, 366, 1126
- Cardelli et al. (1989) Cardelli J. A., Clayton G. C., Mathis J. S., 1989, ApJ, 345, 245
- Carnall et al. (2018) Carnall A. C., McLure R. J., Dunlop J. S., Davé R., 2018, MNRAS, 480, 4379
- Carretta et al. (2009) Carretta E., et al., 2009, A&A, 505, 117
- Charbonnel et al. (2023) Charbonnel C., Schaerer D., Prantzos N., Ramírez-Galeano L., Fragos T., Kuruvanthodi A., Marques-Chaves R., Gieles M., 2023, A&A, 673, L7
- Chisholm et al. (2019) Chisholm J., Rigby J. R., Bayliss M., Berg D. A., Dahle H., Gladders M., Sharon K., 2019, ApJ, 882, 182
- Chisholm et al. (2020) Chisholm J., Prochaska J. X., Schaerer D., Gazagnes S., Henry A., 2020, MNRAS, 498, 2554
- Cleri et al. (2023a) Cleri N. J., et al., 2023a, ApJ, 948, 112
- Cleri et al. (2023b) Cleri N. J., et al., 2023b, ApJ, 953, 10
- Dasyra et al. (2008) Dasyra K. M., et al., 2008, ApJ, 674, L9
- Dasyra et al. (2011) Dasyra K. M., Ho L. C., Netzer H., Combes F., Trakhtenbrot B., Sturm E., Armus L., Elbaz D., 2011, ApJ, 740, 94
- Denissenkov & Hartwick (2014) Denissenkov P. A., Hartwick F. D. A., 2014, MNRAS, 437, L21
- Documentation (2016) Documentation J. U., 2016, JWST User Documentation (JDox), JWST User Documentation Website
- Dopita et al. (2002) Dopita M. A., Groves B. A., Sutherland R. S., Binette L., Cecil G., 2002, ApJ, 572, 753
- Dors et al. (2024) Dors O. L., Cardaci M. V., Hägele G. F., Ilha G. S., Oliveira C. B., Riffel R. A., Riffel R., Krabbe A. C., 2024, MNRAS, 527, 8193
- Duras et al. (2020) Duras F., et al., 2020, A&A, 636, A73
- Eilers et al. (2023) Eilers A.-C., et al., 2023, ApJ, 950, 68
- Eldridge & Stanway (2009) Eldridge J. J., Stanway E. R., 2009, MNRAS, 400, 1019
- Eldridge et al. (2017) Eldridge J. J., Stanway E. R., Xiao L., McClelland L. A. S., Taylor G., Ng M., Greis S. M. L., Bray J. C., 2017, Publications of the Astron. Soc. of Australia, 34, e058
- Endsley et al. (2023) Endsley R., et al., 2023, arXiv e-prints, p. arXiv:2306.05295
- Fan et al. (2006) Fan X., et al., 2006, AJ, 132, 117
- Feltre et al. (2016) Feltre A., Charlot S., Gutkin J., 2016, MNRAS, 456, 3354
- Feltre et al. (2023) Feltre A., et al., 2023, A&A, 675, A74
- Ferland et al. (2017) Ferland G. J., et al., 2017, Rev. Mex. Astron. Astrofis., 53, 385
- Ferrarese & Merritt (2000) Ferrarese L., Merritt D., 2000, ApJ, 539, L9
- Ferruit et al. (2022) Ferruit P., et al., 2022, A&A, 661, A81
- Finkelstein et al. (2013) Finkelstein S. L., et al., 2013, Nature, 502, 524
- Finkelstein et al. (2015) Finkelstein S. L., et al., 2015, ApJ, 810, 71
- Fragos et al. (2013) Fragos T., Lehmer B. D., Naoz S., Zezas A., Basu-Zych A., 2013, ApJ, 776, L31
- Fruscione et al. (2006) Fruscione A., et al., 2006, in Silva D. R., Doxsey R. E., eds, Society of Photo-Optical Instrumentation Engineers (SPIE) Conference Series Vol. 6270, Society of Photo-Optical Instrumentation Engineers (SPIE) Conference Series. p. 62701V, doi:10.1117/12.671760
- Fujimoto et al. (2022) Fujimoto S., et al., 2022, Nature, 604, 261
- Furtak et al. (2023) Furtak L. J., et al., 2023, ApJ, 952, 142
- Gao & Solomon (2004) Gao Y., Solomon P. M., 2004, ApJ, 606, 271
- Garofali et al. (2024) Garofali K., et al., 2024, ApJ, 960, 13
- Gebhardt et al. (2000) Gebhardt K., et al., 2000, ApJ, 539, L13
- Gebhardt et al. (2005) Gebhardt K., Rich R. M., Ho L. C., 2005, ApJ, 634, 1093
- Gieles et al. (2018) Gieles M., et al., 2018, MNRAS, 478, 2461
- Gilli et al. (2010) Gilli R., Vignali C., Mignoli M., Iwasawa K., Comastri A., Zamorani G., 2010, A&A, 519, A92
- Gilli et al. (2022) Gilli R., et al., 2022, A&A, 666, A17
- Goulding et al. (2023) Goulding A. D., et al., 2023, ApJ, 955, L24
- Greene & Ho (2004) Greene J. E., Ho L. C., 2004, ApJ, 610, 722
- Greene & Ho (2007) Greene J. E., Ho L. C., 2007, ApJ, 670, 92
- Greene et al. (2008) Greene J. E., Ho L. C., Barth A. J., 2008, ApJ, 688, 159
- Greene et al. (2020) Greene J. E., Strader J., Ho L. C., 2020, ARA&A, 58, 257
- Greene et al. (2023) Greene J. E., et al., 2023, arXiv e-prints, p. arXiv:2309.05714
- Groves et al. (2004) Groves B. A., Dopita M. A., Sutherland R. S., 2004, ApJS, 153, 75
- Groves et al. (2006) Groves B. A., Heckman T. M., Kauffmann G., 2006, MNRAS, 371, 1559
- Haiman & Loeb (2001) Haiman Z., Loeb A., 2001, ApJ, 552, 459
- Harikane et al. (2023) Harikane Y., et al., 2023, ApJ, 959, 39
- Hatano et al. (2023) Hatano S., et al., 2023, arXiv e-prints, p. arXiv:2305.02189
- Heckman & Best (2014) Heckman T. M., Best P. N., 2014, ARA&A, 52, 589
- Heckman et al. (2004) Heckman T. M., Kauffmann G., Brinchmann J., Charlot S., Tremonti C., White S. D. M., 2004, ApJ, 613, 109
- Henry et al. (2018) Henry A., Berg D. A., Scarlata C., Verhamme A., Erb D., 2018, ApJ, 855, 96
- Hickox & Alexander (2018) Hickox R. C., Alexander D. M., 2018, ARA&A, 56, 625
- Ho (2008) Ho L. C., 2008, ARA&A, 46, 475
- Ho et al. (1997) Ho L. C., Filippenko A. V., Sargent W. L. W., 1997, ApJS, 112, 315
- Hutchison et al. (2019) Hutchison T. A., et al., 2019, ApJ, 879, 70
- Isobe et al. (2023) Isobe Y., et al., 2023, ApJ, 959, 100
- Izotov et al. (2004) Izotov Y. I., Noeske K. G., Guseva N. G., Papaderos P., Thuan T. X., Fricke K. J., 2004, A&A, 415, L27
- Izotov et al. (2007) Izotov Y. I., Thuan T. X., Guseva N. G., 2007, ApJ, 671, 1297
- Izotov et al. (2012) Izotov Y. I., Thuan T. X., Privon G., 2012, MNRAS, 427, 1229
- Izotov et al. (2021) Izotov Y. I., Thuan T. X., Guseva N. G., 2021, MNRAS, 508, 2556
- Izotov et al. (2024) Izotov Y. I., Thuan T. X., Guseva N. G., 2024, MNRAS, 527, 3486
- Jiang et al. (2016) Jiang L., et al., 2016, ApJ, 833, 222
- Jung et al. (2020) Jung I., et al., 2020, ApJ, 904, 144
- Kauffmann & Heckman (2009) Kauffmann G., Heckman T. M., 2009, MNRAS, 397, 135
- Kauffmann et al. (2003) Kauffmann G., et al., 2003, MNRAS, 341, 33
- Kehrig et al. (2015) Kehrig C., Vílchez J. M., Pérez-Montero E., Iglesias-Páramo J., Brinchmann J., Kunth D., Durret F., Bayo F. M., 2015, ApJ, 801, L28
- Kennicutt (1998) Kennicutt Jr. R. C., 1998, ARA&A, 36, 189
- Kennicutt & Evans (2012) Kennicutt R. C., Evans N. J., 2012, ARA&A, 50, 531
- Kewley et al. (2001) Kewley L. J., Dopita M. A., Sutherland R. S., Heisler C. A., Trevena J., 2001, ApJ, 556, 121
- Kewley et al. (2013) Kewley L. J., Maier C., Yabe K., Ohta K., Akiyama M., Dopita M. A., Yuan T., 2013, ApJ, 774, L10
- Kocevski et al. (2023) Kocevski D. D., et al., 2023, ApJ, 954, L4
- Kokorev et al. (2023) Kokorev V., et al., 2023, ApJ, 957, L7
- Kokorev et al. (2024) Kokorev V., et al., 2024, arXiv e-prints, p. arXiv:2401.09981
- Kormendy & Ho (2013) Kormendy J., Ho L. C., 2013, ARA&A, 51, 511
- Kramida et al. (2018) Kramida A., Yu. Ralchenko Reader J., and NIST ASD Team 2018, NIST Atomic Spectra Database (ver. 5.6.1), [Online]. Available: https://physics.nist.gov/asd [2019, September 3]. National Institute of Standards and Technology, Gaithersburg, MD.
- Kroupa (2001) Kroupa P., 2001, MNRAS, 322, 231
- Kroupa & Boily (2002) Kroupa P., Boily C. M., 2002, MNRAS, 336, 1188
- Kubota & Done (2018) Kubota A., Done C., 2018, MNRAS, 480, 1247
- Labbé et al. (2023) Labbé I., et al., 2023, Nature, 616, 266
- Lambrides et al. (2024) Lambrides E., et al., 2024, ApJ, 961, L25
- Larson et al. (2023) Larson R. L., et al., 2023, ApJ, 953, L29
- Lecroq et al. (2024) Lecroq M., et al., 2024, MNRAS, 527, 9480
- Leitherer et al. (1999) Leitherer C., et al., 1999, ApJS, 123, 3
- Lin et al. (2018) Lin D., et al., 2018, Nature Astronomy, 2, 656
- Liu et al. (2009) Liu X., Zakamska N. L., Greene J. E., Strauss M. A., Krolik J. H., Heckman T. M., 2009, ApJ, 702, 1098
- Loeb & Rasio (1994) Loeb A., Rasio F. A., 1994, ApJ, 432, 52
- Luridiana et al. (2015) Luridiana V., Morisset C., Shaw R. A., 2015, A&A, 573, A42
- Lützgendorf et al. (2013) Lützgendorf N., et al., 2013, A&A, 552, A49
- Madau et al. (2014) Madau P., Haardt F., Dotti M., 2014, ApJ, 784, L38
- Maiolino et al. (2023) Maiolino R., et al., 2023, arXiv e-prints, p. arXiv:2308.01230
- Marques-Chaves et al. (2024) Marques-Chaves R., et al., 2024, A&A, 681, A30
- Matsuoka et al. (2018) Matsuoka Y., et al., 2018, ApJ, 869, 150
- Matsuoka et al. (2019) Matsuoka Y., et al., 2019, ApJ, 872, L2
- Matthee et al. (2023) Matthee J., et al., 2023, arXiv e-prints, p. arXiv:2306.05448
- Mayer et al. (2010) Mayer L., Kazantzidis S., Escala A., Callegari S., 2010, Nature, 466, 1082
- McElwain et al. (2023) McElwain M. W., et al., 2023, PASP, 135, 058001
- Mezcua (2017) Mezcua M., 2017, International Journal of Modern Physics D, 26, 1730021
- Mignoli et al. (2013) Mignoli M., et al., 2013, A&A, 556, A29
- Mitsuda et al. (1984) Mitsuda K., et al., 1984, PASJ, 36, 741
- Moran et al. (2014) Moran E. C., Shahinyan K., Sugarman H. R., Vélez D. O., Eracleous M., 2014, AJ, 148, 136
- Mullaney et al. (2013) Mullaney J. R., Alexander D. M., Fine S., Goulding A. D., Harrison C. M., Hickox R. C., 2013, MNRAS, 433, 622
- Nagele & Umeda (2023) Nagele C., Umeda H., 2023, ApJ, 949, L16
- Nakajima et al. (2018) Nakajima K., et al., 2018, A&A, 612, A94
- Natarajan et al. (2024) Natarajan P., Pacucci F., Ricarte A., Bogdán Á., Goulding A. D., Cappelluti N., 2024, ApJ, 960, L1
- Negus et al. (2021) Negus J., Comerford J. M., Müller Sánchez F., Barrera-Ballesteros J. K., Drory N., Rembold S. B., Riffel R. A., 2021, ApJ, 920, 62
- Negus et al. (2023) Negus J., Comerford J. M., Sánchez F. M., Revalski M., Riffel R. A., Bundy K., Nevin R., Rembold S. B., 2023, ApJ, 945, 127
- Netzer (2009) Netzer H., 2009, MNRAS, 399, 1907
- Netzer (2013) Netzer H., 2013, The Physics and Evolution of Active Galactic Nuclei
- Nguyen et al. (2017) Nguyen D. D., et al., 2017, ApJ, 836, 237
- Nguyen et al. (2019) Nguyen D. D., et al., 2019, ApJ, 872, 104
- Nicholls et al. (2017) Nicholls D. C., Sutherland R. S., Dopita M. A., Kewley L. J., Groves B. A., 2017, MNRAS, 466, 4403
- Noyola et al. (2010) Noyola E., Gebhardt K., Kissler-Patig M., Lützgendorf N., Jalali B., de Zeeuw P. T., Baumgardt H., 2010, ApJ, 719, L60
- Oesch et al. (2023) Oesch P. A., et al., 2023, MNRAS, 525, 2864
- Olivier et al. (2022) Olivier G. M., Berg D. A., Chisholm J., Erb D. K., Pogge R. W., Skillman E. D., 2022, ApJ, 938, 16
- Onoue et al. (2023) Onoue M., et al., 2023, ApJ, 942, L17
- Osterbrock (1989) Osterbrock D. E., 1989, Astrophysics of gaseous nebulae and active galactic nuclei
- Osterbrock et al. (1976) Osterbrock D. E., Koski A. T., Phillips M. M., 1976, ApJ, 206, 898
- Pacucci et al. (2023) Pacucci F., Nguyen B., Carniani S., Maiolino R., Fan X., 2023, ApJ, 957, L3
- Padovani et al. (2017) Padovani P., et al., 2017, A&ARv, 25, 2
- Papovich et al. (2023) Papovich C., et al., 2023, ApJ, 949, L18
- Pechetti et al. (2024) Pechetti R., et al., 2024, MNRAS,
- Peterson (1997) Peterson B. M., 1997, An Introduction to Active Galactic Nuclei
- Piotto et al. (2015) Piotto G., et al., 2015, AJ, 149, 91
- Planck Collaboration et al. (2020) Planck Collaboration et al., 2020, A&A, 641, A6
- Portegies Zwart & McMillan (2002) Portegies Zwart S. F., McMillan S. L. W., 2002, ApJ, 576, 899
- Rauscher (2023) Rauscher B. J., 2023, arXiv e-prints, p. arXiv:2306.03250
- Reines & Volonteri (2015) Reines A. E., Volonteri M., 2015, ApJ, 813, 82
- Richardson et al. (2022) Richardson C. T., Simpson C., Polimera M. S., Kannappan S. J., Bellovary J. M., Greene C., Jenkins S., 2022, ApJ, 927, 165
- Rieke et al. (2023) Rieke M. J., et al., 2023, PASP, 135, 028001
- Rigby et al. (2023) Rigby J., et al., 2023, PASP, 135, 048001
- STScI Development Team (2018) STScI Development Team 2018, synphot: Synthetic photometry using Astropy, Astrophysics Source Code Library, record ascl:1811.001 (ascl:1811.001)
- STScI Development Team (2020) STScI Development Team 2020, stsynphot: synphot for HST and JWST, Astrophysics Source Code Library, record ascl:2010.003 (ascl:2010.003)
- Sanders et al. (2023) Sanders R. L., Shapley A. E., Topping M. W., Reddy N. A., Brammer G. B., 2023, arXiv e-prints, p. arXiv:2303.08149
- Satyapal et al. (2021) Satyapal S., Kamal L., Cann J. M., Secrest N. J., Abel N. P., 2021, ApJ, 906, 35
- Schaerer (2002) Schaerer D., 2002, A&A, 382, 28
- Schaerer et al. (2019) Schaerer D., Fragos T., Izotov Y. I., 2019, A&A, 622, L10
- Schaerer et al. (2022) Schaerer D., et al., 2022, A&A, 658, L11
- Schneider et al. (2023) Schneider R., Valiante R., Trinca A., Graziani L., Volonteri M., Maiolino R., 2023, MNRAS, 526, 3250
- Scholtz et al. (2023) Scholtz J., et al., 2023, arXiv e-prints, p. arXiv:2311.18731
- Senchyna et al. (2017) Senchyna P., et al., 2017, MNRAS, 472, 2608
- Senchyna et al. (2020) Senchyna P., Stark D. P., Mirocha J., Reines A. E., Charlot S., Jones T., Mulchaey J. S., 2020, MNRAS, 494, 941
- Shen & Kelly (2012) Shen Y., Kelly B. C., 2012, ApJ, 746, 169
- Shirazi & Brinchmann (2012) Shirazi M., Brinchmann J., 2012, MNRAS, 421, 1043
- Simmonds et al. (2021) Simmonds C., Schaerer D., Verhamme A., 2021, A&A, 656, A127
- Skelton et al. (2014) Skelton R. E., et al., 2014, ApJS, 214, 24
- Stanway & Eldridge (2019) Stanway E. R., Eldridge J. J., 2019, A&A, 621, A105
- Stanway et al. (2016) Stanway E. R., Eldridge J. J., Becker G. D., 2016, MNRAS, 456, 485
- Tacchella et al. (2022) Tacchella S., et al., 2022, ApJ, 927, 170
- Telford et al. (2023) Telford O. G., McQuinn K. B. W., Chisholm J., Berg D. A., 2023, ApJ, 943, 65
- Thuan & Izotov (2005) Thuan T. X., Izotov Y. I., 2005, ApJS, 161, 240
- Topping et al. (2024) Topping M. W., et al., 2024, arXiv e-prints, p. arXiv:2401.08764
- Tumlinson & Shull (2000) Tumlinson J., Shull J. M., 2000, ApJ, 528, L65
- Übler et al. (2023) Übler H., et al., 2023, A&A, 677, A145
- Veilleux & Osterbrock (1987) Veilleux S., Osterbrock D. E., 1987, ApJS, 63, 295
- Vestergaard & Peterson (2006) Vestergaard M., Peterson B. M., 2006, ApJ, 641, 689
- Willott et al. (2010) Willott C. J., et al., 2010, AJ, 139, 906
- Xu et al. (2023) Xu X., et al., 2023, ApJ, 943, 94
- Yang et al. (2023) Yang J., et al., 2023, ApJ, 951, L5
- Zakamska et al. (2003) Zakamska N. L., et al., 2003, AJ, 126, 2125
- de Graaff et al. (2023) de Graaff A., et al., 2023, arXiv e-prints, p. arXiv:2308.09742