![[Uncaptioned image]](/html/2402.18485/assets/x1.png) A Multimodal Foundation Agent for Financial Trading: Tool-Augmented, Diversified, and Generalist
A Multimodal Foundation Agent for Financial Trading: Tool-Augmented, Diversified, and Generalist
Abstract.
Financial trading is a crucial component of the markets, informed by a multimodal information landscape encompassing news, prices, and Kline charts, and encompasses diverse tasks such as quantitative trading and high-frequency trading with various assets. While advanced AI techniques like deep learning and reinforcement learning are extensively utilized in finance, their application in financial trading tasks often faces challenges due to inadequate handling of multimodal data and limited generalizability across various tasks. To address these challenges, we present FinAgent, a multimodal foundational agent with tool augmentation for financial trading. FinAgent’s market intelligence module processes a diverse range of data—numerical, textual, and visual—to accurately analyze the financial market. Its unique dual-level reflection module not only enables rapid adaptation to market dynamics but also incorporates a diversified memory retrieval system, enhancing the agent’s ability to learn from historical data and improve decision-making processes. The agent’s emphasis on reasoning for actions fosters trust in its financial decisions. Moreover, FinAgent integrates established trading strategies and expert insights, ensuring that its trading approaches are both data-driven and rooted in sound financial principles. With comprehensive experiments on 6 financial datasets, including stocks and Crypto, FinAgent significantly outperforms 9 state-of-the-art baselines in terms of 6 financial metrics with over 36% average improvement on profit. Specifically, a 92.27% return (a 84.39% relative improvement) is achieved on one dataset. Notably, FinAgent is the first advanced multimodal foundation agent designed for financial trading tasks.
1. Introduction
Financial markets are essential for economic stability, facilitating capital allocation and risk management. Financial trading systems, developed from technical analysis strategies (Edwards et al., 2018), enhance these markets by enabling efficient trading. Rule-based trading systems are rigid and struggle to adapt to market volatility, often resulting in underperformance in evolving markets. Reinforcement learning-based systems(An et al., 2022) demonstrate enhanced adaptability but encounter substantial obstacles, such as the need for extensive training data and the inexplainability of decision-making processes. Additionally, they struggle with generalizing across diverse market conditions, are sensitive to market noise, and often fail to integrate multimodal market intelligence like news and reports into their analysis. The financial trading landscape demands more advanced machine-learning methods to address complex market dynamics, seeking to move beyond the limitations of rule-based and RL methods.
Recently, Large Language Models (LLMs) have showcased their potential in a range of decision-making tasks when applied in AI agents (Park et al., 2023; Sumers et al., 2023; Zhang et al., 2023; Wang et al., 2023b), marking a significant expansion beyond natural language processing into more complex, task-specific functions. This advancement includes the integration of memory and planning modules, which enable these agents to adapt within dynamic environments, akin to human cognitive processes. This evolution has been further pushed by the advent of multimodal LLMs like GPT-4V (OpenAI, 2023b), which enhances the capabilities of LLMs by processing both textual and visual data. Moreover, the integration of tool-augmented models like Toolformer (Schick et al., 2023) empowers LLMs to utilize external tools, thus elevating their decision-making abilities in complex scenarios. This combination of adaptability and enhanced processing capabilities offers new possibilities in fields such as fintech, where nuanced analysis and adaptation are important.
LLMs have demonstrated remarkable capabilities in analyzing and interpreting financial data, as evidenced by developments like BloombergGPT (Wu et al., 2023), and FinGPT (Yang et al., 2023b). However, there is a natural gap between QA tasks and sequential decision-making in trading. Although FinMEM (Yu et al., 2023) is an LLM trading agent with a human-aligned memory mechanism and character design, the full capabilities of LLMs as comprehensive autonomous trading systems remain underexplored, particularly in their ability to interpret multimodal data and utilize diverse tools. The challenges in navigating the complexities of financial markets are identified as follows:
-
•
Ch1: Insufficient Multimodal Data Processing Ability. Processing the extensive range of market intelligence, including numerical, textual, and visual information, presents significant difficulties. Advanced analytical methods are required to extract key insights from such diverse data to predict market trends.
-
•
Ch2: Lack of Targeted Information Retrieval. Some agents mix up retrieval with their main tasks, relying only on brief target task summaries to retrieve historical data. This absence of precise searching introduces too much irrelevant data into the results, which detracts from overall performance.
-
•
Ch3: Adaptability in Rapidly Evolving Markets. Financial trading requires the ability to quickly adapt to fluctuating market conditions. Traditional methods often fall short, highlighting the necessity for models capable of responding to real-time data and adjusting strategies according to historical market trends.
-
•
Ch4: Integration of Domain Knowledge. Current models often struggle to integrate established methods such as expert guidance and advanced trading tools effectively, leading to a decline in both the effectiveness and depth of market analysis.
-
•
Ch5. Reasoning for Actions. The black-box nature of many sophisticated AI models, directly giving results of decisions without providing the reasoning process.
To address the challenges of adapting the multimodal LLMs to the dynamic and information-rich financial trading tasks, we present FinAgent, a multimodal foundation agent that integrates both textual and visual information for a comprehensive analysis of market dynamics and historical trading patterns. Specifically, FinAgent’s market intelligence module processes multimodal data, such as numerical, textual, and visual, to provide precise analysis of financial market trends, offering insights for future trading tasks (Ch1). A uniquely designed dual-level reflection module is developed, capable of not only rapidly adapting to market dynamics but also enhancing the agent’s ability to learn from historical data and improve its decision-making process (Ch2). FinAgent introduces a diversified memory retrieval system for the market intelligence and reflection modules, separating trading and retrieval tasks to enhance focus on their specific functions and minimize noise in the results (Ch3). Finally, the decision-making module incorporates expert knowledge, comprising both supplementary expert guidance and auxiliary expert strategies, to guide the agent’s decisions. This emphasis on providing reasoned explanations for actions fosters trust in its financial decisions (Ch4 & Ch5). Specifically, our contributions are four-fold:
-
•
We introduce the market intelligence module, which is able to extract key insights from multimodal datasets encompassing asset prices, visual representations, news, and expert analyses, offering a multifaceted view across various markets.
-
•
We not only generate summaries for trading tasks but also provide query fields for retrieval tasks. These query texts include different retrieval types, tailored to enable focused retrieval of specific types of information.
-
•
Our two-level reflection module combines a low-level reflection that analyzes market price movement for insights, while the high-level reflection assesses past trading decisions for improvement, emulating the learning process in decision-making.
-
•
We employ a suite of tools in FinAgent, including expert guidance and technical indicator-based advanced trading strategies, to infuse domain knowledge in financial trading.
With comprehensive experiments on 6 financial datasets, including stocks and Crypto, FinAgent significantly outperforms 9 state-of-the-art baselines in terms of 6 financial metrics with over 36% average improvement on profit. Specifically, a 92.27% return (a 84.39% relative improvement) is achieved on one dataset. Notably, FinAgent is the first advanced multimodal foundation agent designed for financial trading tasks.
| Method | Market Intelligence | Tool Use | Inference & Extension | ||||||||
| News | Reports | Price | Visual Data | Info | Agents | Preference | Training Scheme | Planning | Explainability | Generalization | |
| Rule-based | ✗ | ✗ | ✓ | ✗ | ✗ | ✗ | ✗ | Hyper-parameter Tuning | Myopic | - | Single trading task |
| RL method | ✗ | ✗ | ✓ | ✗ | ✗ | ✗ | ✗ | Model training | Sequential | ✗ | Single trading task |
| FinGPT | ✓ | ✗ | ✓ | ✗ | ✗ | ✗ | ✗ | LLM Fine-tuning | Myopic | ✓ | Limited trading tasks |
| FinMem | ✓ | ✓ | ✓ | ✗ | ✗ | ✗ | ✓ | Reflection | Myopic | ✓ | Multiple trading tasks |
| FinAgent | ✓ | ✓ | ✓ | ✓ | ✓ | ✓ | ✓ | Reflection | Sequential | ✓ | Multiple trading tasks |
2. Related Work
2.1. LLM Agents for Decision Making
The field of artificial intelligence and natural language processing has reached a significant milestone with the emergence of LLMs like ChatGPT (OpenAI, 2021) and GPT-4 (OpenAI, 2023a). BloombergGPT (Wu et al., 2023) introduced the first LLM in the finance domain, combining financial and text data, but without public access. FinGPT (Yang et al., 2023b) proposed the first open-source finance LLMs, incorporating reinforcement learning with human feedback.
While LLMs achieve impressive performance in NLP tasks (Touvron et al., 2023; Chowdhery et al., 2023), more works explored the capability of LLMs to function not just as language processors but as agents capable of performing complex tasks. Initiatives like AutoGPT (Yang et al., 2023c) and MetaGPT (Hong et al., 2023), Voyager (Wang et al., 2023b), and AI agents (Sumers et al., 2023; Park et al., 2023) expand LLMs’ capabilities to complex tasks involving reasoning and collaboration, significantly advancing technology and impacting daily life. FinMEM (Yu et al., 2023) presents an LLM agent with a human-aligned memory mechanism and character design for automated trading.
Recently, there has been growing interest in enhancing LLM agents with external tools and modular methods as AI agents. Tool-augmented Language Models (TALM) (Parisi et al., 2022; Thoppilan et al., 2022; Nakano et al., 2021; Schick et al., 2023) have been evaluated through recent benchmarks, such as ScienceQA and TabMWP (Lu et al., 2022a, b; Chen et al., 2023; Wang et al., 2023a; Sun et al., 2023a; Lu et al., 2023a), designed to assess their ability to tackle intricate reasoning challenges, particularly those requiring the use of external tools. These improvements enable LLMs to retrieve current information through web searches (Nakano et al., 2021) and to apply specialized knowledge from external sources (Yu et al., 2022).
However, a major limitation of LLM agents is their dependence on text-based information, which limits their perception and interaction with the environment. Introducing models equipped with vision capabilities, such as the latest iteration of GPT-4V (OpenAI, 2023b), marks a pivotal breakthrough. There has also been the emergence of multimodal agents (Zhang et al., 2023; Yang et al., 2023a; Lu et al., 2023b) utilizing the visual capabilities of multimodal large language models to perform tasks previously unachievable by text-only agents. Most existing LLMs in finance focus on NLP tasks, and their potential in trading is not fully explored. FinAgent is a multi-modal, tool-augmented LLM foundation agent for financial trading to bridge the gap.
2.2. AI for Financial Trading
AI techniques have been widely used in various financial trading tasks. RNN-based such as GRU (Nelson et al., 2017) and LSTM (Wang et al., 2019) models are popular for stock prediction since they are specifically designed to capture temporal patterns in sequential data. Another direction of work employs graph-based DL models to model pair-wise relations between stocks. For instance, Feng et al. (2019) enhance graph convolutional networks (GCNs) with temporal convolutions for mining inter-stock relations. Sawhney et al. (2020a) focus on stock industry data and links between company CEOs. Tree-based models (Ke et al., 2017) also achieve robust performance. Xu and Cohen (2018) propose a variational autoencoder architecture to extract latent information from tweets. Chen et al. (2019) enhance trading strategy design with the investment behaviors of professional fund managers. Other data sources such as economics news (Hu et al., 2018) and earning calls (Sawhney et al., 2020b) are also used to improve the prediction performance. Sun et al. (2023e) introduce a novel three-stage ensemble learning method. Reinforcement learning (Sun et al., 2023d) has achieved success in finance with algorithms, platform (Sun et al., 2023c), and evaluation toolkits (Sun et al., 2023b). However, most of these methods are hindered by their focus on price data and limited generalization, necessitating advanced techniques that can integrate multimodal intelligence and navigate complex market dynamics.
3. Problem Formulation
We first introduce the Markov Decision Process (MDP) formulation of financial trading. Later on, we provide the formal formulation of FinAgent, which integrates LLMs into the RL pipeline to enable flexible reasoning and decision-making in financial trading.
3.1. Financial Trading as MDP
A financial trading task involves sequentially making investment decisions (e.g., buy/sell stocks) to maximize total profit under certain risk tolerance (Sun et al., 2023d). We formulate it as an MDP under a classic RL scenario following (Sun et al., 2023c; Liu et al., 2020b), where an agent (investor) interacts with an environment (the financial market) to make actions (investment decisions) at discrete time to earn rewards (profits). The MDP is constructed by a 5-tuple . Specifically, is a finite set of states. is a finite set of actions. The state transition function encapsulates transition probabilities between states based on chosen actions. The reward function quantifies the immediate reward of taking an action in a state. The discount factor is . A policy assigns each state a distribution over actions, where has probability . During training, the agent is in charge of making investment decisions at each time step through one whole trading period and tries to learn an optimal policy (investment strategy) that maximizes the expected sum of discounted reward (overall profit): .
Specifically, we focus on single asset (e.g., stock or Crypto) trading. A state represents RL agents’ perception on the financial market based on price information, limited order book (Qin et al., 2023), technical indicators, trend prediction (Ye et al., 2020), financial news (Sawhney et al., 2021), experts’ investment behaviors (Ding et al., 2018) and overall market status (Wang et al., 2021a). The action space includes three choices to buy, sell or hold the asset (Deng et al., 2016; Liu et al., 2020a). The reward function leverages the change of market capitals (earned/lost money) (Liu et al., 2020a) with consideration of commission fee (Sun et al., 2023c; Wang et al., 2021b).
3.2. Problem Formulation
We further integrate multimodal LLMs into the RL framework (Christianos et al., 2023), enabling the flexible definition of the reasoning processes. In FinAgent formulation, we focus on the necessity of defining, learning, and applying these processes independently. We extend the classic RL optimization problem for FinAgent as follows:
| (1) |
where is the reward at the time step that depends on the environmental state and action . are specialized modules that encapsulate beneficial internal reasoning processes. Note that a state contains multimodal information including textual, numerical, and visual data. Faced with a task and equipped with a memory and a tool , FinAgent acting as the multimodal LLM agent, determines its action through the following process:
| (2) |
where is a task-relevant prompt generator. The prompt is then passed to a multimodal LLM, from which a response is generated. Finally, the response is parsed through the task-specific action parsing function to perform compatible actions in the environment.
FinAgent is a multimodal LLMs agent in this framework specifically designed for financial trading, which contains five core modules, namely market intelligence module (M), memory module (Mem), low-level reflection module (L), high-level reflection module (H) and decision-making module (D). We can define the and other modules as follows:
| (3) |
where , , , , correspond to each module respectively, denotes the memory of , , and . and represent the Kline chart and Trading chart. denotes the prompt generator corresponding to each module associated with task .
Therefore, with the integration of memory mechanism, augmented tools, and several designed modules, the overall objective of FinAgent is to find policies as described in Eq. (2) to optimize total discounted returns:
| (4) |
4. FinAgent Framework
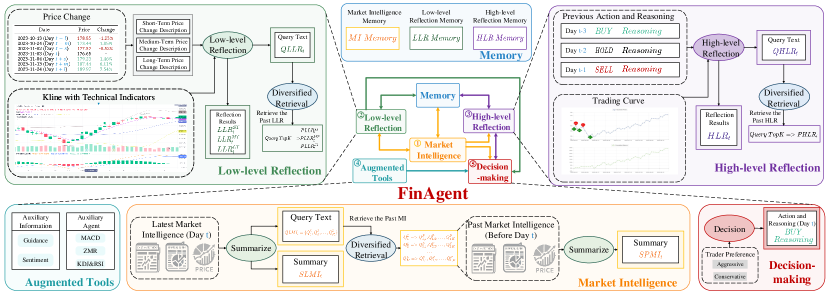
As shown in Figure 2, the FinAgent framework comprises five core modules. Specifically, the market intelligence module (§4.1) is responsible for collecting, collating, summarizing, and analyzing market information, which includes daily updates on stock news, prices, and monthly and quarterly financial reports. The low-level reflection module (§4.3) establishes the inherent correlation between market intelligence and price changes. And the high-level reflection module (§2) involves reflecting on market conditions, price changes, and other factors in the context of outcomes from past trading decisions, which aims to derive insights from previous experiences and identify potential improvement in profitability by assessing the efficacy of historical decisions and offering recommendations for future decision-making processes. The primary role of the memory module (§4.2) is to support the aforementioned three modules by offering storage capabilities and vector retrieve functions. The tool-augmented decision-making module (§4.4) integrates the aforementioned information, along with augmented tools and trader preferences, to make final investment decisions with a comprehensive analysis.
4.1. Market Intelligence Module
To make profitable investment decisions, it is beneficial to collect, summarize, analyze, and extract key insights from various multimodal financial data sources. We design the market intelligence module to achieve this goal. Market intelligence typically involves daily data about the macro environment, current market conditions or investors’ sentiments that inform investment and trading decisions. In FinAgent, we harness the power of both the latest and historical news, financial reports, and asset prices related to the targeted asset in order to inform and optimize trading decisions.
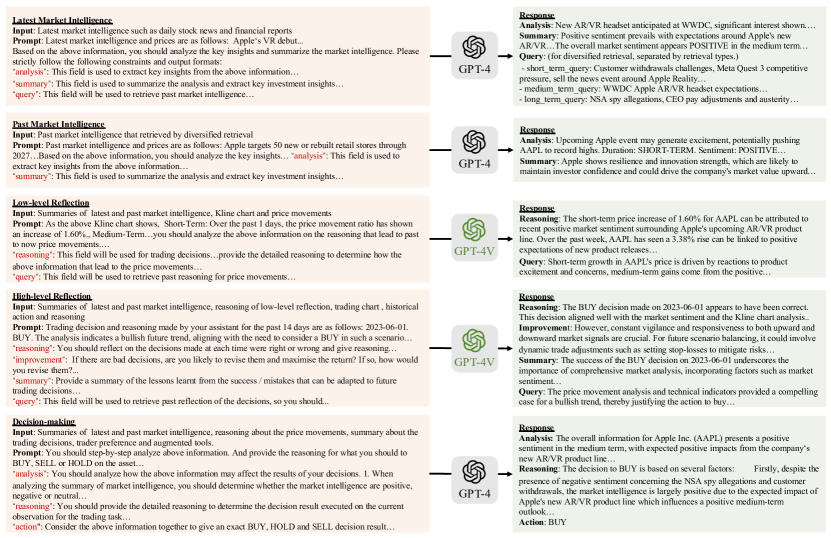
Latest Market Intelligence. This module mainly consists of asset news and daily asset prices. However, it is not confined to these elements alone. Any information impacting the market can be encompassed within our framework as part of the latest market intelligence. The objective of this component is to evaluate the sentiment111Market intelligence can be categorized as positive, negative, or neutral based on its impact on market perceptions and potential outcomes. of each market intelligence item regarding its influence on future asset prices and to provide a detailed summary of whether the market has recently exhibited bearish or bullish tendencies, thereby assisting in informed decision-making.
Nevertheless, historical data can offer insights into patterns that might influence future pricing and potentially affect current and upcoming market dynamics. For instance, if a past product launch significantly boosted a company’s stock, a recent launch might have a similar effect222Some news will detail the percentage increase or decrease in a company’s stock price after some event occurs.. We hope to incorporate these historical experiences and patterns into FinAgent’s considerations. This inspired us to add two additional functional layers: retrieving relevant information from past market intelligence and summarizing key insights and historical experiences from them.
Diversified Retrieval Operation. A straightforward approach involves using the summary of the latest market intelligence as the query text and then employing an LLM to extract its semantically rich embeddings. This allows for retrieving past market intelligence with similar content through vector similarity. However, adopting this approach inevitably comes with two significant shortcomings: i) the summary of recent market intelligence is primarily aimed at supporting subsequent trading decision tasks, not for retrieval tasks. The significant gap between these two objectives can lead to unsatisfactory retrieval results; ii) some noise unrelated to the retrieval task may be contained in the summary, directly affecting the retrieval results. To address these challenges, diversified retrieval is implemented in FinAgent. Specifically, we have introduced an additional query text field to the output of the latest market intelligence component, which is dedicated to serving retrieval tasks in parallel with the summary that caters to trading tasks. It is worth emphasizing that we can define various retrieval types333The retrieval types include short-term, medium/long-term market impacts, asset price increase/decrease, market trends bearish/bullish, news/reports, etc. to enable an agent to retrieve past market intelligence from multiple perspectives, in multiple senses, and with a purpose. As shown in Figure 2, there are retrieval types, so retrieving top historical market intelligence separately can form a combination of market intelligence in the past. This approach assigns specific retrieval types to each piece of historical information accompanying the summaries. This nuanced labeling facilitates a more targeted and efficient search and retrieval process.
Past Market Intelligence. Once similar past market intelligence is searched, it undergoes the summarising step, delivering key insights tailored to augment trading decisions. This meticulous approach ensures that only the most relevant information is incorporated, mitigating the impact of noise and maximizing the utility of historical data in informing trading strategies.
4.2. Memory Module
The memory mechanism (Park et al., 2023; Zhang et al., 2023; Christianos et al., 2023) is crucial in LLM Agents for effectively handling extensive texts, grasping the context, ensuring the coherence of conversations, and improving the agent’s comprehension and logical abilities. In the context of multimodal LLM Agents for financial trading, memory mechanisms play a crucial role in three main aspects: i) Acuity. This feature allows multimodal LLM agents to harness market news, financial reports, and associated information for enhanced market forecasting. By analyzing historical data and current events and understanding their potential impact on market trends and asset prices, multimodal LLM agents can construct more accurate market models, forecasting future price movements and market dynamics to support trading decisions effectively. ii) Adaptability. As price trends and market environments evolve rapidly, memory mechanisms enable multimodal LLM agents to swiftly learn from new market data and price trends, adapting to these changes. This adaptability is achieved through continuous analysis of market conditions and trading outcomes, enabling multimodal LLM agents to dynamically adjust their trading strategies to cope with market volatility and capitalize on new trading opportunities. iii) Amendability. Memory mechanism also empowers multimodal LLM agents to remember past decision-making errors and successful trades for deep reflection and analysis. Through this self-evaluation, multimodal LLM agents can identify the factors leading to mistakes, avoiding the repetition of the same errors in future trading decisions. This ongoing learning and adjustment process aids in continuously optimizing the trading performance and output quality of multimodal LLM agents, resulting in more robust and efficient trading strategies.
To realize the 3A superiority - Acuity, Adaptability, and Amendability - in the memory mechanism, our development of the memory module employed a vector storage architecture. This module is composed of three main components: market intelligence memory (service for (§4.1)), low-level reflection memory (service for (§4.3)), and high-level reflection memory (service for (§2)). As illustrated in Figure 2, the summarize operation creates a query text field for each module, enhancing memory storage and retrieval processes. Specifically, the unique feature of the market intelligence module lies in its ability to retrieve past market intelligence through query text. This module uses vector representations to streamline the storage and retrieval process, matching data based on the similarity of query text vectors. All analyses and summaries from the market intelligence, low-level reflection, and high-level reflection modules are stored in the memory module. This integration equips the agent with a broad spectrum of both the latest and historical market data and insights, bolstering its decision-making capabilities.
4.3. Reflection Module
A reflection module is incorporated into the agent’s design to emulate the cognitive learning process inherent in human decision-making. The reflection framework is divided into low-level reflection and high-level reflection, each serving distinct purposes to enhance the agent’s trading decisions. The low-level reflection module involves reflecting on the relationship between the agent’s observations (e.g., news, financial reports, Kline chart and technical indicators) and the resultant price movements in the market, drawing connections between the provided information and the actual price changes. Whereas the high-level reflection step examines past decisions, tracking both the agent’s actions and the subsequent price movements in order to learn from past successes or mistakes.
Low-level Reflection Module The primary focus of the low-level reflection module is to analyze the connection between the given market intelligence together with the Kline chart and technical indicators and past and future price changes to enhance decision-making. After taking in the price change data, the module generates detailed analysis for varying temporal horizons, spanning short-term, medium-term to long-term perspectives. The emphasis is placed on identifying potential patterns in the price movements of the targeted stock and deriving insights from how the given market intelligence summaries and Kline chart analysis can lead to such price movements. In order to facilitate future access and reference, the module generates a query field containing a concise summary of learned lessons, ensuring efficient retrieval and application of insights in subsequent decision-making endeavors.
| Reflection | Low-level Reflection | High-level Reflection |
| Target | Price Movements | Trading Decisions |
| Visual Data | Kline Chart | Trading Chart |
| Market Understanding | Micro | Macro |
| Function | Adaptability | Adjustability |
High-level Reflection Module The high-level reflection module is designed to provide analysis and reflections on past trading decisions. Besides the past trading decisions and their underlying reasoning, this module incorporates a graphical representation of buy and sell points on a trading chart, coupled with a cumulative return plot, to offer an intuitive representation of the efficacy of historical decisions. The initial phase assesses each trading decision’s correctness, identifying successes and mistakes. Subsequently, the module recommends improvements or corrective actions tailored to each identified mistake or success, fostering a continuous learning process. Beyond individual decision analysis, the module generates overarching lessons from both successes and mistakes, providing a summary that can be adapted to future trading decisions and a query text to facilitate the retrieval of relevant reflections. This iterative learning process equips the agent with a dynamic knowledge base that evolves with each decision and allows the trading agent to draw connections between similar scenarios, applying learned lessons for more informed decision-making.
4.4. Tool-Augmented Decision-making Module
The decision-making module integrates key inputs, including market intelligence summaries, low-level reflection about price movement analyses, and reflections on past decisions. Augmented tools with professional investment guidance and traditional trading strategies like MACD Crossover, KDJ with RSI Filter and Mean Reversion are also considered. The module analyzes sentiment in market intelligence, predicts bullish or bearish trends from price movements, reflects on lessons learned, and evaluates professional guidance and traditional indicators. Decisions are derived from combining insights from these analyses, also considering the current financial position, leading to a final decision—whether to buy, sell, or hold the asset. Leveraging the Chain-of-Thought (COT) approach and in-context learning principles, our trading decision-making module not only executes trades but also provides reasoning, ensuring that each decision is rooted in a comprehensive understanding of market dynamics and contextual knowledge.
5. Experiment Setup
Our research aims to conduct a thorough evaluation of FinAgent’s trading effectiveness, underscoring its unique capability to function efficiently with a significantly reduced historical data training window. This assessment also involves leveraging multimodal data inputs, incorporating both informational and agent-assistive augmented tools, along with a multi-perspective diversified retrieval. This approach is intended to enhance the understanding of market dynamics and sentiments, enabling more comprehensive and logical decision-making processes along with substantiated explanations. To validate its effectiveness, we have conducted a series of experiments to address the following research questions (RQs):
-
•
RQ1: Is FinAgent outperforming current state-of-the-art trading agents and handling tasks that challenge other algorithms?
-
•
RQ2: What is the effectiveness of each component of FinAgent in contributing to its overall performance?
-
•
RQ3: Does the integration of augmented tools in FinAgent lead to a distinguishable improvement in its trading performance?
-
•
RQ4: How effective is the diversified retrieval in FinAgent?
5.1. Datasets
| Asset | AAPL | AMZN | GOOGL | MSFT | TSLA | ETHUSD |
| Trading Date | From 2022-06-01 to 2024-01-01 (398 trading days) | |||||
| Asset Price | 398 (open, high, low, close, adj_close) | |||||
| Visual Data | 398 (Kline Chart, Trading Chart) | |||||
| Asset News | 9748 | 10007 | 7923 | 8178 | 10076 | 2611 |
| Expert Guidance | 593 | 509 | 488 | 393 | 600 | |
To conduct a thorough evaluation of FinAgent, we evaluate it across 6 real-world datasets. These included five datasets from the US stock markets, and one is the cryptocurrency. Each of them has multiple forms of data that come from various sources. Specifically, i) Asset Price at the day-level, including price data for open, high, low, close, and adj close; ii) Visual Data consists of historical Kline charts and trading charts, which are visual representations of asset market data and trading process on a daily basis; iii) Asset News coverage with daily updates from various esteemed sources such as Bloomberg Technology, Seeking Alpha and CNBC Television, ensuring a diverse and thorough perspective on the financial markets; iv) Expert Guidance provided by financial experts as the auxiliary information, aiming to furnish a thorough and well-rounded comprehension of market status. We summarize statistics of the 6 datasets in Table 3 and further elaborate on them in Appendix B.
| Categories | Models | AAPL | AMZN | GOOGL | MSFT | TSLA | ETHUSD | |||||||||||||||||
| ARR% | SR | MDD% | ARR% | SR | MDD% | ARR% | SR | MDD% | ARR% | SR | MDD% | ARR% | SR | MDD% | ARR% | SR | MDD% | |||||||
| Market | B&H | 13.00 | 0.60 | 14.78 | 42.33 | 1.08 | 17.38 | 22.47 | 0.71 | 12.97 | 22.49 | 0.84 | 12.92 | 37.40 | 0.72 | 32.65 | 29.26 | 0.87 | 23.21 | |||||
| Rule-based | MACD | 11.86 | 0.72 | 10.38 | 14.27 | 0.71 | 7.84 | -18.00 | -0.89 | 20.07 | 15.23 | 0.77 | 8.34 | -4.90 | -0.02 | 14.15 | 10.24 | 0.47 | 24.32 | |||||
| KDJ&RSI | 2.17 | 0.17 | 11.88 | 19.38 | 0.65 | 17.27 | 24.39 | 2.13 | 2.03 | 18.84 | 1.06 | 7.78 | 2.14 | 0.17 | 24.73 | 8.87 | 0.51 | 16.95 | ||||||
| ZMR | -3.91 | -0.22 | 8.88 | 18.73 | 0.84 | 7.89 | 32.51 | 1.45 | 5.38 | 9.86 | 0.71 | 6.22 | -7.28 | -0.09 | 19.90 | 29.35 | 1.23 | 13.11 | ||||||
| RL-based | DQN (Mnih et al., 2013) | 7.92 | 0.40 | 14.88 | 27.43 | 1.17 | 5.27 | 34.40 | 1.39 | 7.15 | 30.44 | 1.18 | 10.56 | 15.07 | 0.44 | 28.12 | 29.81 | 1.18 | 9.53 | |||||
| SAC (Haarnoja et al., 2018) | 24.84 | 1.12 | 11.98 | 38.33 | 1.07 | 13.84 | 23.80 | 0.75 | 13.07 | 22.02 | 0.82 | 12.92 | 42.22 | 0.87 | 26.19 | 17.84 | 0.76 | 10.06 | ||||||
| PPO (Schulman et al., 2017) | 13.26 | 0.61 | 14.78 | 21.17 | 0.70 | 13.84 | 38.29 | 1.30 | 8.45 | 11.32 | 0.48 | 17.51 | 33.64 | 0.78 | 28.35 | 34.75 | 1.31 | 11.12 | ||||||
| LLM-based | FinGPT (Yang et al., 2023b) | -5.46 | -0.17 | 16.23 | 42.93 | 1.10 | 18.94 | 12.28 | 0.44 | 13.00 | 25.10 | 0.97 | 9.84 | 38.43 | 0.75 | 31.47 | 21.57 | 0.68 | 25.56 | |||||
| FinMem (Yu et al., 2023) | 23.78 | 1.11 | 10.39 | 40.07 | 1.03 | 18.53 | 31.27 | 1.11 | 8.97 | 40.58 | 1.50 | 7.48 | 50.04 | 0.92 | 25.77 | 44.71 | 1.27 | 13.59 | ||||||
| Ours | FinAgent | 31.89 | 1.43 | 10.40 | 65.10 | 1.61 | 13.20 | 56.15 | 1.78 | 8.45 | 44.74 | 1.79 | 5.57 | 92.27 | 2.01 | 12.14 | 43.08 | 1.18 | 12.71 | |||||
| Improvement(%) | 28.38 | 27.68 | - | 51.64 | 37.61 | - | 46.64 | - | - | 10.25 | 19.33 | 10.45 | 84.39 | 118.48 | 14.20 | - | - | - | ||||||
Our diversified portfolio includes five major stocks: Apple Inc. (AAPL), Amazon.com Inc. (AMZN), Alphabet Inc. (GOOGL), Microsoft Corporation (MSFT), and Tesla Inc. (TSLA) and a prominent cryptocurrency named Ethereum (ETHUSD). This selection aims to showcase FinAgent’s versatility and consistency across various financial assets. Chosen for their extensive news coverage and representation of different market sectors, these data provide a robust basis for assessing FinAgent’s generalization capabilities across diverse financial environments. For dataset split, the data from the latter half of the year is allocated for testing (2023-06-01 2024-01-01) purposes, while the data from the penultimate year is utilized for training (2022-06-01 2023-06-01).
5.2. Evaluation Metrics
We compare FinAgent and baselines in terms of 6 financial metrics following (Sun et al., 2023c; Qin et al., 2023), which include 1 profit metric: annual return rate (ARR), 3 risk-adjusted profit metrics: Sharpe ratio (SR), Calmar ratio (CR), Sortino ratio (SOR), and 2 risk metrics: maximum drawdown (MDD), volatility (VOL). Detailed definitions and formulas are available in Appendix C.
5.3. Baselines
We compare and evaluate the trading performance of FinAgent with four widely accepted conventional rule-based trading strategies (B&H, MACD, KDJ&RSI and ZMR) and five advanced algorithms. Among these, SAC (Haarnoja et al., 2018), PPO (Schulman et al., 2017) and DQN (Mnih et al., 2013) are three models employed RL methods, FinGPT (Yang et al., 2023b) is based on LLM, and another is FinMem (Yu et al., 2023) based on LLM Agents. A brief introduction to each method is available in Appendix D.
5.4. Implementation Details
Although FinAgent’s training and inference can be done without a GPU, we utilized a single NVIDIA RTX A6000 GPU for our benchmark methods. To ensure equitable comparison, all benchmarks are conducted within the same RL environment for both training and evaluation. The following experiments related to FinAgent all have diversified retrieval if not specifically noted. Details on the benchmark and experiments setup are provided in Appendix E.
6. Experimental Results
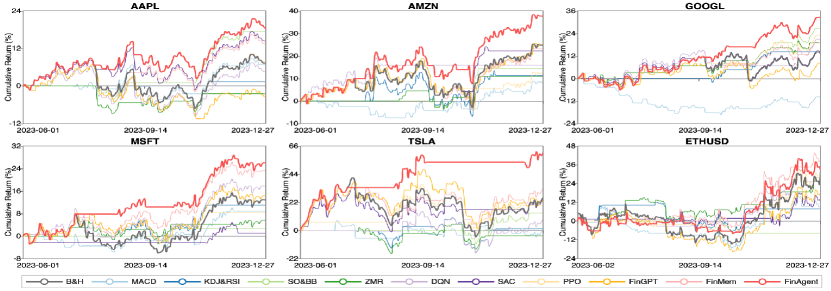
Comparison with Baselines (RQ1). We compared FinAgent with 9 baseline methods in terms of 6 financial metrics. Table 4 and Figure 3 demonstrate our method significantly outperforms existing baselines, especially remarkable improvements in profitability, and setting a new benchmark in the field. The full results and case studies of FinAgent are avaliable in Appendix I, H. FinAgent’s performance on the five stocks, as measured by ARR% and SR, with enhancements of at least 10% and 19%, compared to the best-performing baseline, respectively. Notably, its performance on the TSLA dataset stands out even more, achieving 84% and 118% improvement, significantly outperforming all other baselines. Across all datasets, FinAgent is the only method that consistently outperforms the broader market in terms of profitability. In contrast, FinMem falls short on the AMZN dataset, where its ARR% is 40%, underperforming the market’s Buy & Hold (B&H) strategy at 42%. This underscores the superior stability and robustness of FinAgent compared to other baselines. We can also observe that rule-based methods are optimal in controlling risk, but not outstanding in capturing returns. This is because rule-based model methods are robust to outliers and noise in the data and thus can reduce decision risk. It is worth noting that high returns often come with high risks. Hence, FinAgent represents a slight compromise on risk control. This result relates to our chosen investor preference of an aggressive trader. Therefore, FinAgent can slightly increase the risk to improve returns substantially.
Figure 3 illustrates that FinAgent’s performance surpasses other methods regarding cumulative returns, particularly on the TSLA dataset. Leveraging market intelligence and the reflection mechanism, FinAgent anticipates a significant stock price drop post-September 14, 2023. By taking a short position, it can effectively hedge against potential trading losses and generate high returns.
It’s important to note that our approach yields slightly lower returns than FinMem on the cryptocurrency ETH, primarily because our auxiliary agents are specialized strategies tailored for stocks, not for cryptocurrencies with higher trading frequency. Further insights from the ablation study section for FinAgent reveal that employing a generalized auxiliary agent for cryptocurrency could potentially increase returns to 54%, compared to the current 44%. This significant difference will be elaborated upon in the forthcoming ablation studies.
7. Ablation Studies
7.1. Effectiveness of Each Component (RQ2)
In Table 5, we study the effectiveness of market intelligence (M), low-level reflection (L), high-level reflection (H) and augmented tools (T). When compared to using solely M and ML, the integration of the low-level reflection module leads to an impressive increase in ARR% by 45% to 101% for TSLA, and ETHUSD, and cutting risk by 14% to 44%. When comparing the ML and MLH, the addition of the high-level reflection module significantly enhances the ARR% and SR, while notably reducing risk. This improvement comes with a minor trade-off: a slight 7% rise in MDD% for TSLA. Compared to MLH and MLHT, there’s a minor improvement in stock profitability. However, the performance of ETH cryptocurrency dropped by over 20% due to the introduction of rule-based methods as auxiliary agents, which are specialized only for stocks.
| M | L | H | T | TSLA | ETHUSD | |||||
| ARR% | SR | MDD% | ARR% | SR | MDD% | |||||
| 39.01 | 0.90 | 22.54 | 16.21 | 0.63 | 15.93 | |||||
| 39.27 | 0.77 | 30.15 | 25.97 | 0.77 | 24.43 | |||||
| 57.16(+45.56%) | 1.02 (+33.14%) | 25.77(-14.52%) | 52.33(+101.48%) | 1.34(+72.99%) | 13.59(-44.39%) | |||||
| 89.25(+56.14%) | 1.46(+42.86%) | 27.62(+7.18%) | 54.80(+4.73%) | 1.40(+5.09%) | 11.74(-13.57%) | |||||
| 92.27(+3.38%) | 2.01(+37.84%) | 12.14(-56.04%) | 43.08(-21.39%) | 1.18(-16.09%) | 12.72(+8.30%) | |||||
7.2. Effectiveness of Augmented Tools (RQ3)
As previously discussed, while the addition of auxiliary agents to stock investments results in profit improvements, it causes a considerable performance decline in cryptocurrencies. Thus, we conduct the experiment that decisions are made solely by augmented tools, such as rule-based methods serving as auxiliary agents. We conducted the experiment in which various auxiliary agents provided both decisions and their explanations. These inputs are directly integrated into FinAgent’s decision-making module without other modules’ involvement in the final decision process. As shown in Table 4 and Table 5, the 16% ARR% for solely T method starkly contrasts with the 29% ARR% of B&H in ETHUSD, highlighting the inefficacy of the stock-specific rule-based methods for cryptocurrencies and demonstrating that introducing to FinAgent significantly affects performance. This suggests that investors should not indiscriminately add auxiliary agents for investment support. Instead, they must meticulously select agents that match the characteristics of the market to avoid detrimental impact on performance.
7.3. Effectiveness of Diversified Retrieval (RQ4)
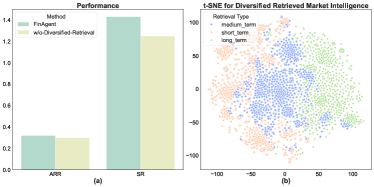
As shown in Figure 4(a), we compare the performance of FinAgent with or without diversified retrieval on AAPL, and find that the use of diversified retrieval can contribute an obvious improvement in ARR and SR. As shown in Figure 4(b), we extract different types of market intelligence that AAPL diversified retrieve to daily on the validation set and filter out individuals with the same content under the same type. We perform t-SNE visualization of its LLM extracted embedding, and we can find that the LLM extracted embedding has a clear distinction between different retrieval types, which proves the effectiveness of our method.
8. Conclusion and Future Work
This paper introduces FinAgent, a financial trading agent powered by LLM that exhibits high reasoning ability and generalizability. FinAgent is a multimodal agent that integrates both textual and visual data, enabling a comprehensive understanding of market dynamics and historical trading behaviors. It is designed to independently leverage auxiliary tools for detailed market data analysis over different time scales. With its multi-perspective and diverse retrieval approach, FinAgent effectively identifies correlations between current market conditions and past market patterns and trends and integrates market information to make final and effective decisions. For future research directions, we will apply FinAgent to other financial tasks, such as portfolio management, where LLM is used to rank each stock according to the observed market intelligence and make the stock selection.
References
- (1)
- Akiba et al. (2019) Takuya Akiba, Shotaro Sano, Toshihiko Yanase, Takeru Ohta, and Masanori Koyama. 2019. Optuna: A Next-Generation Hyperparameter Optimization Framework. In The 25th ACM SIGKDD International Conference on Knowledge Discovery & Data Mining. 2623–2631.
- An et al. (2022) Bo An, Shuo Sun, and Rundong Wang. 2022. Deep reinforcement learning for quantitative trading: Challenges and opportunities. IEEE Intelligent Systems 37, 2 (2022), 23–26.
- Chen et al. (2019) Chi Chen, Li Zhao, Jiang Bian, Chunxiao Xing, and Tie-Yan Liu. 2019. Investment behaviors can tell what inside: Exploring stock intrinsic properties for stock trend prediction. In Proceedings of the 25th ACM SIGKDD International Conference on Knowledge Discovery & Data Mining. 2376–2384.
- Chen et al. (2023) Wenhu Chen, Ming Yin, Max Ku, Pan Lu, Yixin Wan, Xueguang Ma, Jianyu Xu, Xinyi Wang, and Tony Xia. 2023. Theoremqa: A theorem-driven question answering dataset. arXiv preprint arXiv:2305.12524 (2023).
- Chowdhery et al. (2023) Aakanksha Chowdhery, Sharan Narang, Jacob Devlin, Maarten Bosma, Gaurav Mishra, Adam Roberts, Paul Barham, Hyung Won Chung, Charles Sutton, Sebastian Gehrmann, et al. 2023. Palm: Scaling language modeling with pathways. Journal of Machine Learning Research 24, 240 (2023), 1–113.
- Christianos et al. (2023) Filippos Christianos, Georgios Papoudakis, Matthieu Zimmer, Thomas Coste, Zhihao Wu, Jingxuan Chen, Khyati Khandelwal, James Doran, Xidong Feng, Jiacheng Liu, Zheng Xiong, Yicheng Luo, Jianye Hao, Kun Shao, Haitham Bou-Ammar, and Jun Wang. 2023. Pangu-Agent: A fine-tunable generalist agent with structured reasoning. arXiv:2312.14878 [cs.AI]
- Deng et al. (2016) Yue Deng, Feng Bao, Youyong Kong, Zhiquan Ren, and Qionghai Dai. 2016. Deep direct reinforcement learning for financial signal representation and trading. IEEE Transactions on Neural Networks and Learning Systems 28, 3 (2016), 653–664.
- Ding et al. (2018) Yi Ding, Weiqing Liu, Jiang Bian, Daoqiang Zhang, and Tie-Yan Liu. 2018. Investor-imitator: A framework for trading knowledge extraction. In Proceedings of the 24th ACM SIGKDD International Conference on Knowledge Discovery & Data Mining. 1310–1319.
- Edwards et al. (2018) Robert D Edwards, John Magee, and WH Charles Bassetti. 2018. Technical analysis of stock trends. CRC press.
- Feng et al. (2019) Fuli Feng, Xiangnan He, Xiang Wang, Cheng Luo, Yiqun Liu, and Tat-Seng Chua. 2019. Temporal relational ranking for stock prediction. ACM Transactions on Information Systems (TOIS) 37, 2 (2019), 1–30.
- Haarnoja et al. (2018) Tuomas Haarnoja, Aurick Zhou, Kristian Hartikainen, George Tucker, Sehoon Ha, Jie Tan, Vikash Kumar, Henry Zhu, Abhishek Gupta, Pieter Abbeel, et al. 2018. Soft actor-critic algorithms and applications. arXiv preprint arXiv:1812.05905 (2018).
- Hong et al. (2023) Sirui Hong, Mingchen Zhuge, Jonathan Chen, Xiawu Zheng, Yuheng Cheng, Ceyao Zhang, Jinlin Wang, Zili Wang, Steven Ka Shing Yau, Zijuan Lin, Liyang Zhou, Chenyu Ran, Lingfeng Xiao, Chenglin Wu, and Jürgen Schmidhuber. 2023. MetaGPT: Meta programming for a multi-agent collaborative framework. arXiv:2308.00352 [cs.AI]
- Hu et al. (2018) Ziniu Hu, Weiqing Liu, Jiang Bian, Xuanzhe Liu, and Tie-Yan Liu. 2018. Listening to chaotic whispers: A deep learning framework for news-oriented stock trend prediction. In Proceedings of the 11th ACM International Conference on Web Search and Data Mining (WSDM). 261–269.
- Johnson et al. (2019) Jeff Johnson, Matthijs Douze, and Hervé Jégou. 2019. Billion-scale similarity search with gpus. IEEE Transactions on Big Data 7, 3 (2019), 535–547.
- Ke et al. (2017) Guolin Ke, Qi Meng, Thomas Finley, Taifeng Wang, Wei Chen, Weidong Ma, Qiwei Ye, and Tie-Yan Liu. 2017. Lightgbm: A highly efficient gradient boosting decision tree. Advances in neural information processing systems 30 (2017).
- Liu et al. (2020b) Xiao-Yang Liu, Hongyang Yang, Qian Chen, Runjia Zhang, Liuqing Yang, Bowen Xiao, and Christina Dan Wang. 2020b. FinRL: A deep reinforcement learning library for automated stock trading in quantitative finance. Deep RL Workshop, NeurIPS 2020 (2020).
- Liu et al. (2020a) Yang Liu, Qi Liu, Hongke Zhao, Zhen Pan, and Chuanren Liu. 2020a. Adaptive quantitative trading: An imitative deep reinforcement learning approach. In Proceedings of the AAAI Conference on Artificial Intelligence, Vol. 34. 2128–2135.
- Lu et al. (2023a) Pan Lu, Hritik Bansal, Tony Xia, Jiacheng Liu, Chunyuan Li, Hannaneh Hajishirzi, Hao Cheng, Kai-Wei Chang, Michel Galley, and Jianfeng Gao. 2023a. Mathvista: Evaluating mathematical reasoning of foundation models in visual contexts. arXiv preprint arXiv:2310.02255 (2023).
- Lu et al. (2022a) Pan Lu, Swaroop Mishra, Tanglin Xia, Liang Qiu, Kai-Wei Chang, Song-Chun Zhu, Oyvind Tafjord, Peter Clark, and Ashwin Kalyan. 2022a. Learn to explain: Multimodal reasoning via thought chains for science question answering. Advances in Neural Information Processing Systems 35 (2022), 2507–2521.
- Lu et al. (2023b) Pan Lu, Baolin Peng, Hao Cheng, Michel Galley, Kai-Wei Chang, Ying Nian Wu, Song-Chun Zhu, and Jianfeng Gao. 2023b. Chameleon: Plug-and-Play compositional reasoning with large language models. arXiv:2304.09842 [cs.CL]
- Lu et al. (2022b) Pan Lu, Liang Qiu, Kai-Wei Chang, Ying Nian Wu, Song-Chun Zhu, Tanmay Rajpurohit, Peter Clark, and Ashwin Kalyan. 2022b. Dynamic prompt learning via policy gradient for semi-structured mathematical reasoning. arXiv preprint arXiv:2209.14610 (2022).
- Mnih et al. (2013) Volodymyr Mnih, Koray Kavukcuoglu, David Silver, Alex Graves, Ioannis Antonoglou, Daan Wierstra, and Martin Riedmiller. 2013. Playing atari with deep reinforcement learning. arXiv preprint arXiv:1312.5602 (2013).
- Nakano et al. (2021) Reiichiro Nakano, Jacob Hilton, Suchir Balaji, Jeff Wu, Long Ouyang, Christina Kim, Christopher Hesse, Shantanu Jain, Vineet Kosaraju, William Saunders, et al. 2021. Webgpt: Browser-assisted question-answering with human feedback. arXiv preprint arXiv:2112.09332 (2021).
- Nelson et al. (2017) David MQ Nelson, Adriano CM Pereira, and Renato A de Oliveira. 2017. Stock market’s price movement prediction with LSTM neural networks. In 2017 International Joint Conference on Neural Networks (IJCNN). 1419–1426.
- OpenAI (2021) OpenAI. 2021. Chatgpt. https://openai.com/research/chatgpt
- OpenAI (2023a) OpenAI. 2023a. GPT-4 Technical Report. arXiv:2303.08774 [cs.AI]
- OpenAI (2023b) OpenAI. 2023b. GPT-4V(ision) system card. https://openai.com/research/gpt-4v-system-card
- Parisi et al. (2022) Aaron Parisi, Yao Zhao, and Noah Fiedel. 2022. Talm: Tool augmented language models. arXiv preprint arXiv:2205.12255 (2022).
- Park et al. (2023) Joon Sung Park, Joseph C. O’Brien, Carrie J. Cai, Meredith Ringel Morris, Percy Liang, and Michael S. Bernstein. 2023. Generative Agents: Interactive simulacra of human behavior. arXiv:2304.03442 [cs.HC]
- Qin et al. (2023) Molei Qin, Shuo Sun, Wentao Zhang, Haochong Xia, Xinrun Wang, and Bo An. 2023. Earnhft: Efficient hierarchical reinforcement learning for high frequency trading. arXiv preprint arXiv:2309.12891 (2023).
- Sawhney et al. (2020a) Ramit Sawhney, Shivam Agarwal, Arnav Wadhwa, and Rajiv Shah. 2020a. Deep attentive learning for stock movement prediction from social media text and company correlations. In Proceedings of the 2020 Conference on Empirical Methods in Natural Language Processing (EMNLP). 8415–8426.
- Sawhney et al. (2020b) Ramit Sawhney, Piyush Khanna, Arshiya Aggarwal, Taru Jain, Puneet Mathur, and Rajiv Shah. 2020b. VolTAGE: Volatility forecasting via text-audio fusion with graph convolution networks for earnings calls. In Proceedings of the 2020 Conference on Empirical Methods in Natural Language Processing (EMNLP). 8001–8013.
- Sawhney et al. (2021) Ramit Sawhney, Arnav Wadhwa, Shivam Agarwal, and Rajiv Shah. 2021. Quantitative day trading from natural language using reinforcement learning. In Proceedings of the 2021 Conference of the North American Chapter of the Association for Computational Linguistics: Human Language Technologies. 4018–4030.
- Schick et al. (2023) Timo Schick, Jane Dwivedi-Yu, Roberto Dessì, Roberta Raileanu, Maria Lomeli, Luke Zettlemoyer, Nicola Cancedda, and Thomas Scialom. 2023. Toolformer: Language models can teach themselves to use tools. arXiv preprint arXiv:2302.04761 (2023).
- Schulman et al. (2017) John Schulman, Filip Wolski, Prafulla Dhariwal, Alec Radford, and Oleg Klimov. 2017. Proximal policy optimization algorithms. arXiv preprint arXiv:1707.06347 (2017).
- Sumers et al. (2023) Theodore R Sumers, Shunyu Yao, Karthik Narasimhan, and Thomas L Griffiths. 2023. Cognitive architectures for language agents. arXiv preprint arXiv:2309.02427 (2023).
- Sun et al. (2023a) Liangtai Sun, Yang Han, Zihan Zhao, Da Ma, Zhennan Shen, Baocai Chen, Lu Chen, and Kai Yu. 2023a. Scieval: A multi-level large language model evaluation benchmark for scientific research. arXiv preprint arXiv:2308.13149 (2023).
- Sun et al. (2023b) Shuo Sun, Molei Qin, Xinrun Wang, and Bo An. 2023b. PRUDEX-Compass: Towards systematic evaluation of reinforcement learning in financial markets. Transactions on Machine Learning Research (2023).
- Sun et al. (2023c) Shuo Sun, Molei Qin, wentao zhang, Haochong Xia, Chuqiao Zong, Jie Ying, Yonggang Xie, Lingxuan Zhao, Xinrun Wang, and Bo An. 2023c. TradeMaster: A holistic quantitative trading platform empowered by reinforcement learning. In Thirty-seventh Conference on Neural Information Processing Systems Datasets and Benchmarks Track.
- Sun et al. (2023d) Shuo Sun, Rundong Wang, and Bo An. 2023d. Reinforcement learning for quantitative trading. ACM Transactions on Intelligent Systems and Technology 14, 3 (2023), 1–29.
- Sun et al. (2023e) Shuo Sun, Xinrun Wang, Wanqi Xue, Xiaoxuan Lou, and Bo An. 2023e. Mastering stock markets with efficient mixture of diversified trading experts. In Proceedings of the 29th ACM SIGKDD Conference on Knowledge Discovery and Data Mining (KDD ’23). 2109–2119.
- Thoppilan et al. (2022) Romal Thoppilan, Daniel De Freitas, Jamie Hall, Noam Shazeer, Apoorv Kulshreshtha, Heng-Tze Cheng, Alicia Jin, Taylor Bos, Leslie Baker, Yu Du, et al. 2022. Lamda: Language models for dialog applications. arXiv preprint arXiv:2201.08239 (2022).
- Touvron et al. (2023) Hugo Touvron, Thibaut Lavril, Gautier Izacard, Xavier Martinet, Marie-Anne Lachaux, Timothée Lacroix, Baptiste Rozière, Naman Goyal, Eric Hambro, Faisal Azhar, et al. 2023. Llama: Open and efficient foundation language models. arXiv preprint arXiv:2302.13971 (2023).
- Wang et al. (2023b) Guanzhi Wang, Yuqi Xie, Yunfan Jiang, Ajay Mandlekar, Chaowei Xiao, Yuke Zhu, Linxi Fan, and Anima Anandkumar. 2023b. Voyager: An open-ended embodied agent with large language models. arXiv preprint arXiv: Arxiv-2305.16291 (2023).
- Wang et al. (2019) Jia Wang, Tong Sun, Benyuan Liu, Yu Cao, and Hongwei Zhu. 2019. CLVSA: A convolutional LSTM based variational sequence-to-sequence model with attention for predicting trends of financial markets. In Proceedings of the 28th International Joint Conference on Artificial Intelligence (IJCAI). 3705–3711.
- Wang et al. (2021b) Rundong Wang, Hongxin Wei, Bo An, Zhouyan Feng, and Jun Yao. 2021b. Commission fee is not enough: A hierarchical reinforced framework for portfolio management. In Proceedings of the AAAI Conference on Artificial Intelligence, Vol. 35. 626–633.
- Wang et al. (2023a) Xiaoxuan Wang, Ziniu Hu, Pan Lu, Yanqiao Zhu, Jieyu Zhang, Satyen Subramaniam, Arjun R Loomba, Shichang Zhang, Yizhou Sun, and Wei Wang. 2023a. Scibench: Evaluating college-level scientific problem-solving abilities of large language models. arXiv preprint arXiv:2307.10635 (2023).
- Wang et al. (2021a) Zhicheng Wang, Biwei Huang, Shikui Tu, Kun Zhang, and Lei Xu. 2021a. DeepTrader: a deep reinforcement learning approach for risk-return balanced portfolio management with market conditions Embedding. In Proceedings of the AAAI Conference on Artificial Intelligence, Vol. 35. 643–650.
- Wu et al. (2023) Shijie Wu, Ozan Irsoy, Steven Lu, Vadim Dabravolski, Mark Dredze, Sebastian Gehrmann, Prabhanjan Kambadur, David Rosenberg, and Gideon Mann. 2023. Bloomberggpt: A large language model for finance. arXiv preprint arXiv:2303.17564 (2023).
- Xu and Cohen (2018) Yumo Xu and Shay B Cohen. 2018. Stock movement prediction from tweets and historical prices. In Proceedings of the 56th Annual Meeting of the Association for Computational Linguistics (ACL). 1970–1979.
- Yang et al. (2023b) Hongyang Yang, Xiao-Yang Liu, and Christina Dan Wang. 2023b. FinGPT: Open-Source Financial Large Language Models. arXiv preprint arXiv:2306.06031 (2023).
- Yang et al. (2023c) Hui Yang, Sifu Yue, and Yunzhong He. 2023c. Auto-GPT for Online Decision Making: Benchmarks and Additional Opinions. arXiv:2306.02224 [cs.AI]
- Yang et al. (2023a) Zhengyuan Yang, Linjie Li, Jianfeng Wang, Kevin Lin, Ehsan Azarnasab, Faisal Ahmed, Zicheng Liu, Ce Liu, Michael Zeng, and Lijuan Wang. 2023a. MM-REACT: Prompting ChatGPT for multimodal reasoning and action. arXiv:2303.11381 [cs.CV]
- Ye et al. (2020) Yunan Ye, Hengzhi Pei, Boxin Wang, Pin-Yu Chen, Yada Zhu, Ju Xiao, and Bo Li. 2020. Reinforcement-learning based portfolio management with augmented asset movement prediction states. In Proceedings of the AAAI Conference on Artificial Intelligence, Vol. 34. 1112–1119.
- Yu et al. (2022) Wenhao Yu, Dan Iter, Shuohang Wang, Yichong Xu, Mingxuan Ju, Soumya Sanyal, Chenguang Zhu, Michael Zeng, and Meng Jiang. 2022. Generate rather than retrieve: Large language models are strong context generators. arXiv preprint arXiv:2209.10063 (2022).
- Yu et al. (2023) Yangyang Yu, Haohang Li, Zhi Chen, Yuechen Jiang, Yang Li, Denghui Zhang, Rong Liu, Jordan W. Suchow, and Khaldoun Khashanah. 2023. FinMem: A performance-enhanced LLM trading agent with layered memory and character design. arXiv:2311.13743 [q-fin.CP]
- Zhang et al. (2023) Chi Zhang, Zhao Yang, Jiaxuan Liu, Yucheng Han, Xin Chen, Zebiao Huang, Bin Fu, and Gang Yu. 2023. AppAgent: Multimodal agents as smartphone users. arXiv:2312.13771 [cs.CV]
Appendix A Details of Notations
We provide the main notations in Table 6.
| Notation | Description |
| current day | |
| total number of trading days | |
| short-term price analysis examines price fluctuations between past to , and future to periods | |
| medium-term price analysis examines price fluctuations between past to , and future to periods | |
| long-term price analysis examines price fluctuations between past to , and future to periods | |
| a finite set of states | |
| state of day | |
| a finite set of actions | |
| action of day | |
| transition function | |
| reward function | |
| reward of day associated with and | |
| discount factor | |
| policy | |
| specialized modules that are designed to encapsulate any beneficial internal reasoning processes | |
| specialized modules of day | |
| task. e.g., quantitative trading and portfolio management | |
| memory of day in the task | |
| tool of day in the task | |
| task-relevant prompt generator | |
| task-specific action parsing function | |
| M, L, H modules of day in the task | |
| prompt generator for M, L, H modules in the task | |
| memory of M, L, H modules of day in the task | |
| Kline chart of day | |
| trading chart of day | |
| summary of latest market intelligence of day | |
| retrieval types and query texts corresponding to retrieval type of retrieved past market intelligence of day | |
| retrieved topk items | |
| retrieval type and top retrieved past market latest intelligence | |
| summary of retrieved past market intelligence of day | |
| low-level reflection results at short term, medium term and long term impact | |
| query text for low-level reflection of day | |
| retrieved topk low-level reflection in short term, medium term and long term | |
| high-level reflection results of day | |
| query text for high-level reflection of day | |
| retrieved topk high-level reflection of day |
Appendix B Details of Datasets and Processing
To conduct a thorough evaluation of FinAgent, we evaluate it across 6 real-world datasets. These included five datasets from the US stock markets and one is the cryptocurrency. Each of them have multiple forms of data that come from various sources. Specifically, i) Asset Price at the day-level, including price data for open, high, low, close, and adj close; ii) Visual Data consists of historical Kline charts and trading charts, which are visual representations of asset market data and trading process on a daily basis; iii) Asset News coverage with daily updates from various esteemed sources, including Bloomberg Technology, Seeking Alpha, CNBC Television, and more, ensuring a diverse and thorough perspective on the financial markets; iv) Expert Guidance provided by financial experts as the auxiliary information, aiming to furnish a thorough and well-rounded comprehension of market status. We summarize statistics of the 6 datasets in Table 3 and further elaborate on them as follows:
Asset. We selected a varied portfolio comprising five stocks Apple Inc. (AAPL), Amazon.com Inc. (AMZN), Alphabet Inc. (GOOGL), Microsoft Corporation (MSFT), and Tesla Inc. (TSLA), a foreign exchange pair, and a prominent cryptocurrency, Ethereum (ETH). This selection aims to showcase FinAgent’s versatility and consistency across various financial assets. Chosen for their extensive news coverage and representation of different market sectors, these data provide a robust basis for assessing FinAgent’s generalization capabilities across diverse financial environments.
Price and News. We acquired price and news data for all assets from Financial Modeling Prep444FMP API provides data about stock historical price and news, company financial statements, forex and cryptocurrencies. Entry is https://site.financialmodelingprep.com. (FMP), wherein the price data encompasses including open, high, low, clos, and adj close. The news data is sourced from renowned market analysis and stock research platforms, notably including Seeking Alpha and so on. This selection ensures a comprehensive dataset, integrating both quantitative financial metrics and qualitative market insights.
Visual Data. Within the textual data framework, we furnish FinAgent with visual information, specifically including historical Kline charts and trading line charts, to enhance its analytical capabilities. The tool employed for this plotting task is the pyecharts 555https://github.com/pyecharts/pyecharts, a specialized library for financial data visualization.
Expert Guidance. Expert Guidance is provided as a distinct component of the auxiliary information by augmented tools. This selection ensures a comprehensive dataset, integrating professional analysts and individual investors insights, fostering a diverse range of perspectives in the investment community.
Trading Date. For dataset split, the data from the latter half of the year is allocated for testing (2023-06-01666Dates follow the YYYY-MM-DD format, e.g., ”2023-06-01” for June 1st, 2023. 2024-01-01) purposes, while the data from the penultimate year is utilized for training (2022-06-01 2023-06-01).
Appendix C Details of Evaluation Metrics
We compared FinAgent and benchmarks in terms of 6 financial metrics, including 1 profit criterion, 3 risk-adjusted profit criteria, and 2 risk criteria. Definitions and formulas are as follows:
-
•
Annual Rate of Return (ARR) is the annualized average return rate, calculated as , where is the total number of trading days, and is the number of trading days within a year. and represent the final and initial portfolio values.
-
•
Sharpe Ratio (SR) measures risk-adjusted returns of portfolios. It is defined as , where is the expectation, is the standard deviation, denotes the historical sequence of the return rate.
-
•
Volatility (VOL) is the variation in an investment’s return over time, measured as the standard deviation .
-
•
Maximum Drawdown (MDD) measures the largest loss from any peak to show the worst case. It is defined as: , where and .
-
•
Calmar Ratio (CR) compares average annualized return to maximum drawdown, assessing risk-adjusted performance. It is defined as .
-
•
Sortino Ratio (SoR) is a risk-adjusted measure that focuses on the downside risk of a portfolio. It is defined as , where is the standard deviation of negative return.
Appendix D Details of Benchmark Methods
We compare and evaluate the trading performance of FinAgent with four widely accepted conventional benchmark trading strategies (B&H, MACD, KDJ&RSI and ZMR) and five advanced algorithms. Among these, SAC (Haarnoja et al., 2018), PPO (Schulman et al., 2017) and DQN (Mnih et al., 2013) are three models employed deep reinforcement learning (RL) methods, FinGPT (Yang et al., 2023b) is based on LLM, and another is FinMem (Yu et al., 2023) that based on LLM Agents. The following will provide a brief introduction to each model:
-
•
Rule-based
-
–
Buy-and-Hold (B&H) involves holding assets for an extended period, regardless of short-term market fluctuations, assuming that long-term returns will be more favorable.
-
–
Moving Average Convergence Divergence (MACD) is a technical analysis tool that uses MACD indicator and signal line crossovers to identify trading signals and market trends.
-
–
KDJ with RSI Filter (KDJ&RSI) integrates the KDJ indicator for detecting market extremes with the RSI indicator for momentum analysis to identify precise trading signals in financial markets.
-
–
Z-score Mean Reversion (ZMR) assumes that the price will revert to its mean over time with the metric of Z-score.
-
–
-
•
RL-based
-
–
SAC (Haarnoja et al., 2018) is an off-policy actor-critic algorithm that optimizes trading strategies using entropy regularization and soft value functions in continuous action spaces.
-
–
PPO (Schulman et al., 2017) updates trading policies iteratively to balance exploration and exploitation, ensuring stability and sample efficiency.
-
–
DQN (Mnih et al., 2013) uses deep neural networks (DNNs) to make trading decisions by approximating the action-value function based on market data.
-
–
-
•
LLM-based
-
–
FinGPT (Yang et al., 2023b) is an open-source LLM framework designed to transform textual and numerical inputs into insightful financial decisions, asserting its advantage over conventional B&H strategies.
-
–
FinMem (Yu et al., 2023) is an advanced LLM agent framework for automated trading, optimized through fine-tuning the agent’s perceptual span and character settings, significantly enhancing trading performance and boosting cumulative investment returns.
-
–
Appendix E Details of Implementation
Although FinAgent’s training and inference can be done without a GPU, we utilized a single NVIDIA RTX A6000 GPU for our benchmark methods. For dataset split, the data from the latter half of the year is allocated for testing (2023-06-01 2024-01-01) purposes, while the data from the penultimate year is utilized for training (2022-06-01 2023-06-01). To ensure equitable comparison, all benchmarks are conducted within the same RL environment for both training and evaluation.
Benchmark Setup. In the training phase, we use OPTUNA (Akiba et al., 2019) for hyperparameter optimization, adapting both rule-based and RL methods to trading. This process is followed by an evaluation with the optimal parameters. We employ the officially provided default parameters for both training and testing of FinGPT and FinMem.
FinAgent Setup. For each training dataset, we perform only one round of training without the usual requirement for multiple iterations in fine-tuning LLMs. As demonstrated by FinMem (Yu et al., 2023), OpenAI’s GPT-4 shows improved performance over GPT-3.5. Consequently, we have selected GPT-4 as the foundational LLM for FinAgent. For the market intelligence and decision-making modules, which do not process visual data, we use the gpt-4-1106-preview. In contrast, the two reflection modules, which require an in-depth understanding of visual data, utilize gpt-4-vision-preview. For the memory module, which is designed to store777We leveraged the open-source vector database FAISS (Johnson et al., 2019) for constructing the memory module of FinAgent. and retrieve texts based on text similarity, a text encoder is essential for vectorizing the text. We adopt text-embedding-3-large for this purpose. The top-k of our retrieval samples is 5. In the low-level reflection module, short term, medium term and long term are for the latest 1 day, 7 days and 14 days respectively. It is important to note that past and future asset price increases and decreases are visible during the training phase, but only past trends are visible during the testing phase to prevent data leakage. The following experiments related to FinAgent all have diversified retrieval if not specifically noted.
Appendix F Details of Workflow of FinAgent
In this section we focus on FinAgent’s workflow and code implementation.
F.1. Main Entry
We follow the RL process, as shown in the code below, where we initialize the dataset and construct environment for subsequent training and inference.
F.2. Run Step
The whole process is mainly through the global params storage and transimit parameters, we do not list the parameter transmition process in detail here. To execute each step, the following primary procedures are adhered to:
Appendix G Details of Prompt Design
Our prompt templates are designed modularly, featuring separate templates for the latest and past market intelligence, low-level reflection, high-level reflection, and decision-making modules. These templates include variables marked as ”$$key$$” within the ”params” dictionary. Our template utilizes HTML for its ability to combine formatting with user-friendly visualizations. In our testing, we find that JSON’s strict formatting requirements frequently lead to errors. As a result, we opt for XML, a format with more flexible standards. XML is easy to parse, and extracting fields is simpler, making it an ideal output format for GPT-4. Next, we use the ”params” to populate the template with the relevant fields. Following this, we employ an HTML parsing tool to create the JSON message format GPT-4 API demands. We then make API requests to obtain the response output. An example of low level reflection template running is shown as the following Figure 5.
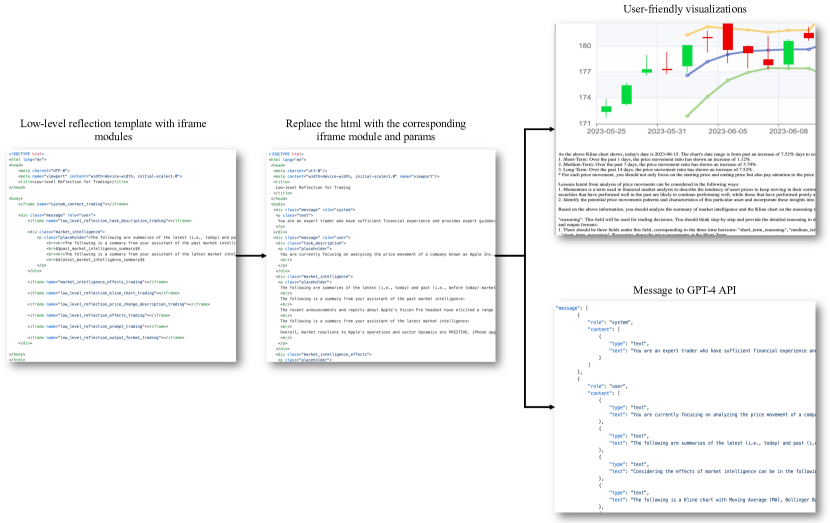
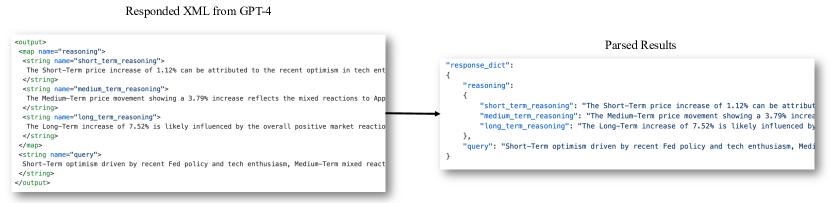
Lastly, we extract the necessary field information using an XML parsing tool as depicted in Figure 6. Each of these iframe modules is carefully designed by us, and we will show each of them in the following subsections.
G.1. Market Intelligence
Market intelligence consists of 2 templates and 7 iframe modules, the XML templates of which are detailed as follows:
Latest Market Intelligence Template
Past Market Intelligence Template
System Content
Task Description
Market Intelligence Effects
Latest Market Intelligence Prompt
Latest Market Intelligence Output Format
Past Market Intelligence Prompt
Past Market Intelligence Output Format
G.2. Low-level Reflection
Low-level reflection consists of 1 template and 7 iframe modules, the XML templates of which are detailed as follows:
Low-level Reflection Template
System Content
Task Description
Kline chart
Price Change Description
Low-level Reflection Effects
Low-level Reflection Prompt
Low-level Reflection Output Format
G.3. High-level Reflection
High-level reflection consists of 1 template and 6 iframe modules, the XML templates of which are detailed as follows:
High-level Reflection Template
System Content
Task Description
Trading chart
High-level Reflection Effects
High-level Reflection Prompt
High-level Reflection Output Format
G.4. Decision-making
Decision-making consists of 1 template and 7 iframe modules, the XML templates of which are detailed as follows:
Decision-making Template
System Content
Task Description
Trading Preference
Decision-making Guidance
Decision-making Strategy
Decision-making Prompt
Decision-making Output Format
Appendix H Details of Comparison with Baselines
We compared FinAgent with 9 baseline methods in terms of 6 financial metrics. Table 7 and Figure 3 demonstrate our method significantly outperforms existing baselines, especially remarkable improvements in profitability, and setting a new benchmark in the field.
| Categories | Models | AAPL | AMZN | GOOGL | MSFT | TSLA | ETHUSD | |||||||||||||||||
| ARR% | SR | MDD% | ARR% | SR | MDD% | ARR% | SR | MDD% | ARR% | SR | MDD% | ARR% | SR | MDD% | ARR% | SR | MDD% | |||||||
| Market | B&H | 13.0024 | 0.5998 | 14.7809 | 42.3337 | 1.0834 | 17.3848 | 22.4726 | 0.7108 | 12.9705 | 22.4942 | 0.8373 | 12.9214 | 37.4009 | 0.7239 | 32.6523 | 29.2588 | 0.8655 | 23.2077 | |||||
| Rule-based | MACD | 11.8642 | 0.7221 | 10.3799 | 14.2748 | 0.7056 | 7.8410 | -18.0034 | -0.8867 | 20.0718 | 15.2322 | 0.7704 | 8.3445 | -4.8974 | -0.0203 | 14.1546 | 10.2360 | 0.4689 | 24.3238 | |||||
| KDJ&RSI | 2.1737 | 0.1746 | 11.8789 | 19.3757 | 0.6495 | 17.2746 | 24.3910 | 2.1282 | 2.0300 | 18.8415 | 1.0587 | 7.7806 | 2.1370 | 0.1695 | 24.7270 | 8.8745 | 0.5098 | 16.9536 | ||||||
| ZMR | -3.9084 | -0.2186 | 8.8819 | 18.7289 | 0.8412 | 7.8938 | 32.5112 | 1.4533 | 5.3845 | 9.8637 | 0.7106 | 6.2210 | -7.2806 | -0.0863 | 19.9048 | 29.3519 | 1.2294 | 13.1098 | ||||||
| RL-based | DQN | 7.9236 | 0.4010 | 14.8785 | 27.4305 | 1.1701 | 5.2736 | 34.4026 | 1.3859 | 7.1473 | 30.4406 | 1.1782 | 10.5612 | 15.0693 | 0.4430 | 28.1204 | 29.8052 | 1.1826 | 9.5297 | |||||
| SAC | 24.8449 | 1.1234 | 11.9776 | 38.3318 | 1.0733 | 13.8432 | 23.8034 | 0.7506 | 13.0667 | 22.0218 | 0.8177 | 12.9214 | 42.2209 | 0.8727 | 26.1947 | 17.8439 | 0.7635 | 10.0587 | ||||||
| PPO | 13.2619 | 0.6096 | 14.7809 | 21.1745 | 0.6965 | 13.8432 | 38.2907 | 1.2982 | 8.4536 | 11.3219 | 0.4831 | 17.5054 | 33.6444 | 0.7767 | 28.3527 | 34.7469 | 1.3096 | 11.1171 | ||||||
| LLM-based | FinGPT | -5.4632 | -0.1731 | 16.2268 | 42.9331 | 1.1026 | 18.9359 | 12.2770 | 0.4444 | 13.0013 | 25.1012 | 0.9667 | 9.8426 | 38.4338 | 0.7504 | 31.4740 | 21.5746 | 0.6801 | 25.5620 | |||||
| FinMem | 23.7809 | 1.1073 | 10.3872 | 40.07 | 1.034 | 18.5279 | 31.2716 | 1.1073 | 8.9706 | 40.5757 | 1.4989 | 7.4838 | 50.0353 | 0.9233 | 25.7714 | 44.717 | 1.2738 | 13.587 | ||||||
| FinAgent (Our) | w/o-MLH | 18.5186 | 0.9882 | 11.8842 | 62.3106 | 1.6379 | 11.3999 | 37.3308 | 1.2657 | 12.4859 | 18.2970 | 0.8945 | 9.6792 | 39.0087 | 0.8971 | 22.5376 | 16.2106 | 0.6329 | 15.9325 | |||||
| w/o-LHT | 12.6872 | 0.5849 | 14.7806 | 43.2195 | 1.1057 | 14.6786 | 17.4140 | 0.5763 | 13.0060 | 18.4571 | 0.7108 | 14.2551 | 39.2704 | 0.7662 | 30.1507 | 25.9708 | 0.7718 | 24.4314 | ||||||
| w/o-HT | 21.3044 | 0.9777 | 13.6424 | 47.3916 | 1.2032 | 15.5038 | 29.3235 | 1.0177 | 8.9706 | 39.9073 | 1.4777 | 7.4838 | 57.1638 | 1.0201 | 25.7714 | 52.3265 | 1.3351 | 13.5870 | ||||||
| w/o-T | 33.7509 | 1.5205 | 8.1783 | 63.8116 | 1.7009 | 9.7325 | 52.1066 | 1.8228 | 8.3106 | 42.5213 | 1.4909 | 7.6998 | 89.2532 | 1.4573 | 27.6213 | 54.8040 | 1.4030 | 11.7427 | ||||||
| FinAgent | 31.8972 | 1.4326 | 2.9424 | 65.0998 | 1.6096 | 4.4841 | 56.1542 | 1.7786 | 6.0365 | 44.7359 | 1.7884 | 7.4209 | 92.2677 | 2.0088 | 6.4543 | 43.0822 | 1.1773 | 3.3078 | ||||||
| Improvement(%) | 35.8464 | 35.3481 | 7.9217 | 50.4556 | 45.3636 | - | 46.6523 | - | - | 10.2529 | 19.3142 | 10.4131 | 84.4052 | 117.5674 | 14.2116 | 22.5574 | 7.1319 | - | ||||||
| Categories | Models | AAPL | AMZN | GOOGL | MSFT | TSLA | ETHUSD | |||||||||||||||||
| SOR | CR | VOL | SOR | CR | VOL | SOR | CR | VOL | SOR | CR | VOL | SOR | CR | VOL | SOR | CR | VOL | |||||||
| Market | B&H | 16.5846 | 0.9589 | 0.0114 | 35.1804 | 2.4319 | 0.0188 | 18.5186 | 1.9025 | 0.0167 | 26.5133 | 1.8135 | 0.0135 | 23.3319 | 1.3856 | 0.0301 | 23.2235 | 1.3831 | 0.0222 | |||||
| Rule-based | MACD | 13.7755 | 1.1877 | 0.0082 | 19.2452 | 1.9176 | 0.0103 | -20.9170 | -0.8883 | 0.0097 | 18.7485 | 1.8966 | 0.0099 | -0.4067 | -0.0544 | 0.0182 | 10.8951 | 0.5433 | 0.0166 | |||||
| KDJ&RSI | 3.3994 | 0.2578 | 0.0084 | 16.6915 | 1.2471 | 0.0160 | 36.6655 | 11.4076 | 0.0052 | 19.5346 | 2.4169 | 0.0085 | 3.3617 | 0.2737 | 0.0192 | 7.7786 | 0.6106 | 0.0120 | ||||||
| ZMR | -2.9977 | -0.3700 | 0.0072 | 9.5853 | 2.4473 | 0.0110 | 35.1125 | 5.7782 | 0.0103 | 12.9275 | 1.6385 | 0.0069 | -1.8214 | -0.1642 | 0.0182 | 21.4433 | 2.1715 | 0.0137 | ||||||
| RL-based | DQN | 10.3705 | 0.6266 | 0.0111 | 29.7698 | 5.1156 | 0.0111 | 37.7389 | 4.6190 | 0.0114 | 32.8642 | 2.8493 | 0.0122 | 11.0394 | 0.7399 | 0.0225 | 24.6279 | 3.0545 | 0.0143 | |||||
| SAC | 33.5676 | 2.0552 | 0.0105 | 32.4320 | 2.7660 | 0.0112 | 19.3937 | 1.9708 | 0.0165 | 26.0662 | 1.7829 | 0.0135 | 26.2869 | 1.4410 | 0.0251 | 13.3918 | 1.9199 | 0.0146 | ||||||
| PPO | 16.7660 | 0.9747 | 0.0113 | 20.3167 | 1.6735 | 0.0159 | 42.7201 | 4.3691 | 0.0136 | 14.7808 | 0.7484 | 0.0130 | 19.1547 | 1.3203 | 0.0231 | 27.2416 | 2.9836 | 0.0147 | ||||||
| LLM-based | FinGPT | -4.6731 | -0.2460 | 0.0111 | 34.8082 | 2.2545 | 0.0186 | 11.6596 | 1.1842 | 0.0167 | 30.1935 | 2.5867 | 0.0127 | 23.1813 | 1.4402 | 0.0291 | 18.5817 | 1.0131 | 0.0221 | |||||
| FinMem | 29.8819 | 2.2731 | 0.0102 | 33.0779 | 2.1843 | 0.0188 | 34.7826 | 3.4572 | 0.0134 | 47.1061 | 5.1266 | 0.0123 | 25.8819 | 2.0887 | 0.028 | 34.1492 | 3.1349 | 0.0194 | ||||||
| FinAgent (Our) | w/o-MLH | 20.8183 | 1.5678 | 0.0090 | 53.4328 | 4.9724 | 0.0166 | 24.9489 | 2.9016 | 0.0137 | 22.0401 | 1.9273 | 0.0100 | 20.3649 | 1.8355 | 0.0221 | 14.0758 | 1.1917 | 0.0174 | |||||
| w/o-LHT | 16.1500 | 0.9396 | 0.0114 | 35.1674 | 2.9256 | 0.0186 | 15.1339 | 1.5520 | 0.0168 | 22.4806 | 1.3883 | 0.0133 | 22.2082 | 1.5162 | 0.0286 | 21.0778 | 1.2131 | 0.0222 | ||||||
| w/o-HT | 29.5194 | 1.5760 | 0.0105 | 40.4896 | 2.9758 | 0.0184 | 33.6191 | 3.2906 | 0.0139 | 46.4396 | 5.0540 | 0.0123 | 28.3015 | 2.2956 | 0.0278 | 37.1720 | 3.6027 | 0.0212 | ||||||
| w/o-T | 46.6145 | 3.9301 | 0.0101 | 50.1096 | 5.9255 | 0.0162 | 62.2508 | 5.7201 | 0.0125 | 40.3937 | 5.2137 | 0.0129 | 41.5642 | 2.9306 | 0.0266 | 37.4619 | 4.2958 | 0.0208 | ||||||
| FinAgent | 44.2812 | 10.4032 | 0.0102 | 52.5602 | 13.198 | 0.0176 | 62.2992 | 8.4532 | 0.0138 | 49.6249 | 5.5732 | 0.0111 | 45.4139 | 12.143 | 0.0187 | 31.0159 | 12.7171 | 0.0207 | ||||||
| Improvement(%) | 38.8675 | 72.8960 | - | 51.8823 | 15.8320 | - | 45.3630 | - | - | 5.3471 | 44.7529 | - | 72.7625 | 209.0104 | - | 9.7007 | 37.0315 | - | ||||||
Appendix I Details of FinAgent analysis
We provide a detailed analysis of FinAgent’s performance in this section and will provide some decision-making case studies.
I.1. Case Study I
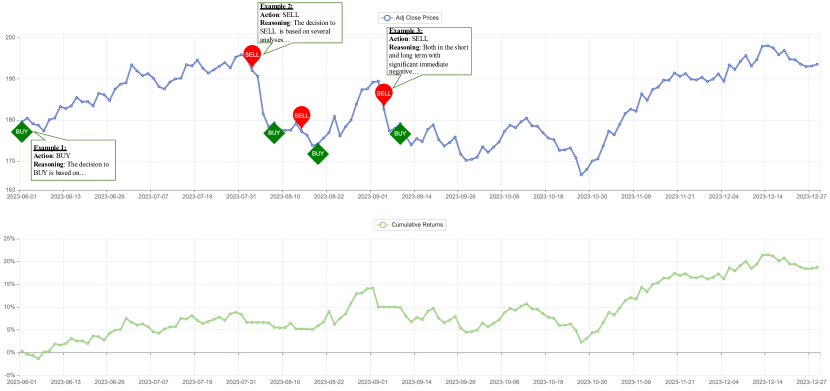
Example 1
Example 2
Example 3
FinAgent’s decision-making prowess showcases a sophisticated blend of comprehensive analysis, adaptability, and rigorous risk management, each playing a pivotal role in navigating the intricate dynamics of financial markets. The methodology is rooted in a deep analysis that encompasses an array of factors such as market intelligence, price trends, and expert investment advice. This holistic approach enables FinAgent to distill actionable insights from complex data streams, as demonstrated in Example 1 where the BUY decision was informed by a confluence of positive market sentiment toward Apple’s innovative AR/VR product line and a bullish price trajectory across different timelines.
The essence of FinAgent’s strategy lies in its remarkable adaptability and commitment to learning from historical trading patterns. This aspect is vividly illustrated in Example 2, where a SELL decision was guided by an analysis revealing a negative medium to long-term market sentiment, underscoring FinAgent’s capacity to preemptively adjust its positions in anticipation of future market movements.
Correcting the earlier oversight, Example 3 indeed underscores a SELL decision, driven by a nuanced evaluation of mixed market sentiments, immediate negative challenges potentially impacting AAPL’s stock price, and the critical constraint of limited cash reserves. This example highlights FinAgent’s strategic foresight and prudence. Despite recognizing the technical strength and a bullish trend in the long-term price movement analysis, FinAgent opts to sell, prioritizing liquidity and risk mitigation over speculative gains in the face of significant immediate uncertainties and financial limitations.
In conclusion, FinAgent’s strategic approach to decision-making, illustrated through these examples, emphasizes the importance of a balanced, informed, and cautious investment strategy. By synthesizing comprehensive market analysis, drawing lessons from past trading experiences, and meticulously managing risks, FinAgent adeptly maneuvers through market volatility. This disciplined methodology not only optimizes potential returns but also diligently minimizes exposure to adverse market swings, demonstrating the criticality of adaptability and prudent risk assessment in achieving sustainable investment success.
I.2. Case Study: II
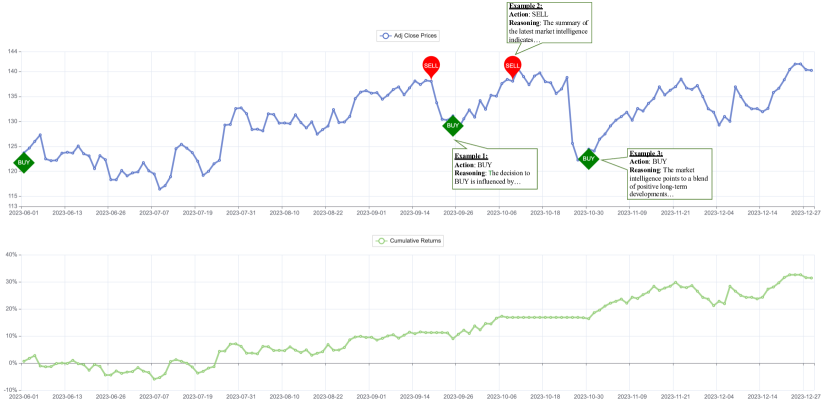
Example 1
Example 2
Example 3
The decision-making approach of FinAgent, as showcased through the examples, underscores a comprehensive and nuanced understanding of the market, demonstrating several core strengths that contribute to its effective trading strategy.
Firstly, in Example 1, FinAgent’s decision to BUY is informed by a detailed analysis of market intelligence that points to a positive long-term outlook for Alphabet Inc. This example highlights FinAgent’s ability to integrate diverse sources of market intelligence, including sector-specific developments in cloud and AI, and investor sentiment, into its decision-making process. It reflects a strategic consideration of both current market conditions and future growth prospects, showcasing the importance of acting on bullish signals when the overall market sentiment and trend analysis suggest potential for appreciation.
Example 2 presents a scenario where FinAgent opts for a SELL decision, emphasizing risk management and liquidity considerations. The reasoning behind the sell decision illustrates FinAgent’s capacity to preemptively navigate potential market downturns or corrections by capitalizing on current stock values. This decision is particularly noteworthy for its forward-looking nature, aiming to secure profits and improve liquidity in anticipation of future market uncertainties. It demonstrates FinAgent’s adaptability and its ability to incorporate reflections on past trading strategies to avoid missing optimal selling points, underscoring a proactive approach to risk management.
In Example 3, the decision to BUY despite short-term challenges, based on the strength of long-term opportunities, particularly advancements in AI and regulatory relaxations, showcases FinAgent’s strategic foresight. This example illustrates how FinAgent leverages comprehensive market analysis to identify and act on long-term growth prospects, even in the face of temporary market downturns. The ample cash reserve facilitates this decision, highlighting the importance of financial flexibility in capitalizing on strategic buying opportunities.
Collectively, these examples demonstrate FinAgent’s strengths in leveraging detailed market analysis, integrating short and long-term market trends, managing risks proactively, and maintaining financial flexibility to make informed trading decisions. FinAgent is characterized by a balance of strategic foresight, adaptability, and a disciplined consideration of past trading reflections, positioning it to capitalize on market opportunities while navigating potential risks effectively.
I.3. Case Study III
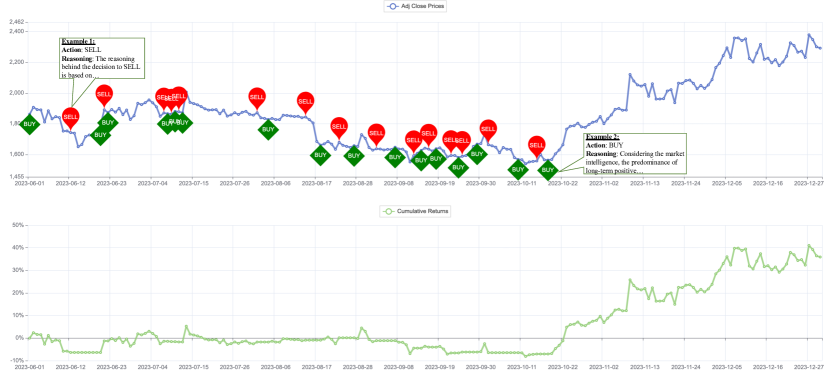
Example 1
Example 2
The decision-making capabilities of FinAgent, as illustrated through examples, reveal a sophisticated blend of strategic insight and analytical depth in navigating the cryptocurrency market. This approach leverages comprehensive market analysis, integrating market intelligence, historical trends, and technical indicators like the Moving Average (MA5) and Bollinger Bands, to inform its trading decisions.
Example 1 showcases FinAgent’s methodical use of data to make a SELL decision on the ETHUSD pair, reflecting a commitment to capital protection and risk management amidst negative market trends. This demonstrates FinAgent’s strength in crafting informed strategies that prioritize long-term capital security over short-term gains, illustrating a prudent approach to trading in volatile markets.
Example 2 illustrates the proactive side of FinAgent, where a BUY decision is made based on a positive market outlook. This decision, supported by solid technical analysis and sufficient liquidity, shows FinAgent’s ability to seize market opportunities, highlighting its adaptability and aggressive strategy to leverage potential market upswings for significant gains.
FinAgent’s strategic and analytical framework, as evidenced by these examples, effectively balances risk and reward, demonstrating a nuanced understanding of the cryptocurrency market’s complexities. The methodical integration of diverse data points into coherent trading strategies underscores FinAgent’s capability to navigate market dynamics adeptly.
While the cryptocurrency market’s inherent volatility poses challenges, FinAgent’s approach exhibits a level of resilience. The firm’s strategic decisions, though cautious, are not overly conservative but are designed to adapt to market conditions, seeking to optimize outcomes within the realm of calculated risk. Moving forward, refining analytical models and strategies to further align with the unpredictable nature of cryptocurrencies remains an area for gradual enhancement. By continuing to evolve its decision-making framework, FinAgent aims to maintain its strategic edge while mitigating the impacts of market volatility, positioning it well for sustained success in the dynamic landscape of cryptocurrency trading.
Appendix J Details of Benchmark Analysis
J.1. Analysis of Rule-based Strategies for Trading
We examine four fundamental rule-based strategies using technical indicators, chosen for their broad coverage of market scenarios and strategic diversity in trading. Moving Average Convergence Divergence (MACD) and stochastic oscillators combined with Bollinger Bands represent trend-following methods fundamental to capturing market momentum. In contrast, KDJ with RSI Filter and Z-score Mean Reversion offer insights into potential market reversals, crucial for risk management and exploiting countertrend opportunities. Together, these strategies encompass a wide spectrum of trading situations, from following prevailing trends to identifying reversal points, thereby providing a comprehensive decision-making toolkit. To set a benchmark, these strategies use the same market state and trading environment as other RL benchmark methods. In the training stage, we applied OPTUNA for hyperparameter optimization to adapt them to the financial instrument traded.
J.1.1. Moving Average Convergence Divergence (MACD) Crossover Strategy.
This strategy utilizes MACD indicators for trend-following, generating buy/sell signals based on bullish or bearish momentum shifts, making it suitable for moderate-risk traders favoring clear market trends.
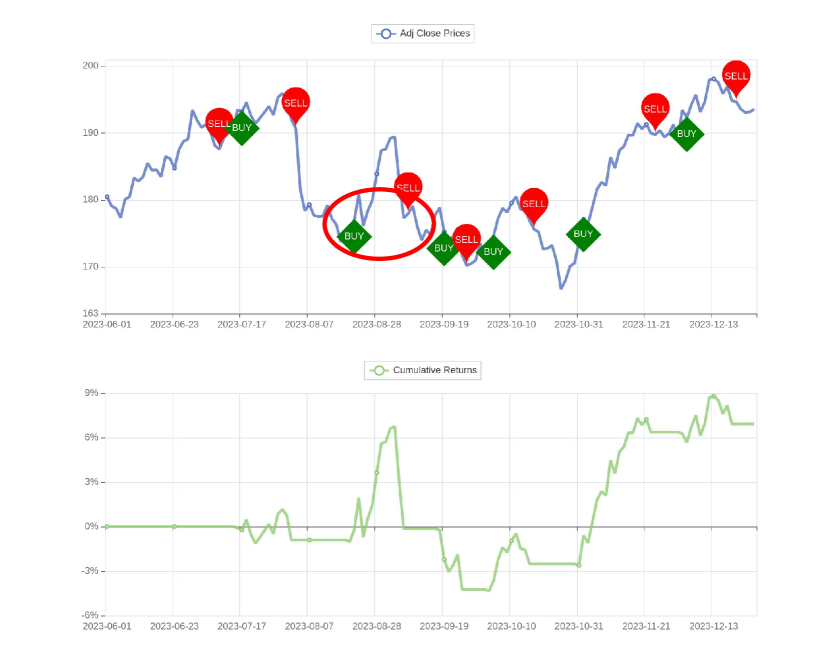
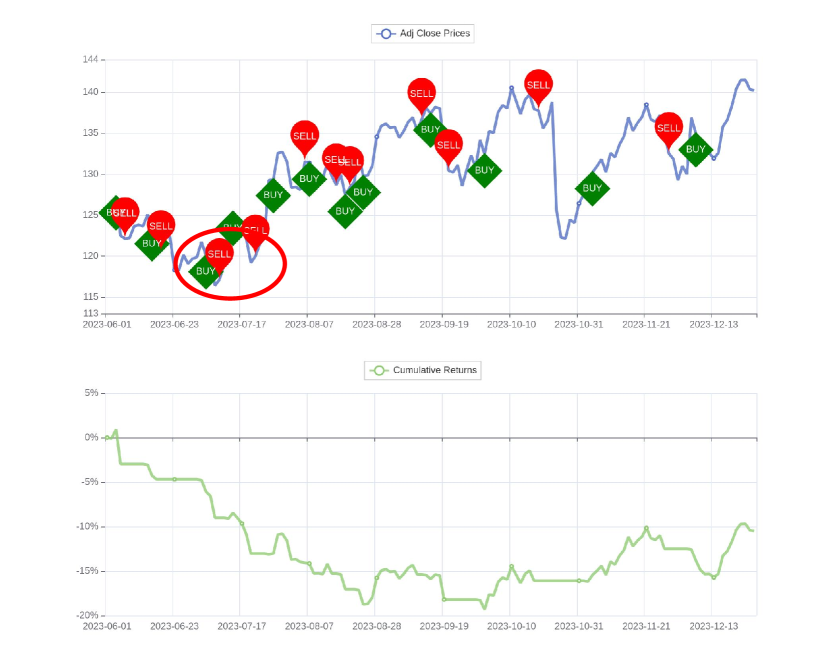
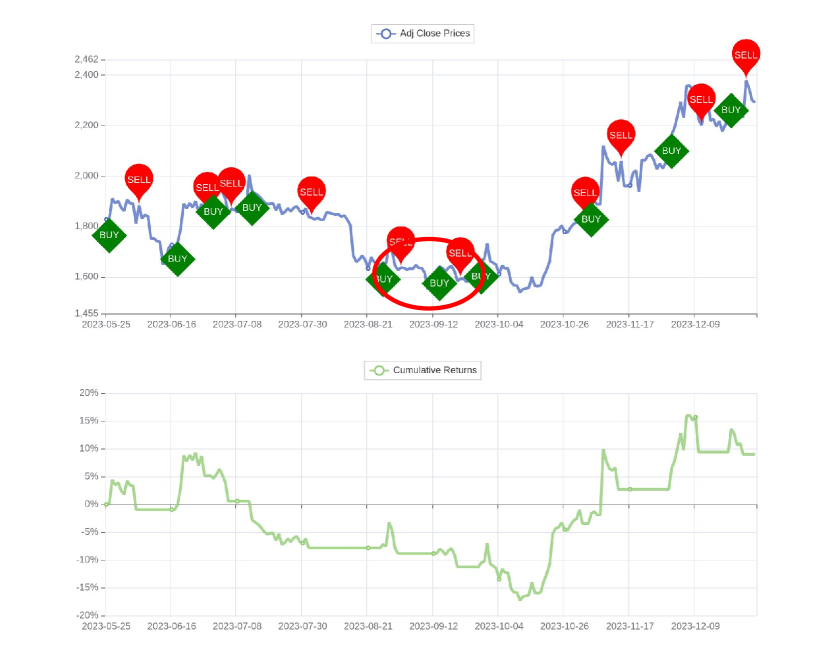
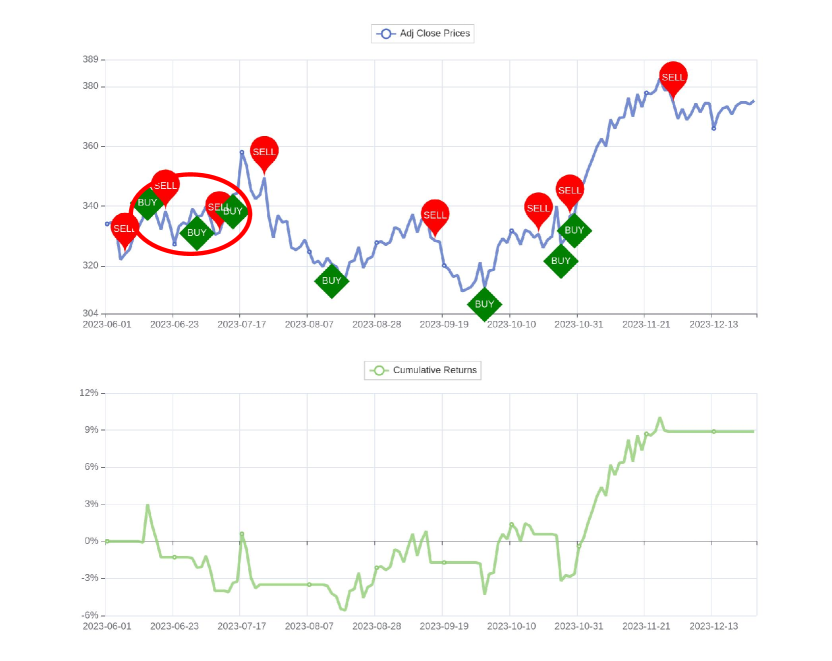
Limitation 1: Sub-optimal position-changing points. The MACD strategy often exhibits delayed reactions to market changes, leading to sub-optimal position-changing points. This lag is particularly pronounced in fast-moving or volatile markets. For example, in the case of stocks like AAPL as marked in Fig. 11, where market dynamics can shift rapidly, the MACD might signal a buy or sell too late, thereby missing the optimal entry or exit points. This limitation is intrinsic to the MACD’s reliance on historical moving averages, making it less effective in markets that experience quick reversals or where the trend direction changes frequently.
Limitation 2: Incapability of handling volatility. The MACD strategy struggles in highly volatile markets due to its dependency on moving averages, which may not accurately reflect current market conditions under such circumstances. In volatile trading environments like the marked period in Fig.11, the MACD can generate misleading signals, leading to a series of unprofitable trades. The standard signal thresholds of MACD may not be adaptable enough for all market conditions, particularly in volatile settings. This limitation underscores the need for a more dynamic approach, possibly integrating adaptive thresholds that account for the prevailing market volatility.
Limitation 3: High turnover rate results in high transaction fee. A significant drawback of the MACD strategy is its tendency to generate a high turnover rate, as shown in the marked periods of Fig.13 and Fig.13, leading to substantial transaction costs. In financial markets where transaction fees are considerable, like the stock market, frequent trading by MACD can significantly lower profit margins.
J.1.2. KDJ&RSI Strategy.
This strategy merges the KDJ stochastic oscillator and RSI to identify overbought or oversold conditions, issuing buy or sell signals based on momentum and RSI thresholds, ideal for risk-averse traders preferring extreme market conditions.
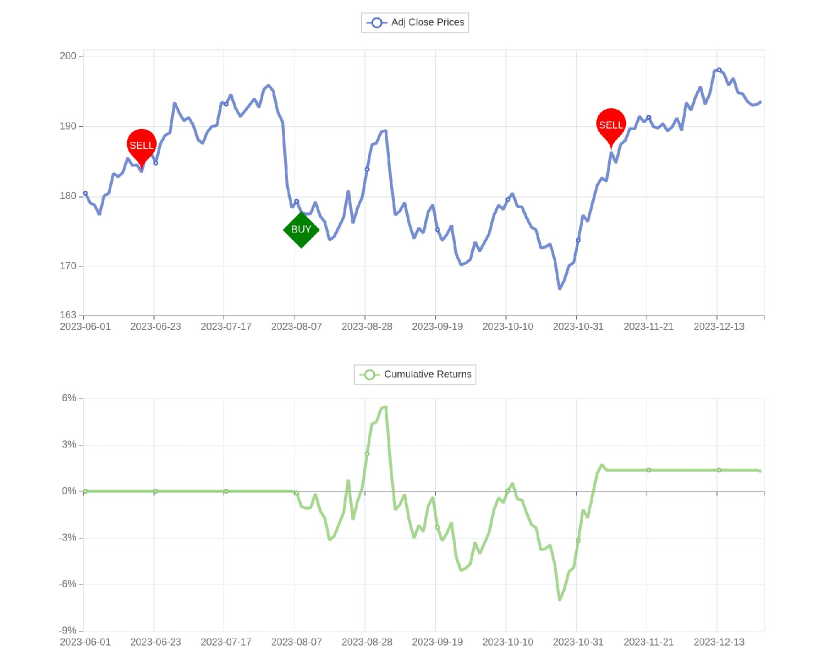
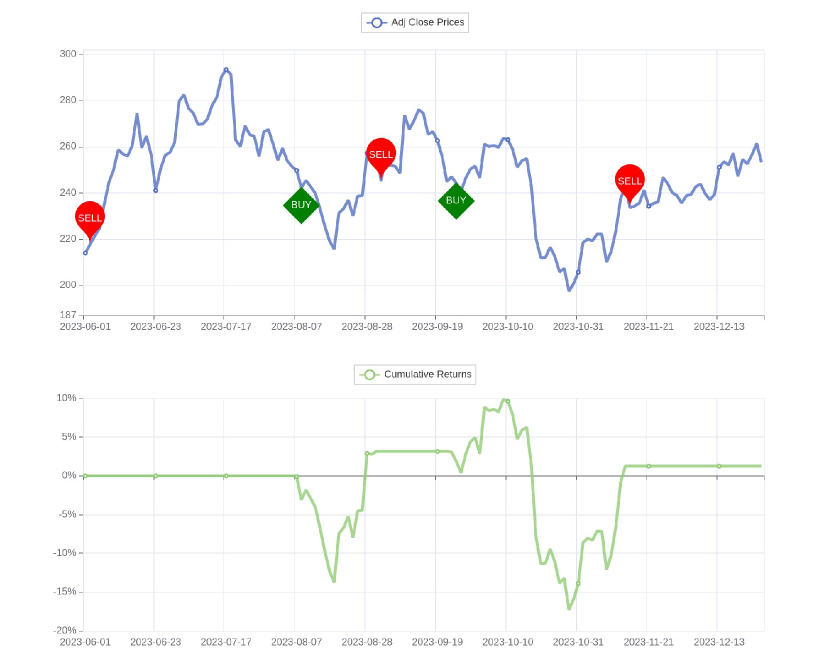
Limitation 1: Lack of generalization ability. The KDJ&RSI strategy, while useful in certain market conditions, is not a universally applicable strategy. It lacks generalization across different market environments due to its sensitivity to specific parameters and market trends. This means that its performance can vary greatly between different stocks. Despite the hyper-partmeters are trained with historical data, it is still not able to get profitable results on some instruments as shown in Fig. 15, 15.
J.1.3. Z-score Mean Reversion.
This strategy employs z-score mean reversion, generating buy or sell signals when prices deviate significantly from the mean, making it suitable for risk-averse traders who capitalize on price normalization.
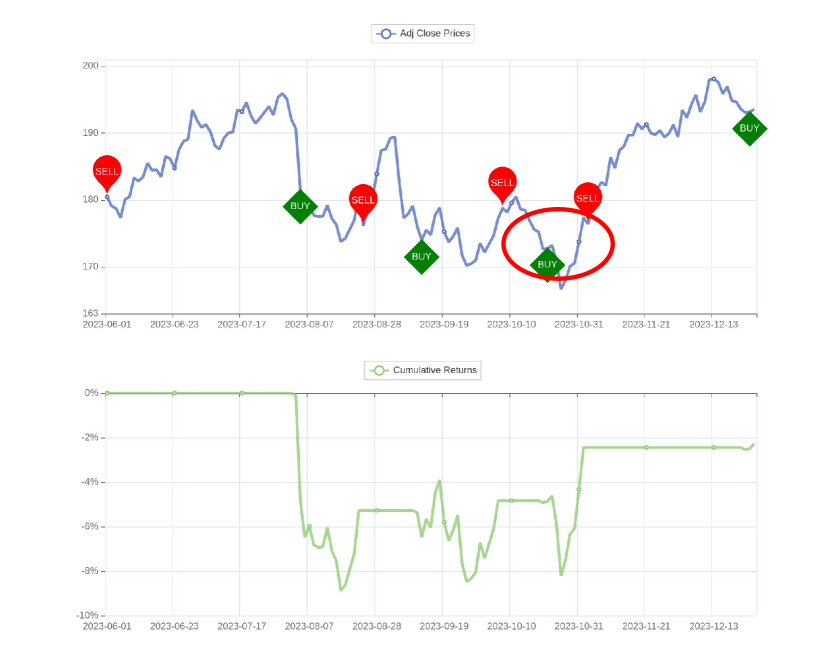
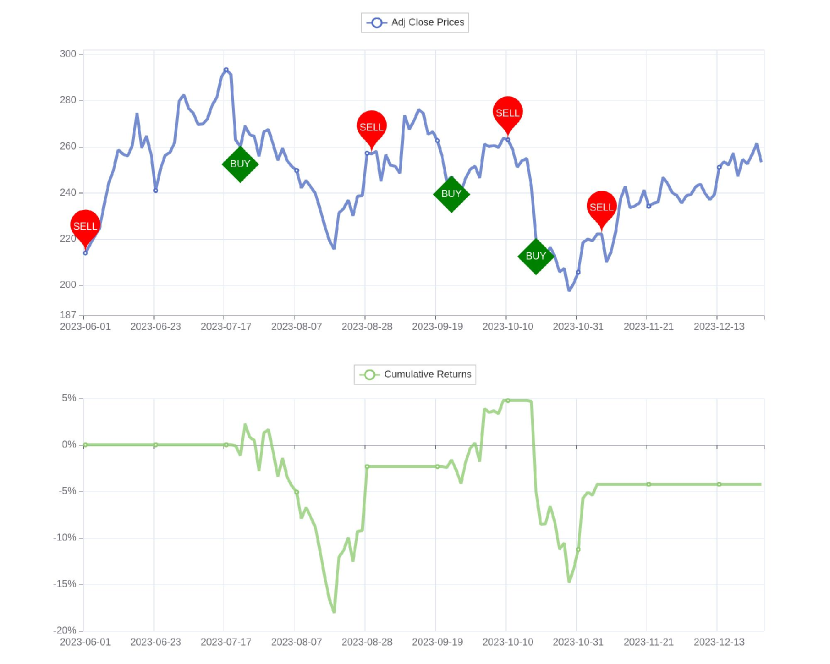
Limitation 1: Sub-optimal decision due to insensitivity to market trend. The ZMR trading strategy, while adept at capturing dramatic shifts in market patterns, often exhibits a notable insensitivity to more stable, long-term market trends. This limitation becomes particularly apparent in its tendency to make sub-optimal trading decisions during periods of gradual market changes. A clear example of this can be observed in the trading behavior of AAPL, as depicted in the marked period of Fig. 17. The strategy decided to sell after the price met the reverting point, missing the bullish trend afterward. The strategy’s focus on mean reversion overlooks the significance of persistent trend movements, leading to sub-optimal trading outcomes.
Limitation 2: Poor performance in non-mean-reverting Market conditions. A significant limitation of the z-score mean-reversion trading strategy is its poor performance in market conditions that do not exhibit mean-reverting behavior. The strategy inherently assumes that stock prices will revert to their historical mean, which is often not the case in trending or momentum-driven markets. In such environments, where prices consistently move in one direction without reverting, the mean-reversion strategy can result in sustained losses. This is particularly evident in strongly bullish or bearish markets, where the strategy may continuously take counter-trend positions, leading to adverse trading outcomes. The inability of the mean-reversion strategy to adapt to non-mean-reverting market conditions highlights its lack of versatility and the potential risk of relying solely on historical mean-reversion patterns. This is evident by the trading decisions in TSLA as shown in Fig. 17 .
J.2. Analysis of Using FinAgent as a router for technical indicators-driven strategies for trading.
We examined the potential of FinAgent to function as decision-making routers within a Mixture-of-Experts (MoE) framework of trading strategies. This experiment setting only utilized the decision module of FinAgent, intentionally excluding components such as market intelligence, memory, and reflection modules. This exclusion eliminates the necessity for a training phase for FinAgent. The strategies implemented in this research have undergone fine-tuning using Optuna on a designated training dataset. Each strategy’s effectiveness is meticulously documented and provided to the LLM, enabling it to make informed decisions based on the detailed performance data.
According to the numerical data presented in Table 4, the FinAgent router, while not always achieving the optimal strategy outcome, consistently delivers robust and positive trading results. This observation is further substantiated by the analysis of trading behavior across various assets, which exhibits less extreme behavior than using a single trading strategy. This suggests that the FinAgent router is capable of adapting its decision-making process to various market conditions. Although there is an improvement compared to employing single trading strategies, we have also identified certain limitations. These limitations are further addressed by other modules within the FinAgent system.
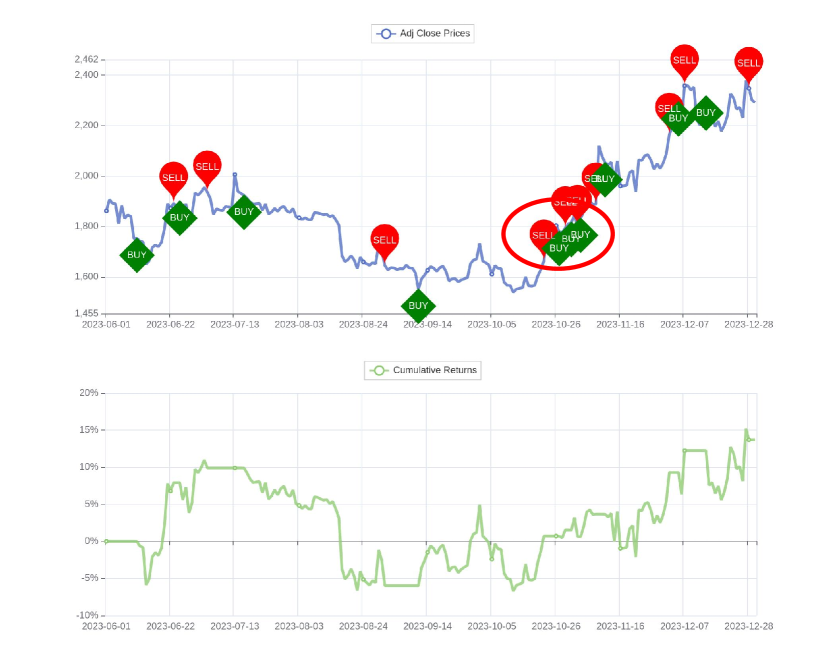
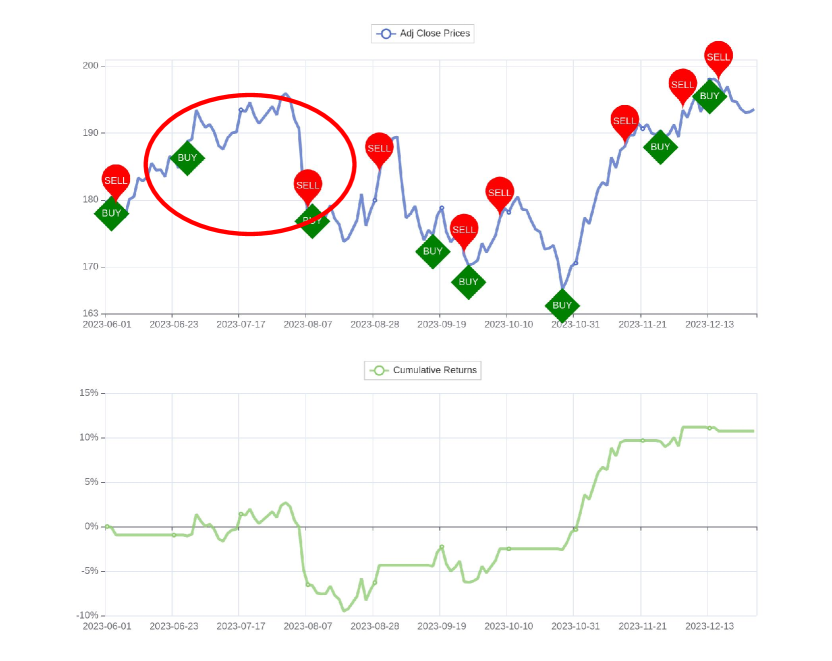
Limitation 1: Gap in using multiple strategies to make a single decision In the role of a router, FinAgent demonstrates variable preferences for strategy decisions at each stage. This variability introduces a potential risk of unprofitable trading in such sequential decision-making scenarios, as each strategy operates based on unique assumptions. For instance, consider the period highlighted in Fig. 19. Within this short timeframe, multiple buy and sell decisions are executed. The buy decisions are mostly influenced by the KDJ&RSI and SO&BB strategies, which signal a buying opportunity. On the other hand, the sell decisions are primarily guided by the ZMR strategy, which indicates a strong sell signal during the same period.
Limitation 2: Limited performance with weak strategies. The router’s performance is constrained by the effectiveness of the underlying strategies. This limitation becomes evident in scenarios where all strategies demonstrate weak performance. An example of this can be observed during the period marked in Fig. 19. As illustrated in Fig. 11, Fig. 15, and Fig. 17, none of the strategies managed to generate a profit during this period. In the absence of other FinAgent modules, such as reflection, the decision-making capability of the router is limited.
Limitation 3: Result is sensitive to prompt engineering and randomness. In our experiments, we observed a distinct variation in the trading decisions when modifying the decision prompt and executing the agent across different trials. Owing to the inherent nature of the API service provided by OpenAI, controlling the randomness in the responses is not feasible. This limitation adds to the risk factor when relying solely on the decision module in FinAgent for robustness.
J.3. Analysis of RL for Trading
Reinforcement learning has been applied to trading with varying degrees of success. Traditional algorithms like PPO (Proximal Policy Optimization), DQN(Deep Q-learning), and SAC(Soft Actor-Critic) have shown potential but also limitations in stock prediction accuracy and practicality due to large data requirements. To set a benchmark, these algorithms are trained in uniform conditions and same dataset, using OPTUNA for hyperparameter optimization, to explore their effectiveness in trading and provide insights into their applicability and optimization for investment decision-making.
J.3.1. Analysis of PPO for trading
The Proximal Policy Optimization (PPO) model, when applied to stock trading, exhibits notable drawbacks that can impact its overall performance. One significant limitation is the tendency for the model to remain idle for extended periods. This proclivity for inactivity stems from the algorithm’s cautious learning process, prioritizing risk avoidance over seeking potential gains. Consequently, during these prolonged idle phases, the model may miss lucrative trading opportunities, leading to suboptimal returns. This issue becomes particularly pronounced in dynamic and rapidly changing stock market conditions, where the hesitancy of the PPO model may hinder its ability to capitalize on favorable market movements. The model’s conservative nature becomes particularly evident in Figure 21, where it remains idle even as the cumulative return drops below 0, highlighting its reluctance to capitalize on favourable market movements. This limitation underscores the need to refine the PPO algorithm to balance risk management better and seize profitable opportunities in dynamic market environments.
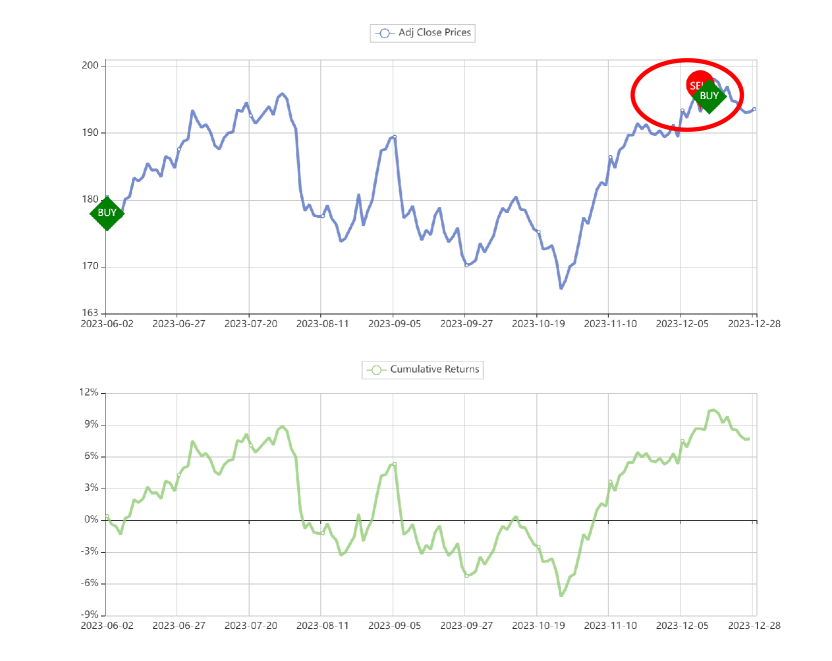
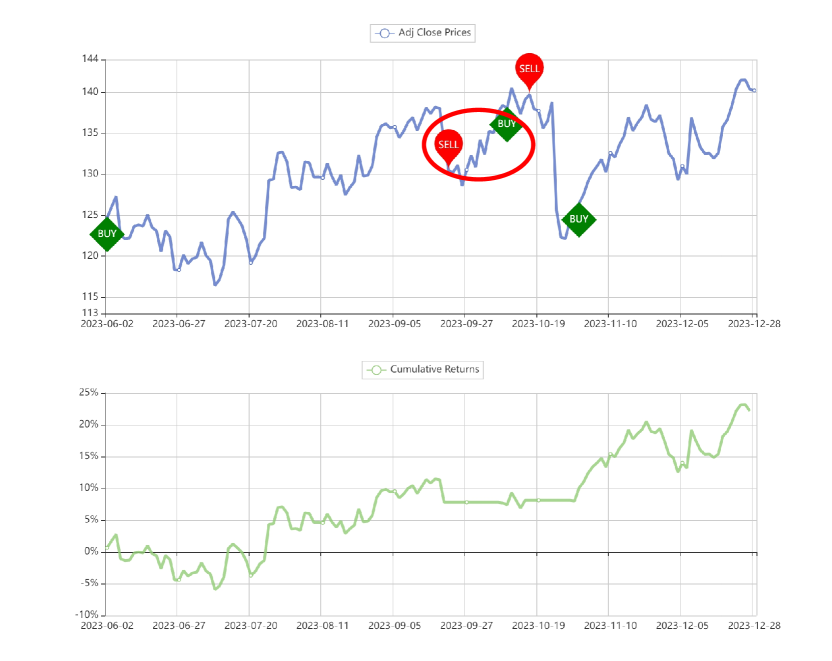
Another drawback associated with PPO in stock trading lies in its challenge to achieve optimal timing for buying and selling. The model may encounter difficulties in accurately predicting short-term price movements, resulting in purchasing stocks at relatively high prices or missing opportunities to buy at lower prices. This suboptimal timing can directly impact the model’s overall performance, leading to lower returns and less effective utilization of available capital. The inherent uncertainty and volatility of stock markets pose challenges for PPO models to consistently make well-timed decisions, highlighting the complexity of accurately forecasting market movements. Figure 21 exemplifies this issue, where the model fails to capture the low-value on September 27, 2023, resulting in a decision to buy at a relatively high price and subsequently leading to suboptimal income. This highlights the need for improved timing mechanisms within the PPO algorithm to enhance its effectiveness in navigating the uncertainties of stock markets.
To address these drawbacks, it becomes imperative to fine-tune the model parameters and optimize the training process. Additionally, augmenting the PPO model with complementary techniques or incorporating more sophisticated features, such as sentiment analysis and macroeconomic indicators, can enhance its decision-making capabilities. Regular monitoring and adjustments are crucial to adapting the model to changing market conditions, mitigating the impact of extended idle periods, and improving its ability to time trades effectively. By embracing a holistic approach that combines machine learning with domain expertise, one can work towards overcoming these limitations and developing a more robust and adaptive stock trading algorithm.
J.3.2. Analysis of DQN Algorithm for Stock Trading
Though the implementation of the Deep Q-Network (DQN) algorithm in stock trading can yield relatively positive results in the long term, its effectiveness in navigating market complexities has shown limitations.
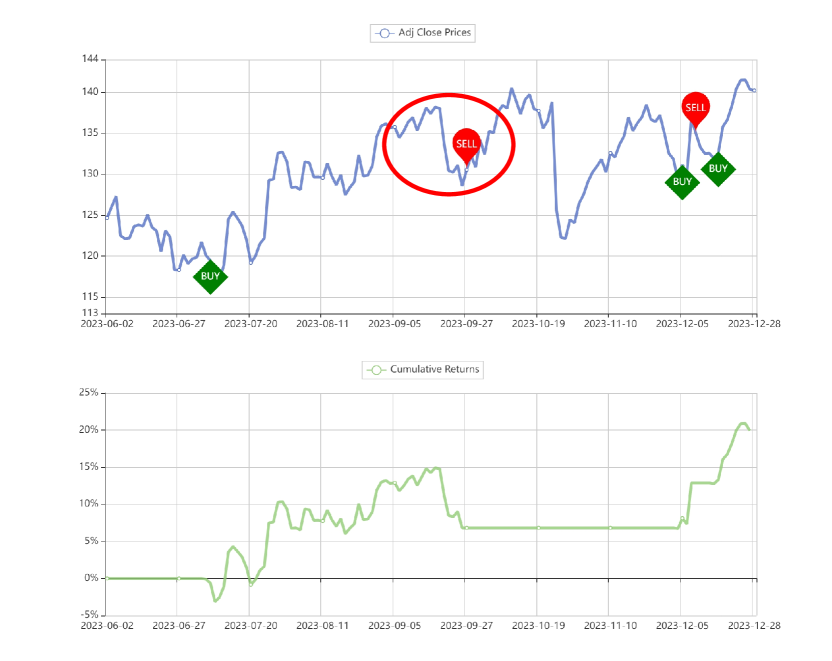
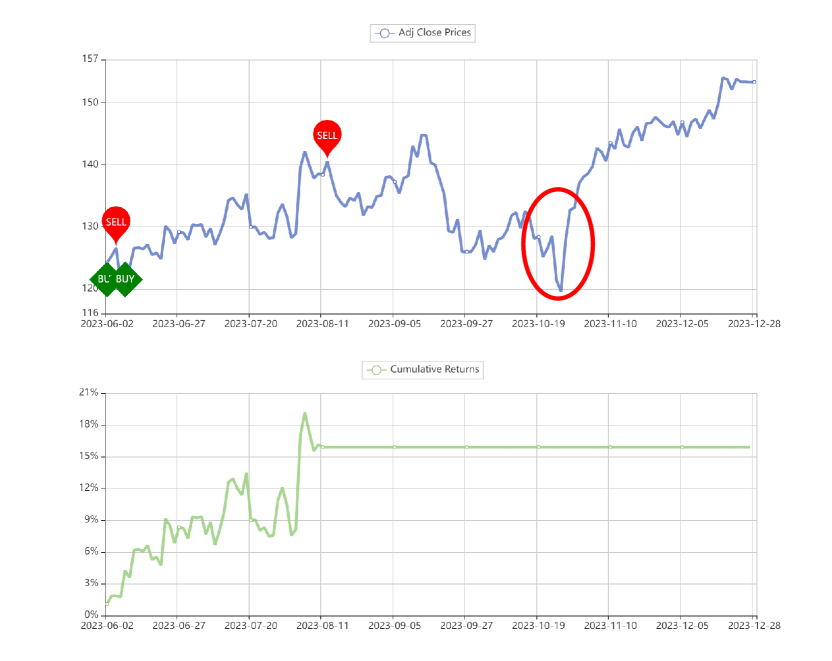
One primary drawback of the DQN algorithm is its inability to balance risk and reward effectively. It often adopts a conservative stance, potentially leading to missed opportunities for significant gains during bullish market phases. Conversely, in bearish conditions, the model’s failure to swiftly adjust its strategy can result in prolonged holding of depreciating assets, exacerbating losses. This is evident in FigureLABEL:fig:_DQN_GOOGL, where the model fails to capture the high-value point, selling at a lower price on a later day, September 27, 2023, and missing the chance for better earnings. Additionally, it takes no action and remains in a zero position during the bullish phase from October 26, 2023, to November 23, 2023, missing this period of increase. A similar issue occurs in the implementation of AMZN, missing the bullish phase from October 23, 2023, to December 2023.
Another drawback of DQN in this context is its susceptibility to market volatility and unpredictable nature, which can lead to suboptimal decision-making. This issue is particularly noticeable in Figure 27, where DQN’s performance in managing the ETHUSD asset demonstrates a pattern of delayed reactions, often lagging behind rapid market movements, especially from July 18, 2023, to August 15, 2023, during periods of extreme price fluctuations.
To address these challenges, it is crucial to refine the DQN algorithm by incorporating advanced features, such as sophisticated market indicators, real-time data analysis, and diverse market data. Enhancing the algorithm’s sensitivity to market dynamics and integrating effective risk management strategies can improve its decision-making quality. Regular updates of the model with current market data and trends are essential to maintain its relevance and accuracy in a rapidly changing financial landscape.
J.3.3. Analysis of SAC Algorithm for Stock Trading
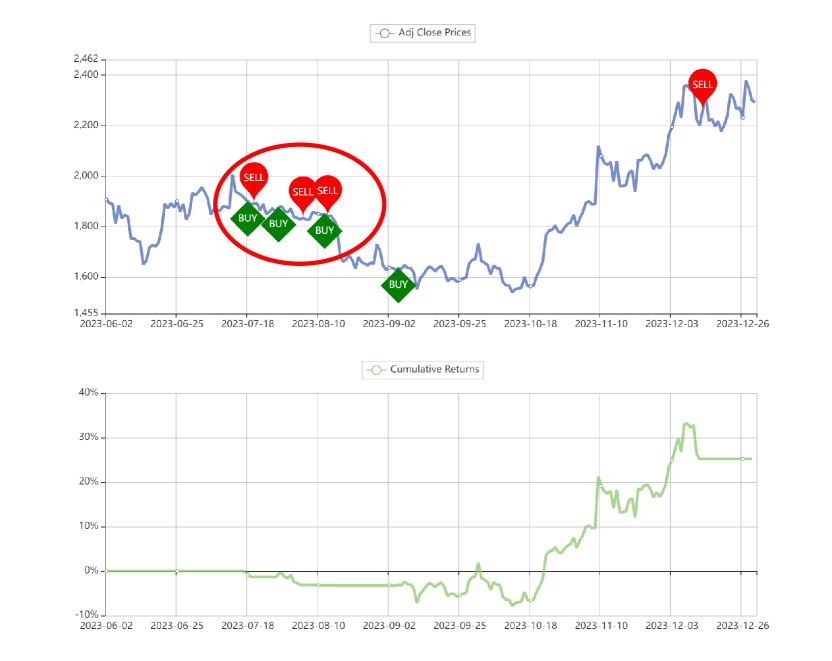
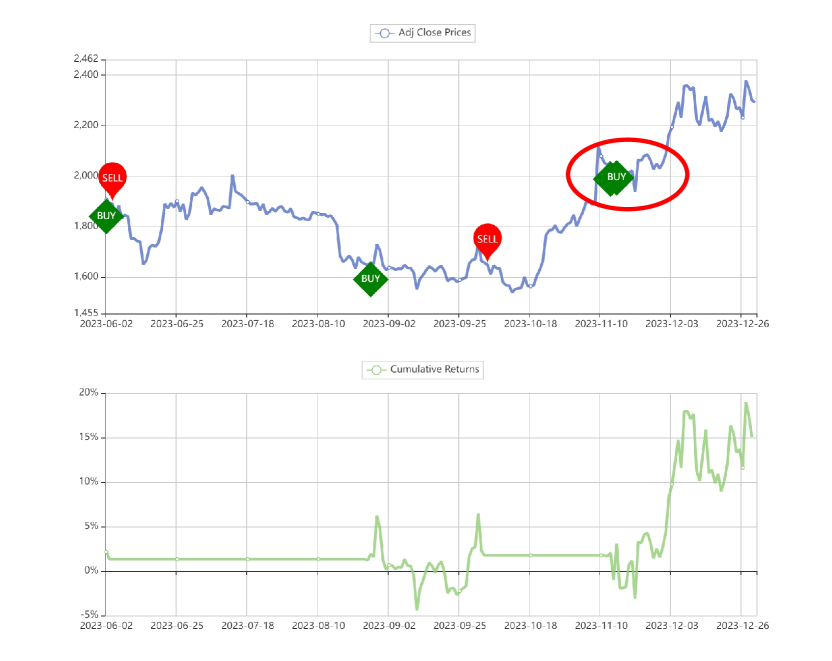
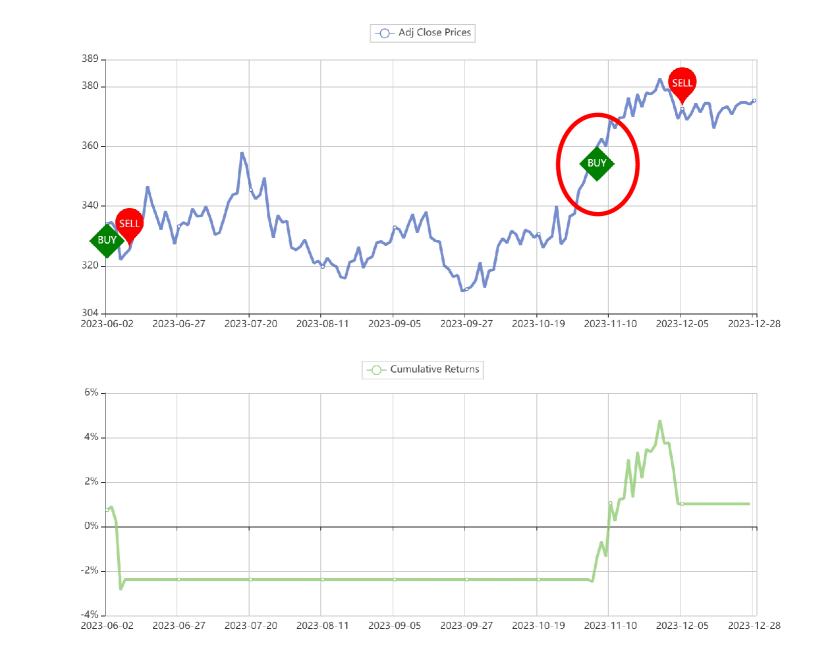
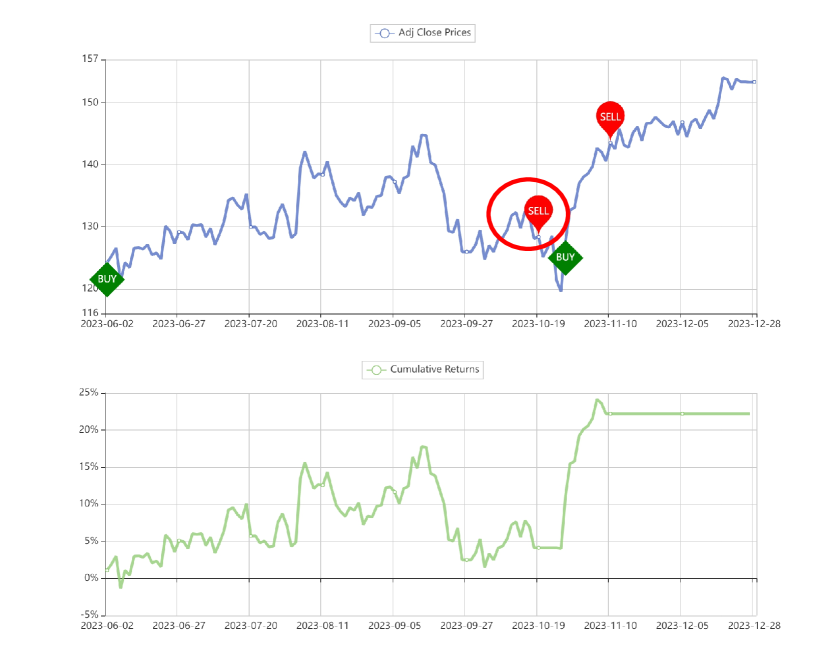
The Soft Actor-Critic (SAC) algorithm, when applied to stock trading, demonstrates certain strengths but also faces challenges that limit its performance. The introduction of entropy regularization enables the agent to better explore unknown states, learning to formulate strategies through interaction with the environment in order to maximize the expected cumulative reward. However, it still encounters difficulties when dealing with the intricacies of the stock market.
One limitation observed in the implementation of SAC is its handling of market ·volatility, especially in high-fluctuation environments like cryptocurrency trading. For instance, when trade on Ethereum (ETHUSD), as depicted in Figure 27, SAC tends to be overly cautious. It performed two buy actions around Nov 15, 2023, during a bullish phase. These decisions were made over a relatively long-term observation, which led to missed opportunities during significant market movements. This conservative approach, though avoiding potential losses, can result in the model not fully capitalizing on the profitable market trends.
Similarly, in the stock market, SAC’s performance varies based on the specific characteristics of each stock. For example, with Microsoft (MSFT) and Amazon (AMZN), depicted in Figures 27 and 27, SAC struggles to optimally time its entry and exit points. For AMAZ, it sold the holding stocks on October 19, 2023, missing several peaks and losing potential higher returns. For MSFT, it performed sold operations on November 10, 2023, when the bullish market trend still went on. Both late responses to market uptrends and premature exits from profitable positions affect the overall return on trading.
In summary, while SAC offers a robust framework for reinforcement learning tasks, its application in the dynamic and volatile stock requires careful tuning and enhancement to better leverage its capabilities.
J.4. Analysis of FinGPT for Trading
FinGPT’s performance in predicting stock prices has exhibited several significant flaws, highlighting critical limitations in its ability to provide reliable insights for investment decisions.
Limitation 1: Failure to capitalize on peak price opportunities. During a specific period, FinGPT missed the chance to sell the stock at its zenith, opting instead to hold onto it. Unfortunately, this strategy proved detrimental as the stock’s value plummeted below the initial purchase price, leading to avoidable financial losses. This reveals a deficiency in FinGPT’s adaptive decision-making, as it neglected to adjust its strategy despite the clear opportunity to maximize returns. For example, on July 10, 2023, FinGPT made a buy action for MSFT at a price of $330.46. Despite reaching a peak price of $358 on July 18, 2023, FinGPT continued to hold the stock, ultimately making a misprediction about a further increase. The reasoning behind this misprediction involved positive developments, market conditions, and the anticipation of strong earnings. However, the model failed to adjust its strategy and sold the stock at a lower price of $336.37 on July 26, 2023, resulting in a significant loss as shown in Figure 31.
Limitation 2: Wrong prediction for a sharp price drop. Another noted pattern of inaccurate predictions by FinGPT in stock market forecasting raises serious concerns about its reliability as a tool for investment guidance. The model’s propensity to erroneously predict increases in stock prices, leading to unexpected downturns, suggests a fundamental flaw in its predictive capabilities, rendering it unsuitable for investors seeking profitable opportunities.
A glaring example of FinGPT’s failure in predictive accuracy occurred in its handling of TSLA (Tesla) stocks on October 8, 2023. The model recommended purchasing TSLA stocks at a specific price of $245.34, operating under the assumption that the stock would subsequently experience an upward trajectory. However, this prediction proved grossly inaccurate, as the stock value deviated significantly from the forecasted trajectory, plummeting to $215.49 by August 18, 2023. Figure 31 shows the details of this failure.
This significant misalignment between FinGPT’s predictions and the actual market trajectory exposed its limitation in adapting to dynamic conditions and eroded the confidence of investors who relied on its recommendations. The incident highlights the imperative need for continuous improvement in FinGPT’s algorithms to enhance its predictive accuracy, ensuring investors receive more reliable guidance in fluctuating financial landscapes.
The inability of FinGPT to accurately anticipate the dynamic nature of financial markets emphasizes the critical need for refining its predictive algorithms. This refinement is crucial to ensure a more nuanced and accurate understanding of market dynamics, ultimately enhancing the model’s reliability as a tool for investment guidance. The incident with TSLA is a compelling example of the imperative nature of continuous improvement in FinGPT’s capabilities to meet the demands of a rapidly changing and unpredictable financial landscape. Furthermore, this incident with TSLA serves as a poignant reminder of the evolving challenges within the financial landscape, necessitating ongoing efforts to fine-tune FinGPT’s algorithms.
Limitation 3: Wrong prediction for a stock price surge. Conversely, when FinGPT wrongly predicts a decrease in stock prices, it opts to sell, but the actual market behaviour contradicts its forecast by demonstrating a continued increase in stock value. This inconsistency in predicting market trends raises questions about the model’s effectiveness in providing actionable insights aligned with real-world financial dynamics. For example, on June 7, 2023, the model recommended selling AAPL stocks, forecasting a 1-2% decrease based on positive developments and potential concerns. The cited positive developments included the expected valuation of $4 trillion by 2025 and the successful launch of the Vision Pro. However, the market response contradicted FinGPT’s projection, as the stock price increased for three consecutive days, as shown in Figure 31. This highlights a substantial misalignment between the model’s analysis and the market dynamics, exposing a critical flaw in its ability to anticipate short-term stock movements accurately.
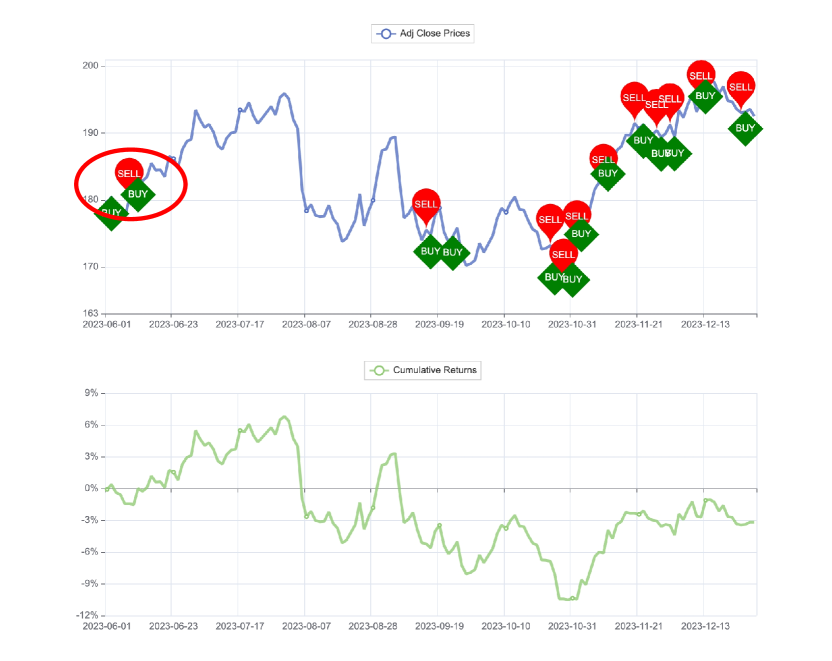
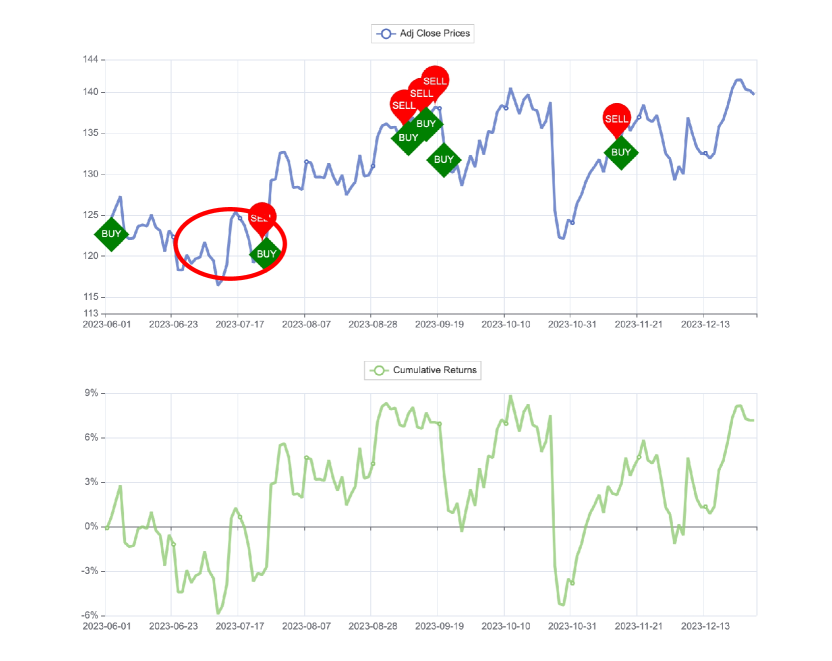
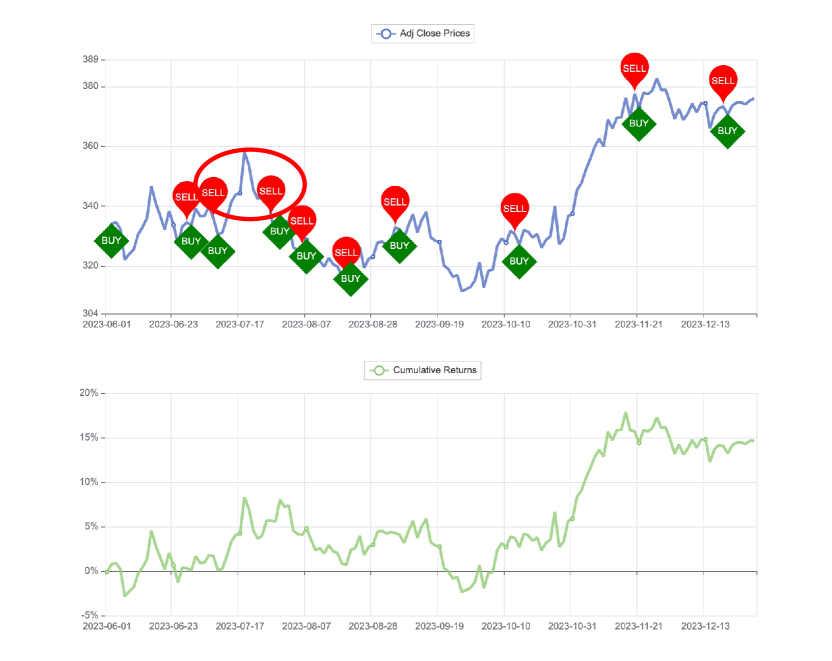
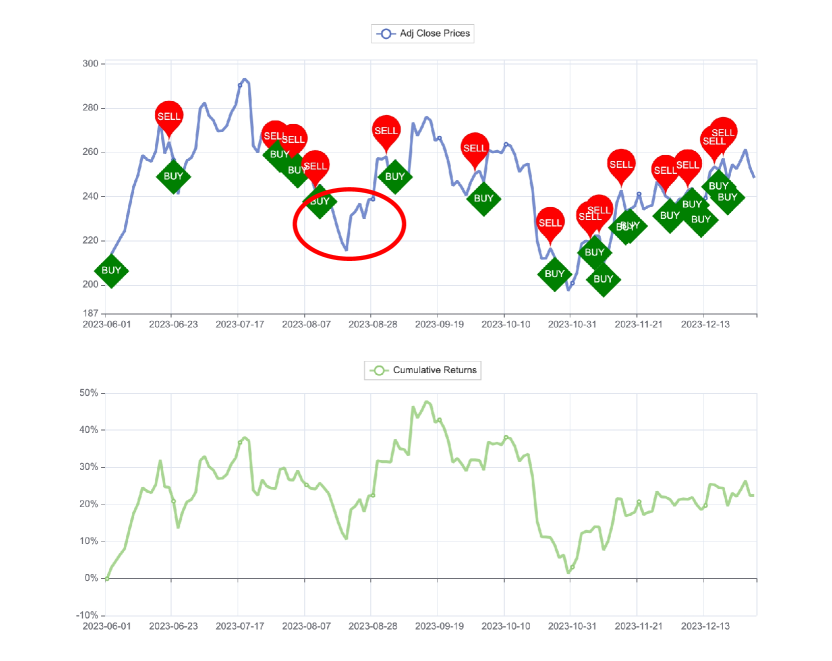
Limitation 4: Mismatch between the action and reasoning. The further drawback of FinGPT is its tendency to recommend continuous holding of stocks, even when successful price predictions are made. Despite accurately forecasting market movements, the model often fails to provide timely and proactive investment strategies. This inclination towards recommending a prolonged holding strategy may cause investors to miss out on valuable opportunities for profit maximization. For example, during the period spanning from June 6, 2023, to July 6, 2023, FinGPT showcased an impressive ability to predict all price changes for GOOGL accurately. However, a critical flaw emerged in its decision-making process, as the model consistently maintained the same investment action without adapting to the foreseen market dynamics. Despite believing that the stock was destined to experience a decline in the near future, as shown in Figure 31, FinGPT failed to promptly translate this insight into a strategic move such as selling the stock. This lack of agility in responding to its predictions represents a significant shortcoming. The essence of successful trading lies not only in the accurate anticipation of market trends but also in the timely execution of appropriate actions to capitalize on those predictions or, conversely, to mitigate potential losses. FinGPT’s inability to recalibrate its investment strategy when confronted with predicted downturns accentuates a key area where the model could significantly improve its decision-making capabilities. While the model excels in forecasting, integrating a more dynamic and proactive approach to trading would enhance its overall efficacy. Financial markets are renowned for their fluidity and susceptibility to rapid changes, making adaptability a crucial element for success. The failure to adjust to evolving conditions hampers the model’s ability to navigate market complexities and leads to missed opportunities to leverage favourable price fluctuations. This limitation underscores the critical necessity of incorporating a more responsive decision-making approach into FinGPT’s functionality. The dynamic nature of financial markets requires accurate predictions and the ability to interpret changing conditions swiftly and proactively, ensuring that FinGPT remains a valuable and reliable tool.
| Symbol | Date | Price Change | Action | Prediction |
| AMZN | 11/10 | -0.97 | HOLD | … increase by 0-1% … |
| AMZN | 14/10 | 3.21 | HOLD | … decrease by 0.5-1% … |
| AMZN | 15/10 | -2.6 | HOLD | … increase by 0-1% … |
Limitation 5: Meaningless prediction after consecutive failures. The last notable drawback of FinGPT is when FinGPT encounters three consecutive wrong predictions. In response, the model generates explanations that lack substance and offer little value to investors. These responses often involve generic statements, such as ”it’s difficult to predict the exact stock price movement,” accompanied by vague positive and negative factors. This tendency to provide meaningless responses further diminishes FinGPT’s credibility and utility in guiding investment decisions during challenging periods. For example, The prediction FinGPT made on November 16, 2023, for AMZN, after the wrong prediction from November 11, 2023, to November 15, 2023, as shown in Table 8, instead of providing a meaningful analysis or adjusting its approach, the model generated a generic response, acknowledging the difficulty of predicting stock movements and offering vague positive factors and potential concerns. This lack of nuanced reasoning and the provision of a seemingly irrelevant response indicates a weakness in the model’s ability to learn from its mistakes and adjust its predictions coherently.
J.5. Analysis of FinMem for Trading
FinMem primarily relies on layered memory to retrieve historical news and financial reports, and depends on the reflection mechanism to contemplate the potential connections between this information and future price movements. In this section, we conduct a detailed analysis of the decision-making results and reasoning provided by FinMem during the decision-making process.
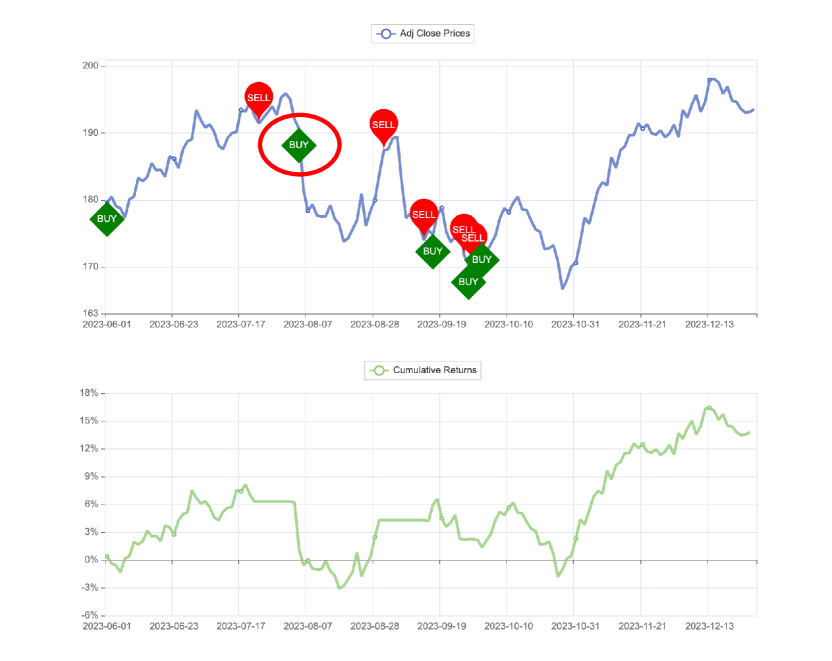
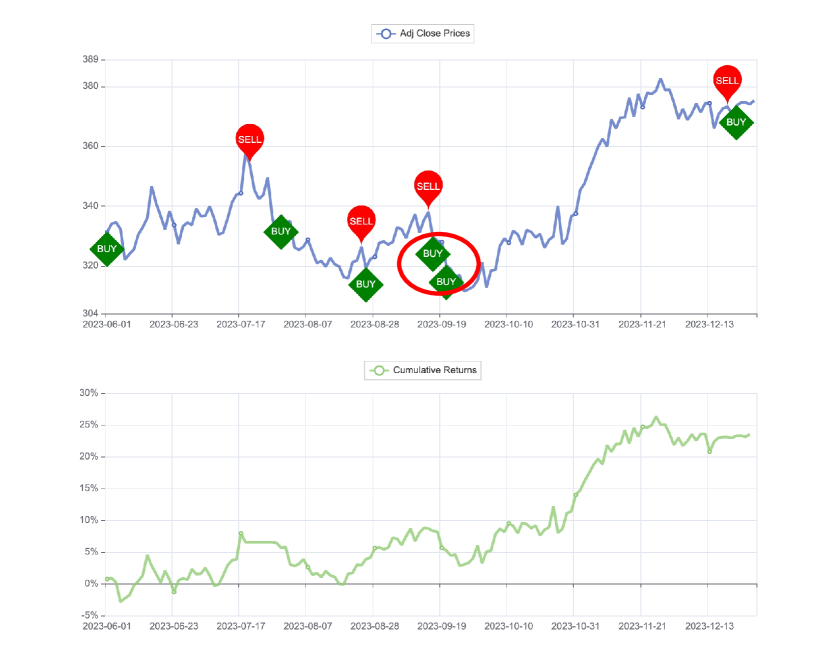
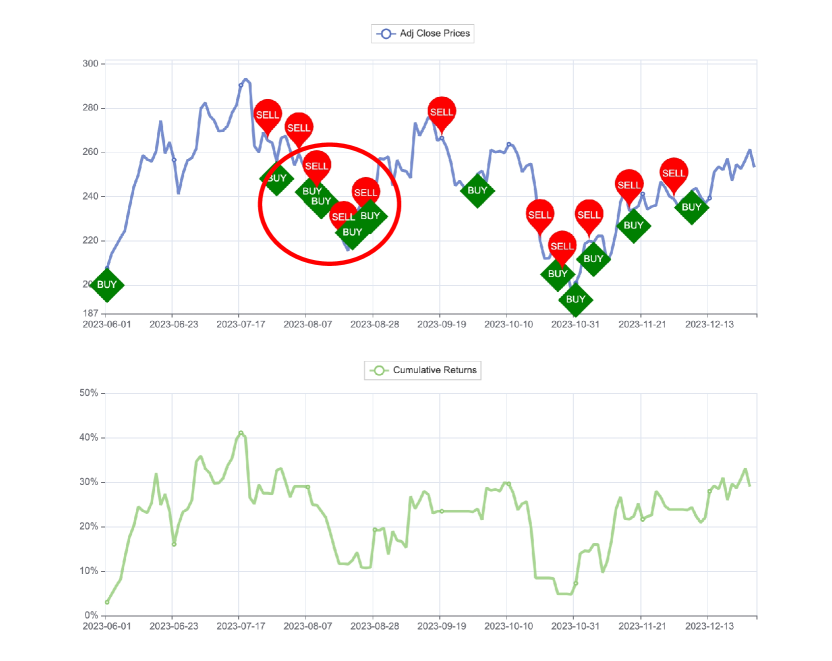
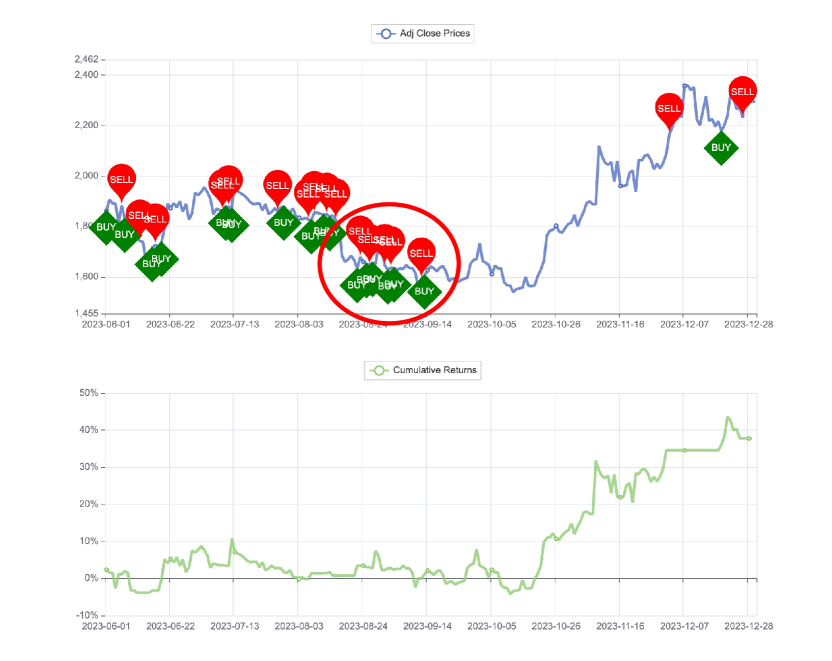
Limitation 1: Incorrect decision-making due to partially positive market news. The wrong buying decision was generated on 4 August 2023 as shown in Figure 35. The overall AAPL stock price from 1 August 2023 to 20 August 2023 was a continuous downward trend. On August 4, 2023, most of the news was negative for AAPL. For example, ”Huawei’s upgraded mobile operating system might intensify competition in the smartphone sector,” and ”Apple’s loss of $3T market value due to lower iPhone demand,” etc. There were only two pieces of positive news: ”Services revenue offsets iPhone sales drag in earnings report,” and ”Subscription-based business model indicates growth potential.” However, FinMem ignored the long-term downward trend and provided a buying rationale based on the belief that the earnings report and subscription-based business model could generate positive signals for stock price appreciation. This erroneous buying decision led to a shift in returns from 6% to -3%.
Limitation 2: The cash is insufficient for more shares but provides a buying decision result. As shown in the Figure 35, our setting is that buying means going all in, while selling means going all out. In the chart, it can be seen that there were two buying operations, and although the stock price declined, the remaining cash was not sufficient to support further buying. FinMem lacks a clear understanding of the environment and its own current situation, which could lead to decisions that contradict reality. In FinAgent, we have a specially designed state description iframe module to avoid this situation.
Limitation 3: Unstable decision-making. FinMem’s decisions are unstable, as shown in Figure 35 and 35, where FinMem made numerous buy-then-sell and sell-then-buy operations. Although in a stable market with minor price fluctuations, this would not significantly impact the return rate, in a highly volatile market, a single unstable operation could lead to substantial losses. We analyze the main reasons for this phenomenon from two aspects. First, market information is complex and often contains both positive and negative news, making it difficult to clearly determine what causes stock price fluctuations. Second, FinMem is unable to perceive the historical record of past decisions. It cannot clearly identify the historical conditions of the current choice of decision, leading to unstable decision-making.