Phase transitions of under laser shock compression
Abstract
We present in-situ x-ray diffraction and velocity measurements of under laser shock compression at pressures between 38-116 GPa. None of the phases reported by static compression studies were observed. Instead, we observed an isostructural phase transition from - to a new - phase at a pressure of 50-62 GPa. The - phase differs from - by an 11% volume drop and a different unit cell compressibility. We further observed a two-wave structure in the velocity profile, which can be related to an intermediate regime where both and phases coexist. Density functional theory calculations with a Hubbard parameter indicate that the observed unit cell volume drop can be associated with a spin transition following a magnetic collapse.
The phase diagrams of iron oxides are notoriously rich with a variety of electronic and structural transitions triggered by pressure or temperature. Due to its relevance to geophysical studies, has been extensively studied under static compression using Laser Heated Diamond Anvil Cells (LH-DAC), up to approximately 113 GPa and 2800 K [1, 2, 3]. A series of phase transitions were observed, as well as a possible breakdown of at high temperature into Fe25O32 and Fe5O7 [1]. Moreover, a Mott transition and a high-spin to low-spin transition have been evidenced at 50 GPa, although it remains unclear if structural transitions are triggered by the electronic transition or vice versa [4, 5, 6, 7]. The - phase () is stable up to 40 GPa. For this phase, a continuous decrease in the c/a ratio is observed with increasing pressure [8, 9, 10, 11, 12]. From 40 GPa to 47 GPa, the - phase (Rh2O3-II type structure, Pbcn orthorhombic) is observed [13, 1]. Above 54 GPa, the phase transforms into - phase (a distorted perovskite described in the monoclinic system [8]) stable up to 55 GPa. Above 50-60 GPa, the - phase transforms into - (Cmcm post-perovskite orthorhombic), while above 67 GPa the possibly metastable - (Aba2 orthorhombic), is also observed in a limited region between approximately 1000 and 2000 K [1].
The behaviour of under dynamic compression is less well understood and experimental results are scarce, largely due to the complexity of the target design. High-purity samples in LH-DAC experiments are usually powders [5, 6, 14, 2, 3] or grown single-crystals [1]. In contrast, dynamic compression measurement require bulk, high-purity and homogeneous samples. These are hard to find naturally with the required stoichiometry [15], but are also challenging to synthesize at the relatively large (mm) sizes needed in experiments [16]. Nevertheless, gas gun measurements have been performed up to around 140 GPa [17, 16] showing a significant volume drop of 10% at approximately 50 GPa, which may be indicative of a phase transition. Another study also reported a significant drop in resistivity at 44-52 GPa using a double-stage light-gas gun on large natural crystals [15]. However, the crystal structures of under dynamic shock compression remain unknown, and it is unclear how these relate to the flurry of phases observed under static compression. In this letter we present in-situ time-resolved x-ray diffraction measurements in shock-compressed using an x-ray Free Electron Laser (XFEL), at pressures between 38-122 GPa. Our results demonstrate that the behaviour of is indeed very different under dynamic compression: we observe none of the high-pressure phases seen statically, and instead find a single new isostructural phase transition around 50-62 GPa, which we link to the collapse in magnetic ordering.
The experiment was performed at the Matter in Extreme Condition (MEC) end station of the Linac Coherent Light Source (LCLS) [18]. The shock was driven by two synchronized nanosecond lasers (527 nm) incident on the target at an angle of 20 and with a spot size of 300 m. We used pulse durations of 5, 10 and 15 ns, with a maximum total energy of 60 J on target. In-situ x-ray diffraction (XRD) was performed using the x-ray beam operating in self-amplified spontaneous emission mode, with a photon energy of 7.08 keV, a spectral bandwidth of 25 eV, and pulse duration of 50 fs FWHM [19, 20]. The x-rays were focused onto the target at an angle of 35 with a spot size diameter of 60 m, overlapping the focal spot of the optical lasers to probe the planar shock front region. The diffraction signal was measured in transmission geometry on 4 quadruple ePix10k detectors. Azimuthal integration of 2D diffraction images was carried out including solid angle correction, Al filter correction, polarization, and self-attenuation from the target. When this was not possible, integration was performed using the Dioptas software, based on the PyFai library [21, 22], including solid angle correction and polarization. Two Velocity Interferometer System for Any Reflector (VISAR) [23] were used to retrieve the velocity history and the time when the shock left the sample. VISAR sensitivities were 4.5241 and 1.9890 km s-1 fringes-1, respectively, with acquisition time windows of 10 and 20 ns.
Two different target designs were used. The first consisted of 8 m of Fe2O3 deposited on 54 m of parylen-N. The second contained a 8 m layer of Fe2O3 sandwiched between a 22.1 m sapphire window on one side, and a 54 m layer of parylen-N on the other. A 200 nm aluminum flash coating was applied to the front face of all targets to minimize direct heating by the laser prepulse. The Fe2O3 was deposited via a physical vapor deposition process, leading to a polycrystalline structure of columnar crystallites with a preferential orientation along the -axis of the crystal, and perpendicular to the shock wave propagation given the geometry of our setup (for further details see Figs. S1-S8).
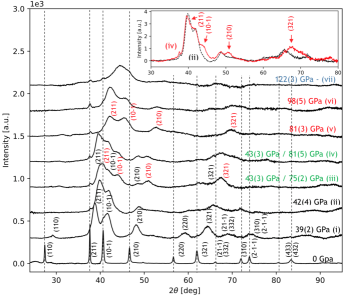
We show the radially integrated x-ray diffraction patterns of under shock in Fig. 1, measured when nearly the entire layer is shocked, but before shock breakout and release. The pattern recorded prior to the shock at ambient conditions is shown for comparison. At pressures below 42 GPa, the patterns (i) and (ii) show similar features to that of the ambient sample in terms of both peak positions and intensities. Nine - peaks are identified and shifted toward larger angles due to sample compression. Overall, strong peak broadening is observed in shocked samples, reminiscent of a decrease in crystallite size and an increase in micro-strain effects (lattice parameters fluctuations) under pressure [25, 26]. At intermediate pressures, patterns (iii) and (iv) show four additional peaks, indexed in red on pattern (iii). We attribute these to the appearance of a second kind of phase, which we dub the phase, having the same crystallographic structure as but a significantly lower volume. These mixed patterns are thus associated with two pressures depending on the phase. For pressures above 81 GPa, only four peaks corresponding to the - are observed, with a significant shift toward larger angles due to larger compression. At 122 GPa, pattern (vii) also shows the appearance of a diffuse signal at scattering angles of 45 ( Å-1) and 55 ( Å-1), which could be interpreted as an amorphous phase (2D diffraction data are shown in Fig. S9).
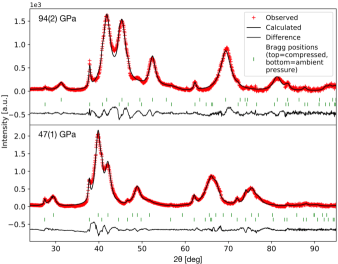
It was not possible to perform Rietveld refinements on the data due to the complex microstructure of the samples under shock. Instead, we performed Le Bail refinements, shown in Fig. 2, for data from targets without a sapphire window. At 47(1) GPa a decrease of ratio for the compressed - phase is observed compared with ambient -. At 94(2) GPa we identify an - structure with a significantly smaller volume than the - observed at 47(1) GPa (225.2 Å3 and 265.8 Å3, respectively). In both cases, the - structure [24] fits the compressed phase well (%). For data above 80 GPa, none of the high pressure phases of reported under static compression were observed (-, -, Fe25O32, or Fe5O7 [1]).
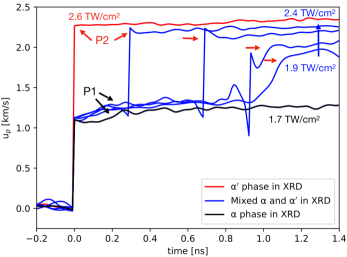
Velocity profiles at the /Sapphire interface for increasing laser intensities are shown as a function of time in Fig. 3. A double-wave structure is systematically observed in VISAR data when the mixing of the and phases is detected in diffraction, as shown for shots in blue. The first wave is labelled P1 and the second wave P2. From the appearance of the phase, the P1 wave velocity remains constant at around 1.3 km s-1 for all mixed shots regardless of the laser intensity. In contrast, the P2 wave velocity increases with laser intensity and its arrival time becomes shorter. The double-wave structure is also observed for targets without a sapphire window, measured directly from the free surface of (Fig. S8). This indicates that the double-wave structure is not due to the sapphire window, but is produced within the layer at specific laser intensities. The splitting of the wavefront into two waves is characteristic of a phase transition with a volume change [27, 28]. We thus identify this observation as a signature of the phase transition, which is also observed in diffraction, and associate the P1 and P2 waves with the and phases, respectively. The pressures in the and phases can then be determined from the P1 and P2 velocities, similarly to previous work on Bismuth [29].
The unit cell volumes of the - and - phases are plotted against pressure in Fig 4. The - phase is observed up to 54 2 GPa, and the - phase for pressures above 63 2 GPa. We measure a (11.0 1.4)% volume drop between the two phases, calculated from x-ray diffraction data showing both in coexistence. This volume drop indicates that the transition from to is a first-order transition.
The volume drop is accompanied by a pressure gap of around 9 3 GPa. This could be due to experimental detection limitations, such as 1) the VISAR etalon; 2) the temporal range restricted by the multiple waves in our sample design (see Fig. S4 of the supplementary) that might prevent the detection of the P2 waves with breakout time superior to the temporal range; or 3) the inherent laser-shocked x-ray diffraction peak broadness that prevents small peaks to be observed. In addition, phase transitions under shock are also subject to temperature effects that might broaden the transition pressure range [27], as well as superheating, kinetic and plasticity effects [30, 31, 32] that might affect the onset pressure for - synthesis.
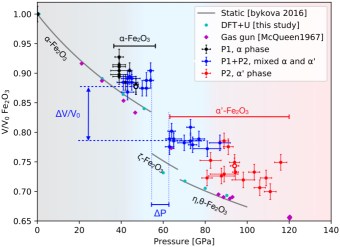
Overall, our data yield larger unit cell volumes than previous shock data from gas gun experiments [17] as seen in Fig. 4. However, these previous measurements are intrinsically different to ours, either due to their time scale (ms or s for gas guns) or by the nature of the measurements (optical and macroscopic compared with x-ray bulk and microscopic). In this work, the volume is extracted from the positions of the diffraction peaks. Further, we note that single-crystals are known to behave differently depending of the relative alignment of the compression direction with the crystal axis [15]. Because of how our samples were deposited they do have a notable preferred orientation, and this may well affect the experimental compression values.
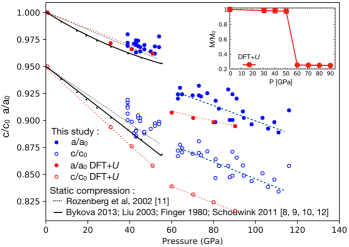
Figure 5 shows the evolution of and , where and denote the lattice parameters under shock and and the parameters at ambient conditions. Both are deduced from Le Bail refinements. Below 54 GPa, the ratios for - are consistent with static compression data [11], and can be explained by bonding distortion or uneven modifications of the Fe-O-Fe bond lengths [8, 9, 10, 11, 12]. This pressure distortion effect is observed in other corundum-structured oxides [8, 33], and can lead to a Mott insulator transition. A discontinuity of 3.6 % is seen between 54-62 GPa for a/a0, in line with the observed volume drop between the and phases shown in Fig. 4. No discontinuity is observed for c/c0. Above 62 GPa we observe a change in the slope of c/c0 with pressure, while the slope of the corresponding a/a0 line remains unchanged. This indicates that the c-axis becomes less compressible in the new phase, and that the volume drop observed is mostly due to a strong decrease of the a lattice parameter.
As the transition is observed without change of symmetry, the - to - transition could be electronically driven. Two electronic transitions are observed at 50 GPa in static compression experiments: a Mott transition and a simultaneous spin transition [7]. These transitions are not limited by the timescale required for atomic displacement, and can therefore be much faster than a structural transition. Moreover, it has been shown that Mott and spin transitions can lead to a significant volume collapse without structural change [7], as seen for example in MnO [34] and FeO [35]. To further investigate such electronic transitions, we performed DFT calculations [36, 37, 38, 39, 40, 41] of -. As our experimental data show only - phase, relaxation of cell parameters, atomic positions and magnetic state of iron was performed with symmetry. Our simulations were performed using the v7.1 Quantum-Espresso suite [42, 43]. Scalar-Relativistic ultrasoft pseudopotential (PP) [44] were generated using the PBEsol exchange-correlation functionals [45] for Fe and O. The effective Hubbard parameter was used for the Fe- orbitals, with the initial occupations given by the PP. We used a kinetic-energy cutoff of the plane-wave basis set of 100 Ry and an augmentation charge energy cutoff of 800 Ry. The calculations were carried out using a 121212 -point grid. The DFT+ calculations were performed at ambient pressure using eV, leading to an energy band gap of 2.075 eV and magnetic moment per Fe atom of 4.41 , in agreement with experimental values of 2.14 eV and 4.6 , respectively [46, 47].
The results of the DFT calculations are shown in Figs. 4 and 5. All main features of interest observed experimentally around the phase transition at 50-60 GPa are reproduced in the simulations: we find a large V/V0 volume drop (10%), a discontinuity in the evolution of a/a0 but without a change in compressibility, and a change in compressibility but without a discontinuity of c/c0. While there remains some discrepancy in the absolute values for the calculated parameters, overall the simulations reproduce the observed trends with good fidelity. The volume drop between 50-60 GPa is correlated to a drop in the local magnetic momentum of iron, as shown in the inset in Fig. 5, decreasing by a factor of 5, i.e. changing from a high to a low spin state. Therefore, we posit that the transition could be explained by a spin transition from a high-spin rhombohedral phase (-) to a low-spin rhombohedral phase (- being a low-spin corundum-structured phase). We note that, in principle, the value of U in our simulations should change with pressure. We performed similar calculations for different values of U (1,3,5,7 eV), and find that while this affects the pressure at which the transition takes place, it does not change the calculated volume drop of 10%, nor the change from high to low spin. While our DFT calculations are not tailored to identify a Mott transition, it is known from dynamical mean-field theory calculations that the spin transition and the Mott transition are linked and occur simultaneously [48]. We thus propose that the transition is an electronically driven spin transition from high-spin to low-spin, possibly associated with a Mott transition. Importantly, this implies that the electronic transition will occur before any structural transition takes place. Static compression experiments reported simultaneous electronic (spin and Mott transitions) and structural transitions (to or - phases) [1, 2, 3, 4, 5, 6, 7]. Here our time-resolved experiments show an electronic transition occurring before such structural transitions, proving that the electronic transition implies the structural change as indicated by [6], and not the other way around.
To summarize, we have presented in-situ time-resolved x-ray diffraction measurements in shock-compressed up to 122 GPa, showing a clear difference in the phase diagram compared with static compression experiments. None of the high pressure phases seen statically where observed dynamically. Instead, we observed an isostructural phase transition around 50-60 GPa, characterized by an 11% volume drop due to a high-spin to low-spin transition, and, possibly, a Mott transition. Our results thus show that the electronic transition(s) observed in under static compression around 50 GPa still occur, but without the associated structural transitions. These either cannot happen under dynamic laser compression, or require timescales longer than those accessible in our experiment to form. The structures of the and phases differ significantly from the structure of the phase: they are composed of FeO6 prisms and octahedra, whereas the phase is only composed of FeO6 octahedra [1]. Our results thus suggest that the fast electronic transitions (1 ns) are the ones driving the comparatively slower reconstructive structural transitions to the and phases (1 ns) [49], and not vice versa.
Use of the Linac Coherent Light Source (LCLS), SLAC National Accelerator Laboratory, is supported by the U.S. Department of Energy, Office of Science, Office of Basic Energy Sciences under Contract No. DE-AC02-76SF00515. This project has received funding from the European Research Council (ERC) under the European Union’s Horizon 2020 research and innovation program (ERC PLANETDIVE grant agreement No 670787). This work was supported by grants from Japan Society for the Promotion of Science (JSPS). C.C., S.A., P.H., J.S.W and S.M.V. acknowledge support from the UK EPSRC under grants EP/P015794/1 and EP/W010097/1. T.G. acknowledges support from AWE via the Oxford Centre for High Energy Density Science (OxCHEDS). T.C. and S.M.V. acknowledge support from the Royal Society. A.F. acknowledges support from the STFC UK Hub for the Physical Sciences on XFELs. We thank the microscopy, x-ray diffraction and PVD platforms at IMPMC for support in producing and characterizing the samples. We also thank T. De Resseguier, R. Smith, T. Vinci and A. Benuzzi-Mounaix for helpful discussions.
References
- Bykova et al. [2016] E. Bykova, L. Dubrovinsky, N. Dubrovinskaia, M. Bykov, C. McCammon, S. V. Ovsyannikov, H. P. Liermann, I. Kupenko, A. I. Chumakov, R. Rüffer, M. Hanfland, and V. Prakapenka, Structural complexity of simple Fe2O3 at high pressures and temperatures, Nature Communications 7, 10661 (2016).
- Ono and Ohishi [2005] S. Ono and Y. Ohishi, In situ X-ray observation of phase transformation in Fe2O3 at high pressures and high temperatures, Journal of Physics and Chemistry of Solids 66, 1714 (2005).
- Ono et al. [2004] S. Ono, T. Kikegawa, and Y. Ohishi, High-pressure phase transition of hematite, Fe2O3, Journal of Physics and Chemistry of Solids 65, 1527 (2004).
- Pasternak et al. [1999] M. P. Pasternak, G. K. Rozenberg, G. Y. Machavariani, O. Naaman, R. D. Taylor, and R. Jeanloz, Breakdown of the Mott-Hubbard State in Fe2O3 : A First-Order Insulator-Metal Transition with Collapse of Magnetism at 50 GPa, Physical Review Letters 82, 4663 (1999).
- Badro et al. [2002] J. Badro, G. Fiquet, V. V. Struzhkin, M. Somayazulu, H.-k. Mao, G. Shen, and T. Le Bihan, Nature of the High-Pressure Transition in Fe2O3 Hematite, Physical Review Letters 89, 205504 (2002).
- Sanson et al. [2016] A. Sanson, I. Kantor, V. Cerantola, T. Irifune, A. Carnera, and S. Pascarelli, Local structure and spin transition in Fe2O3 hematite at high pressure, Physical Review B 94, 014112 (2016).
- Greenberg et al. [2018] E. Greenberg, I. Leonov, S. Layek, Z. Konopkova, M. P. Pasternak, L. Dubrovinsky, R. Jeanloz, I. A. Abrikosov, and G. K. Rozenberg, Pressure-Induced Site-Selective Mott Insulator-Metal Transition in Fe2O3, Physical Review X 8, 031059 (2018).
- Bykova et al. [2013] E. Bykova, M. Bykov, V. Prakapenka, Z. Konôpková, H.-P. Liermann, N. Dubrovinskaia, and L. Dubrovinsky, Novel high pressure monoclinic Fe2O3 polymorph revealed by single-crystal synchrotron X-ray diffraction studies, High Pressure Research 33, 534 (2013).
- Liu et al. [2003] H. Liu, W. A. Caldwell, L. R. Benedetti, W. Panero, and R. Jeanloz, Static compression of alpha-Fe2O3: linear incompressibility of lattice parameters and high-pressure transformations, Physics and Chemistry of Minerals 30, 582 (2003).
- Schouwink et al. [2011] P. Schouwink, L. Dubrovinsky, K. Glazyrin, M. Merlini, M. Hanfland, T. Pippinger, and R. Miletich, High-pressure structural behavior of -fe2o3 studied by single-crystal X-ray diffraction and synchrotron radiation up to 25 GPa, American Mineralogist 96, 1781 (2011).
- Rozenberg et al. [2002] G. K. Rozenberg, L. S. Dubrovinsky, M. P. Pasternak, O. Naaman, T. Le Bihan, and R. Ahuja, High-pressure structural studies of hematite Fe2O3, Physical Review B 65, 064112 (2002).
- Finger and Hazen [1980] L. W. Finger and R. M. Hazen, Crystal structure and isothermal compression of Fe2O3, Cr2O3, and V2O3 to 50 kbars, Journal of Applied Physics 51, 5362 (1980).
- Ito et al. [2009] E. Ito, H. Fukui, T. Katsura, D. Yamazaki, T. Yoshino, Y. Aizawa, A. Kubo, S. Yokoshi, K. Kawabe, S. Zhai, A. Shatzkiy, M. Okube, A. Nozawa, and K.-I. Funakoshi, Determination of high-pressure phase equilibria of Fe2O3 using the Kawai-type apparatus equipped with sintered diamond anvils, American Mineralogist 94, 205 (2009).
- Boulard et al. [2019] E. Boulard, M. Harmand, F. Guyot, G. Lelong, G. Morard, D. Cabaret, S. Boccato, A. D. Rosa, R. Briggs, S. Pascarelli, and G. Fiquet, Ferrous Iron Under Oxygen‐Rich Conditions in the Deep Mantle, Geophysical Research Letters 46, 1348 (2019).
- Kondo et al. [1980] K. Kondo, T. Mashimo, and A. Sawaoka, Electrical resistivity and phase transformation of hematite under shock compression, Journal of Geophysical Research 85, 977 (1980).
- Liebermann and Schreiber [1968] R. C. Liebermann and E. Schreiber, Elastic constants of polycrystalline hematite as a function of pressure to 3 kilobars, Journal of Geophysical Research 73, 6585 (1968).
- McQueen and Marsh [1966] R. McQueen and S. Marsh, Handbook of Physical Constants (unpublished data), Geological Society of America Memoir 97, 153 (1966).
- Nagler et al. [2015] B. Nagler, B. Arnold, G. Bouchard, R. F. Boyce, R. M. Boyce, A. Callen, M. Campell, R. Curiel, E. Galtier, J. Garofoli, E. Granados, J. Hastings, G. Hays, P. Heimann, R. W. Lee, D. Milathianaki, L. Plummer, A. Schropp, A. Wallace, M. Welch, W. White, Z. Xing, J. Yin, J. Young, U. Zastrau, and H. J. Lee, The Matter in Extreme Conditions instrument at the Linac Coherent Light Source, Journal of Synchrotron Radiation 22, 520 (2015).
- Madey [1971] J. M. J. Madey, Stimulated Emission of Bremsstrahlung in a Periodic Magnetic Field, Journal of Applied Physics 42, 1906 (1971).
- Deacon et al. [1977] D. A. G. Deacon, L. R. Elias, J. M. J. Madey, G. J. Ramian, H. A. Schwettman, and T. I. Smith, First Operation of a Free-Electron Laser, Physical Review Letters 38, 892 (1977).
- Prescher and Prakapenka [2015] C. Prescher and V. B. Prakapenka, DIOPTAS : a program for reduction of two-dimensional X-ray diffraction data and data exploration, High Pressure Research 35, 223 (2015).
- Kieffer et al. [2020] J. Kieffer, V. Valls, N. Blanc, and C. Hennig, New tools for calibrating diffraction setups, Journal of Synchrotron Radiation 27, 558 (2020).
- Barker and Hollenbach [1972] L. M. Barker and R. E. Hollenbach, Laser interferometer for measuring high velocities of any reflecting surface, Journal of Applied Physics 43, 4669 (1972).
- Blake et al. [1966] R. Blake, R. Hessevick, T. Zoltai, and L. Finger, Refinement of the Hematite Structure, American Mineralogist 51, 123 (1966).
- Ichiyanagi et al. [2019] K. Ichiyanagi, S. Takagi, N. Kawai, R. Fukaya, S. Nozawa, K. G. Nakamura, K.-D. Liss, M. Kimura, and S.-i. Adachi, Microstructural deformation process of shock-compressed polycrystalline aluminum, Scientific Reports 9, 7604 (2019).
- Briggs et al. [2017] R. Briggs, M. Gorman, A. Coleman, R. McWilliams, E. McBride, D. McGonegle, J. Wark, L. Peacock, S. Rothman, S. Macleod, C. Bolme, A. Gleason, G. Collins, J. Eggert, D. Fratanduono, R. Smith, E. Galtier, E. Granados, H. Lee, B. Nagler, I. Nam, Z. Xing, and M. McMahon, Ultrafast X-Ray Diffraction Studies of the Phase Transitions and Equation of State of Scandium Shock Compressed to 82 GPa, Physical Review Letters 118, 025501 (2017).
- Zel’dovich and Raizer [1967] Y. B. Zel’dovich and Y. P. Raizer, Shock waves in solids, in Physics of Shock Waves and High-Temperature Hydrodynamic Phenomena (Elsevier, 1967) pp. 685–784.
- Mcqueen et al. [1970] R. Mcqueen, S. Marsh, J. Taylor, J. Fritz, and W. Carter, The equation of state of solids from shock wave studies, in High-Velocity Impact Phenomena (Elsevier, 1970) pp. 293–417.
- Gorman et al. [2018] M. G. Gorman, A. L. Coleman, R. Briggs, R. S. McWilliams, D. McGonegle, C. A. Bolme, A. E. Gleason, E. Galtier, H. J. Lee, E. Granados, M. Śliwa, C. Sanloup, S. Rothman, D. E. Fratanduono, R. F. Smith, G. W. Collins, J. H. Eggert, J. S. Wark, and M. I. McMahon, Femtosecond diffraction studies of solid and liquid phase changes in shock-compressed bismuth, Scientific Reports 8, 16927 (2018).
- Pépin et al. [2019] C. M. Pépin, A. Sollier, A. Marizy, F. Occelli, M. Sander, R. Torchio, and P. Loubeyre, Kinetics and structural changes in dynamically compressed bismuth, Physical Review B 100, 060101 (2019).
- McBride et al. [2019] E. E. McBride, A. Krygier, A. Ehnes, E. Galtier, M. Harmand, Z. Konôpková, H. J. Lee, H.-P. Liermann, B. Nagler, A. Pelka, M. Rödel, A. Schropp, R. F. Smith, C. Spindloe, D. Swift, F. Tavella, S. Toleikis, T. Tschentscher, J. S. Wark, and A. Higginbotham, Phase transition lowering in dynamically compressed silicon, Nature Physics 15, 89 (2019).
- Smith et al. [2013] R. F. Smith, J. H. Eggert, D. C. Swift, J. Wang, T. S. Duffy, D. G. Braun, R. E. Rudd, D. B. Reisman, J.-P. Davis, M. D. Knudson, and G. W. Collins, Time-dependence of the alpha to epsilon phase transformation in iron, Journal of Applied Physics 114, 223507 (2013).
- Cox [2010] P. A. Cox, Transition metal oxides: an introduction to their electronic structure and properties, The International series of monographs on chemistry No. 27 (Clarendon Press ; Oxford University Press, Oxford : New York, 2010).
- Yoo et al. [2005] C. S. Yoo, B. Maddox, J.-H. P. Klepeis, V. Iota, W. Evans, A. McMahan, M. Y. Hu, P. Chow, M. Somayazulu, D. Häusermann, R. T. Scalettar, and W. E. Pickett, First-Order Isostructural Mott Transition in Highly Compressed MnO, Physical Review Letters 94, 115502 (2005).
- Ohta et al. [2012] K. Ohta, R. E. Cohen, K. Hirose, K. Haule, K. Shimizu, and Y. Ohishi, Experimental and Theoretical Evidence for Pressure-Induced Metallization in FeO with Rocksalt-Type Structure, Physical Review Letters 108, 026403 (2012).
- Hohenberg and Kohn [1964] P. Hohenberg and W. Kohn, Inhomogeneous electron gas, Phys. Rev. 136, B864 (1964).
- Kohn and Sham [1965] W. Kohn and L. J. Sham, Self-consistent equations including exchange and correlation effects, Phys. Rev. 140, A1133 (1965).
- Anisimov et al. [1991] V. Anisimov, J. Zaanen, and O. Andersen, Band theory and mott insulators: Hubbard u instead of stoner i, Phys. Rev. B. 44, 943 (1991).
- Liechtenstein et al. [1995] A. Liechtenstein, V. Anisimov, and J. Zaanen, Density-functional theory and strong interactions: Orbital ordering in mott-hubbard insulators, Phys. Rev. B 52, R5467 (1995).
- Dudarev et al. [1998] S. Dudarev, G. Botton, S. Savrasov, C. Humphreys, and A. Sutton, Electron-energy-loss spectra and the structural stability of nickel oxide: An lsda+u study, Phys.Rev. B 57, 1505 (1998).
- Cococcioni and de Gironcoli [2005] M. Cococcioni and S. de Gironcoli, Linear response approach to the calculation of the effective interaction parameters in the lda+u method, Phys. Rev. B 71, 035105 (2005).
- Giannozzi and et al. [2009] P. Giannozzi and et al., Quantum espresso: a modular and open-source software project for quantum simulations of materials, Journal of physics: Condensed matter 39, 395502 (2009).
- et al. [2017] P. G. et al., Advanced capabilities for materials modelling with quantum espresso, J. Phys.: Condens. Matter 29, 465901 (2017).
- Corso [2014] A. D. Corso, Pseudopotentials periodic table: From h to pu, Computational Materials Science 95, 337 (2014).
- Perdew et al. [2008] J. P. Perdew, A. Ruzsinszky, G. I. Csonka, O. A. Vydrov, G. E. Scuseria, L. A. Constantin, X. Zhou, and K. Burke, Restoring the density-gradient expansion for exchange in solids and surfaces, Phys. Rev. Lett. 100, 136406 (2008).
- Benjelloun et al. [1984] D. Benjelloun, J.-P. Bonnet, J.-P. Doumerc, J.-C. Launay, M. Onillon, and P. Hagenmuller, Mater. Chem. Phys. 10, 503 (1984).
- Coey and Sawatzky [1971] J. M. D. Coey and G. A. Sawatzky, J. Phys. C 4, 2386 (1971).
- Kuneš et al. [2009] J. Kuneš, D. M. Korotin, M. A. Korotin, V. I. Anisimov, and P. Werner, Pressure-Driven Metal-Insulator Transition in Hematite from Dynamical Mean-Field Theory, Physical Review Letters 102, 146402 (2009).
- Burns and Glazer [2013] G. Burns and A. Glazer, Space Group Applications, in Space Groups for Solid State Scientists (Elsevier, 2013) pp. 187–274.