Neurological disorders leading to mechanical dysfunction of the esophagus: an emergent behavior of a neuromechanical dynamical system
Abstract
An understanding how neurological disorders lead to mechanical dysfunction of the esophagus requires knowledge of the neural circuit of the enteric nervous system. Historically, this has been elusive. Here, we present an empirically guided neural circuit for the esophagus. It has a chain of unidirectionally coupled relaxation oscillators, receiving excitatory signals from stretch receptors along the esophagus. The resulting neuromechanical model reveals complex patterns and behaviors that emerge from interacting components in the system. A wide variety of clinically observed normal and abnormal esophageal responses to distension are successfully predicted. Specifically, repetitive antegrade contractions (RACs) are conclusively shown to emerge from the coupled neuromechanical dynamics in response to sustained volumetric distension. Normal RACs are shown to have a robust balance between excitatory and inhibitory neuronal populations, and the mechanical input through stretch receptors. When this balance is affected, contraction patterns akin to motility disorders are observed. For example, clinically observed repetitive retrograde contractions emerge due to a hyper stretch sensitive wall. Such neuromechanical insights could be crucial to eventually develop targeted pharmacological interventions.
Keywords: Mechanical dysfunction, neurological disorder, esophagus, emergent behavior, Wilson-Cowan model, neuromechanics
1 Introduction
An understanding of how neurological disorders lead to mechanical dysfunction of organs remains an open problem (1, 2, 3, 4). Specifically, gastrointestinal and esophageal motility disorders (EMDs) are neurologically driven mechanical dysfunctions affecting approximately 35 million Americans (5, 6, 7, 2). These disorders have seen an alarming rise in prevalence due to the opioid epidemic. About of chronic opioid users experience constipation, and suffer from esophageal reflux (8, 9). Opioid-induced gastrointestinal motility disorder is known to be of neurological origin but with scarce understanding of how mechanical dysfunction emerges (10, 11, 12).
These gaps in knowledge often lead to misinterpretations of disorders. Therefore, impeding the development of effective neurologically focused treatment approaches (13, 14, 15, 16). Establishing a foundational understanding of the emergent behavior of organs may play a vital role in proposing targeted solutions. For instance, the use of selected peripherally acting opioid antagonists may be recommended for clinical study (17, 18, 19).
Uncovering the pathogenesis of EMDs requires an understanding of the enteric nervous system neural circuit that controls peristalsis (20, 21). Historically, this has been elusive (22, 23, 24). Peristaltic motion is pervasive in the gastrointestinal tract (esophagus, stomach, intestines) (22, 25, 26, 27). Particularly in the esophagus, it has been known that there are two major types of neurons – those that stimulate contraction of esophageal muscle and another that inhibit muscle contractions (28, 29, 30). However, beyond a few overarching concepts, the peristaltic neural circuit has remained unresolved (31).
Clinically, esophageal motility has been investigated with high-resolution manometry, a technology utilizing closely spaced pressure transducers positioned along the length of the esophagus (32). High-resolution manometry is an excellent method for quantifying the strength and timing of esophageal contractions (33, 34). However it cannot yield specific information about inhibition other than in tonically contracted sphincter (35, 33, 34).
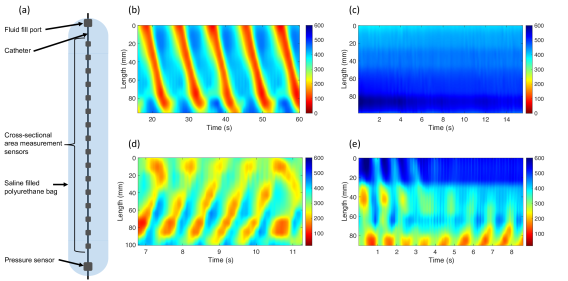
More recently, esophageal motility has been investigated with functional lumen imaging probe (FLIP) Panometry (36, 37). The FLIP device comprises a catheter surrounded by a fluid-filled bag which is placed within the esophageal lumen, measuring cross-sectional area at different locations over time (Fig. 1a). The normal response elicited during a FLIP study (sustained volumetric distension) is of repetitive antegrade contractions (RACs, Fig. 1b) (38). FLIP studies exhibiting patterns other than RACs can also occur and are considered abnormal, potentially indicative of an EMD (36) (Fig. 1). Thus, FLIP has garnered attention as a potential diagnostic tool (37).
It has been proposed, based on clinical data, that RACs is a form of secondary peristaltic response to non-transient esophageal distension (39). This response involves esophageal contractions that are provoked by local distention and that occur independently of the central nervous system (22, 30). However, a complete understanding of how this pattern emerges and the involved mechanisms remains unresolved (40), and there is currently no known neural circuit that can explain this pattern (41). Moreover, due to this lack of understanding, the emergence of abnormal patterns remains unclear (42, 43, 44). Clarifying the connection between neural signals and the mechanical dysfunctions observed can provide valuable insights into the nature of these disorders, crucial for developing targeted pharmacological interventions.
In this study, we propose a first-of-its-kind empirically guided organ-scale neuromechanical model for the esophagus that predicts and explains a broad repertoire of esophageal motility patterns. Organ-scale neuromechanical models prove invaluable for unraveling the intricate patterns and behaviors that emerge from the interactions of individual components within a system, shedding light on how their failure leads to mechanical dysfunctions (45, 46, 47). Through this model, we aim to provide a theoretical framework capable of explaining the essential features observed in clinical FLIP studies. Further, we use this model to reveal the underlying mechanisms associated with normal and abnormal FLIP contraction patterns, hopefully providing insight into the pathogenesis of EMDs.
2 Results
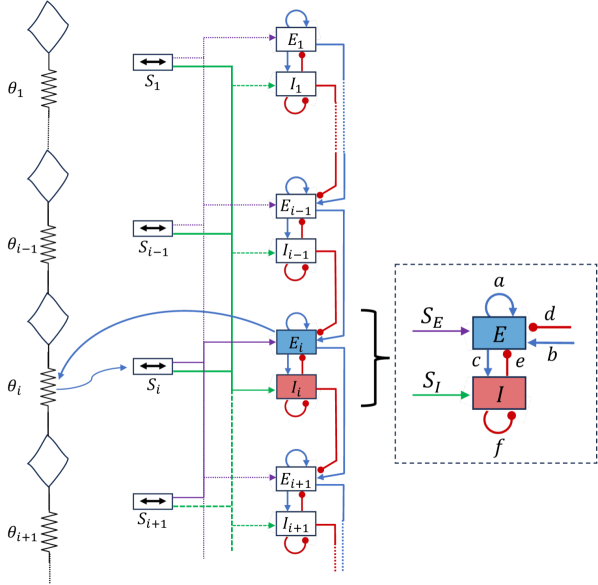
The results reported below are obtained based on the empirically guided neural circuit shown in Fig. 2(a) & 2(b). The circuit and the corresponding neuromechanical mathematical model are described in the Methods section.
2.1 Repetitive antegrade contractions
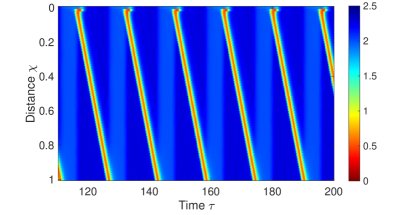
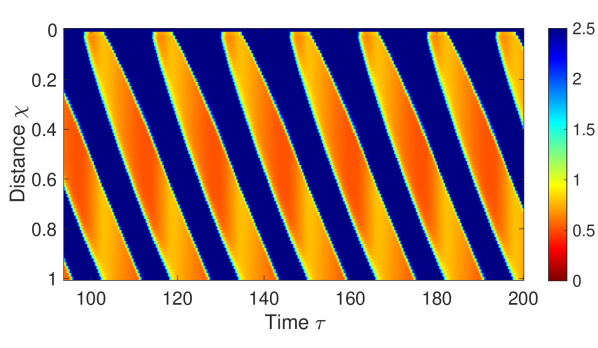
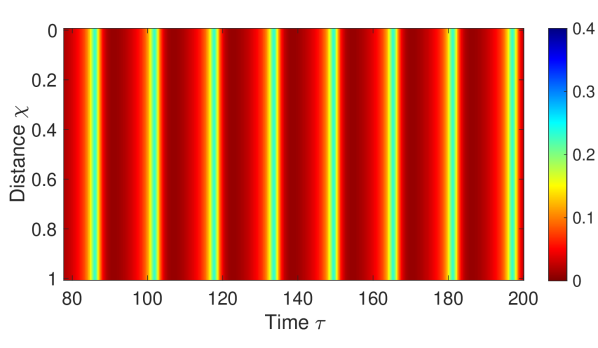
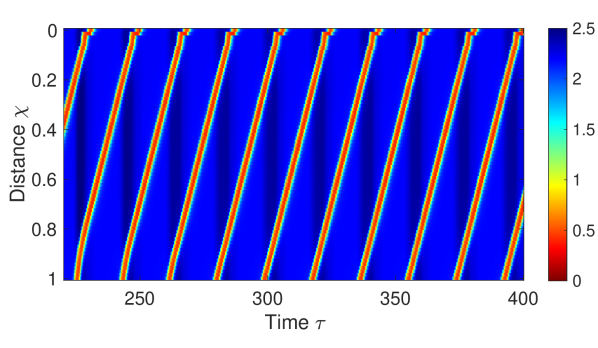
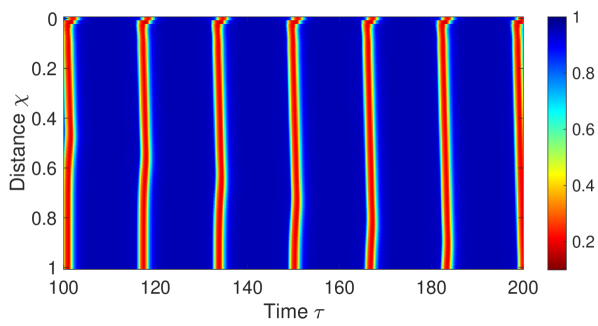
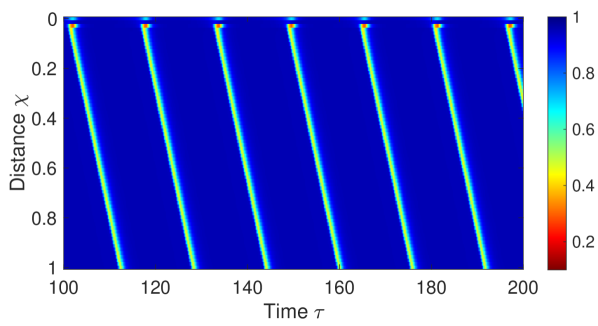
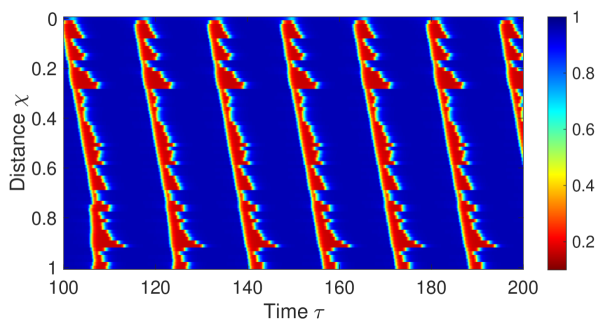
Figure 3 presents a normal RACs pattern obtained through simulations of the mathematical model, qualitatively reproducing the key elements observed in RACs: repetitiveness, forward (antegrade) propagation, and non-overlapping contractions. The contractions emerge and are sustained autonomously and independently of the central nervous system or any externally prescribed input. We establish Fig. 3 as the baseline case. In the following sections, we use the model to explain the triggering mechanism of the pattern and the development of its essential elements, revealing the underlying dynamics of RACs.
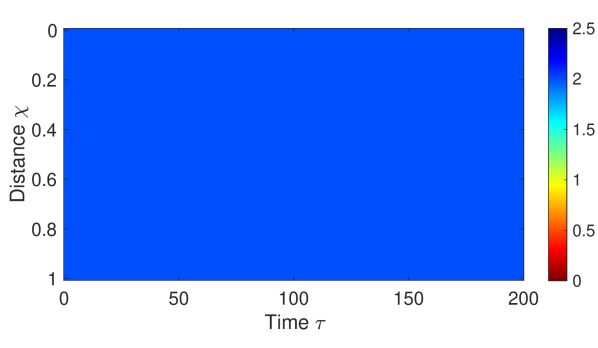
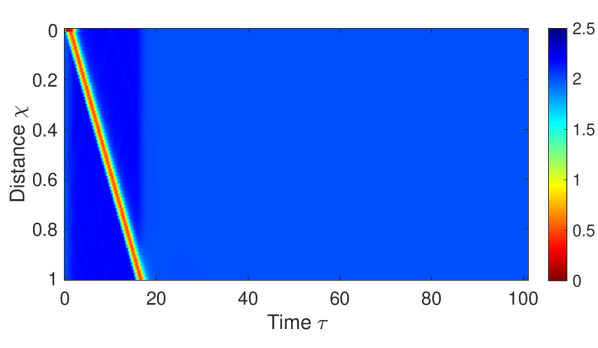
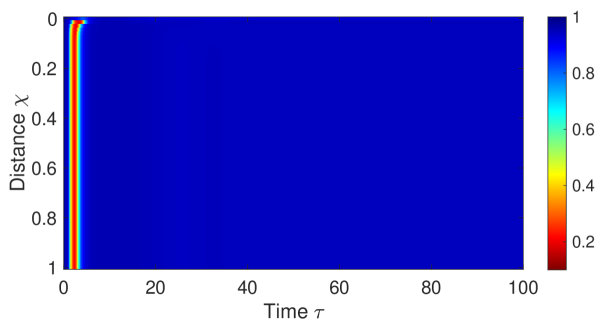
Excitatory signals from stretch receptors () serve as the primary initiators of RACs and play a pivotal role in sustaining the repetitive pattern. Figure 4(a) demonstrates the consequence of disabling stretch receptors, resulting in a lack of contractility due to insufficient excitatory inputs. Figure 4(b) illustrates a scenario where stretch receptors are disabled, and a brief excitatory input is introduced at the proximal end of the esophagus. In the model’s context, this is equivalent to setting everywhere except the proximal end, where for a short time period. As depicted, the proximal excitatory input travels down the esophageal length, leading to a single, propagating contraction. However, without stretch receptors, there is no sustained excitatory input to reinitiate additional contractions.
The emergence of the repetitive, rhythmic attribute observed in FLIP studies is mathematically elucidated through the model. Let’s focus on section , positioned along the length of the distended esophagus. Adequate sustained volumetric distension around triggers the activation of local stretch receptors. These receptors, in turn, innervate excitatory neurons at (via ), initiating the excitatory phase. The activated excitatory neurons then stimulate both excitatory and inhibitory cells at location . Over time, the activity of inhibitory cells surpasses a threshold level, triumphing over both excitatory and inhibitory activity and inducing a refractory period where all cells cease activity. The sustained distension, resulting in constant innervation from stretch, initiates a new cycle when all cells are inactive (48). Note that distension-induced innervation also occurs in inhibitory pathways (), ensuring that inhibition precedes excitation.
The primary determinant governing the forward propagation of contractions is the presence of unidirectional connections ( and ), as they are the only parameters introducing asymmetry into the system (49, 50). In the absence of these connections, the system exhibits repetitive but non-propagating contractions (Fig. 4(e)). The constant input from mechanoreceptors to the excitatory population () ensures that each oscillator operates at its natural frequency, generating an individual limit cycle. Therefore, rhythmic behavior persists even without unidirectional connections (Fig. 4(e)).
Unidirectional coupling introduces an additional stimulus, which in an isolated case (considering a single oscillator in the chain) can be viewed as periodic perturbations. When a stable limit cycle experiences a perturbation, it introduces transient changes which quickly decay to the original oscillatory activity. However, it returns with a phase shift relative to its unperturbed cycle. This adjustment of the phase of each oscillator is termed phase resetting (51, 52). In a coupled system, the phase shift eventually stabilizes to a constant value for all subsequent perturbations, leading to a phase-locked state between coupled oscillators. The delay between each oscillator increases with distance from the first oscillator, as out-of-phase oscillations accumulate (53, 49). Consequently, the signal propagates through the chain as a wave, with each oscillator oscillating with a delay relative to its proximal neighbor (54, 55, 56). Since muscle contraction follows excitatory signal’s pattern (Eq.(8)), muscle contraction pattern appears as a propagating wave (57, 58, 29). Note that the constant phase scenario is the solution to the system. The system is not each oscillator by itself; instead, it forms a new system—a coupled chain—with its own natural frequency and a phase difference between adjacent oscillators.
Lastly, the absence of overlapping patterns observed in normal RACs results from a balance among various factors, including input to the excitatory population (such as and ), inhibitory activity levels (controlled by , , and ), and the excitatory activation threshold (). A parametric study reveals that overlapping contractions occur when the firing of excitatory populations dominates inhibitory firing (see section S5.1 in supplementary). This leads to excitation in the proximal esophagus before the refraction of the distal esophagus, observed in two distinct ways. The first involves extending the excitatory phase. This is exemplified, for instance, by reducing the inhibitory signal from the anterior inhibitory population () (Fig. 4(c)). The second entails allowing excitatory activity to spike faster, effectively shortening the refractory period. This is demonstrated, for instance, by reducing the excitatory activation threshold (), requiring less innervation to activate excitatory cells (Fig. 4(d)).
2.2 Comparison with clinical data
Numerous studies over the years explored esophageal response to distension, offering insights into the typical reactions of the esophagus under various conditions. However, similar to RACs, many of these responses are non-intuitive (25, 59, 60, 61, 62, 63). In this section, we showcase the capability of the proposed neural model to reproduce these diverse distension-induced esophageal scenarios, demonstrating its versatility beyond FLIP manometry. Importantly, we leverage the results to briefly explain these non-intuitive clinical observations in a healthy esophagus. We present four distinct scenarios representing a healthy esophageal response to distension:
-
Case 1.
Transient esophageal distension: Results in a single contraction (61). The short stimulus can be introduced though abrupt inflation and deflation of a distending medium or through vagal efferent nerve stimulation.
-
Case 2.
Prolonged esophageal distension using a short balloon followed by abrupt deflation: During the distension, the esophagus distal to the distended section is mostly inactive. Upon abrupt deflation, one phasic contraction appears, traveling down the length of the esophagus (64, 61). The pressure and cross-sectional area variations along the distended region are not reported in these studies.
-
Case 3.
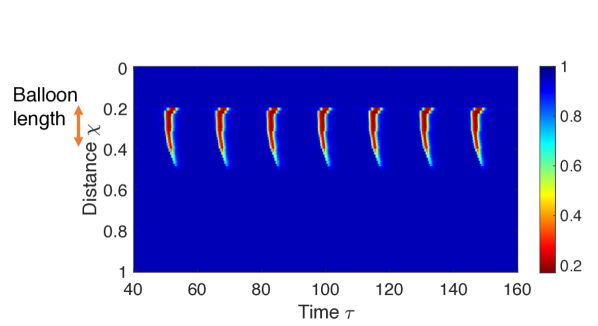
Sustained distension of a short section of the esophagus: Results in repetitive contractions along the distended section, as observed through a pressure probe located inside the fluid-filled distending bag (62, 65). The contractions’ frequency remains independent of the bag’s length, exhibiting a consistent rate of 6 contractions per minute, akin to the FLIP scenario (62, 40). The pressure variations distal to the distended region are not reported in these studies.
- Case 4.
When reproducing the above scenarios, the neural circuit and its parametric values remain constant across the different simulations. The objective is to demonstrate that the properties inherent in the baseline solution, representing a typical esophageal response to FLIP (Fig. 3), automatically encompass all clinically observed distension-induced scenarios. The simulations vary by adjusting the distension’s location and duration along the esophagus.
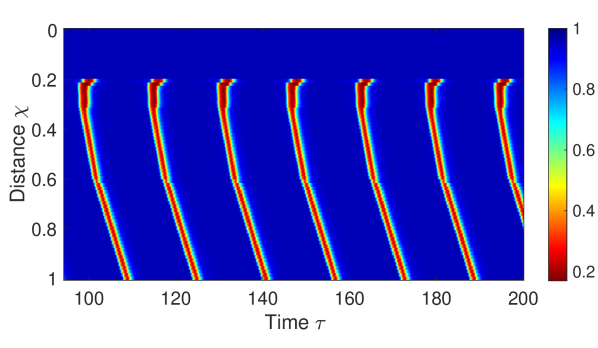
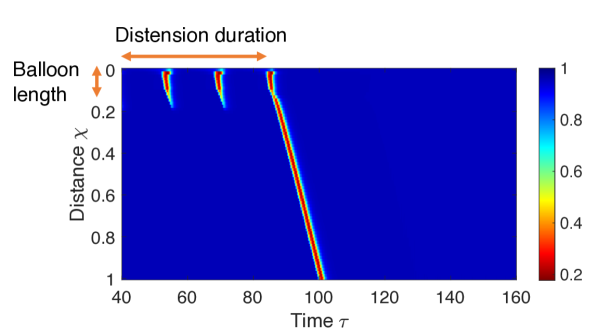
All four scenarios are successfully reproduced. Cases 1 and 4 are displayed in Fig. 4(b) and Fig. 3, respectively, and discussed in the preceding section. Figure 4(b) corresponds to Fig. 1 in the manuscript by Paterson et al. (61). Cases 2 and 3 are presented in Fig. 5 and elaborated upon in the following discussion. Figure 5(a) corresponds to Fig. 2 in the manuscript by Paterson et al. (61), and Fig. 5(b) corresponds to Fig. 1d in the manuscript by Gregersen et al. (62).
Note that cases 2 and 3, though similar, were reported by different research groups, conducting different studies. Paterson et al. (61) (Case 2) focused on the esophageal response distal to the distension (air-filled balloon), providing detailed pressure readings solely distal to the balloon. Gregersen et al. (62) (Case 3) documented the pressure and cross-sectional area only inside the distending medium. From these separate studies, we infer that sustained esophageal distension using a short bag or balloon induces repetitive contractions only along the distended section, with the rest of the esophagus mostly inactive. Upon abrupt removal of the distension, a single contraction emerges, traveling beyond the distended segment. Figure 5 displays the muscle contraction pattern over the entire esophageal length, capturing the behavior inside and outside the bag/balloon.
To explain the clinical observations in cases 2 and 3, we specifically focus on unique aspects not discussed in the preceding section, including (i) the selective appearance of contractions solely along the distended section (with a quiescent state distal to the bag), (ii) the observation of a traveling contraction upon deflation of the bag, and (iii) the explanation for the contraction frequency’s independence of the bag’s length.
-
(i)
As previously established, muscle activation at any location along the esophagus is both initiated and sustained by local stretch receptors innervating excitatory neurons. Given that input from mechanoreceptors to the excitatory neurons is primarily local (28), the absence of distension (proximal or distal to the bag) results in no contraction (as illustrated in Fig. 4(a)).
However, note that excitatory neurons can also receive excitatory innervation from proximal excitatory neurons (if active) through parameter . This scenario can lead to the signal propagating even without the presence of distension at a specific location, as shown in Fig. 4(b). So, what prevents these waves from propagating all the way towards the distal end of the esophagus?
The key factor is descending inhibition. When the esophagus is excited at any location, innervation is sent to inhibitory neurons distally (66), causing the esophagus to relax in anticipation of an incoming bolus (31). Thus, introducing enough inhibition which stops the wave from propagating beyond the distended region. In our model, this is represented by , where is a location distal to the distended section. If we set the stretch-induced innervation to inhibitory neurons only around the distended region, as in Fig. 4(f), contractions distal to the distended region are present.
-
(ii)
Note that the inhibitory activity levels distal to distension are low, allowing a quick recovery once distension is eliminated. Conversely, excitatory activity levels along the distended section are high, taking longer to recover. Therefore, upon abrupt emptying of the bag or balloon, the excitatory signal is free to travel down through neighboring communication (parameter ), unimpeded by inhibitory activity (as depicted in Fig. 4(b)). This propagating excitatory signal translates into muscle contraction, resulting in the observed phasic contraction.
-
(iii)
Examining the rate of propagating contractions is equivalent to studying the frequency of muscle contraction at a single location, dependent on the excitation-refractory cycle of neuronal populations at that specific location (43, 62). The time elapsed from the initiation of the excitatory phase to the end of the refractory period is dictated by the neural architecture and the strength of excitatory input from stretch () (48). Since these parameters are independent of the bag’s length, the contraction frequency is not expected to change with the bag’s length.
2.3 Esophageal motility disorders
In the following section, we showcase how alterations in specific parameters disrupt the RACs pattern. These disruptions result in solutions reminiscent of established esophageal motility disorders, as defined by the Chicago Classification (43, 34). This demonstration not only exposes the underlying mechanisms of these disorders but also emphasizes that they are emergent behaviors. Through this exploration, we establish the model’s consistency with pathologies, providing valuable insights into the dynamic interplay of components influencing esophageal motility disorders. The results are obtained though parametric and robustness studies available in section S5.1 in supplementary.
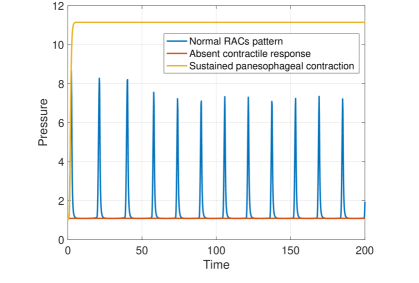
Absent contractile response.
As discussed earlier, an absent contractile response emerges when the excitatory population’s activity (), responsible for controlling muscle contraction, is either reduced or absent (Fig. 4(a)). This response may be attributed to dysfunctions in the normal operation of stretch receptors ( and ), particularly when there are alterations in the sensitivity threshold of the mechanoreceptors (). Changes in esophageal stiffness and dilation are suspected to impact esophageal sensitivity to distension, a phenomenon associated with motility disorders characterized by an absent contractile response, such as achalasia I (67).
The results in Fig. 4(b) might provide insights into cases where patients exhibit normal primary peristalsis (as measured by high-resolution manometry) but abnormal findings in FLIP studies (35, 68). Such discrepancies could be explained by abnormal responses to distension, leading to a lack of an excitatory signal and, consequently, an inability to initiate secondary peristalsis.
Disordered non-occluding contractions.
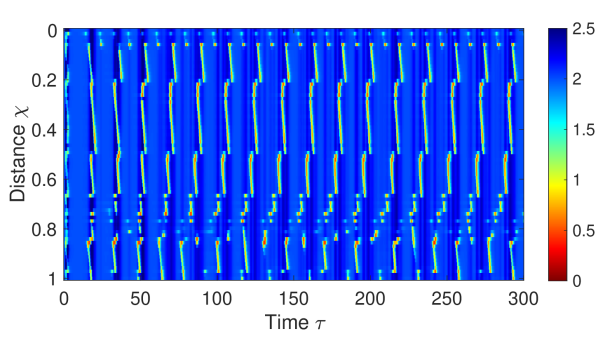
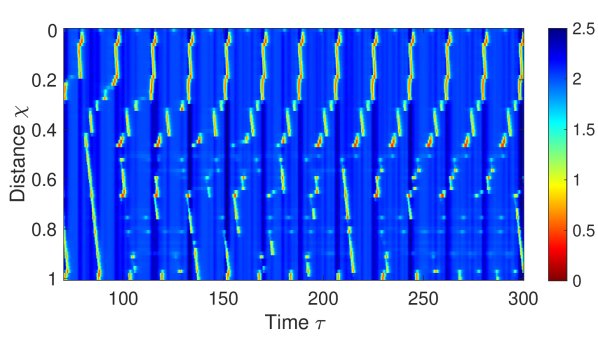
The introduction of local variations to the parameters defining the neuronal circuitry results in the observation of a sporadic or chaotic contraction pattern, as illustrated in Fig. 4(g) and Fig. 4(h). Given the inherent variability of biological systems, small irregularities are immanent. Implementing such small irregularities in the model does not significantly alter the contraction pattern, showcasing its robustness (see supplementary Fig. S12). However, significant local variations in the system’s parameters (such as , and ) may disrupt the desired excitatory-inhibitory balance required for proper RACs, resulting in pronounced irregularities in the contraction pattern (Fig. 4(g)).
It is crucial to emphasize the significance of the system’s robustness. If the system is not initially robust, it becomes more sensitive to small irregularities. Such cases have parametric values allowing the solution to exhibit regular RACs. Nevertheless, the excitatory-inhibitory balance is not as stable. Thus, these scenarios are more prone to sporadic or chaotic contraction patterns when introducing small irregularities, which would not otherwise trigger such responses (Fig. 4(h))
Sustained panesophageal contractions.
Sustained, non-propagating contractions leading to an increase in FLIP pressure are observed when the inhibitory signal to the excitatory population is weakened. Thus, preventing inhibitory activity from overcoming excitatory activity, keeping excitatory cells active. This scenario is reproduced by reducing the inhibitory signal to adjacent excitatory neurons () or by decreasing the excitation of inhibitory neurons ( or ). Note that since the FLIP’s fluid is incompressible, the color-coded topography of cross-sectional area may resemble absent contractile response (Fig. 4(a)). However, the pressure profile differs, as the uniform muscle contraction increases the pressure in the bag, as illustrated in Fig. 6.
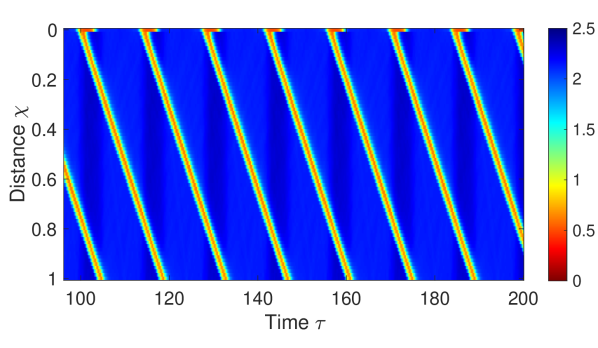
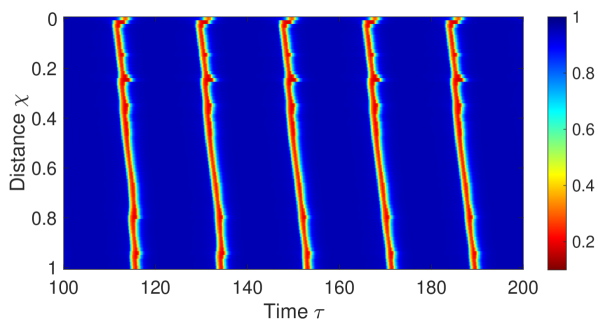
Repetitive retrograde contractions.
Repetitive retrograde contractions emerge with decreased innervation of inhibitory neurons via mechanoreceptors () or increased innervation of excitatory neurons via mechanoreceptors () (Fig. 4(i)). The retrograde pattern results from a phase shift in the excitatory signal, opposing the antegrade pattern. Importantly, this phenomenon is not due to a retrograde traveling signal, as the innervation pathways remain unidirectional. Further details on reversing propagation direction are discussed extensively in our recent work (69).
3 Discussion
This work closes the gap of clarifying the connection between the aberrant neural circuitry and the emergent mechanical dysfunction. The organ-scale neuromechanical model proves useful in giving clarity into the specific neural pathways, connections, and interactions between different types of neurons in the esophagus. The main objectives were to unveil the underlying mechanism of RACs by providing a neural circuitry that reproduces this pattern and to elucidate the mechanisms leading to neurologically driven EMDs. Our results suggest that abnormal contraction patterns are likely to originate from neuronal imbalance. This is aligned with prior speculations concerning the manifestation of esophageal motility disorders (43, 67, 42).
Additionally, we addressed open questions about the emergence of RACs. By examining scenarios in which stretch receptors are disabled, we demonstrated that RACs are locally triggered, supporting the notion that they are a form of secondary peristalsis. Thus, showcasing how neuromechanical models can bring clarity to clinical observations.
However, it is essential to acknowledge certain limitations. The parametric values in our model, while effective in reproducing observed behaviors, need calibration. Extracting these values experimentally is a challenging task (70), especially considering the current lack of a fully explained and quantified esophageal neuronal pattern. As such, we relied on qualitative clinical observations reported in the literature to guide our model parameters. Hence, future research should focus on experimentally validating these parameters.
Advancing towards experimental validation can be achieved through additional pharmacological studies, electrophysiological recordings, and by studying the neural circuity at the molecular level though immunohistochemical, optogenetics, neuronal tracing, and calcium imaging (22, 23, 24, 71, 72, 73, 74, 75). A recent study on the peristaltic reflex of the colon provides a promising template, revealing the physiological and neural elements involved using multiple experimental methods (75).
Another limitation concerns the absence of the lower esophageal sphincter (LES) in our model, particularly regarding its potential influence on the emergence of repetitive retrograde contractions. Repetitive retrograde contractions pattern has previously been theorized to arise from either impaired inhibitory innervation or esophageal outflow obstruction (42). A recent clinical study supports the former hypothesis, attributing repetitive retrograde contractions to neural imbalance leading to excess excitation (42). Our investigation aligns with this perspective. However, the current work does not exclude the second possibility. The effect of esophageal outflow obstruction should be point of future investigation, with a proper LES model.
Nevertheless, despite these challenges, our work opens a new area of investigation in esophagology that is based on mechanophysiology (mechanics-based organ function). One of the leading diagnostic protocols for EMDs is the Chicago Classification scheme (34). This work is a milestone in our effort to develop the first mechanics-guided disease classification and diagnostic protocol for EMDs (76, 77).
There is also a potential for broad impact beyond the esophagus. Mechanical dysfunctions caused by neurological disorders expand beyond the gastrointestinal tract and are prominent in other organs where an emergent behavior occurs such as the heart, lungs, bladder, and uterus (78, 1, 79, 80, 81). For example, acute respiratory distress syndrome and chronic obstructive pulmonary disease are associated with disturbance in the lungs’ rhythmic function (4, 82). In the heart, asynchronous in electrical activation can cause abnormalities in perfusion and pump function, leading to arrhythmias or even heart failure (83, 84, 85).
Organ-scale neuromechanical models can mark a significant step forward in bridging the gap between clinical observations and mechanistic understanding, thereby aiding the development of effective neurologically focused treatment approaches. This work provides a template to interrogate neurologically driven mechanophysiological pathologies of other organs.
4 Methods
4.1 Overview of mathematical model
In this section, we provide a brief overview of esophageal neuromechanics and describe how the different components are represented in our empirically guided model. The mathematical details are discussed in the succeeding section.
The esophagus is a multilayered tubular organ that connects between the mouth and the stomach, transporting swallowed material through peristaltic contraction (58). This coordinated movement results from sequential contraction of the circular muscle, that is neurally controlled (31, 86, 87). Peristalsis can be triggered by swallowing, initiated by the central nervous system (primary peristalsis) (57, 25), or locally, provoked by esophageal distention and is independent of the central nervous system (secondary peristalsis) (22, 30). Since esophageal response to FLIP is known to be involuntary and assumed to be triggered locally, the model is such that the innervation is lead by local feedback (41, 39, 88).
The esophageal wall and FLIP mechanics are modeled as one, close ended, flexible tube filled with incompressible, viscous fluid (89). The esophageal neural circuitry is constructed as a chain of unidirectionally coupled relaxation oscillators, often used to model central pattern generators (47). The neural circuitry receives excitatory signals from stretch receptors along the esophageal body (Fig. 2(a)). Since esophageal contraction wave is coordinated by a sequential excitation (57, 58, 29), the coupling between the neurological model and the body mechanics is done by initiating contraction when the amount of local excitation rises above a threshold. The innervation pathways for each neuronal population (excitatory and inhibitory) are discussed next.
Excitatory input from stretch. When the FLIP bag inside the esophagus is inflated, it causes the esophagus to distend, activating the proprioceptive channel that is mediated by stretch receptors, which respond to changes in strain (90, 91). These mechanoreceptors are parts of the esophageal motor neurons and are distributed along the length of the esophagus. Thus, in our neurological model, mechanoreceptors are activated when they sense that local strain increases above a threshold and send excitatory signals to both excitatory and inhibitory neuronal populations.
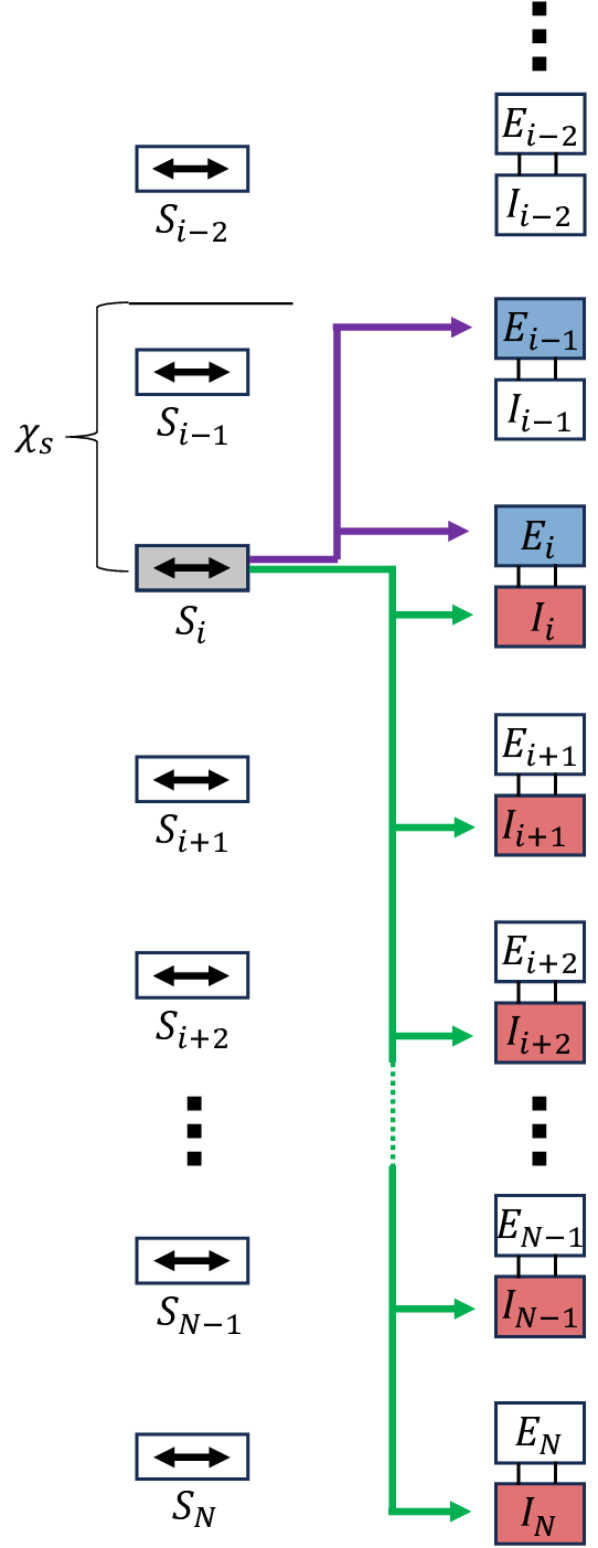
Since the esophagus contracts proximal to a bolus and relaxes distal to a bolus (28), activated mechanoreceptors are set to send excitatory signals to proximal excitatory populations and distal inhibitory populations (31). Additionally, it has been reported that during esophageal distension, the portion of the esophageal body that is located distal to the distended balloon typically remains inactive or quiescent (64, 61). The esophagus distal to the excited portion in inhibited to accommodate for the incoming bolus (28, 66, 31). Therefore, the input from stretch receptors to inhibitory neuronal population affects all inhibitory neurons distal to the sensed distension. On the other hand, the input from mechanoreceptors to the excitatory neuronal population is more local, such that sensed distension only inputs excitatory signal to proximal excitatory neurons that are within 10 of esophageal length.
Input from adjacent neuronal populations. It is believed that depolarization of one muscle cell in the esophagus will result in electronic increase of neighboring muscle cells in an aboral direction (29, 92). Hence, excitatory populations in the model also receive signals from adjacent proximal populations. Nearest-neighbor connections of two types are introduced (93, 94, 95). First, unidirectional, aboral excitatory connections between excitatory populations of neighboring segments leading to a propagation of activity along the chain of segments (parameter in Fig. 2(a)). Second, inhibitory connections from the inhibitory population in one segment to the neighboring (anterior) excitatory populations (parameter in Fig. 2(a)).
Intrasegmental synaptic inputs. Lastly, each segment’s excitatory and inhibitory populations exchange local signals, imitating the excitatory and inhibitory synapses per cell in the excitatory or inhibitory populations (parameters , , , and in Fig. 2(a)) (48). These are trivial elements of the system when modeling the electrical activity using phenomenological approach (96).
Our study is built upon and extends the models recently developed for larval locomotion which used the Wilson-Cowan model (93, 94, 48). It is the first to connect crawling in Drosophila models to the contraction pattern of the esophagus. However, the biggest and most unique advance is in how the initial excitation occurs and the way in which the rhythmic motion emerges. In the locomotion models, the forward waves were induced by applying an external input to distal excitatory population. In the current model, no external neuronal signaling is needed to initiate the contraction nor to sustain the rhythmic contractions.
4.2 Body mechanics and fluid equations
The flow inside the FLIP device placed in the esophageal lumen is modeled as a one-dimensional, fluid-filled, flexible tube that is closed on both ends (89, 97, 98). The conservation of mass and momentum equations are
| (1) |
and
| (2) |
respectively (99). A parabolic flow is assumed everywhere. In the equations above, , , , and are the tube cross-sectional area, fluid velocity (averaged at each cross-sectional area), pressure inside the tube, fluid density, and fluid viscosity, respectively. We introduce a linear constitutive relation
| (3) |
to complete the system (100, 101). Here, , , and are external pressure, tube stiffness, and undeformed reference area (cross-sectional area of the tube when ), respectively. Lastly, the neurally controlled contraction of the esophageal lumen is set through dynamically varying the rest cross-sectional area of the tube by a factor (99, 102, 103). captures the muscular dynamic, induced by the neural activity discussed next.
4.3 Neural circuitry: excitation, inhibition, and muscle contraction pattern
Relaxation oscillators are often used to model cardiac and gastro-intestinal electrical activity (96, 104, 105, 2). To represent the electrical activity of the entire organ, we introduce a system of locally coupled Wilson–Cowan oscillators, distributed uniformly along the length of the esophagus. Each unit consists of two neuronal populations, excitatory () and inhibitory () (Fig. 2(a)). The values of and at each oscillator depict the activity levels of the excitatory and inhibitory neuron populations. The differential equations for the time-dependent variation of averaged excitatory and inhibitory neuronal activities at node introduced by (48) with the unidirectional coupling introduced by (94) is
| (4) |
and
| (5) |
The intrasegmental connectivity parameters , , , and represent the average number of excitatory and inhibitory synapses per cell in the excitatory or inhibitory population. The connectivity coefficient denotes the unidirectional excitatory connections between the excitatory populations of neighboring segments (excitatory signal from nearest posterior excitatory population). The connectivity coefficient signifies the unidirectional inhibitory connections from a segment’s inhibitory population to the nearest anterior segment’s excitatory population. For the relaxation oscillators located at the proximal end, . The time constants and dictate the decay of the excitatory and inhibitory activities, and determine the activities’ timescale. The sigmoid function characterizes the switching threshold defined as
| (6) |
where is activation speed (slope of sigmoid), and is activation threshold (location of sigmoid’s maximum slope). Lastly, and symbolize the local excitatory inputs to each population at oscillator , capturing the mechano-sensory feedback coming from the stretch receptors (93, 94), discussed next.
In our model, the mechano-receptors are activated when they sense that local strain increases above a threshold (). As discussed in a prior section, when activated, a sensory stretch receptor sends excitatory signals to proximal excitatory populations and excitatory signals to distal inhibitory populations. The input to excitatory neurons from stretch receptors is more local, meaning that stretch excites excitatory neurons within the proximal vicinity of the activated receptor. On the other hand, the input from stretch receptors to inhibitory neurons is applied to all inhibitory neurons distal to the activated receptor. Thus, and input for a segment located in are defined as
| (7) |
where , , , , and are the strength of the net sensory feedback coming from the stretch receptors, is esophageal length, and are gains, and is horizontal shift. The schematic of the stretch induced innervation is presented in Fig. 2(b).
Using the neural coupling above, we can solve for the activation function such that
| (8) |
where is a time constant, a threshold for muscle activation, and , where is the gain, and is the maximum contraction strength.
4.4 Non-dimensional form
The dynamic system of equations described above is non-dimensionalized using
| (9) |
where , , , , and are the non-dimensional variables for cross-sectional area, time, velocity, pressure, and position, respectively (89, 97). Thus, dimensional equations ((1), (2), (3), (4), (5), and (8)) become
| (10) |
| (11) |
| (12) |
| (13) |
| (14) |
| (15) |
respectively, where , , , and .
4.5 Initial and boundary conditions
The fluid in the tube is initially at rest and the cross-sectional area is uniform, hence
| (17) |
since the neuronal system is at rest. Lastly, recall that the tube is closed on both ends, thus,
| (18) |
4.6 Numerical implementation
The system of equations is solved using MATLAB function for the time derivatives and central difference discretization for the spatial derivatives. The discrete expressions for the external source terms in equation (7) are
| (20) | ||||
where denotes the number of nodes.
Table 1 lists the model’s parameters and their values. Values for the parameters defining esophageal body mechanics and fluid properties are approximated based on clinical data and previous computational studies (107, 108, 109, 110). The parameters involved in the neural equations are chosen such that the system has a single unstable fixed point and a stable limit cycle in response to the constant external stimulus and . Depending on the values of the parameters in the system, one can obtain multiple equilibria with different stability properties. For simplicity, we choose the values introduced by (48) with small variations. For example, theoretical work concerning Wilson-Cowan oscillators often set for simplicity (48). By setting , we ensure that both excitatory and inhibitory populations ”turn-on” when distension is applied, independent of one other. A theoretical overview of relaxation oscillators, limit cycle solution, and the constrains introduced by modeling esophageal response is provided in Section S5.2 of the supplementary.
Note that obtaining a limit cycle solution is not the only constrain in this case. The parameters (specially , , , and ) are adjusted such that the model captures the qualitative patterns observed in clinical esophageal distension studies. For instance, high value for makes the propagation more distinct and the system more robust (93, 94). However, it also breaks the constrain in which the rhythmic contractions only take place along the distended section. For high , excitation from proximal cells dominate, allowing the wave to propagate even without local excitation from mechanoreceptors.
| 3000 | |
|---|---|
| 100 | |
| 0.05 | |
| 2 | |
| 1.5 | |
| 0.1 | |
| 0.2 | |
| 4 |
| 16 | |
|---|---|
| 20 | |
| 12 | |
| 40 | |
| 15 | |
| 3 | |
| 1.6 | |
| 1.35 |
| 4 | |
|---|---|
| 3.7 | |
| 1.3 | |
| 2 | |
| 1000 | |
| 1000 | |
| 5 | |
| 0.3 |
Acknowledgments
This work was funded by the by the National Institutes of Health (NIDDK grants DK079902 & DK117824 and NIDDK grants DK079902), and National Science Foundation (OAC grants 1450374 & 1931372)
Author contributions
GE wrote the main manuscript text, prepared all the figures, and wrote the code; NP, and GE developed the mathematical formulation; DC contributed to data acquisition; GE, SH, XL, DC, PK, JP, and NP interpreted results of calculations; PK, JP, and NP contributed to obtaining funding, critical revision of the manuscript and final approval.
Competing interests
PK and JP hold shared intellectual property rights and ownership surrounding FLIP panometry systems, methods, and apparatus with Medtronic Inc. DC: Medtronic (Speaking, Consulting) PK: Ironwood (Consulting), Reckitt (Consulting), Johnson & Johnson (Consulting)
S5 Supplementary
S5.1 Sensitivity testing and robustness analysis
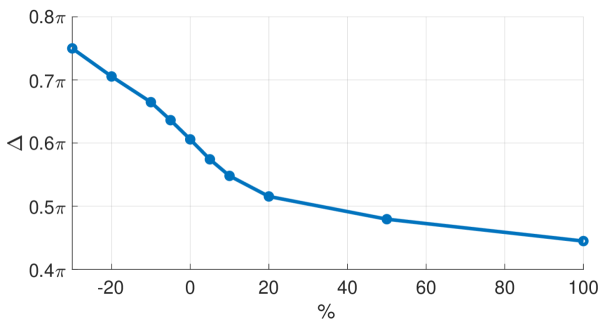
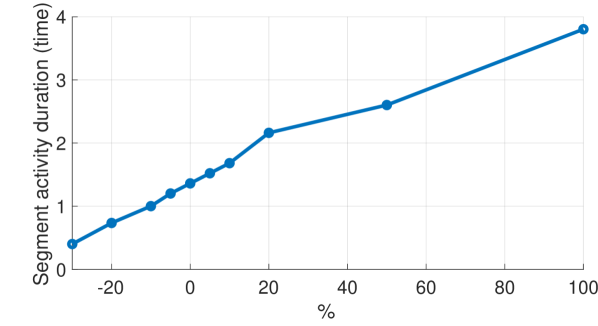
In the pursuit of a comprehensive understanding of the intricate dynamics within the coupled model, we perform a parametric study. This study involves systematically varying individual parameters by increments of , , , , allowing us to dissect the relationship between these parameters and the model’s response. For some parameters, greater increments are considered. The parametric study or sensitivity test has a dual purpose. Firstly, to evaluate the robustness of the model to varying parameters. Secondly, to explore how different parameters affect the solution to the extent that the emerging response resembles an esophageal motility disorder. The impact of varying individual parameters on the simulation results is assessed both qualitatively and quantitatively, providing a comprehensive view of the model’s behavior under various conditions.
The quantitative evaluation focuses on the following criteria:
-
•
Maximum values of and – amplitude of and oscillations.
-
•
Period of and oscillations.
-
•
Contraction duration (length/wave speed) – how long it takes the wave to propagate along the entire length.
-
•
Intersegmental phase lag – time delay in the propagation of the neural signal between adjacent segments.
-
•
Segment activity duration – how long an oscillator is active.
The qualitative assessment is concerned with examining the color-coded topography of the solution, and comparing it with the one of the baseline case (Fig. 3). Are there repetitive, forward propagating contractions? If so, do they decay with time or remain intact as long as distension is applied?
The results of the sensitivity testing reveals that the model is in fact robust to varying individual parameters. Additionally, it shows that the model is more sensitive to some parameters over others. Lastly, the results uncover interesting patterns which provides insights into the role each parameter plays in creating the desired RACs pattern, with the constrains discussed in the main manuscript. Samples for the qualitative and quantitative analysis are presented graphically or though topographic maps in Figs S7,S8,S9,S10, and S11 are discussed next. Table – provides a summary of the parametric investigation.
Figure S7 displays the simulations solutions to different values of . Smaller value implies less inhibition of excitatory neurons, increasing overall excitatory activity. This is translated into uniform or fast propagating contractions, and increase intersegmental phase lag (Fig. 7(a)). We explain this observation though the following concepts. When excitation is increased, excitatory neurons fire more frequently and with greater intensity, leading to a stronger signal being transmitted along the neural pathways. Stronger signal can overcome the differences in physical properties between segments, and propagate more quickly along the neural pathways, thus, reduce intersegmental phase lag. For the exact same reason, we see an opposite pattern for increasing value, and thus reducing excitatory activity, which results in greater phase lag (Fig. 7(b)).

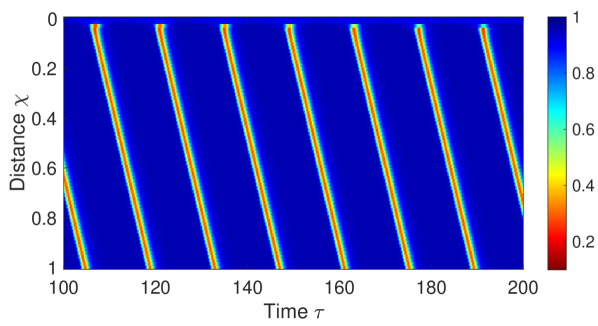
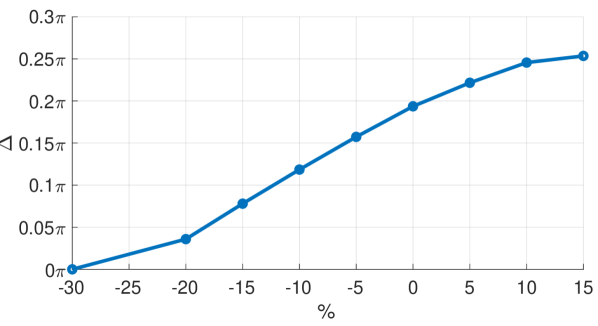
Figure S8 presents the results obtained by the simulations with different values. Since is responsible for the inhibition of inhibitory neuronal population, the pattern is opposite to the one obtained by varying . As shown in Fig. S8, increasing results in fast contractions whereas decreasing results in slower propagation, more slanted contractions. Increasing means less excitation of inhibitory neurons, thus less inhibition on excitatory population, and therefore more uniform firing.
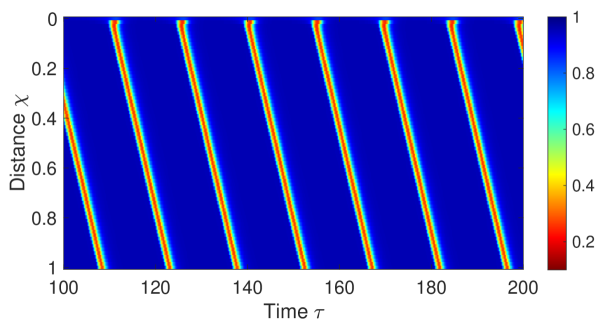
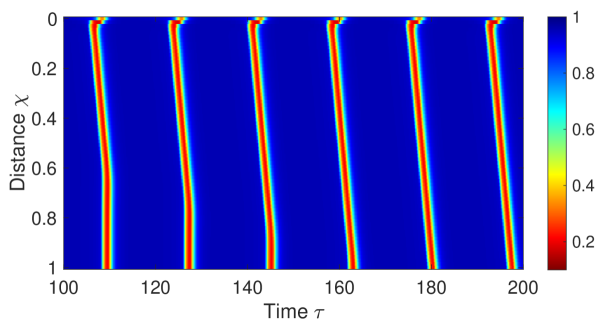
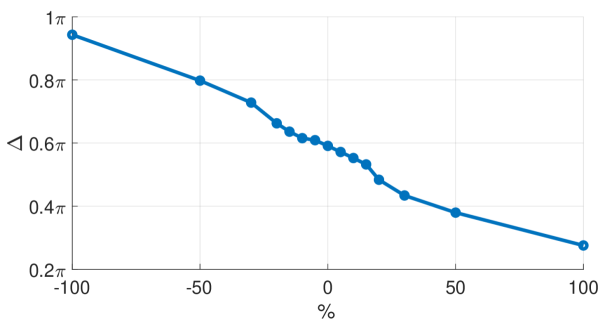
Figure S9 displays the results obtained using various values of the parameter . These results demonstrate that reducing this parameter, indicating less overall inhibition, leads to a significant decrease in intersegmental phase lag, in line with our expectations. However, when examining the system’s response to increased values of , it becomes evident that the system converges to an absent contractile response. Initially, there is a spike, known as the excitable regime, which quickly decays to the system’s resting state. This outcome is due to the fact that the value chosen for the baseline case () is close to the upper limit for this parameter for which a limit cycle solution exists. Increasing shifts the nullcline (represented by the black curve in Fig. S14) to the left on the phase diagram.
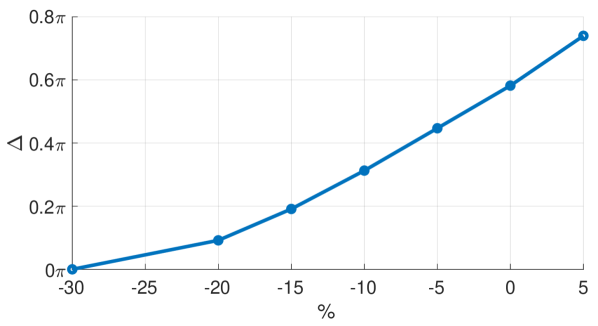
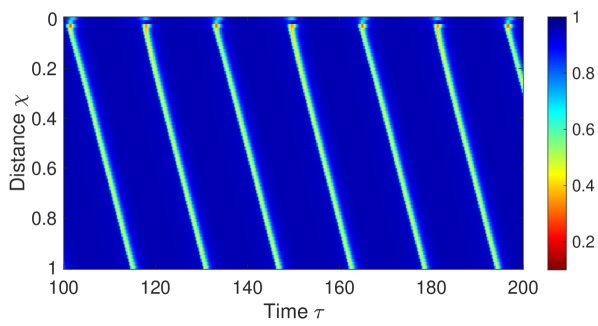
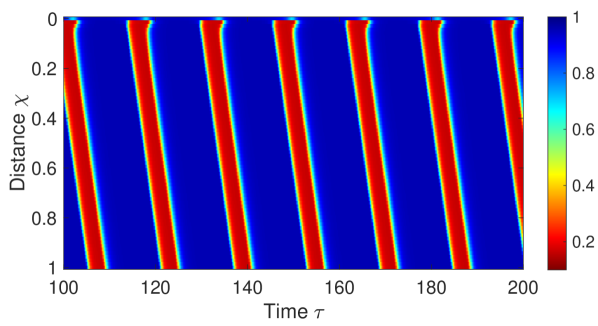
Other interesting parameters are and , which were discussed in great details in (94) and (93). Figures S10and 5 present the results obtained by the simulations with different and values, respectively. Both (94) and (93) concluded that increasing intersegmental coupling has a stabilizing effect on propagation, where larger values of and increase the model’s robustness. However, our scenario has additional constrains that were not considered in previous work. While making the solution more stable though increasing and , one minimizes the effect of the other parameters on solution. Specifically, the interplay between and is essential to capture the unique features of the esophagus (discussed in the main manuscript and shown in Fig 5). If is too large, it can cause in the signal to propagate even without the present of distension (a solution which looks like Fig. 4(f) rather than Fig. 5(b)).
As shown in Fig. 10(a), increasing values is translated into reduction of intersegmental phase lag. However, varying has an additional, much more obvious effect on the solution, shown in Fig. 10(b). Increasing implies stronger and longer contraction as segment activity duration increases. On the other hand, when is reduced, there is not enough excitatory signal passing, leading very weak contractions. These patterns can be observed qualitatively in Fig. 10(c) and Fig. 10(d).
An opposite pattern is observed when increasing or decreasing . Increasing inhibitory signal to excitatory population from nearest-neighbor () implies weaker and shorter contraction duration as segment activity duration decreases. This is presented qualitatively in Fig. S11.

Lastly, note that the system’s response to the change of strength of input parameter to excitatory population, , is as the center of a different study, which we encourage the readers to visit (69).
As indicated in the main text, biological systems are naturally prone to variation, making it essential to test the model’s ability to withstand minor disruptions without altering its contraction pattern. To achieve this, we systematically assess the model’s robustness by introducing small irregularities into its parameters along the length. For each parameter, we randomly sample values from a Gaussian distribution with specific mean and variance, and examine whether the model can maintain its contraction pattern when subjected to these parameter variations. Several examples are presented in Fig. S12. The figure indicates that the model is robust for the parametric values chosen as the baseline solution.
Note that variability may not come from randomness but due to structural changes in the esophagus.
S5.2 Background and theory - relaxation oscillators and limit cycle solution
A relaxation oscillator is a mathematical model of electronic circuit that can exhibit a variety of behaviors that depend on the intrinsic and input parameters defining it (111). Relaxation oscillators have been used for years to model the electrical activity of the heart due to their ability to display rhythmic, repetitive patterns known as limit cycles (1, 112, 2). The shape, frequency, and amplitude of the oscillations depend on the properties of the oscillator (111).
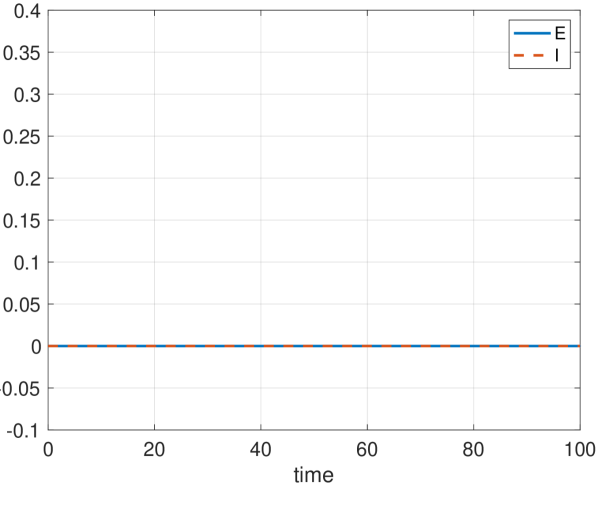
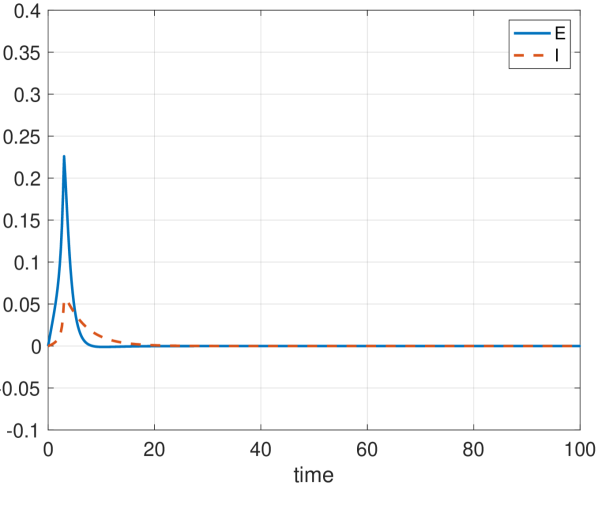
Unlike the heart, the esophagus does not exhibit a consistent rhythmic pattern in its natural state. In the absence of any electrical input or stimulation, the esophagus remains at rest (25). When subjected to short-term stimuli, the esophagus briefly becomes active, undergoing a single cycle of activity before gradually returning to its resting state (61). Lastly, under sustained stimuli (through sustained volumetric distension), a rhythmic pattern emerges in its behavior (40). By definition, relaxation oscillators can exhibit these distinct behaviors based on the presence and nature of external inputs, as discussed next.
In the absence of any prescribed input, a relaxation oscillator remains in a resting state. During this time, the system’s output remains constant (Fig. 13(a)). When a transient input is introduced, a relaxation oscillator responds by producing a transient and distinguishable output. Following the excitation, the system gradually decays to its rest state (Fig. 13(b)). Lastly, if the input is sustained and exceeds a certain threshold, the relaxation oscillator can transition into a self-sustained, rhythmic oscillatory behavior known as a limit cycle solution (Fig. 13(c)).
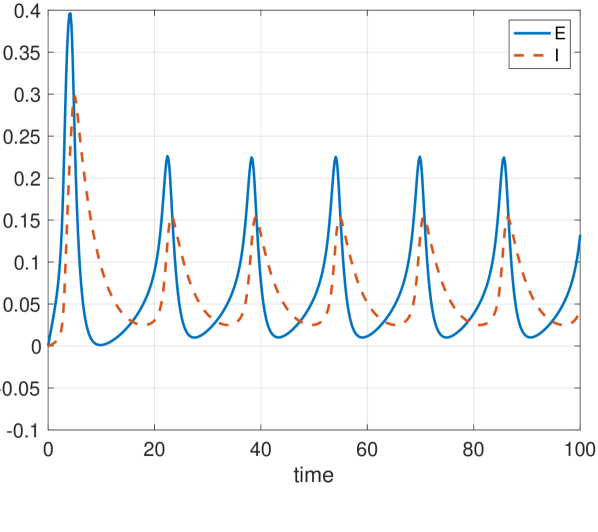
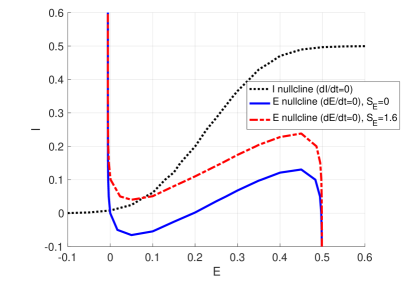
Since this work is mostly concerned with esophageal rhythmic response, we wish to further explain limit cycle oscillations. To understand the emergence of limit cycle oscillations, we employ phase analysis, displayed in Fig. S14. By doing so, we can clearly identify the threshold value the input needs to surpass to obtain transition from rest state (at ) to limit cycle oscillations. The axis are the state variables, and the curves are the nullclines ( and ). As increases, the nullcline shifts up, such that the intersection of the two curves is at the middle branch of the nullcline. As a results, a limit cycle solution emerges.
A chain of limit cycle oscillators is a well-studied system (114, 115). The oscillators in such a system are coupled, often identical, and each oscillator exhibits a limit cycle solution, independent of the coupling (55, 116, 53). Such systems often exhibit “frequency pulling”, where all oscillators converge into an entrained frequency. However, they are not synchronized, as there is phase shift between adjacent oscillators (114, 117). At steady state, the oscillators phase lock, meaning that they oscillate at constant phase from one another, creating a special case of synchrony (49, 118). This emerging pattern, known to be the fundamental solution of coupled system in equilibrium state, is the key element in creating the propagating attribute of the system (50, 54).
References
- Trayanova et al. (2011) Trayanova, N. A., J. Constantino, and V. Gurev, 2011. Electromechanical models of the ventricles. American Journal of Physiology-Heart and Circulatory Physiology 301:H279–H286.
- Du et al. (2010) Du, P., G. O’Grady, J. B. Davidson, L. K. Cheng, and A. J. Pullan, 2010. Multiscale modeling of gastrointestinal electrophysiology and experimental validation. Critical Reviews™ in Biomedical Engineering 38.
- Buijs et al. (2016) Buijs, F. N., L. León-Mercado, M. Guzmán-Ruiz, N. N. Guerrero-Vargas, F. Romo-Nava, and R. M. Buijs, 2016. The circadian system: a regulatory feedback network of periphery and brain. Physiology 31:170–181.
- Sundar et al. (2015) Sundar, I. K., H. Yao, M. T. Sellix, and I. Rahman, 2015. Circadian clock–coupled lung cellular and molecular functions in chronic airway diseases. American journal of respiratory cell and molecular biology 53:285–290.
- Rao and Gershon (2016) Rao, M., and M. D. Gershon, 2016. The bowel and beyond: the enteric nervous system in neurological disorders. Nature reviews Gastroenterology & hepatology 13:517–528.
- Drossman et al. (1993) Drossman, D. A., Z. Li, E. Andruzzi, R. D. Temple, N. J. Talley, W. Grant Thompson, W. E. Whitehead, J. Janssens, P. Funch-Jensen, E. Corazziari, et al., 1993. US householder survey of functional gastrointestinal disorders: prevalence, sociodemography, and health impact. Digestive diseases and sciences 38:1569–1580.
- Ouyang and Locke III (2007) Ouyang, A., and G. R. Locke III, 2007. Overview of neurogastroenterology-gastrointestinal motility and functional GI disorders: classification, prevalence, and epidemiology. Gastroenterology clinics of North America 36:485–498.
- Abramowitz et al. (2013) Abramowitz, L., N. Béziaud, L. Labreze, V. Giardina, C. Caussé, B. Chuberre, F. Allaert, and S. Perrot, 2013. Prevalence and impact of constipation and bowel dysfunction induced by strong opioids: a cross-sectional survey of 520 patients with cancer pain: DYONISOS study. Journal of medical economics 16:1423–1433.
- Tuteja et al. (2010) Tuteja, A., J. Biskupiak, G. Stoddard, and A. Lipman, 2010. Opioid-induced bowel disorders and narcotic bowel syndrome in patients with chronic non-cancer pain. Neurogastroenterology & Motility 22:424–e96.
- Lydon et al. (1999) Lydon, A. M., T. Cooke, F. Duggan, and G. D. Shorten, 1999. Delayed postoperative gastric emptying following intrathecal morphine and intrathecal bupivacaine. Canadian Journal of Anesthesia 46:544–549.
- Snyder and Vela (2023) Snyder, D. L., and M. F. Vela, 2023. Impact of opioids on esophageal motility. Neurogastroenterology & Motility e14587.
- Sobczak et al. (2014) Sobczak, M., M. Sałaga, M. A. Storr, and J. Fichna, 2014. Physiology, signaling, and pharmacology of opioid receptors and their ligands in the gastrointestinal tract: current concepts and future perspectives. Journal of gastroenterology 49:24–45.
- Ten Tusscher and Panfilov (2008) Ten Tusscher, K., and A. V. Panfilov, 2008. Modelling of the ventricular conduction system. Progress in biophysics and molecular biology 96:152–170.
- Du et al. (2018) Du, P., S. Calder, T. R. Angeli, S. Sathar, N. Paskaranandavadivel, G. O’Grady, and L. K. Cheng, 2018. Progress in mathematical modeling of gastrointestinal slow wave abnormalities. Frontiers in physiology 8:1136.
- Hardeland et al. (2012) Hardeland, R., J. A. Madrid, D.-X. Tan, and R. J. Reiter, 2012. Melatonin, the circadian multioscillator system and health: the need for detailed analyses of peripheral melatonin signaling. Journal of pineal research 52:139–166.
- Shahriari et al. (2020) Shahriari, D., D. Rosenfeld, and P. Anikeeva, 2020. Emerging frontier of peripheral nerve and organ interfaces. Neuron 108:270–285.
- Thomas (2008) Thomas, J., 2008. Opioid-induced bowel dysfunction. Journal of pain and symptom management 35:103–113.
- Albert-Vartanian et al. (2016) Albert-Vartanian, A., M. Boyd, A. Hall, S. Morgado, E. Nguyen, V. Nguyen, S. Patel, L. Russo, A. Shao, and R. Raffa, 2016. Will peripherally restricted kappa-opioid receptor agonists (pKORA s) relieve pain with less opioid adverse effects and abuse potential? Journal of Clinical Pharmacy and Therapeutics 41:371–382.
- Al-Hasani and Bruchas (2011) Al-Hasani, R., and M. R. Bruchas, 2011. Molecular mechanisms of opioid receptor-dependent signaling and behavior. The Journal of the American Society of Anesthesiologists 115:1363–1381.
- Clavé and Shaker (2015) Clavé, P., and R. Shaker, 2015. Dysphagia: current reality and scope of the problem. Nature Reviews Gastroenterology & Hepatology 12:259–270.
- Seguella and Gulbransen (2021) Seguella, L., and B. D. Gulbransen, 2021. Enteric glial biology, intercellular signalling and roles in gastrointestinal disease. Nature Reviews Gastroenterology & Hepatology 18:571–587.
- Park and Conklin (1999) Park, H., and J. L. Conklin, 1999. Neuromuscular control of esophageal peristalsis. Current gastroenterology reports 1:186–197.
- Fung and Vanden Berghe (2020) Fung, C., and P. Vanden Berghe, 2020. Functional circuits and signal processing in the enteric nervous system. Cellular and Molecular Life Sciences 77:4505–4522.
- Kulkarni et al. (2018) Kulkarni, S., J. Ganz, J. Bayrer, L. Becker, M. Bogunovic, and M. Rao, 2018. Advances in enteric neurobiology: the “brain” in the gut in health and disease. Journal of Neuroscience 38:9346–9354.
- Goyal and Chaudhury (2008) Goyal, R. K., and A. Chaudhury, 2008. Physiology of normal esophageal motility. Journal of clinical gastroenterology 42:610.
- Spencer and Hu (2020) Spencer, N. J., and H. Hu, 2020. Enteric nervous system: sensory transduction, neural circuits and gastrointestinal motility. Nature reviews Gastroenterology & hepatology 17:338–351.
- Patel and Thavamani (2023) Patel, K. S., and A. Thavamani, 2023. Physiology, peristalsis. In StatPearls [Internet], StatPearls Publishing.
- Mittal (2016) Mittal, R. K., 2016. Regulation and dysregulation of esophageal peristalsis by the integrated function of circular and longitudinal muscle layers in health and disease. American Journal of Physiology-Gastrointestinal and Liver Physiology 311:G431–G443.
- Sifrim and Jafari (2012) Sifrim, D., and J. Jafari, 2012. Deglutitive inhibition, latency between swallow and esophageal contractions and primary esophageal motor disorders. Journal of neurogastroenterology and motility 18:6.
- Woodland et al. (2013) Woodland, P., D. Sifrim, A. L. Krarup, C. Brock, J. B. Frøkjær, C. Lottrup, A. M. Drewes, L. L. Swanstrom, and A. D. Farmer, 2013. The neurophysiology of the esophagus. Annals of the New York Academy of Sciences 1300:53–70.
- Paterson (2006) Paterson, W. G., 2006. Esophageal peristalsis. GI Motility online .
- Pandolfino et al. (2009) Pandolfino, J., M. Fox, A. Bredenoord, and P. Kahrilas, 2009. High-resolution manometry in clinical practice: utilizing pressure topography to classify oesophageal motility abnormalities. Neurogastroenterology & Motility 21:796–806.
- Gorti et al. (2020) Gorti, H., S. Samo, N. Shahnavaz, and E. Qayed, 2020. Distal esophageal spasm: Update on diagnosis and management in the era of high-resolution manometry. World Journal of Clinical Cases 8:1026.
- Yadlapati et al. (2021) Yadlapati, R., P. J. Kahrilas, M. R. Fox, A. J. Bredenoord, C. Prakash Gyawali, S. Roman, A. Babaei, R. K. Mittal, N. Rommel, E. Savarino, et al., 2021. Esophageal motility disorders on high-resolution manometry: Chicago classification version 4.0©. Neurogastroenterology & Motility 33:e14058.
- Carlson et al. (2021) Carlson, D. A., A. J. Baumann, E. N. Donnan, A. Krause, W. Kou, and J. E. Pandolfino, 2021. Evaluating esophageal motility beyond primary peristalsis: assessing esophagogastric junction opening mechanics and secondary peristalsis in patients with normal manometry. Neurogastroenterology & Motility 33:e14116.
- Donnan and Pandolfino (2020) Donnan, E. N., and J. E. Pandolfino, 2020. EndoFLIP in the esophagus: assessing sphincter function, wall stiffness, and motility to guide treatment. Gastroenterology Clinics 49:427–435.
- Savarino et al. (2020) Savarino, E., M. Di Pietro, A. J. Bredenoord, D. A. Carlson, J. O. Clarke, A. Khan, M. F. Vela, R. Yadlapati, D. Pohl, J. E. Pandolfino, et al., 2020. Use of the functional lumen imaging probe in clinical esophagology. The American journal of gastroenterology 115:1786.
- Hirano et al. (2017) Hirano, I., J. E. Pandolfino, and G. E. Boeckxstaens, 2017. Functional lumen imaging probe for the management of esophageal disorders: expert review from the clinical practice updates committee of the AGA Institute. Clinical Gastroenterology and Hepatology 15:325–334.
- Carlson et al. (2015a) Carlson, D., Z. Lin, M. Rogers, C. Lin, P. Kahrilas, and J. Pandolfino, 2015. Utilizing functional lumen imaging probe topography to evaluate esophageal contractility during volumetric distention: a pilot study. Neurogastroenterology & Motility 27:981–989.
- Carlson et al. (2020a) Carlson, D. A., W. Kou, M. Masihi, S. Acharya, A. J. Baumann, E. N. Donnan, P. J. Kahrilas, and J. E. Pandolfino, 2020. Repetitive antegrade contraction: a novel response to sustained esophageal distension is modulated by cholinergic influence. American Journal of Physiology-Gastrointestinal and Liver Physiology 319:G696–G702.
- Goyal (2022) Goyal, R. K., 2022. EndoFLIP Topography: Motor Patterns in an Obstructed Esophagus. Gastroenterology 163:552–555.
- Carlson et al. (2018) Carlson, D. A., P. J. Kahrilas, K. Ritter, Z. Lin, and J. E. Pandolfino, 2018. Mechanisms of repetitive retrograde contractions in response to sustained esophageal distension: a study evaluating patients with postfundoplication dysphagia. American Journal of Physiology-Gastrointestinal and Liver Physiology 314:G334–G340.
- Carlson et al. (2020b) Carlson, D. A., W. Kou, and J. E. Pandolfino, 2020. The rhythm and rate of distension-induced esophageal contractility: a physiomarker of esophageal function. Neurogastroenterology & Motility 32:e13794.
- Halder et al. (2022) Halder, S., J. Yamasaki, S. Acharya, W. Kou, G. Elisha, D. A. Carlson, P. J. Kahrilas, J. E. Pandolfino, and N. A. Patankar, 2022. Virtual disease landscape using mechanics-informed machine learning: Application to esophageal disorders. Artificial Intelligence in Medicine 102435.
- Mercado-Perez and Beyder (2022) Mercado-Perez, A., and A. Beyder, 2022. Gut feelings: mechanosensing in the gastrointestinal tract. Nature Reviews Gastroenterology & Hepatology 19:283–296.
- Nishikawa et al. (2007) Nishikawa, K., A. A. Biewener, P. Aerts, A. N. Ahn, H. J. Chiel, M. A. Daley, T. L. Daniel, R. J. Full, M. E. Hale, T. L. Hedrick, et al., 2007. Neuromechanics: an integrative approach for understanding motor control. Integrative and comparative biology 47:16–54.
- Ijspeert (2008) Ijspeert, A. J., 2008. Central pattern generators for locomotion control in animals and robots: a review. Neural networks 21:642–653.
- Wilson and Cowan (1972) Wilson, H. R., and J. D. Cowan, 1972. Excitatory and inhibitory interactions in localized populations of model neurons. Biophysical journal 12:1–24. https://doi.org/10.1016/S0006-3495(72)86068-5.
- Kopell and Ermentrout (1986) Kopell, N., and G. B. Ermentrout, 1986. Symmetry and phaselocking in chains of weakly coupled oscillators. Communications on Pure and Applied Mathematics 39:623–660.
- Strogatz and Stewart (1993) Strogatz, S. H., and I. Stewart, 1993. Coupled oscillators and biological synchronization. Scientific american 269:102–109.
- Kopell and Ermentrout (1988) Kopell, N., and G. B. Ermentrout, 1988. Coupled oscillators and the design of central pattern generators. Mathematical biosciences 90:87–109.
- Smeal et al. (2010) Smeal, R. M., G. B. Ermentrout, and J. A. White, 2010. Phase-response curves and synchronized neural networks. Philosophical Transactions of the Royal Society B: Biological Sciences 365:2407–2422.
- Izhikevich (2000) Izhikevich, E. M., 2000. Phase equations for relaxation oscillators. SIAM Journal on Applied Mathematics 60:1789–1804.
- Kopell and Ermentrout (2003) Kopell, N., and G. B. Ermentrout, 2003. Chains of oscillators in motor and sensory systems.
- Cohen et al. (1992) Cohen, A. H., G. B. Ermentrout, T. Kiemel, N. Kopell, K. A. Sigvardt, and T. L. Williams, 1992. Modelling of intersegmental coordination in the lamprey central pattern generator for locomotion. Trends in neurosciences 15:434–438.
- Schwemmer and Lewis (2012) Schwemmer, M. A., and T. J. Lewis, 2012. The theory of weakly coupled oscillators. Phase response curves in neuroscience: theory, experiment, and analysis 3–31.
- Diamant (1997) Diamant, N. E., 1997. Neuromuscular mechanisms of primary peristalsis. The American journal of medicine 103:40S–43S.
- Yazaki and Sifrim (2012) Yazaki, E., and D. Sifrim, 2012. Anatomy and physiology of the esophageal body. Diseases of the Esophagus 25:292–298.
- McMahon et al. (2007) McMahon, B. P., J. B. Frøkjær, P. Kunwald, D. Liao, P. Funch-Jensen, A. M. Drewes, and H. Gregersen, 2007. The functional lumen imaging probe (FLIP) for evaluation of the esophagogastric junction. American Journal of Physiology-Gastrointestinal and Liver Physiology 292:G377–G384.
- Pedersen et al. (2005) Pedersen, J., A. M. Drewes, and H. Gregersen, 2005. New analysis for the study of the muscle function in the human oesophagus. Neurogastroenterology & Motility 17:767–772.
- Paterson et al. (1988) Paterson, W. G., S. Rattan, and R. Goyal, 1988. Esophageal responses to transient and sustained esophageal distension. American Journal of Physiology-Gastrointestinal and Liver Physiology 255:G587–G595.
- Gregersen et al. (2011) Gregersen, H., G. E. Villadsen, and D. Liao, 2011. Mechanical characteristics of distension-evoked peristaltic contractions in the esophagus of systemic sclerosis patients. Digestive diseases and sciences 56:3559–3568.
- Penagini et al. (1996) Penagini, R., A. Picone, and P. A. Bianchi, 1996. Effect of morphine and naloxone on motor response of the human esophagus to swallowing and distension. American Journal of Physiology-Gastrointestinal and Liver Physiology 271:G675–G680.
- Christensen (1970) Christensen, J., 1970. Patterns and origin of some esophageal responses to stretch and electrical stimulation. Gastroenterology 59:909–916.
- Villadsen et al. (2001) Villadsen, G., J. Storkholm, H. Zachariae, L. Hendel, F. Bendtsen, and H. Gregersen, 2001. Oesophageal pressure–cross-sectional area distributions and secondary peristalsis in relation to subclassification of systemic sclerosis. Neurogastroenterology & Motility 13:199–210.
- Abrahao Jr et al. (2011) Abrahao Jr, L., V. Bhargava, A. Babaei, A. Ho, and R. Mittal, 2011. Swallow induces a peristaltic wave of distension that marches in front of the peristaltic wave of contraction. Neurogastroenterology & Motility 23:201–e110.
- Gregersen and Lo (2018) Gregersen, H., and K. M. Lo, 2018. Pathophysiology and treatment of achalasia in a muscle mechanical perspective. Annals of the New York Academy of Sciences 1434:173–184.
- Carlson et al. (2015b) Carlson, D. A., Z. Lin, P. J. Kahrilas, J. Sternbach, E. N. Donnan, L. Friesen, Z. Listernick, B. Mogni, and J. E. Pandolfino, 2015. The Functional Lumen Imaging Probe Detects Esophageal Contractility Not Observed With Manometry in Patients With Achalasia. Gastroenterology 149:1742–1751. https://doi.org/10.1053/j.gastro.2015.08.005.
- Elisha et al. (2024) Elisha, G., R. Gast, S. Halder, S. A. Solla, P. J. Kahrilas, J. E. Pandolfino, and N. A. Patankar, 2024. Direct and retrograde signal propagation in unidirectionally coupled Wilson-Cowan oscillators. arXiv preprint arXiv:2402.18100 .
- Yeoh et al. (2017) Yeoh, J. W., A. Corrias, and M. L. Buist, 2017. Modelling human colonic smooth muscle cell electrophysiology. Cellular and molecular bioengineering 10:186–197.
- Yang et al. (2023) Yang, D., N. Almanzar, and I. M. Chiu, 2023. The role of cellular and molecular neuroimmune crosstalk in gut immunity. Cellular & Molecular Immunology 1–11.
- Rajendran et al. (2019) Rajendran, P. S., R. C. Challis, C. C. Fowlkes, P. Hanna, J. D. Tompkins, M. C. Jordan, S. Hiyari, B. A. Gabris-Weber, A. Greenbaum, K. Y. Chan, et al., 2019. Identification of peripheral neural circuits that regulate heart rate using optogenetic and viral vector strategies. Nature communications 10:1944.
- Jean (2001) Jean, A., 2001. Brain stem control of swallowing: neuronal network and cellular mechanisms. Physiological reviews 81:929–969.
- Harrington et al. (2007) Harrington, A., J. Hutson, and B. Southwell, 2007. Immunohistochemical localisation of cholinergic muscarinic receptor subtype 1 (M1r) in the guinea pig and human enteric nervous system. Journal of chemical neuroanatomy 33:193–201.
- Koh et al. (2022) Koh, S. D., B. T. Drumm, H. Lu, H. J. Kim, S.-B. Ryoo, H.-U. Kim, J. Y. Lee, P.-L. Rhee, Q. Wang, T. W. Gould, et al., 2022. Propulsive colonic contractions are mediated by inhibition-driven poststimulus responses that originate in interstitial cells of Cajal. Proceedings of the National Academy of Sciences 119:e2123020119.
- Acharya et al. (2021a) Acharya, S., S. Halder, D. A. Carlson, W. Kou, P. J. Kahrilas, J. E. Pandolfino, and N. A. Patankar, 2021. Assessment of esophageal body peristaltic work using functional lumen imaging probe panometry. American Journal of Physiology-Gastrointestinal and Liver Physiology 320:G217–G226.
- Halder et al. (2023) Halder, S., J. E. Pandolfino, P. J. Kahrilas, A. Koop, J. Schauer, I. K. Araujo, G. Elisha, W. Kou, N. A. Patankar, and D. A. Carlson, 2023. Assessing mechanical function of peristalsis with functional lumen imaging probe panometry: Contraction power and displaced volume. Neurogastroenterology & Motility 35:e14692.
- Jie et al. (2010) Jie, X., V. Gurev, and N. Trayanova, 2010. Mechanisms of mechanically induced spontaneous arrhythmias in acute regional ischemia. Circulation research 106:185–192.
- Jelinčić et al. (2022) Jelinčić, V., I. Van Diest, D. M. Torta, and A. von Leupoldt, 2022. The breathing brain: The potential of neural oscillations for the understanding of respiratory perception in health and disease. Psychophysiology 59:e13844.
- Andersson and Arner (2004) Andersson, K.-E., and A. Arner, 2004. Urinary bladder contraction and relaxation: physiology and pathophysiology. Physiological reviews 84:935–986.
- Berridge (2008) Berridge, M. J., 2008. Smooth muscle cell calcium activation mechanisms. The Journal of physiology 586:5047–5061.
- Jung and Vij (2021) Jung, T., and N. Vij, 2021. Early diagnosis and real-time monitoring of regional lung function changes to prevent chronic obstructive pulmonary disease progression to severe emphysema. Journal of Clinical Medicine 10:5811.
- Leclercq et al. (2002) Leclercq, C., O. Faris, R. Tunin, J. Johnson, R. Kato, F. Evans, J. Spinelli, H. Halperin, E. McVeigh, and D. A. Kass, 2002. Systolic improvement and mechanical resynchronization does not require electrical synchrony in the dilated failing heart with left bundle-branch block. Circulation 106:1760–1763.
- Usyk and Mcculloch (2003) Usyk, T. P., and A. D. Mcculloch, 2003. Relationship between regional shortening and asynchronous electrical activation in a three-dimensional model of ventricular electromechanics. Journal of cardiovascular electrophysiology 14:S196–S202.
- Niederer et al. (2011) Niederer, S. A., G. Plank, P. Chinchapatnam, M. Ginks, P. Lamata, K. S. Rhode, C. A. Rinaldi, R. Razavi, and N. P. Smith, 2011. Length-dependent tension in the failing heart and the efficacy of cardiac resynchronization therapy. Cardiovascular research 89:336–343.
- Orvar et al. (1993) Orvar, K. B., H. Gregersen, and J. Christensen, 1993. Biomechanical characteristics of the human esophagus. Digestive diseases and sciences 38:197–205.
- Neuhuber and Wörl (2016) Neuhuber, W. L., and J. Wörl, 2016. Enteric co-innervation of striated muscle in the esophagus: still enigmatic? Histochemistry and cell biology 146:721–735.
- Carlson et al. (2022) Carlson, D. A., J. E. Prescott, E. Germond, D. Brenner, M. Carns, C. S. Correia, M.-P. Tetreault, Z. H. McMahan, M. Hinchcliff, W. Kou, et al., 2022. Heterogeneity of primary and secondary peristalsis in systemic sclerosis: A new model of “scleroderma esophagus”. Neurogastroenterology & Motility 34:e14284.
- Acharya et al. (2021b) Acharya, S., W. Kou, S. Halder, D. A. Carlson, P. J. Kahrilas, J. E. Pandolfino, and N. A. Patankar, 2021. Pumping Patterns and Work Done During Peristalsis in Finite-Length Elastic Tubes. Journal of Biomechanical Engineering 143. http://dx.doi.org/10.1115/1.4050284.
- Lang et al. (2019) Lang, I. M., B. K. Medda, and R. Shaker, 2019. Characterization and mechanism of the esophago-esophageal contractile reflex of the striated muscle esophagus. American Journal of Physiology-Gastrointestinal and Liver Physiology 317:G304–G313.
- Sengupta (2000) Sengupta, J., 2000. An overview of esophageal sensory receptors. The American journal of medicine 108:87–89.
- Omari et al. (2022) Omari, T. I., A. Zifan, C. Cock, and R. K. Mittal, 2022. Distension contraction plots of pharyngeal/esophageal peristalsis: next frontier in the assessment of esophageal motor function. American Journal of Physiology-Gastrointestinal and Liver Physiology 323:G145–G156.
- Pehlevan et al. (2016) Pehlevan, C., P. Paoletti, and L. Mahadevan, 2016. Integrative neuromechanics of crawling in D. melanogaster larvae. Elife 5:e11031. https://doi.org/10.7554/eLife.11031.
- Gjorgjieva et al. (2013) Gjorgjieva, J., J. Berni, J. F. Evers, and S. J. Eglen, 2013. Neural circuits for peristaltic wave propagation in crawling Drosophila larvae: analysis and modeling. Frontiers in computational neuroscience 7:24.
- Hughes and Thomas (2007) Hughes, C. L., and J. B. Thomas, 2007. A sensory feedback circuit coordinates muscle activity in Drosophila. Molecular and Cellular Neuroscience 35:383–396.
- Nash and Panfilov (2004) Nash, M. P., and A. V. Panfilov, 2004. Electromechanical model of excitable tissue to study reentrant cardiac arrhythmias. Progress in biophysics and molecular biology 85:501–522.
- Elisha et al. (2022a) Elisha, G., S. Acharya, S. Halder, D. A. Carlson, W. Kou, P. J. Kahrilas, J. E. Pandolfino, and N. A. Patankar, 2022. Peristaltic regimes in esophageal transport. Biomechanics and Modeling in Mechanobiology 1–19. https://doi.org/10.1007/s10237-022-01625-x.
- Elisha et al. (2022b) Elisha, G., S. Halder, D. A. Carlson, W. Kou, P. J. Kahrilas, J. E. Pandolfino, and N. A. Patankar, 2022. A mechanics–based perspective on the function of human sphincters during functional luminal imaging probe manometry. (preprint).
- Ottesen (2003) Ottesen, J., 2003. Valveless pumping in a fluid-filled closed elastic tube-system: one-dimensional theory with experimental validation. Journal of Mathematical Biology 46:309–332. https://doi.org/10.1007/s00285-002-0179-1.
- Whittaker et al. (2010) Whittaker, R. J., M. Heil, O. E. Jensen, and S. L. Waters, 2010. A Rational Derivation of a Tube Law from Shell Theory. The Quarterly Journal of Mechanics and Applied Mathematics 63:465–496. https://doi.org/10.1093/qjmam/hbq020.
- Kwiatek et al. (2011) Kwiatek, M. A., I. Hirano, P. J. Kahrilas, J. Rothe, D. Luger, and J. E. Pandolfino, 2011. Mechanical Properties of the Esophagus in Eosinophilic Esophagitis. Gastroenterology 140:82–90. https://doi.org/10.1053/j.gastro.2010.09.037.
- Manopoulos et al. (2006) Manopoulos, C. G., D. S. Mathioulakis, and S. G. Tsangaris, 2006. One-dimensional model of valveless pumping in a closed loop and a numerical solution. Physics of Fluids 18:017106. https://doi.org/10.1063/1.2165780.
- Bringley et al. (2008) Bringley, T. T., S. Childress, N. Vandenberghe, and J. Zhang, 2008. An experimental investigation and a simple model of a valveless pump. Physics of Fluids 20:033602. https://doi.org/10.1063/1.2890790.
- Pullan et al. (2004) Pullan, A., L. Cheng, R. Yassi, and M. Buist, 2004. Modelling gastrointestinal bioelectric activity. Progress in biophysics and molecular biology 85:523–550.
- Chambers et al. (2008) Chambers, J. D., J. C. Bornstein, and E. A. Thomas, 2008. Insights into mechanisms of intestinal segmentation in guinea pigs: a combined computational modeling and in vitro study. American Journal of Physiology-Gastrointestinal and Liver Physiology 295:G534–G541.
- Elisha et al. (2023a) Elisha, G., S. Halder, S. Acharya, D. A. Carlson, W. Kou, P. J. Kahrilas, J. E. Pandolfino, and N. A. Patankar, 2023. A mechanics–based perspective on the function of the esophagogastric junction during functional luminal imaging probe manometry. Biomechanics and Modeling in Mechanobiology 1–19.
- Gregersen et al. (2008) Gregersen, H., J. Pedersen, and A. M. Drewes, 2008. Deterioration of muscle function in the human esophagus with age. Digestive diseases and sciences 53:3065–3070.
- Kou et al. (2015) Kou, W., J. E. Pandolfino, P. J. Kahrilas, and N. A. Patankar, 2015. Simulation studies of circular muscle contraction, longitudinal muscle shortening, and their coordination in esophageal transport. American Journal of Physiology-Gastrointestinal and Liver Physiology 309:G238–G247. https://doi.org/10.1152/ajpgi.00058.2015.
- Halder et al. (2021) Halder, S., S. Acharya, W. Kou, P. J. Kahrilas, J. E. Pandolfino, and N. A. Patankar, 2021. Mechanics informed fluoroscopy of esophageal transport. Biomechanics and Modeling in Mechanobiology 20. https://doi.org/10.1007/s10237-021-01420-0.
- Elisha et al. (2023b) Elisha, G., S. Halder, D. A. Carlson, P. J. Kahrilas, J. E. Pandolfino, and N. A. Patankar, 2023. A mechanics–based perspective on the pressure-cross-sectional area loop within the esophageal body. Frontiers in Physiology 13:2693.
- Wang (1999) Wang, D., 1999. Relaxation oscillators and networks. Wiley encyclopedia of electrical and electronics engineering 18:396–405.
- Cherubini et al. (2008) Cherubini, C., S. Filippi, P. Nardinocchi, and L. Teresi, 2008. An electromechanical model of cardiac tissue: Constitutive issues and electrophysiological effects. Progress in biophysics and molecular biology 97:562–573.
- Grasman (2012) Grasman, J., 2012. Asymptotic methods for relaxation oscillations and applications, volume 63. Springer Science & Business Media.
- Daniel et al. (1994) Daniel, E., B. Bardakjian, J. Huizinga, and N. Diamant, 1994. Relaxation oscillator and core conductor models are needed for understanding of GI electrical activities. American Journal of Physiology-Gastrointestinal and Liver Physiology 266:G339–G349.
- Jones and Kopell (2006) Jones, S., and N. Kopell, 2006. Local network parameters can affect inter-network phase lags in central pattern generators. Journal of mathematical biology 52:115–140.
- Collins and Stewart (1993) Collins, J. J., and I. N. Stewart, 1993. Coupled nonlinear oscillators and the symmetries of animal gaits. Journal of Nonlinear science 3:349–392.
- Wang (1995) Wang, D., 1995. Emergent synchrony in locally coupled neural oscillators. IEEE transactions on neural networks 6:941–948.
- Campbell and Wang (1996) Campbell, S., and D. Wang, 1996. Synchronization and desynchronization in a network of locally coupled Wilson-Cowan oscillators. IEEE transactions on neural networks 7:541–554.