Direct measure of DNA bending by quantum magnetic imaging of a nano-mechanical torque-balance
Abstract
DNA flexibility is a key determinant of biological function, from nucleosome positioning to transcriptional regulation, motivating a direct measurement of the bend-torque response of individual DNA molecules. In this work, DNA bending is detected using a nano-mechanical torque balance formed by tethering a ferromagnetic nanoparticle probe by an individual DNA molecule to a diamond magnetic field imager. The torque exerted by the DNA in response to bending caused by an applied magnetic torque is measured using wide-field imaging of quantum defects near the surface of the diamond. Qualitative measurements of differences in DNA bio-mechanical binding configuration are demonstrated, and as a proof-of-principle, a quantitative measurement of the bend response is made for individual DNA molecules. This quantum-enabled measurement approach could be applied to characterize the bend response of biophysically relevant short DNA molecules as well as the sequence dependence of DNA bending energy.
I Introduction
Although DNA is the chemical basis of the genetic code [1], the mechanical properties of DNA itself play a central mechanistic role in many cellular processes [2, 3, 4, 5, 6]. DNA can be modeled as an elastic rod with twist and bend degrees of freedom subject to thermal fluctuations [7]. On long length scales, the DNA conformation is described by the wormlike chain model (WLC) which depends on a single parameter, the persistence length nm [8]. However, the success of the WLC model on these long length scales does not imply that it is applicable at shorter, biologically-relevant length scales [9, 5]. In fact, both atomic-force-microscopy (AFM) imaging of DNA molecules adsorbed to mica [10] and cyclization measurements of molecules shorter than appear to demonstrate that DNA is much more flexible on short scales than predicted by the WLC model [11, 12, 13].
In spite of this previous experimental work, significant questions remain. The DNA cyclization approach suffers from several shortcomings: There remains debate in the literature about both (i) the measured factor values as well as (ii) about subtle and technical biochemical assumptions implicit to the interpretation [14]. Even if these cyclization results are sound, (iii) the mathematical dependence of the observable factor on the underlying DNA mechanics model is highly non-trivial. Although it is straightforward to determine whether a DNA mechanics model predicts the observed factor, the observed factor is insufficient to determine the DNA mechanics model [15]. We therefore classify the cyclization approach as an indirect measure of DNA mechanics. In contrast, we would classify AFM studies as a direct measurement of the DNA bending energy as a function of curvature; however, the interpretation of these experiments are subject to an assumption about whether the surface-adsorbed DNA molecules maintain the same mechanical properties as DNA in a physiologically relevant buffer [10]. Can a direct measurement of the DNA torque-bend relation be measured in solution? Single-molecule techniques have been developed to directly measure the torque-twist relation; however, no equivalent methods have yet been developed to directly measure the torque-bend relation [16, 17, 18].
A torque-balance assay measures the torque response as a function of bending angle. The challenge of realizing the DNA torque-balance assay lies in measuring the small torque exerted by individual DNA molecules and of probing the bend response at short length scales. In this work, we construct a nano-mechanical torque-balance to address both of these challenges. A ferromagnetic nanoparticle probe attached to one end of a single DNA molecule is used to bend the DNA molecule and to probe the bending response of DNA. At the far end from the ferromagnetic probe, the DNA molecule is constrained to a diamond quantum magnetic field sensor [Fig. 1(a)]. An external applied magnetic field exerts a torque on the probe which is balanced by the torque exerted by the DNA molecule. The probe magnetic moment and the applied magnetic field are measured simultaneously using a wide-field quantum magnetic probe imaging (magPI) platform comprising a near-surface ensemble of nitrogen-vacancy (NV) quantum defects in the diamond sensor [19]. By changing the orientation and strength of the applied magnetic field and measuring the orientation of the magnetic probe, we directly measure the DNA bend response as a function of bend angle. This quantum-enabled measurement scheme allows direct access to the bend response of individual DNA molecules, building on prior experiments using magnetic tweezers [20, 17].
Using the torque-balance assay, this paper aims to answer the following questions: (i) Can the torque exerted by DNA bending be measured directly? (ii) What is the energy requirement to bend 50 nm DNA molecules and (iii) sub-50 nm DNA molecules? The realization of the torque-balance assay affirmatively answers question (i). Additionally, we address question (ii) by measuring the bend response of a DNA molecule with contour length . The bend response of this molecule is found to be consistent with the WLC model prediction, which is expected at the long length-scale [10], demonstrating a technique that can be used towards a definitive answer to question (iii).
This paper is organized as follows. Section II introduces the nano-mechanical DNA torque-balance experimental assay, considers the required experimental parameters to probe the DNA bend response, and describes the DNA torque-balance construction. Section III details the wide-field quantum magPI platform used to measure the probe moment vector and applied external magnetic field vector. Section IV shows the ability of the assay to distinguish between three distinct DNA-probe configurations: an immobilized probe, a torsion-free DNA-tethered probe, and a probe in a torque-balance configuration. Section V presents the direct measurement of bend response as a function of bend angle for an individual 200 nm DNA molecule. Section VI provides an outlook towards using the torque-balance assay to build a quantitative understanding of the bending of short DNA molecules.
II Nano-mechanical torque-balance
II.1 Experimental principle
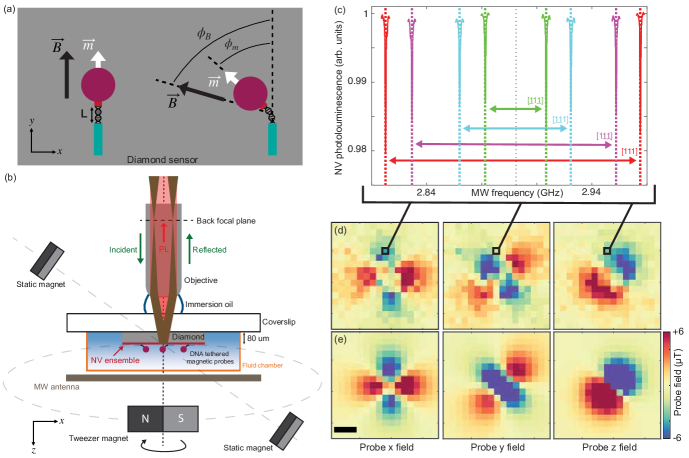
The nano-mechanical torque-balance [Fig. 1(a)] leverages the principle of mechanical equilibrium to measure the bend torque exerted by an individual DNA molecule. For a given applied field, the torques acting on the DNA-tethered magnetic probe are balanced:
| (1) |
where is the torque exerted by the DNA on the probe and
| (2) |
is the torque exerted by the applied magnetic field on the probe with magnetic moment . The probe must be strictly ferromagnetic so that is independent of . Additionally, must be spatially homogeneous such that the applied field only applies a torque and not a force on the magnetic probe.
Using the torque-balance, this work aims to test the applicability of the WLC model which treats DNA as a elastic rod with bend energy that is quadratic in bend angle [5]:
| (3) |
where is the DNA contour length, is the in-plane DNA bend angle and is the thermal energy. This model predicts that the torque exerted by DNA is linear in bend angle:
| (4) |
where is the out-of-plane DNA bend torque. The torque-balance assay directly interrogates the DNA bend-torque relation by measuring the probe moment vector as a response to varying applied field directions and magnitudes. If the DNA bend response is governed by the WLC, Eqs. 1 & 4 can be used to measure the WLC persistence length for a given DNA length . If the DNA bending is not described by the WLC model, the assay can illuminate the underlying DNA bending physics by measuring the functional dependence of bend torque on bend angle.
II.2 Ferromagnetic probe chosen to maximize sensitivity to DNA torque
To measure a bend response of the DNA molecule in the torque-balance assay, we must apply torques within the dynamic range of the assay. The torque dynamic range for a given DNA contour length is constrained by starting with the WLC prediction. Using Eq. 4, we predict that the torque required to bend a = 200 nm DNA molecule by = 1 rad is 1 pN nm. As detailed in the next section, applied magnetic fields on the order of 1 mT are used in the torque-balance assay, constraining the probe magnetic moment that can be used to measure the DNA molecule’s bend response to be approximately A m2. We satisfy this low magnetic moment requirement by using single-domain bio-compatible cobalt nanoparticles (Turbobeads GmbH): assuming a uniform bulk magnetization, we estimate the magnetic moment of the (approximately 30 nm) single-domain nanoparticles to be A m2. This moment magnitude enables a 2 pN nm applied torque in a 1 mT magnetic field, on the same order as and sufficient to probe the bend response of individual DNA molecules.
II.3 DNA-ferromagnetic probe torque-balance assay construction
For the DNA to exert a torque on the magnetic probe, we use “constrained” DNA molecules with multiple attachment points between both the sensor surface and the DNA and the DNA and magnetic probe. These constrained DNA molecules are engineered with two distinct lock-and-key binding pairs: digoxigenin/anti-digoxigenin for the surface-DNA attachments and biotin/streptavidin for the DNA-probe attachments [21]. To form the constrained DNA constructs, a free DNA fragment (of programmable length) is ligated together with an oligo containing multiple digoxigenin labels at one end, and an oligo containing multiple biotin labels at the far end. The free DNA fragment can be made arbitrarily short between the surface-DNA and DNA-probe linking oligos, in principle allowing for constructs with nanometer-scale free DNA lengths.
The protocol for assembling the DNA constructs on diamond (based on Refs. [21, 22]) is outlined here, and the full protocol is given in the Supplemental Material (SM) [23]. The diamond sensor is mounted to a glass coverslip and integrated into a fluid chamber with inlet and outlet ports. The construct reagents are introduced in solution one-by-one into the chamber and incubated for fixed time intervals. The un-bound excess is rinsed out using a phosphate-buffered-saline-based buffer. First, anti-digoxigenin is flowed in and non-specifically bound to the diamond surface. Then, a casein buffer is used to block the rest of the diamond surface to prevent non-specific binding of excess DNA molecules and magnetic probes. After surface blocking, the engineered DNA constructs are introduced and the digoxigenin ends bind to the anti-digoxigenin tethering sites at the diamond surface. Next, streptavidin-coated ferromagnetic probes are introduced that bind to the biotin end of the DNA molecules. Finally, the chamber is rinsed with experimental buffer.
III magPI measures both probe and applied magnetic fields
An essential component of the torque-balance assay is measurement of the applied magnetic torque on the DNA-tethered probe, requiring a technique that measures both the probe magnetic moment vector and applied magnetic field vector. The simultaneous measurement of these two vectors is enabled by the magPI platform comprising a high-density ensemble of NV defects in the top 150 nm of the diamond [24, 19]. A schematic of the bio-compatible platform is shown in Fig. 1(b). Magnetic probes are tethered by DNA molecules to a diamond sensor in a fluid chamber, and the NV defect electron spins are controlled with laser and microwave (MW) excitation. We image the emitted NV photoluminescence (PL) onto a sCMOS camera to enable wide-field vector magnetometry [25]. Further details about the magPI platform can be found in Sec. 2 in the SM [23].
Both probe and applied magnetic fields cause Zeeman splitting of the electron spin energy levels of the NV defects. Each camera pixel records the PL from several hundred NV centers that are oriented in four possible crystallographic directions [26]. From each pixel we measure an optically-detected-magnetic-resonance (ODMR) spectrum by sweeping the MW frequency and measuring the optical response. An example ODMR spectrum shown in Fig. 1(c) illustrates the four Zeeman projections associated with each NV orientation. Measuring the ODMR spectrum in wide-field enables mapping of the four Zeeman projections across an imaging field of view (Sec. 2.3 in SM [23]) [27]. These Zeeman maps are linearly transformed to maps of the lab-frame magnetic field vector components [Fig. 1(d)].
To perform this transformation, each Zeeman splitting must be assigned to a specific NV orientation, which in an arbitrary field is challenging due to the symmetry of the NV defect [26]. We break this symmetry by using an applied field comprising two superposing magnetic fields: a “static” field parallel to the [111] NV orientation and a rotating “tweezer” field parallel to the diamond plane [Fig. 1(b)]. This asymmetric total applied field with millitesla-magnitude enables each of the four Zeeman projections to be uniquely assigned (Sec. 2.4 in SM [23]). The total applied field is not fully in-plane as suggested by Fig. 1(a) because the static field has a small out-of-plane component.
The NVs measure both probe and applied magnetic fields, but these fields can be disentangled since the millitesla-scale applied field is homogeneous over the imaging field of view. The applied field is obtained by averaging the measured magnetic field across the image, and the microtesla-scale probe dipole field maps are obtained by subtracting off the applied field at each pixel.
To speed up data acquisition, which as will be seen is critical to minimize phototoxicity of the DNA tethers, we further exploit the mismatch in magnitudes between applied field and probe fields. The Zeeman splittings caused by the applied field are on the order of tens of MHz, while the Zeeman splittings caused by probe fields are tens to hundreds of kHz. We thus first measure the ODMR frequencies for a given applied field direction and magnitude in the absence of DNA-tethered magnetic probes [Fig. S5 in SM [23]], then during measurement of DNA tethers we only apply MW frequencies in a 3 MHz window around each ODMR for each applied field configuration [Fig. S6 in SM [23]].
The measured probe field lab-frame components [Fig. 1(d)] are fit by a least-squares method to a six-parameter magnetic dipole model [Fig. 1(e)] that enables determination of the probe position and magnetic moment vectors (Sec. 3 in SM [23]). As illustrated in the probe fields of Figs. 1(d) &( e), there is a discrepancy between the center regions of the experimental and modelled probe field images. This discrepancy exists because the probe dipole produces high magnetic field gradients that are unable to be imaged by the magPI platform. The large magnetic field gradients inhomogenously broaden the ODMR spectra, reducing ODMR contrast and washing out the probe field signal. To fit the probe moment vector, these high-gradient regions are masked (Sec. 3.1 in SM [23]). Errors associated with probe field fitting are discussed in Sec. 3.2 in the SM [23].
IV Differentiation between torsion-free and constrained DNA molecules
We first characterize the precision of the torque-balance assay by measuring the probe response of a series of constructs with known mechanical properties. These experimental tests validate the torque-balance assay’s ability to measure probe orientation, and to discern distinct bio-mechanical configurations by their responses to the applied field. The three experiments presented here examine the probe response to the applied field in the case of an immobilized probe, a torsion-free DNA-tethered-probe, and a constrained DNA-tethered probe like those used in the torque-balance assay.
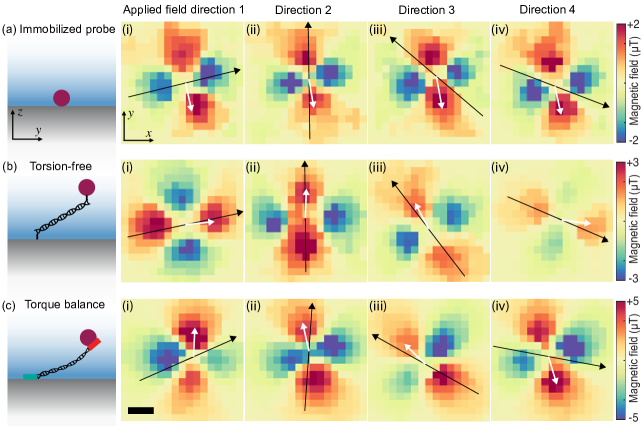
In the first experiment, the magnetic probe is immobilized on the diamond sensor surface [Fig. 2(a), left] in the absence of DNA. The probe magnetic moment is fixed by the surface interaction, independent of the applied field. This experiment provides a non-trivial experimental test: if the probe moment is found to reorient with applied field, then the probe may not be purely ferromagnetic and the platform is unable to measure both probe and applied fields. The immobilized probe response to applied field is shown in the image panels in Fig. 2(a), where the four images correspond to four different applied field directions. The in-plane probe magnetic moment vector is overlaid in white and the in-plane applied field vector is overlaid in black. As expected, for the immobilized probe, the measured probe moment vector points in an arbitrary fixed direction, independent of applied field. This result validates the magPI platform’s ability to sense both probe and applied fields and demonstrates probe ferromagnetism, crucial in order for probe direction to be correlated with DNA orientation.
In the second experiment, the probe is tethered by a torsion-free DNA molecule with a single digoxigenin and biotin marker at each end, meaning the surface-DNA and DNA-probe are attached by a single binding site [Fig. 2(b), left] [21, 19]. The torsion-free DNA tethered magnetic probe is thus free to align to the applied field. This experiment provides an additional set of experimental tests: if the torsion-free tethered probe is found to have a similar response to the immobilized probe, the DNA tethers are unable to be formed on diamond. Additionally, if the probe moment is found to deviate from the applied field direction, the DNA may be cooperatively adhering to the diamond surface. The torsion-free tethered probe response to applied field shown in Fig. 2(b) shows that the probe moment aligns to the applied field. This experiment demonstrates the ability of the magPI platform to effectively measure field-dependent probe orientation and validates the diamond-DNA tethering protocol.
In the third experiment, the torque-balance assay, the probe is tethered by a constrained DNA molecule [Fig. 2(c), left]. This experiment tests whether the assay can detect the multiple binding sites used with constrained tethers: if the response of the probe in this experiment is different from both the first two experiments, the assay is able to detect DNA back-action on the magnetic probe. The four images shown in Fig. 2(c) show a different magnetic probe response to the changing applied field direction compared to Fig. 2(a) and Fig. 2(b). In Fig. 2(c)(i), the probe is oriented away from the applied field direction, similar to the immobilized probe. Then, in Fig. 2(c)(ii)&(iii), the probe is oriented along the applied field direction, similar to the torsion-free probe. Finally, in Fig. 2(c)(iv) the probe is again oriented away from the applied field. The probe moment direction in this experiment is determined by both the torque exerted by the external field and the torque exerted by the DNA on the magnetic probe. As will be seen in the next section, the DNA bend torque magnitude can be quantified by measuring the deflection between probe orientation and applied field direction.
These three experiments demonstrate the assay’s ability to determine probe orientation, validate ferromagnetism of the probes, and observe back-action of the DNA on the magnetic probe due to bending torque.
V Direct measurement of the torque generated by DNA bending
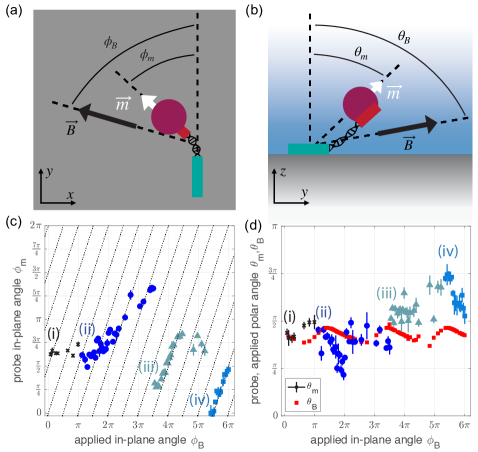
We obtain the bend response of a single 200 nm DNA molecule by measuring the probe response to a series of closely-spaced applied field angles. For each applied field angle, we measure the probe moment vector. The magnetic torque on the probe depends on the applied field vector and probe moment vector, as shown in Eq. 2. We thus first characterize the probe orientation defined by probe in-plane angle [Fig. 3(a)] and probe polar angle [Fig. 3(b)] over three full in-plane revolutions of the applied field. Fig. 3(c) shows as a function of applied field in-plane angle . Several distinct probe trajectories are observed. In the first trajectory [Fig. 3(c)(i)], the probe in-plane angle is relatively unchanging such that the probe appears immobilized, potentially caused by stochastic binding of the tether to the surface. In the second trajectory [Fig. 3(c)(ii)], after about half a revolution, the probe begins to follow the field, however, the slope of the trajectory is less steep than the torsion-free tether response (dashed lines). This indicates that the DNA is bending and the both the DNA and applied field are exerting a torque on the probe. After about a full revolution of applied field [Fig. 3(c)(iii)], the probe discontinuously jumps in orientation before resuming a near-linear response with applied field. After a final jump [Fig. 3(c)(iv)], the probe follows the dashed lines, appearing completely torsion-free, after which the probe signal vanishes. This suggests that the surface-DNA binding changes between (iii) and (iv) from a torque-balance to a torsion-free configuration, then laser-induced phototoxicity un-tethers the DNA or probe. The discrete jumps in are given by the probe reorienting in both the in-plane and polar direction as seen in Fig. 3(d).
Using probe in-plane angle , polar angle and the probe moment magnitude, we calculate the applied torque on the probe. For this DNA tether, the fitted probe magnitude is A m2, consistent with the predicted moment magnitude necessary to probe the DNA bend response (Sec. IIB). The out-of-plane component of applied torque is plotted as a function of applied field in-plane angle in Fig. 4(a). In the first trajectory [Fig. 4(a)(i)], is low because the angle between probe vector and applied field vector is small. In the second trajectory, [Fig. 4(a)(ii)], shows an approximately linear relationship with applied in-plane angle, indicating the influence of DNA bending. Between the second and third trajectories [Fig. 4(a)(ii) and (iii)], flips sign but maintains its magnitude of approximately 3 pN nm. Then, linearly scales for the remainder of the third trajectory, again representing the response of DNA bending. In the fourth trajectory [Fig. 4(a)(iv)], is measured to be approximately zero for the remainder of the trajectory, consistent with the torsion-free response seen in Fig. 3(c)(iv).
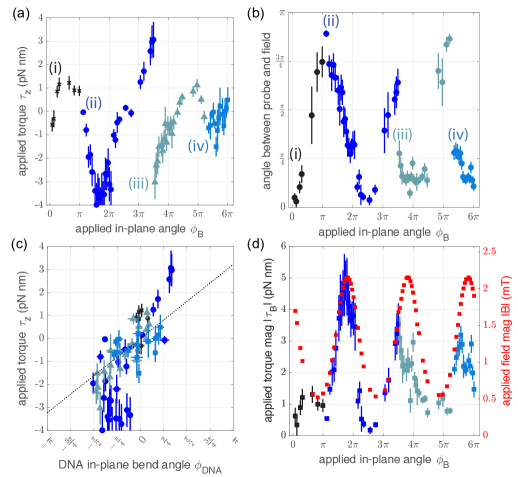
Using Eq. 4, we can quantify the DNA bend torque response by measuring the out-of-plane torque as a function of DNA in-plane bend angle, i.e. . for each trajectory is measured by subtracting the probe in-plane angle from a “home” orientation, so . For each trajectory (i)-(iv), the “home” orientation is taken as the probe angle for which is minimized. The applied torque is plotted as a function of DNA bend angle in Fig. 4(c). Additionally, the WLC model prediction (Eq. 4) with = 200 nm and = 50 nm is plotted as a dashed line.
For a 200 nm DNA tether, because , the hypothesis is the bending should be described by the WLC model prediction [5]. The data in Fig. 4(c) shows reasonable alignment with the WLC model prediction for , validating the torque-balance assay’s ability to measure DNA bend response. Interestingly, we do not observe in-plane bend angles above . This is due to the polar-angle reorientation of the probe moment vector at large applied torque, like between trajectories (ii) and (iii). However, we can observe in trajectory (ii) and to a lesser extent in trajectory (iii) that even before the reorientation there is a deviation between the WLC prediction and the bend response. This deviation could suggest an energetic model of DNA bending that is distinct from the WLC model, for example, a bend energy model that is quadratic for low bending angles but “turns on” a linear energy term for high bending angles [5, 15]. For a model of this type, the DNA bend-torque relation would be linear around zero bend angle and saturate for some critical bend angle. In order to fully understand the DNA bending, further measurements with varying applied torque magnitudes are required as discussed in the next section. In all experiments, the magnetic probe becomes un-tethered after minutes to hours under optical illumination.
As a consistency check, we show the total applied torque magnitude on the probe overlaid with the the applied field magnitude in Fig. 4(d), which qualitatively scale together. However, the four distinct trajectories show differing total applied torques, corroborating the analysis that the DNA configuration changes between each trajectory. Additionally, the angle between the probe vector and applied field vector shown in Fig. 4(b) shows a changing probe response to applied torque in each trajectory.
This direct measurement of the bend response of a 200 nm DNA molecule is validated by the low-bend-angle agreement with the WLC prediction. Additional higher-stiffness and torsion-free DNA tether torque responses are provided in Sec.4 of the SM [23]. These additional measurements illustrate the assay’s ability to characterize varying DNA bend responses, and also highlight the challenge of interpreting this response at the present state of this technology.
VI Conclusion and Outlook
In this work, a nano-mechanical torque-balance assay is used to measure the bend response of individual DNA molecules. A wide-field quantum magnetic probe imaging platform simultaneously measures both the vector magnetic field produced by DNA-tethered ferromagnetic probes and the applied magnetic field vector. The probe dipole magnetic field images are fit to measure the probe moment vector, and the platform is able to distinguish three distinct biomechanical configurations: immobilized probe, torsion-free DNA tether and constrained, multiply-bound DNA tether. For a 200 nm DNA molecule, we directly measure the bend response and find it to be consistent with the WLC model with = 50 nm.
This proof-of-principle demonstration of the torque-balance assay opens up the possibility of quantitative measurements of short DNA bending. The first measurement would be a controlled DNA molecule length-dependence study to identify the length scales over which the WLC model holds. The torque-balance DNA constructs used can be made arbitrarily short between the surface-DNA and DNA-probe linking oligos, allowing for measurements down to the nanometer length scale. Additionally, the assay could be used to measure sequence-dependent bending stiffness of individual DNA molecules [12] to provide insights about the effect of DNA form on function. However, to realize these controlled studies, an orthogonal imaging modality to validate the DNA constructs should be implemented. The control experiments in this work are able to differentiate between a torsion-free and torque-balance DNA tether, but with a separate structure imaging modality such as the dark-field tethered-particle-motion (DF-TPM) assay [28] the length of each DNA construct may be able to be measured independently. Using the DF-TPM assay to quantify DNA tether length is conceptually simple but is challenging to realize, as it requires a highly sensitive imaging apparatus to measure the low amount of probe-scattered-light at high enough speeds to capture the sub-millisecond DNA tether correlation time dynamics with sufficient signal-to-noise.
Several areas for further sensor development should be addressed to realize large-scale quantitative DNA bending measurements. While the use of magnetic probes circumvents bleaching of fluorescent probes, a significant challenge in this experiment is excitation-laser induced phototoxicity of DNA tethers which limits the amount of time (and number of applied magnetic field configurations) under which the tethers can be studied, even with total-internal-reflection excitation. In this work, we found the multiply-bound tethers in the torque-balance configuration to be more robust than the singly-bound torsion-free tethers, but both kinds of DNA tethers were eventually subject to phototoxicity, while the immobilized probes were robust to high-intensity and long time-scale laser illumination. Solutions for using sufficient laser power to excite the NV defects while limiting tether destruction are key to enable long-time-scale, high-sensitivity measurements.
Improving the yield of bound DNA tethers (approximately 1-3 per (50 µm)2 in this work) is also necessary, and may require new diamond surface preparation techniques such as with atomic layer deposition (ALD) of a different material [29] or direct surface-functionalization [30]. We found the DNA tether yield to be significantly higher on glass relative to diamond. To increase yield on diamond, ALD of alumina was done on one of two identical diamonds used in this work to try to mimic a glass surface. The DNA tether yield on the diamond surface after alumina ALD was not found to be statistically significant, so further explorations of surface preparation to increase DNA tether yield are warranted.
Next, we note that due to the single-pixel magnetic field gradients near the probe (Sec. II), we are unable to utilize a majority of probe signal to determine probe orientation and distance. A promising approach to reduce the pixel size and thus mitigate single-pixel inhomogeneous broadening is to use super-resolution magnetic field imaging [31]. This technique would increase sensitivity and spatial resolution of the probe field images, allowing for faster imaging with lower error on probe orientation fitting.
Another challenge is related to the vector magnetometry used in this work, which requires assigning each of the four measured Zeeman splittings to their corresponding NV crystallographic orientations. In the presence of small and symmetric magnetic fields, the orientation assignment is difficult because the ODMR spectra for the different NV orientations overlap. In this work, vector magnetometry is accomplished by applying a millitesla-scale asymmetric magnetic field. By using Fourier optical processing [32], the individual NV orientations can in principle be imaged separately using downstream optical components, which would provide several advantages. First, the Zeeman-to-NV-orientation assignment would always be known, unambiguously determining lab-frame magnetic field without calibration. Second, Fourier processing would omit the need for an asymmetric applied field. This would allow a single magnet to supply the applied field, making the applied field magnitude constant for differing field directions and significantly simplifying the interpretation of the DNA bend-torque response. Additionally, microtesla-scale applied fields could be used, enabling the use of larger moment probe magnets to apply the same magnitude torques on the DNA molecules for faster and more accurate probe orientation imaging.
In conclusion, we have developed a new biophysical assay that can directly measure the bend response of individual DNA molecules. This work combines the tethered-particle-motion assay, a long-standing workhorse of DNA single-molecule biophysics, with a magnetic tweezer and the high-sensitivity magnetic imaging enabled by NV quantum defects in diamond. With this proof-of-principle demonstration, we build towards a large-scale, quantitative measurement platform that could illuminate underlying DNA mechanics at biophysically-relevant short length-scales. More broadly, we show that advancements in quantum sensing technology may enable access to measurements of yet-unstudied fundamental biophysical phenomena.
Acknowledgements
We acknowledge Yuri Choe and David Bergsman for alumina atomic layer deposition, Kento Sasaki for supplying the microwave antenna used in this work, and Isaiah Kim for initial magnetic tweezer field calibration. This material is based on work supported by the National Science Foundation under Grant No. 1607869 and the University of Washington Materials Research Science and Engineering Center (MRSEC; DMR-1719797).
References
- Crick [1970] F. Crick, Nature 227, 561 (1970).
- Basu et al. [2021] A. Basu, D. G. Bobrovnikov, and T. Ha, J. Mol. Biol. 433, 166861 (2021).
- Finzi and Gelles [1995] L. Finzi and J. Gelles, Science 267, 378 (1995).
- Gelles and Landick [1998] J. Gelles and R. Landick, Cell 93, 13 (1998).
- Wiggins and Nelson [2006] P. A. Wiggins and P. C. Nelson, Phys. Rev. E Stat. Nonlin. Soft Matter Phys. 73, 031906 (2006).
- [6] B. Simpson, C. Tupper, and N. M. Al Aboud, “Genetics, DNA packaging,” https://europepmc.org/article/nbk/nbk534207, accessed: 2023-6-22.
- Bates and Maxwell [2005] A. D. Bates and A. Maxwell, DNA Topology (Oxford University Press, 2005).
- Bustamante et al. [2000] C. Bustamante, S. B. Smith, J. Liphardt, and D. Smith, Curr. Opin. Struct. Biol. 10, 279 (2000).
- Garcia et al. [2007] H. G. Garcia, P. Grayson, L. Han, M. Inamdar, J. Kondev, P. C. Nelson, R. Phillips, J. Widom, and P. A. Wiggins, Biopolymers 85, 115 (2007).
- Wiggins et al. [2006] P. A. Wiggins, T. van der Heijden, F. Moreno-Herrero, A. Spakowitz, R. Phillips, J. Widom, C. Dekker, and P. C. Nelson, Nat. Nanotechnol. 1, 137 (2006).
- Cloutier and Widom [2004] T. E. Cloutier and J. Widom, Mol. Cell 14, 355 (2004).
- Geggier and Vologodskii [2010] S. Geggier and A. Vologodskii, Proc. Natl. Acad. Sci. U. S. A. 107, 15421 (2010).
- Vafabakhsh and Ha [2012] R. Vafabakhsh and T. Ha, Science 337, 1097 (2012).
- Du et al. [2005] Q. Du, C. Smith, N. Shiffeldrim, M. Vologodskaia, and A. Vologodskii, Proceedings of the National Academy of Sciences 102, 5397 (2005).
- Drozdetski et al. [2019] A. V. Drozdetski, A. Mukhopadhyay, and A. V. Onufriev, Frontiers in Physics 7 (2019).
- Strick et al. [2000] T. Strick, J. Allemand, V. Croquette, and D. Bensimon, Prog. Biophys. Mol. Biol. 74, 115 (2000).
- Gore et al. [2006] J. Gore, Z. Bryant, M. Nöllmann, M. U. Le, N. R. Cozzarelli, and C. Bustamante, Nature 442, 836 (2006).
- Neuman [2010] K. C. Neuman, J. Biol. Chem. 285, 18967 (2010).
- Kazi et al. [2021] Z. Kazi, I. M. Shelby, H. Watanabe, K. M. Itoh, V. Shutthanandan, P. A. Wiggins, and K.-M. C. Fu, Phys. Rev. Appl. 15, 054032 (2021).
- Strick et al. [1998] T. R. Strick, V. Croquette, and D. Bensimon, Proc. Natl. Acad. Sci. U. S. A. 95, 10579 (1998).
- Kovari et al. [2018] D. T. Kovari, Y. Yan, L. Finzi, and D. Dunlap, Methods Mol. Biol. 1665, 317 (2018).
- Yang et al. [2016] D. Yang, A. Ward, K. Halvorsen, and W. P. Wong, Nat. Commun. 7, 11026 (2016).
- Kazi [2024] Z. Kazi, “Supplemental material,” (2024).
- Kleinsasser et al. [2016] E. E. Kleinsasser, M. M. Stanfield, J. K. Q. Banks, Z. Zhu, W.-D. Li, V. M. Acosta, H. Watanabe, K. M. Itoh, and K.-M. C. Fu, Appl. Phys. Lett. 108, 202401 (2016).
- Levine et al. [2019] E. V. Levine, M. J. Turner, P. Kehayias, C. A. Hart, N. Langellier, R. Trubko, D. R. Glenn, R. R. Fu, and R. L. Walsworth, Nanophotonics 8, 1945 (2019).
- Abe and Sasaki [2018] E. Abe and K. Sasaki, J. Appl. Phys. 123, 161101 (2018).
- Fescenko et al. [2019] I. Fescenko, A. Laraoui, J. Smits, N. Mosavian, P. Kehayias, J. Seto, L. Bougas, A. Jarmola, and V. M. Acosta, Phys Rev Appl 11 (2019).
- Milstein et al. [2011] J. N. Milstein, Y. F. Chen, and J.-C. Meiners, Biopolymers 95, 144 (2011).
- Xie et al. [2022] M. Xie, X. Yu, L. V. H. Rodgers, D. Xu, I. Chi-Durán, A. Toros, N. Quack, N. P. de Leon, and P. C. Maurer, Proc. Natl. Acad. Sci. U. S. A. 119 (2022).
- Rodgers et al. [2023] L. V. H. Rodgers, S. T. Nguyen, J. H. Cox, K. Zervas, Z. Yuan, S. Sangtawesin, A. Stacey, C. Jaye, C. Weiland, A. Pershin, A. Gali, L. Thomsen, S. A. Meynell, L. B. Hughes, A. C. Bleszynski Jayich, X. Gui, R. J. Cava, R. R. Knowles, and N. P. de Leon, arXiv 2309.07354 (2023).
- Mosavian et al. [2023] N. Mosavian, F. Hubert, J. Smits, P. Kehayias, Y. Silani, B. A. Richards, and V. M. Acosta, arXiv 2310.05436 (2023).
- Backlund et al. [2017] M. P. Backlund, P. Kehayias, and R. L. Walsworth, Phys. Rev. Appl. 8, 054003 (2017).