The dark timbre of gravitational waves
Abstract
Gravitational wave timbre, the relative amplitude and phase of the different harmonics, can change due to interactions with low-mass halos. We focus on binaries in the LISA range and find that the integrated lens effect of cold dark matter structures can be used to probe the existence of halos if a single binary with eccentricity is detected with a signal-to-noise ratio .
Introduction – Gravitational waves (GWs) are often associated with sound because they are characterized by waveforms and in general, there is a poorer angular resolution than with electromagnetic signals. Like with sound, for GWs there is also the notion of timbre since eccentric binaries emit GWs in different harmonics simultaneously. The relative powers of the harmonics are determined by the binary eccentricity and the harmonic numbers Peters and Mathews (1963).
GWs are sensitive to wave optics interactions with small halos which can leave detectable imprints in the waveform Takahashi and Nakamura (2003); Fairbairn et al. (2023); Çalışkan et al. (2023); Savastano et al. (2023); Tambalo et al. (2023); Ma et al. (2023); Cremonese et al. (2021); Urrutia et al. (2023) or a phase difference with respect to an electromagnetic counterpart Takahashi (2017); Morita and Soda (2019); Ezquiaga et al. (2020); Suyama (2020). Both methods rely on frequency-dependent effects for detectability.
In this work, we propose a novel probe of the wave optics effects: measurements of the timbre of the GW signal from an eccentric binary. Furthermore, we considered not only the effect of a single encounter but the integrated effect of light halos which the GW signal is expected to encounter. We study if the measurements of the timbre can be used to probe the low mass end of the dark matter (DM) halo mass function (HMF) where deviations from the cold dark matter (CDM) predictions may appear. For example, the small-scale structures are suppressed in models of warm or ultralight DM models Bode et al. (2001); Hui et al. (2017); Rogers and Peiris (2021).
We focus on signals whose frequency does not change significantly. In the LISA sensitivity range, such signals can originate e.g. from intermediate-mass black holes or extreme mass ratio binaries Barack and Cutler (2007); Babak et al. (2017); Berry et al. (2019); Gair et al. (2017); Hannuksela et al. (2019); Bonetti and Sesana (2020). We compute the integrated effect of the DM halo population and show that very light halos, which are integrated out in weak lensing studies as a constant density field Bartelmann and Schneider (2001), induce changes in the amplitude and phases of the different harmonics of a mHz GW signal, effectively changing the timbre by the imprints of these light DM structures. The effect is detectable with LISA in the first harmonics if the binary has a signal-to-noise between and has eccentricity . We find that the effect mainly comes from halos of . Such light halos are a prediction of CDM but so far have eluded observations Zavala and Frenk (2019). Therefore, its detection would provide a probe of the low mass tail of the HFM and severely constraint deviations from CDM at small scales.
Lensing by a single halo – Consider a binary whose orbital frequency remains almost constant during the observation. We denote the angular diameter distance of the binary by , where is the corresponding redshift and is the comoving distance, and assume that the GW signal emitted by the binary interacts with a halo at angular diameter distance . In the frequency domain, the lensed waveform is , where denotes the unperturbed GW signal. The amplification factor in the thin-lens approximation is given by Schneider et al. (2012)
| (1) |
which is an integral over the lens plane of all the paths that the GW can take through it and the prefactor ensures that in the absence of the lens . We define a characteristic length scale and dimensionful vectors that denote the position of the source in the source plane and the position at which the GW crosses the lens plane . The dimensionless vectors and are defined as and . The dimensionless frequency and the dimensionless time delay function then become
| (2) | |||
| (3) |
where and is defined such that .
We approximate the halos by the NFW profile , which corresponds to the lens potential (see e.g. Fairbairn et al. (2023))
| (4) |
where and and are dimensionless parameters. The distances are scaled by , where denotes the point mass Einstein radius, so the dimensionless frequency simplifies to . The NFW profile is parameterized by the scale radius and the corresponding density , which are both functions of the halo virial mass . For halos as light as the ones we will consider interactions with stars can affect the profile. However, the survival rate is expected to be high Delos (2019); Hayashi et al. (2003); van den Bosch et al. (2018); Taylor and Babul (2001); van den Bosch et al. (2005); Berezinsky et al. (2008); Penarrubia and Benson (2005) so we can safely use the NFW profile.
In the geometric limit, the GW follows a single classical trajectory, the minimal time path, around the NFW halo. The interaction lacks interference patterns and induces a frequency-independent amplification Takahashi and Nakamura (2003),
| (5) |
where and corresponds to the classical path. However, in the wave optics regime, the amplification becomes frequency dependent, and numerical computation of Eq. (1) is necessary.111We do it by computing the method introduced in Takahashi (2004).
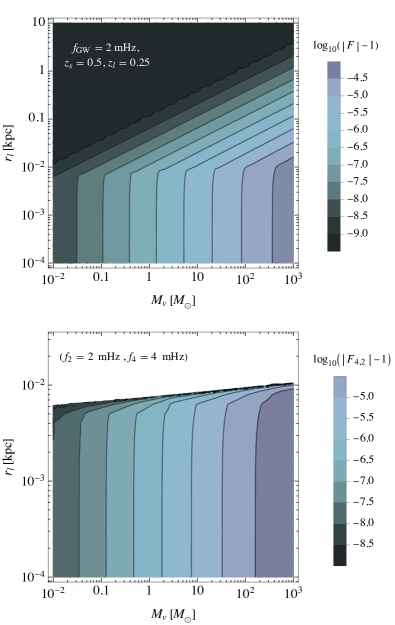
In the upper panel of Fig. 1, we show the amplification for different halo masses and distances in the lens plane. We have fixed the signal frequency to mHz, the source redshift to , and the lens is positioned at half the redshift. For a fixed halo mass in the wave optics regime, the interaction is independent of the projected position of the source in the lens plane. In the geometric optics regime, the amplification effect rapidly decreases with , roughly as but increases with the lens mass,222Linear scaling at a fixed frequency is expected if and didn’t change with . We find a slightly stronger scaling mainly because the compactness of the halos mildly decreases with decreasing . roughly as . The dividing distance between the wave optics and geometric optics regimes, on the other hand, increases very slowly with remaining slightly below pc in the shown mass range.
Whereas a circular binary emits GWs only at twice its orbital frequency, an eccentric binary emits at all integer multiples of it Peters and Mathews (1963),
| (6) |
The different harmonics get amplified by different amounts as the lensing effect is frequency-dependent. This is the dark timbre effect. In the lower panel of Fig. 1, we show the magnitude of the ratio of amplification factors that characterize the shift in the timbre,
| (7) |
between the second and the fourth harmonic of an eccentric binary with orbital frequency mHz. As expected, there is no difference in the geometric optics regime’s amplification factor for high-impact parameters. Only the halos in the wave optics regime, pc, modify the timbre of the signal. The phase difference is similar in magnitude to the amplification factor ratio.
Total lens effect – The effect of a single lens is characterized by the lens redshift , the projected distance of the source in the lens plane and the halo mass . We estimate the modification of the timbre caused by all of the halos the signal encounters in the wave optics regime on its way from the source to the detector by generating configurations of the heaviest lenses and estimating the expected effect from the light halos.
We consider only halos inside the wave optics regime, , since those are the only ones causing a frequency dependent effect. The total number of halos within that radius is
| (8) |
where is the HMF which we compute using the extended Press-Schechter formalism Press and Schechter (1974); Bond et al. (1991) with the CDM power spectrum Eisenstein and Hu (1998). From Eq. (8), we can identify the probability densities of the lens parameters:
| (9) | ||||
We generate realizations of the lenses with mass that the signal encounters by sampling the probability distributions (LABEL:eq:prob) and approximate their total effect by taking a product of the amplifications caused by each of the lenses:
| (10) | ||||
Here is sampled from a Poisson distribution with mean in the mass range and the approximation holds because . We generate realizations to estimate the distribution of .
For light halos with , the Poisson fluctuations are negligible because their number inside the wave optics regime is very large. Therefore, the effect they cause does not change significantly between different paths and the distribution of the total lensing factor
| (11) |
can then be estimated by convoluting the distribution of with , where
| (12) |
is the expected effect from the light halos. The sum in (12) is over mass bins, is the expected deviation of the lensing factor from unity for halos in the mass bin and is the number of halos in the wave optics regime in that bin. This results in a translation of the distribution from heavy halos by adding the integrated effect of the light ones.
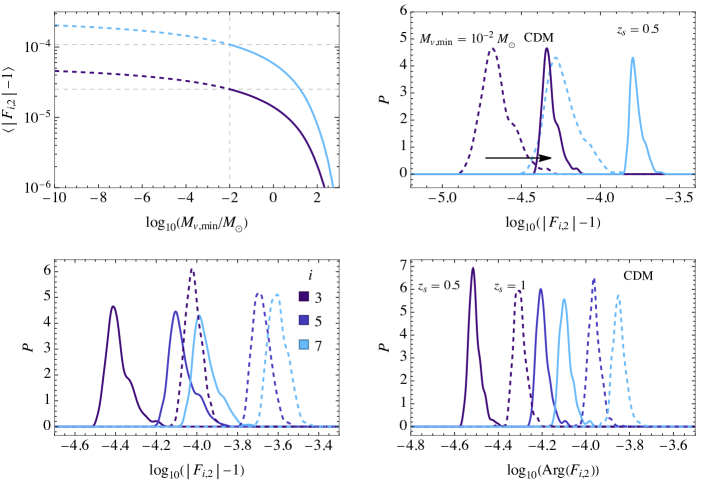
In the upper panels of Fig. 2 we show what is the effect of adding the lightest halos. On the left panel, we can see how halos heavier than are not contributing significantly. The reason for that is that they are too rare to fill the wave optics lensing tube. The main effect comes from halos between being the ones that give the biggest contribution. Beyond the effect increases very slowly and we have explicitly checked that it converges. Halos lighter than change the total lensing effect by an factor. On the right panel, we can see how the distributions are shifted by adding the contribution from the lightest halos.
In the lower panels of Fig. 2 we show the probability distribution of the modulus and the argument of the amplification ratio between the second and the third, the fifth and the seventh harmonic for the same benchmark case as in Fig. 1, for (solid lines) and (dashed lines). On the left panel, we see that the differences are of order for and up to for . We can see that the distribution of the phase difference scales as expected concerning the amplifications, goes up to or for and respectively.
Previous GW microlensing studies have focused on searching for halos with , which causes a larger effect. However, for realistic profiles like either Einasto Retana-Montenegro et al. (2012) or NFW, the effect in the geometric limit is just a constant amplification Fairbairn et al. (2023) that is degenerate with the rest of the parameters. The lensing tube where wave optics effects are relevant is fixed by the frequency of the GW and the mass of the halo. For the LISA frequencies and halos with the expected number of halos in the wave optics tube is very small and, consequently, it is not expected that LISA would see any such lensed events Fairbairn et al. (2023). In this study, we instead consider much lighter halos which are expected, assuming the CDM model, to induce wave optics effects in all of the GW events that LISA will see. The next section discusses the precision necessary to test and detect this effect.
Detectability and prospects – To detect this effect, we require that the signal with the shifted timbre can not fit well with a template using the standard timbre. In general, the wellness of a template fit is given by Jaranowski and Krolak (2005)
| (13) |
where refers to the GW signal and the template parameterized by . For a binary that evolves very slowly, the waveform is approximately a sum of delta functions and Eq. (13) simplifies to
| (14) | ||||
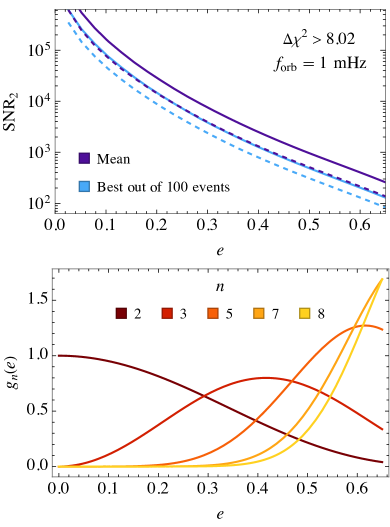
where characterizes the amplitude of the signal and is the signal-to-noise ratio of the second harmonic. The template is parameterized by an amplitude , an eccentricity , and a phase . The function is the relative power radiated in the th harmonic by a binary with eccentricity Peters and Mathews (1963). We show for some of the lowest harmonics in the lower panel of Fig. 3.
For the spectral sensitivity we use the proposed spectral sensitivity for LISA Amaro-Seoane et al. (2017); Robson et al. (2019) including the galactic and extragalactic foregrounds Lewicki and Vaskonen (2023). We considered sources at and at with mHz. To assess the detectability of the shifted timbre effect, we consider only the harmonics which dominate the signal for , as seen in the lower panel of Fig. 3. As benchmarks, we consider 1) the mean values for and 2) the best out of 100 events. We determine how large needs to be for a given so that the shifted timbre is detectable. We use the threshold corresponding to CL for a template with three parameters. In the upper panel of Fig. 3, we show that if we consider (full lines) then is required if but for it is enough to have . The required is about a factor 3 smaller for the best out of 100 events than for the mean. These SNRs seem within the reach of LISA for sufficiently nearby sources.
The precision at which the amplitudes of a harmonic can be resolved is
| (15) |
which is easy to show from Fisher analysis Poisson and Will (1995). This implies that a higher is necessary to resolve the relative amplification factors than to detect the dark timbre. Optimistically, if a population of eccentric binaries is detected with it would be possible to reconstruct the PDFs of and probe the HMF down to . However, already the detection of one sufficiently eccentric binary with would tell about the existence of halos with .
Conclusions – We have estimated for the first time the integrated lensing effect of light halos on the mid-frequency (mHz) gravitational wave signals. We have proposed to test these effects using the different harmonics of an eccentric binary. We have shown that the wave optics effects due to the low mass dark matter halos, , induce frequency-dependent changes in the amplitude and phase of the harmonics, the timbre of the signal. This shifted timbre is detectable in the 7 dominant harmonics of the signal for signal-to-noise ratios between if the binary eccentricity is . If such binaries exist, LISA could probe the shifted timbre. This would open a new avenue to test low-mass dark matter halos and thus provide new insights into the nature of dark matter.
Acknowledgements.
Acknowledgments – We thank Luca Marzola and Hardi Veermäe for useful suggestions. This work was supported by the Estonian Research Council grants PRG803, PSG869, RVTT3 and RVTT7 and the Center of Excellence program TK202. The work of V.V. was partially supported by the European Union’s Horizon Europe research and innovation program under the Marie Skłodowska-Curie grant agreement No. 101065736.References
- Peters and Mathews (1963) P. C. Peters and J. Mathews, Phys. Rev. 131, 435 (1963).
- Takahashi and Nakamura (2003) R. Takahashi and T. Nakamura, Astrophys. J. 595, 1039 (2003), arXiv:astro-ph/0305055 .
- Fairbairn et al. (2023) M. Fairbairn, J. Urrutia, and V. Vaskonen, JCAP 07, 007 (2023), arXiv:2210.13436 [astro-ph.CO] .
- Çalışkan et al. (2023) M. Çalışkan, N. Anil Kumar, L. Ji, J. M. Ezquiaga, R. Cotesta, E. Berti, and M. Kamionkowski, Phys. Rev. D 108, 123543 (2023), arXiv:2307.06990 [astro-ph.CO] .
- Savastano et al. (2023) S. Savastano, G. Tambalo, H. Villarrubia-Rojo, and M. Zumalacarregui, Phys. Rev. D 108, 103532 (2023), arXiv:2306.05282 [gr-qc] .
- Tambalo et al. (2023) G. Tambalo, M. Zumalacárregui, L. Dai, and M. H.-Y. Cheung, Phys. Rev. D 108, 103529 (2023), arXiv:2212.11960 [astro-ph.CO] .
- Ma et al. (2023) H. Ma, Y. Lu, Z. Chen, and Y. Chen, Mon. Not. Roy. Astron. Soc. 524, 2954 (2023), arXiv:2307.02742 [astro-ph.CO] .
- Cremonese et al. (2021) P. Cremonese, J. M. Ezquiaga, and V. Salzano, Phys. Rev. D 104, 023503 (2021), arXiv:2104.07055 [astro-ph.CO] .
- Urrutia et al. (2023) J. Urrutia, V. Vaskonen, and H. Veermäe, Phys. Rev. D 108, 023507 (2023), arXiv:2303.17601 [astro-ph.CO] .
- Takahashi (2017) R. Takahashi, Astrophys. J. 835, 103 (2017), arXiv:1606.00458 [astro-ph.CO] .
- Morita and Soda (2019) T. Morita and J. Soda, (2019), arXiv:1911.07435 [gr-qc] .
- Ezquiaga et al. (2020) J. M. Ezquiaga, W. Hu, and M. Lagos, Phys. Rev. D 102, 023531 (2020), arXiv:2005.10702 [astro-ph.CO] .
- Suyama (2020) T. Suyama, Astrophys. J. 896, 46 (2020), arXiv:2003.11748 [gr-qc] .
- Bode et al. (2001) P. Bode, J. P. Ostriker, and N. Turok, Astrophys. J. 556, 93 (2001), arXiv:astro-ph/0010389 .
- Hui et al. (2017) L. Hui, J. P. Ostriker, S. Tremaine, and E. Witten, Phys. Rev. D 95, 043541 (2017), arXiv:1610.08297 [astro-ph.CO] .
- Rogers and Peiris (2021) K. K. Rogers and H. V. Peiris, Phys. Rev. Lett. 126, 071302 (2021), arXiv:2007.12705 [astro-ph.CO] .
- Barack and Cutler (2007) L. Barack and C. Cutler, Phys. Rev. D 75, 042003 (2007), arXiv:gr-qc/0612029 .
- Babak et al. (2017) S. Babak, J. Gair, A. Sesana, E. Barausse, C. F. Sopuerta, C. P. L. Berry, E. Berti, P. Amaro-Seoane, A. Petiteau, and A. Klein, Phys. Rev. D 95, 103012 (2017), arXiv:1703.09722 [gr-qc] .
- Berry et al. (2019) C. P. L. Berry, S. A. Hughes, C. F. Sopuerta, A. J. K. Chua, A. Heffernan, K. Holley-Bockelmann, D. P. Mihaylov, M. C. Miller, and A. Sesana, (2019), arXiv:1903.03686 [astro-ph.HE] .
- Gair et al. (2017) J. R. Gair, S. Babak, A. Sesana, P. Amaro-Seoane, E. Barausse, C. P. L. Berry, E. Berti, and C. Sopuerta, J. Phys. Conf. Ser. 840, 012021 (2017), arXiv:1704.00009 [astro-ph.GA] .
- Hannuksela et al. (2019) O. A. Hannuksela, K. W. K. Wong, R. Brito, E. Berti, and T. G. F. Li, Nature Astron. 3, 447 (2019), arXiv:1804.09659 [astro-ph.HE] .
- Bonetti and Sesana (2020) M. Bonetti and A. Sesana, Phys. Rev. D 102, 103023 (2020), arXiv:2007.14403 [astro-ph.GA] .
- Bartelmann and Schneider (2001) M. Bartelmann and P. Schneider, Phys. Rept. 340, 291 (2001), arXiv:astro-ph/9912508 .
- Zavala and Frenk (2019) J. Zavala and C. S. Frenk, Galaxies 7, 81 (2019), arXiv:1907.11775 [astro-ph.CO] .
- Schneider et al. (2012) P. Schneider, J. Ehlers, and E. Falco, Gravitational Lenses, Astronomy and Astrophysics Library (Springer New York, 2012).
- Delos (2019) M. S. Delos, Phys. Rev. D 100, 083529 (2019), arXiv:1907.13133 [astro-ph.CO] .
- Hayashi et al. (2003) E. Hayashi, J. F. Navarro, J. E. Taylor, J. Stadel, and T. R. Quinn, Astrophys. J. 584, 541 (2003), arXiv:astro-ph/0203004 .
- van den Bosch et al. (2018) F. C. van den Bosch, G. Ogiya, O. Hahn, and A. Burkert, Mon. Not. Roy. Astron. Soc. 474, 3043 (2018), arXiv:1711.05276 [astro-ph.GA] .
- Taylor and Babul (2001) J. E. Taylor and A. Babul, Astrophys. J. 559, 716 (2001), arXiv:astro-ph/0012305 .
- van den Bosch et al. (2005) F. C. van den Bosch, G. Tormen, and C. Giocoli, Mon. Not. Roy. Astron. Soc. 359, 1029 (2005), arXiv:astro-ph/0409201 .
- Berezinsky et al. (2008) V. Berezinsky, V. Dokuchaev, and Y. Eroshenko, Phys. Rev. D 77, 083519 (2008), arXiv:0712.3499 [astro-ph] .
- Penarrubia and Benson (2005) J. Penarrubia and A. J. Benson, Mon. Not. Roy. Astron. Soc. 364, 977 (2005), arXiv:astro-ph/0412370 .
- Takahashi (2004) R. Takahashi, Wave Effects in the Gravitational Lensing of Gravitational Waves from Chirping Binaries, Ph.D. thesis, Department of Physics, Kyoto University (2004).
- Press and Schechter (1974) W. H. Press and P. Schechter, Astrophys. J. 187, 425 (1974).
- Bond et al. (1991) J. R. Bond, S. Cole, G. Efstathiou, and N. Kaiser, Astrophys. J. 379, 440 (1991).
- Eisenstein and Hu (1998) D. J. Eisenstein and W. Hu, Astrophys. J. 496, 605 (1998), arXiv:astro-ph/9709112 .
- Retana-Montenegro et al. (2012) E. Retana-Montenegro, E. Van Hese, G. Gentile, M. Baes, and F. Frutos-Alfaro, Astron. Astrophys. 540, A70 (2012), arXiv:1202.5242 [astro-ph.CO] .
- Jaranowski and Krolak (2005) P. Jaranowski and A. Krolak, Living Rev. Rel. 8, 3 (2005), arXiv:0711.1115 [gr-qc] .
- Amaro-Seoane et al. (2017) P. Amaro-Seoane et al., arXiv e-prints , arXiv:1702.00786 (2017), arXiv:1702.00786 [astro-ph.IM] .
- Robson et al. (2019) T. Robson, N. J. Cornish, and C. Liu, Class. Quant. Grav. 36, 105011 (2019), arXiv:1803.01944 [astro-ph.HE] .
- Lewicki and Vaskonen (2023) M. Lewicki and V. Vaskonen, Eur. Phys. J. C 83, 168 (2023), arXiv:2111.05847 [astro-ph.CO] .
- Poisson and Will (1995) E. Poisson and C. M. Will, Phys. Rev. D 52, 848 (1995), arXiv:gr-qc/9502040 .