PDRs4All VII. The 3.3 µm aromatic infrared band as a tracer of physical properties of the ISM in galaxies ††thanks: Based on JWST ERS program #1288
Aromatic infrared bands (AIBs) are a set of broad emission bands at 3.3, 6.2, 7.7, 8.6, 11.2, and 12.7 m, seen in the infrared spectra of most galaxies. With JWST, the 3.3 m AIB can in principle be detected up to a redshift of . Relating the evolution of the 3.3 m AIB to local physical properties of the ISM is thus of paramount importance.
By applying a dedicated machine learning algorithm to JWST NIRSpec observations of the Orion Bar photodissociation region obtained as part of the PDRs4All Early Release Science (ERS) program, we extracted two template spectra capturing the evolution of the AIB-related emission in the 3.2-3.6 µm range, which includes the AIB at 3.3 µm and its main satellite band at 3.4 µm.
In the Orion Bar, we analyze the spatial distribution of the templates and their relationship with the fluorescent emission of H2 in the near infrared.
We find that one template (“AIBIrrad”) traces regions of neutral atomic gas with strong far-UV fields, while the other template (“AIBShielded”) corresponds to shielded regions with lower FUV fields and a higher molecular gas fraction. We then show that these two templates can be used to fit the NIRSpec AIB-related spectra of nearby galaxies. The relative weight of the two templates (AIBIrrad/Shielded) is a tracer of the radiative feedback from massive stars on the ISM. We derive an estimate of AIBIrrad/Shielded in a lensed galaxy, and find that it has a lower value than for local galaxies. This pilot study illustrates how a detailed analysis of AIB emission in nearby regions can be used to probe the physical conditions of the extragalactic ISM.
Key Words.:
astrochemistry – infrared: ISM – ISM: individual objects: Orion Bar – ISM: photon-dominated region (PDR) – techniques: spectroscopic1 Introduction
Photodissociation regions (PDRs) are region of the interstellar medium where the far-UV photons (6 E 13.6 eV) from massive stars strongly influence the dust and gas. This deposition of energy results in the dissociation of molecules and heating of the gas and dust. PDRs cool through emission in the infrared (IR). In the mid-IR wavelength range ( µm), classic spectral signatures of PDRs are i) continuum emission attributed to dust grains, ii) H2 emission lines, iii) emission lines from neutral atoms and ions ([S ii], [Si ii], etc.), and iv) aromatic infrared bands (AIBs), which are broad emission features generally attributed to fluorescent emission of large carbonaceous molecules, i.e. polycyclic aromatic hydrocarbons (PAHs). The most prominent AIBs are found at wavelengths of 3.3, 6.2, 7.7, 8.6, 11.2, and 12.7 µm. Perhaps the main observational fact is that PAHs are ubiquitously observed in the interstellar medium (ISM) of star-forming galaxies (SFGs, e.g. Draine et al., 2007; Li, 2020; Sandstrom et al., 2023), including at high redshift (e.g. Riechers et al., 2014; McKinney et al., 2020). PAHs are believed to play a major role in the physics and chemistry of PDRs, and, notably, in heating the gas via the photoelectric effect (e.g. Bakes & Tielens, 1994; Weingartner & Draine, 2001; Berné et al., 2022a).
Here we focus on the emission in the 3.2-3.6 µm range, which includes the AIB at 3.3 µm and less-prominent neighboring bands, in particular one at 3.4 µm. While the emission at 3.3 µm is attributed to aromatic C-H stretching vibrations, the emission at 3.4 µm is attributed to aliphatic C-H stretching vibrations (e.g. Allamandola et al., 1989; Joblin et al., 1996; Yang et al., 2016a). These bands are also seen in galaxy spectra (i.e. Li, 2020, and references therein).
Kim et al. (2012) as well as Lai et al. (2020) showed that the 3.3 µm emission can be a reasonable star formation (SF) indicator and Rigopoulou et al. (2021) demonstrated that PAH intensity ratios could be used to probe physical conditions of the ISM of galaxies and thus differentiate between normal SFGs and galaxies hosting an AGN. Using near-IR spectra of M82 observed by AKARI, Yamagishi et al. (2012) found that the spatial evolution of the spectra can be explained by two main components: the AIB at 3.3 µm and the aliphatic satellite band at 3.4 µm. The ratio between the intensity of the 3.3 and 3.4 µm bands seems to increase the closer to the galaxy AGN the observations are.
Observations with the James Webb Telescope (JWST) opens up new possibilities for using these signatures to trace the physical conditions in galaxies. Indeed, first observations with the JWST have shown that the AIB at 3.3 µm and its satellite at 3.4 µm are observed and bright in galaxies of the nearby universe (e.g. Evans et al., 2022; Inami et al., 2022; U et al., 2022; Lai et al., 2023) and up to a redshift of 4 (the lensed galaxy SPT0418-47 Spilker et al., 2023), where the only detected spectral feature in the galaxy spectrum is the AIB at 3.3 µm observed with JWST/MIRI MRS. In principle, this AIB could be detected up to a redshift with MIRI MRS. It is therefore useful to understand how this emission is linked to local physical properties.
In this article, using JWST-ERS NIRSpec observations of the Orion Bar (program ID # 1288, Berné et al. (2022b)), we extract elementary spectra using a machine learning approach based on non-negative matrix factorization (NMF), following previous studies Berné et al. (2007); Foschino et al. (2019). The article is composed as follows: we describe the data in § 2 and in § 3, we detail the process of extracting the AIB templates in the near-IR (3.2-3.7 µm) range for the Orion Bar. We then compare these templates with the ones from Foschino et al. (2019). In § 3.3, we analyse the spatial distribution of the templates and establish the relationship between these templates and the ISM properties in §3.4. We then use the templates to analyze galaxy spectra in § 4 and we extend the method to the spectra of spatially resolved galaxies in § 4.2.. Finally, conclusions are presented in § 5. Throughout the paper, we use a 737 cosmology ( km s-1, , and ) and all errors are given at 1 unless stated otherwise.
2 Data
2.1 Orion Bar
The observations were performed with the JWST-NIRSpec Integral Field Unit (IFU) as part of the PDRs4All ERS program (Berné et al., 2022b) on September 10 2022. They were reduced using the JWST pipeline version 1.9.4 with Calibration Reference Data System (CRDS) context file jwst_1014.pmap. For this study, we only use the spectral cube corresponding to the F290LP filter which spans from to 5 m. This data cube is a combination of 9 pointings, forming a mosaic spanning across the Orion Bar. The detailed data reduction together with a general analysis of the line emission is described in Peeters et al. (2023) and in Chown et al. (2023) where a first description of the PAH emission is also discussed.
2.2 Galaxies
At the time of writing this paper, four galaxies from the ERS program #1328111Details on this program can be seen on their website https://goals.ipac.caltech.edu/ have been observed with NIRSpec. Those galaxies are, namely, VV114 (Evans et al., 2022; Rich et al., 2023; Linden et al., 2023), NGC7469 (U et al., 2022; Lai et al., 2022; Bohn et al., 2023; Armus et al., 2023; Lai et al., 2023; Bianchin et al., 2023), IIZw96 (Inami et al., 2022) and NGC3256 nucleus 1 and nucleus 2. We retrieved from MAST the level 3 NIRSpec IFU cubes for these five pointings covering filters 100, 170 and 290LP. For each pointing, we extracted from the cubes the average spectrum using elliptical apertures (see Table 1). As most of the galaxies observed have saturated spectra near their center, we exclude the saturated area when extracting each galaxy spectrum.
We also include data for the M82 galaxy from the GO program id # 2677. These are NIRSpec MSA observations of the nucleus and disk edge with the F290LP filter. Here we use the data for the nucleus only since it provides the best detection of the AIB at 3.3 µm and its satellite band at 3.4 µm. We obtained a mean spectrum by averaging the spectra obtained in all shutters.
In addition, another ERS program (id # 1355) released their MIRI MRS reduced data of a redshift galaxy, called SPT0418-47, in which the AIB at 3.3 µm is present (Spilker et al., 2023). For this specific galaxy, we follow the reduction process provided by the authors in order to extract a unique average spectrum of this lensed source for all channels of MIRI.
In total, we thus obtain 7 average spectra covering the range of the emission bands at 3.3 and 3.4 µm in galaxies near and far.
| Galaxy name | Center RA | Center DEC | radius () | radiussub | PA |
|---|---|---|---|---|---|
| (1) | (2) | (3) | (4) | (5) | (6) |
| IIZw96 | 20:57:24.376 | 17:07:39.7 | 1.270.75 | 25 | |
| VV114 | 01:07:47.530 | -17:30:25.30 | 0.510.38 | 0.130.08 | 33 |
| NGC7469 | 23:03:15.633 | 8:52:26.21 | 0.790.79 | 0 | |
| NGC3256 nucl1 | 10:27:51.231 | -43:54:14.00 | 0.340.34 | 0.06 | 0 |
| NGC3256 nucl2 | 10:27:51.218 | -43:54:19.42 | 0.380.24 | 0.06 | 20 |
(1) Galaxy name; (2) RA of the ellipse center (J2000); (3) DEC of the ellipse center (J2000); (4) Radius of ellipse in kpc (semi-major and semi-minor axes); (5) Radius of subtracted ellipse in kpc; (6) Ellipse position angle (in degrees, same for both apertures).
3 Template NIRSpec AIB-related spectra in the Orion Bar
3.1 Extracting template spectra from the observed data cube
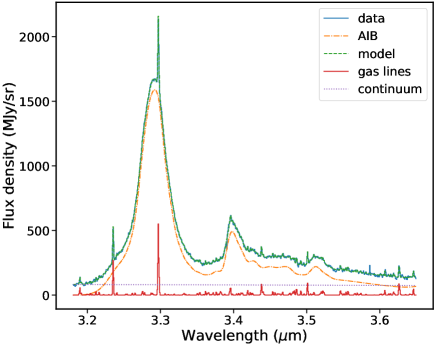
Our aim is to extract a set of representative elementary (“template”) spectra from the observed NIRSpec spectral cubes of the Orion Bar. To do so, we follow the decomposition method presented in Boulais et al. (2021) and Foschino et al. (2019). Details of the method are provided in these two references but we briefly describe them here. First, the 3D NIRSpec data cube is transformed into a 2D matrix: , with and , . In this study, we consider a wavelength range between 3.18 µm which covers the AIB at 3.3 µm and its satellite bands, in particular the major one at 3.4 µm. Then, we filter out low SNR spectra in using cutoffs in flux to remove potential spikes and saturated spectra in this wavelength range. Those cutoffs are the following: in each spectrum, intensities larger than MJy sr-1 are set to . This cut-off value is chosen to be larger than any real emission line in our data, and corresponds to spikes present in the data. We then select only those spectra whose sum of values is greater than 1 (this removes spectra which contain no information at the border of the field of view). The selected spectra constitute the lines of the matrix , which has dimensions (8690,706) i.e 706 spectral points and 8690 spatial positions. Spectra in are then fitted using a combination of synthetic components (AIB-related bands, gas lines and continuum) in order to remove the contribution from gas lines and dust emission and extract the emission related to the AIBs (see Foschino et al. 2019 and Fig. 1). We define the matrix whose lines are these 8690 pure AIB fitted spectra (e.g. orange curve in Fig. 1). The next step consists in identifying the dimension of the subspace spanned by the data in . This is done as in Boulais et al. (2021), by analysis of the eigenvectors of the covariance matrix. Using this method we find that this dimension is . We then apply non-negative matrix factorization (NMF Lee & Seung 1999) to with , which provides the matrices and such that . Following Boulais et al. (2021), the NMF algorithm is initialized using the results of the MASS algorithm applied to .
3.2 Extracted AIB-related spectra
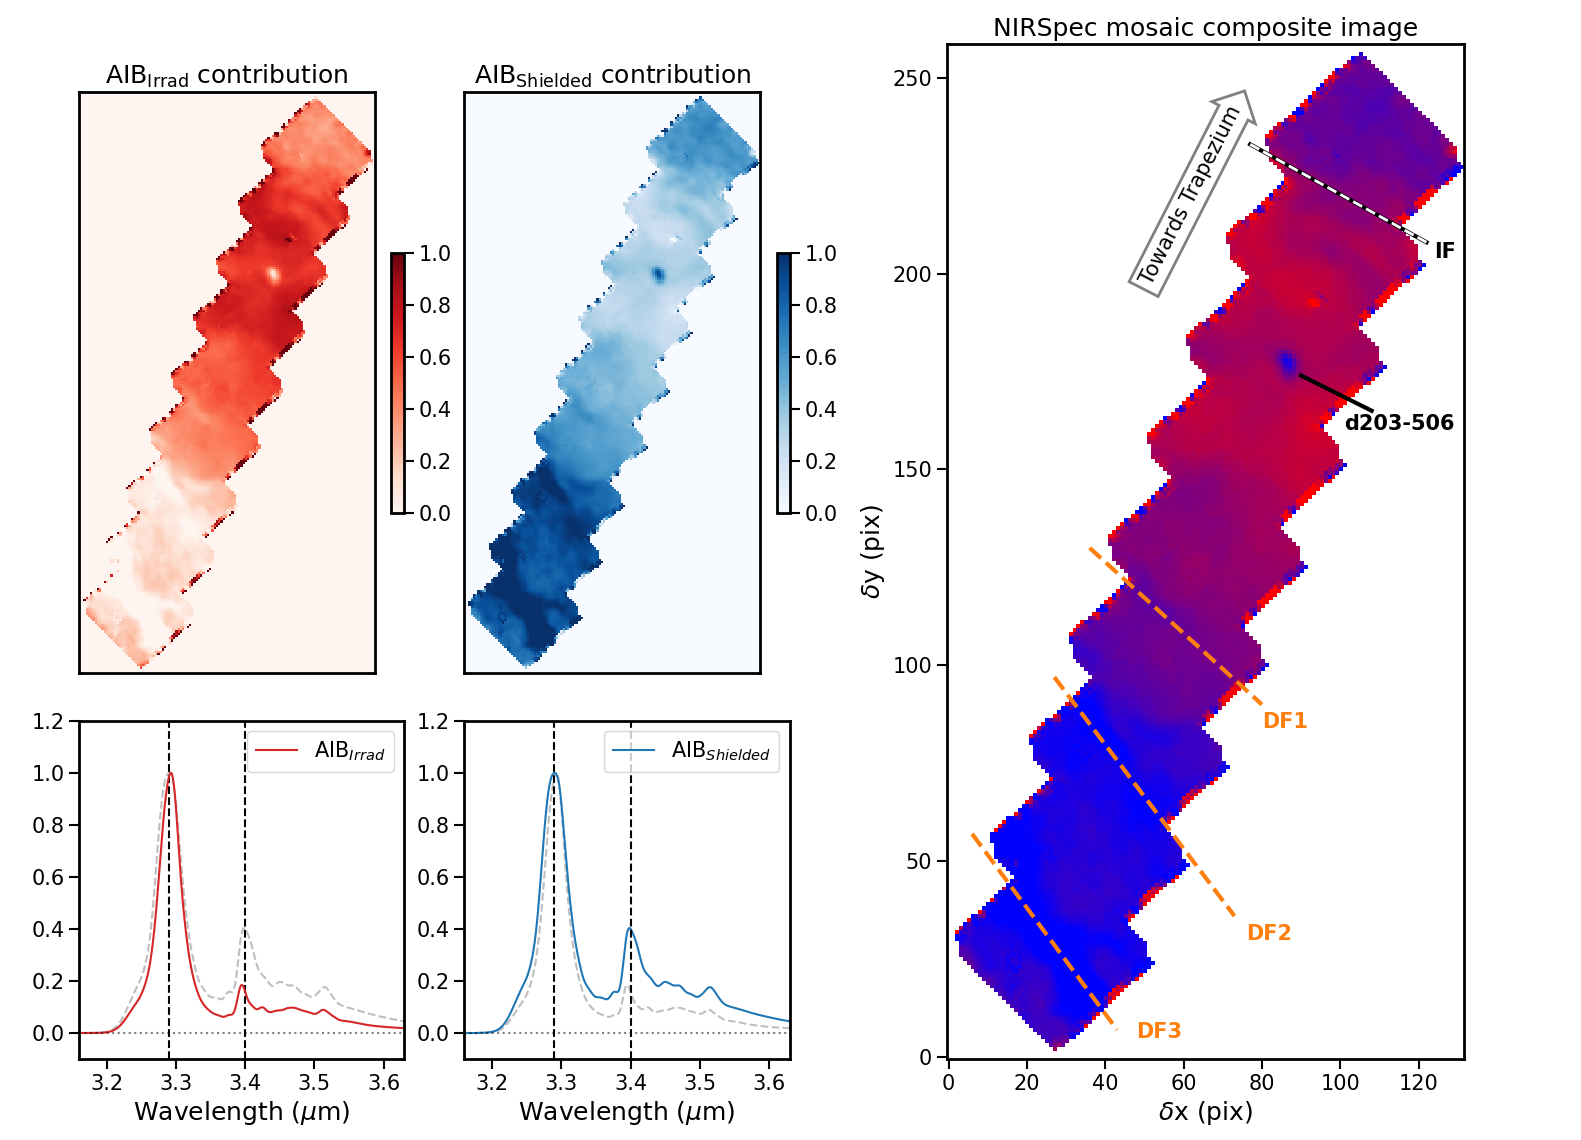
The extracted AIB-related spectra are presented in Fig. 2. The two spectra are similar, however they show some specific differences. The first template spectrum (AIBIrrad hereafter) in red in Fig. 2 is dominated by a strong band at 3.294 m, and a weak band at 3.393 m. An underlying plateau is present between , but relatively weak compared to the 3.294 band. The second template spectrum (AIBShielded hereafter) in blue on Fig. 2 shows a prominent band at 3.290 m, which is broader than the same band in the AIBIrrad spectrum. The 3.4 m emission feature in AIBShielded is also much stronger. The template AIBShielded also shows a more prominent plateau in the 3.36–3.53 m range.
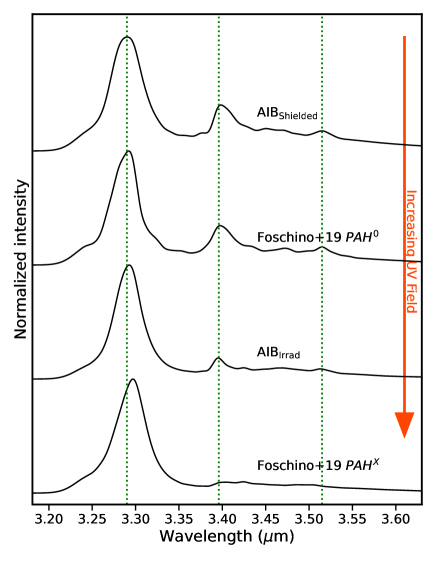
For each template, we estimate the 3.4 to 3.3 m band intensity ratios. The 3.3 m band intensity is obtained between 3.24 and 3.35 m and the 3.4 m band between 3.38 and 3.42 m. For each band, we subtract a linear continuum between the integration ranges to get only the band emission. The 3.4/3.3 integrated intensity band ratio is 0.04 for template AIBIrrad, and 0.10 for template AIBShielded. These values correspond well to the extremes of this band ratio as derived from NIRSpec observations of NGC 7469 (Lai et al., 2023). As mentioned before, the 3.3 m band is associated with aromatic C-H stretch emission, while the 3.4 m band is attributed to aliphatic C-H emission (Allamandola et al., 1989), the fraction of aliphatics is found to be relatively minor (typically one methyl sidegroup per PAH for AIBShielded following Joblin et al. (1996) and Yang et al. (2016b). If the carriers of the 3.4 m band are surhydrogenated PAHs rather than alkylated PAHs (Bernstein et al., 1996), then an even smaller amount of CH aliphatic bonds is required to explain the observed 3.4 to 3.3 m band intensity ratios (Yang et al., 2020). In all cases, the AIBIrrad template corresponds to the emission of PAHs with very few attached aliphatic C-H bonds. Because the latter are more easily photodissociated than aromatic C-H bonds upon UV irradiation (Marciniak et al., 2021), the AIBIrrad spectrum can be regarded as corresponding to more UV processed PAHs with respect to the AIBShielded spectrum. On the opposite, the species emitting the AIBShielded spectrum have been less exposed to UV irradiation (Joblin et al., 1996; Pilleri et al., 2015; Chown et al., 2023; Peeters et al., 2023), which was also recently seen in NGC7469 by Lai et al. (2023). In Figure 3, we present both templates, together with two templates from Foschino et al. (2019) in the same wavelength range, ordered by visual ratio of the 3.3 over 3.4 µm bands. The AIBShielded template is very close to the neutral PAH0 template of Foschino et al. (2019) - yet with a slightly stronger 3.4 band, thus confirming that it corresponds to regions that are rather shielded from the UV or denser in which more pristine material is exposed to UV photons. The AIBIrrad template is close to the PAHX template -yet with slightly more emission at 3.4 µm, which corresponds to the most irradiated environments.
3.3 Spatial distribution of the extracted templates
To complement this interpretation, we derived the spatial distribution of templates AIBIrrad and AIBShielded spectra in the Orion Bar. To do this, we used a linear combination of the two template AIB-related spectra + gas lines + continuum to fit each of the observed spectrum at each spatial position in the NIRSpec cube (see details of the fitting method in Foschino et al. 2019). The respective contribution of the two AIB template spectra, which results from this fit, is shown in Fig. 2. The template AIBIrrad dominates in the Northwest of the field of view, that is, in regions closer to the massive Trapezium stars, while template AIBShielded is found to be mostly present to the Southeast of the field of view. AIBShielded is also found to follow some dense structures present in the field of view of the Orion Bar, that is the d203-506 protoplanetary disk (Berné et al. 2023) and several dense dissociation fronts seen in H2 with NIRCam (Habart et al., 2023). The observed spatial distribution for templates AIBIrrad and AIBShielded spectra is compatible with the photo-chemical scenario discussed above, namely AIBIrrad traces the regions that are more exposed to UV photons and AIBShielded is more characteristic of denser and UV shielded regions. In Figure 2, we note however that there is an excess in AIBShielded beyond the ionization front in the HII region. This is most likely because the AIB emission in this upper corner of the map emanates from the background face-on PDR nebula and not the HII region itself (see Fig. 5 of Habart et al., 2023).
3.4 Relationship between the template AIB-related spectra and PDR physical properties
In order to assess the relationship between these templates and physical conditions in more detail, we extract several quantitative parameters on each spaxel of the Orion Bar NIRSpec field of view. We derive AIBIrrad/Shielded, the ratio of integrated intensity of the AIBIrrad template over the integrated intensity of the AIBShielded template. We also extracted, for all pixels, the integrated intensities of the pure rotational H2 0–0 S(9) line at µm , the H2 1–0 S(1) ro-vibrational line at µm , the Pfund Hydrogen recombination line at µm and the O i line at µm . This latter line emission results from UV induced fluorescence, and can be used to derive the intensity of the UV radiation field (see Peeters et al. (2023) and references therein). We thus follow the approach from these authors to estimate the distribution of (in units of the Habing (1968) field) within the NIRSpec filed of view. Finally, we use the extracted integrated intensity of the AIB-related emission between 3.2 and 3.7 µm from Peeters et al. (2023), written IAIB.
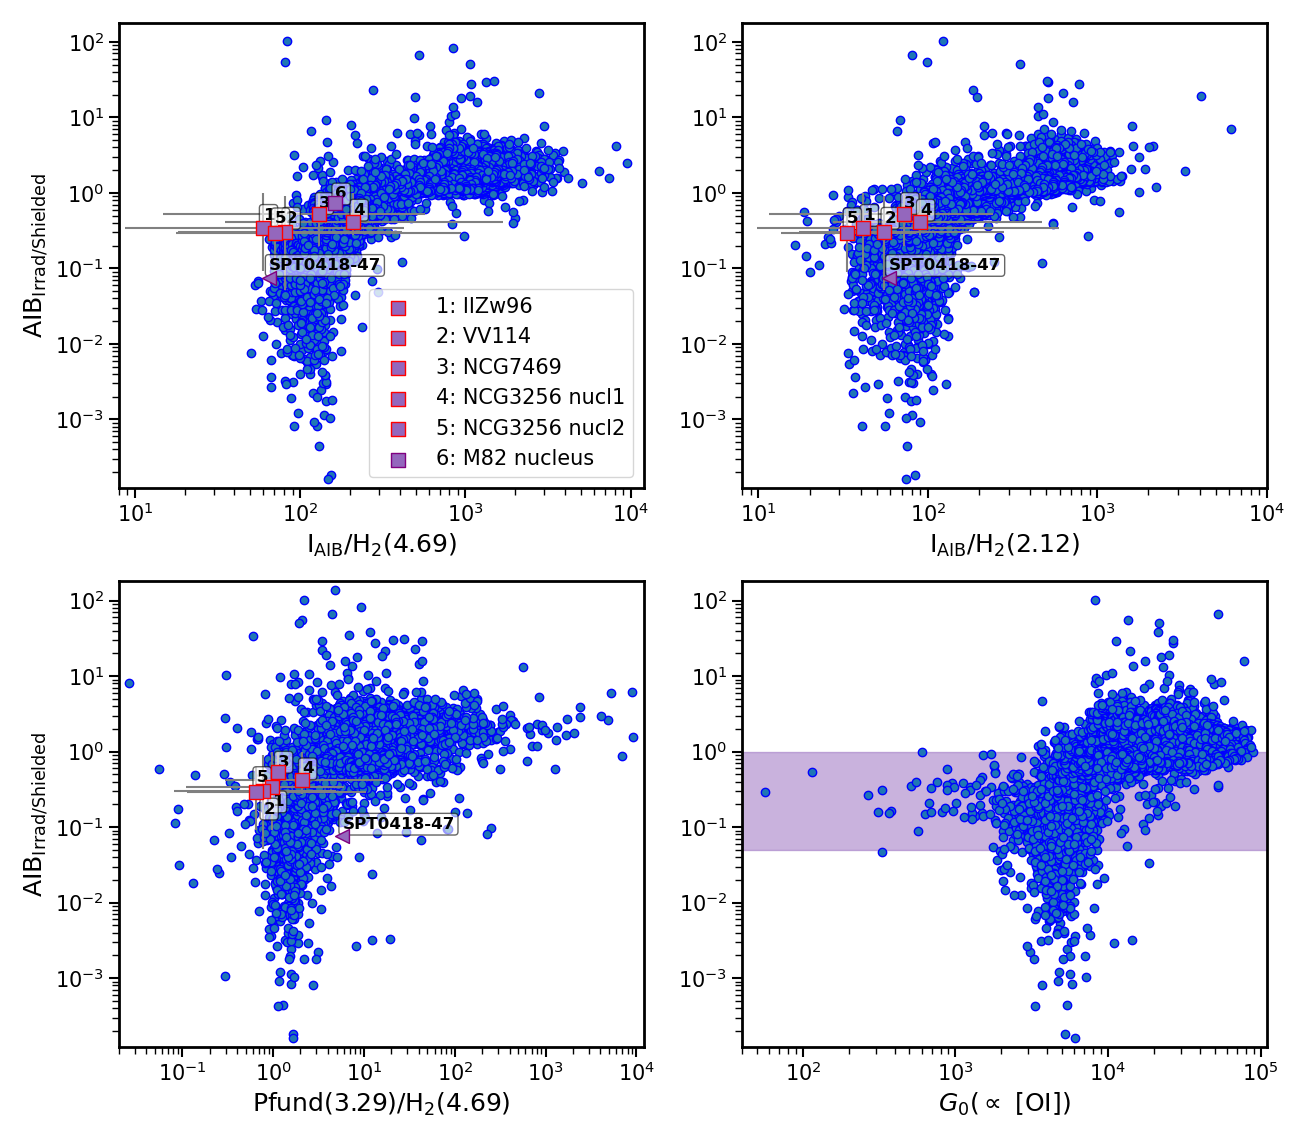
In Figure 4, we plot AIBIrrad/Shielded as a function of the ratios between AIB emission and the H2 line intensities, the ratio of the Pfund- Hydrogen recombination line at µm to the H2 pure rotational line at µm , and the intensity of the UV radiation field derived from the O i line at µm . Strong variations of the AIBIrrad/Shielded ratio are observed, from to . Some outliers are present in this diagram with values , corresponding to the edge of the NIRSpec mosaic where the fit is poor. All ratios on the X-axis of the four panels in Figure 4 have been chosen to increase in more irradiated regions. AIBIrrad/Shielded thus appears to be large in regions where the UV field is the strongest and where H2 is photodissociated (but not the AIB carriers). AIBIrrad/Shielded is smaller in regions of lower UV field, where H2 can form and thus the AIB to H2 ratio is smaller. Similarly, AIBIrrad/Shielded is larger in regions where the Pfund- (inonized gas) over H2 (warm molecular gas) ratio is large. Finally, this trend is also observed with radiation field, that is, AIBIrrad/Shielded increases with the intensity of the radiation field as derived from the O i line. More specifically, the points with the top 10 AIBIrrad/Shielded ratios have a median G, while those with the bottom 10 AIBIrrad/Shieldedratio have a median G. We note that this approach only allows to probe the intensity of the radiation field, while the hardness could also play a role on the AIB derived ratio (see Yang & Li 2023). The effect of hardness could be tested by observing several PDRs illuminated by stars with various masses. The increase of AIBIrrad/Shielded is steep in the range where the AIB to H2 ratio is comprised between a few s and , and then much shallower beyond this latter value creating a ”shoulder” in the diagrams upper panels of Fig. 4, this shoulder corresponds to spectra at the dissociation fronts present in the Orion Bar (DF1, DF2, DF3, see Fig. 2). Overall, these results support the interpretation in Sect. 3.2 and Sect. 3.3 related to the processing of the AIB carriers with UV field inside the PDR.
4 Application to galaxies
| Galaxy name | Redshift | IAIB/H2(4.69) | IAIB/H2(2.12) | Pfund(3.29)/H2(4.69) | AIBIrrad/Shielded | SFR |
|---|---|---|---|---|---|---|
| (1) | (2) | (3) | (4) | (5) | (6) | (7) |
| IIZw96 | 0.03611 | 59.2 | 40.3 | 1.3 | 0.488 | 40–601 |
| VV114 | 0.02022 | 81.3 | 54.6 | 0.73 | 0.411 | 384 |
| NGC7469 | 0.016275 | 135.1 | 73.5 | 0.97 | 1.067 | 10–306 |
| NGC3256 nucl1 | 0.0093647 | 217.4 | 89.3 | 2.6 | 0.689 | 308 |
| NGC3256 nucl2 | 0.0093647 | 69.4 | 32.7 | 2.5 | 0.412 | 508 |
| STP0418-47 | 4.22489 | 64.9 | 59.2 | 5.8 | 0.075 | 3509 |
| M82 nucleus | 0.0007310 | 0.0061 | 0.741 | 1011 |
(1) Galaxy name; (2) galaxy redshift; (3) IAIB/H2(4.69) = H flux ratio; (4) IAIB/H2(2.12) = H flux ratio; (5) Pfund(3.29)/H2(4.69) = Pfund(H flux ratio; (6) AIBIrrad/Shielded = AIBIrrad/AIBShielded; (7) The galaxy SFR (in M⊙ yr-1). 1: Inami et al. (2022); 2: Evans et al. (2022); 3: Rich et al. (2023); 4: Basu-Zych et al. (2013); 5: U et al. (2022); 6: Lai et al. (2022); 7: Yuan et al. (2019); 8: Sakamoto et al. (2014); 9: Spilker et al. (2023); 10: Morabito et al. (2014); 11: Yoast-Hull et al. (2013).
4.1 Fitting global galaxy spectra using the templates
In this section we now turn to galaxies observed with NIRSpec. We fit the 7 average spectra of these objects in our sample using a linear combination of emission lines, continuum and both AIBIrrad and AIBShielded templates (we follow the same procedure as in Sect. 3.3 but accounting for galaxy redshift when fitting the spectra). For galaxy SPT0418-47, as the spectrum has a relatively low SNR (), emission lines are not detected and thus not included in the fit.

Figure 5 shows all the fits obtained for nearby galaxies. The root mean square normalized error (see definition e.g. in Boulais et al. (2021)) is below 1%. From those fits, we extract the AIBIrrad/Shielded and compare them to the same observational parameters as for the Orion Bar (Fig. 4). For all galaxies in the study, the derived values overlap with those of the Orion Bar. Interestingly, for all the nearby galaxies, the points are situated near the shoulder of the Orion Bar data. This indicates that the AIB spectra from those nearby galaxies likely trace the irradiated surfaces of molecular clouds in the vicinity of massive stars. As can be seen in the bottom right panel of Fig. 4, the range of values of AIBIrrad/Shielded derived for nearby galaxies is consistent with radiation field in the range of (Fig. 4).

4.2 Fitting the spectra of spatially resolved galaxies
In order to obtain complementary insights into the variations of the AIB emission within local galaxies, we now perform a similar analysis by fitting the spectra at all spatial positions within the NIRSpec cubes of the GOALS program 222For M82 however, this galaxy has no NIRSpec IFU observation available and we thus cannot perform a “resolved” fitting like the other five nearby galaxies. The fitted spectra are extracted over an aperture of one pixel radius. We thus end up with approximately 1500 spectra per pointing. Each spectrum is then fitted using the linear combination of the extracted templates (AIBIrrad and AIBShielded, linear and power-law continuum, and emission lines), as above. From these fits, we derive the maps of the AIBIrrad/Shielded ratio for each galaxy. Those maps are shown in Figure 7. On this figure, we also include the maps of the Paschen alpha line at 1.875 m (left column), and of the integrated intensity of the 3.3 µm AIB. Emission in the Paschen alpha line is a tracer of Extreme UV ( eV) photons, while the 3.3 µm integrated intensity is more sensitive to Far-UV ( eV) photons. Thus, both are tracers of the radiative feedback from OB stars on the ISM, yet with different physical conditions (respectively HII region vs PDR, Peeters et al. 2023). Since the evolution of the ratio of the 3.3 over 3.4 µm bands, and therefore the relative contribution of AIBIrrad and AIBShielded depends on the FUV intensity (Joblin et al., 1996, Fig. 3 of this work), we compare in Fig. 7, the spatial distribution of AIBIrrad/Shielded with that of the 3.3 µm band.
In the case of IIZw96 AIBIrrad/Shielded seems to follow the Paschen alpha and the 3.3 µm emissions at first look. However, looking in more detail, the AIBIrrad/Shielded ratio peaks near the central Paschen alpha and 3.3 µm knots but not necessarily exactly at their positions. Also, some knots are seen peaking in Pa alpha and 3.3 emission but not in AIBIrrad/Shielded. In VV114, AIBIrrad/Shielded is bright in the North-East knot of 3.3 µm and Paschen alpha emission, but is small near the nucleus where both Paschen alpha and 3.3 µm emission peak. In NGC 7469, AIBIrrad/Shielded follows the knots of active star formation, however the distributions are no fully co-spatial. Instead, it appears that AIBIrrad/Shielded is somewhat on the edges of these knots and seems to miss the star-forming region in the South. The situation near the nucleus is more difficult to assess due to saturation of the NIRSpec spectra. For NGC 3256 nucleus 1, AIBIrrad/Shielded peaks close to the peak of 3.3 µm and Paschen Alpha emission near the nucleus of the galaxy. However, the spatial pattern differs: AIBIrrad/Shielded shows a more diffuse emission, linked to the starforming knots, but not completely co-located, as in NGC 7469. Finally, in NGC 3256 nucleus 2, the distribution of AIBIrrad/Shielded seems completely unrelated to Paschen alpha or the 3.3 µm emission. We do see however –as in all other galaxies, a peak of AIBIrrad/Shielded near a starforming knot at the Northwest of the field of view (Fig. 7 ). Comparing the AIBIrrad/Shielded to the HST visible images, it appears that low values of AIBIrrad/Shielded seem to correspond to dark regions of the HST images (Fig. 7), where visual extinction is high, i.e. regions with large amounts of molecular gas. In summary, AIBIrrad/Shielded does seem to be related to the radiative feedback from massive stars in the observed galaxies. As in the Orion Bar, this ratio is high in the vicinity of massive OB stars, and is much lower in regions with higher extinction and larger molecular gas fractions. This is also compatible with the findings of Lai et al. (2020) who found a correlation between the 3.4/3.3 µm band ratio and the radiation field intensity, suggesting that aliphatic (3.4) component is more prone to photo-destruction under intense radiation environment.

4.3 Fitting a high redshift AIB spectrum
In the last step of our analysis we fit the AIB spectrum of the galaxy SPT0418 obtained with MIRI using our template spectra. The result of this fit is shown in Figure 6. Although the SNR is poor on this observation, this suggests that our extracted templates could be applied to a high redshift galaxy. For this source, the H2 lines are not detected, thus we derive an upper limit for the ratios between the H2 line intensity and using the measured RMS noise at the wavelengths of the 2.12 and 4.69 µm H2 lines. We then place SPT0418 in the diagrams of Fig. 4. Interestingly, it appears to fall in a different region: while the H2 over AIB ratio is only an upper limit, the AIBIrrad/Shielded is clearly lower than for nearby galaxies. This lower value of AIBIrrad/Shielded with respect to galaxies of the local universe would indicate that less highly irradiated gas is present in SPT0418. This result is quite counter intuitive considering the large SFR of this galaxy. However, given the noisy nature of the spectrum (Fig. 6) the reliability of the derived value of AIBIrrad/Shielded needs to be confirmed with deeper observations of this source with MIRI.
5 Conclusion
In this paper, using JWST NIRSpec observations of the Orion Bar, we extracted two template spectra AIBIrrad and AIBShielded which give a good representation of the AIB emission from this PDR in the 3.2 to 3.6 µm range. We have shown that the ratio between these two templates, AIBIrrad/Shielded, is linked to the physical conditions in the PDR, with high values corresponding to regions where the UV field is strongest and where H2 is dissociated and low values corresponding to regions where the UV field is weakest and where H2 can form. We fitted NIRSPec spectra of nearby galaxies using these two templates and extracted maps of the AIBIrrad/Shielded ratio. We showed that this ratio follows the radiative feedback from massive stars. Finally, we used our templates to fit the spectrum of a high redshift galaxy, showing the potential of such an approach to derive physical conditions of the ISM in these objects. These templates could also be used, for instance, to fit the spectral energy distribution of galaxies, in order to constrain the intrinsic properties of galaxies such as their initial mass function distribution or even their SFR history. Additional spectroscopic observations with JWST covering the range of the 3.3 µm AIB for both low and high redshift (up to ) galaxies are needed to confirm and refine the potential of the approach presented here to determine the global physical conditions of the ISM in galaxies.
Acknowledgments
We thank the referee for her/his comments and suggestions which helped to improve the clarity of the manuscript. This work is based [in part] on observations made with the NASA/ESA/CSA James Webb Space Telescope. The data were obtained from the Mikulski Archive for Space Telescopes at the Space Telescope Science Institute, which is operated by the Association of Universities for Research in Astronomy, Inc., under NASA contract NAS 5-03127 for JWST. These observations are associated with programs #1288, #1328, #1355 and #2677. IS, OB, AC are funded by the Centre National d’Etudes Spatiales (CNES) through the APR program. EP acknowledges support from the University of Western Ontario, the Institute for Earth and Space Exploration, the Canadian Space Agency (CSA, 22JWGO1-16), and the Natural Sciences and Engineering Research Council of Canada.
References
- Allamandola et al. (1989) Allamandola, L. J., Tielens, A. G. G. M., & Barker, J. R. 1989, ApJS, 71, 733
- Armus et al. (2023) Armus, L., Lai, T., U, V., et al. 2023, ApJ, 942, L37
- Bakes & Tielens (1994) Bakes, E. L. O. & Tielens, A. G. G. M. 1994, ApJ, 427, 822
- Basu-Zych et al. (2013) Basu-Zych, A. R., Lehmer, B. D., Hornschemeier, A. E., et al. 2013, ApJ, 774, 152
- Berné et al. (2022a) Berné, O., Foschino, S., Jalabert, F., & Joblin, C. 2022a, A&A, 667, A159
- Berné et al. (2022b) Berné, O., Habart, É., Peeters, E., et al. 2022b, PASP, 134, 054301
- Berné et al. (2007) Berné, O., Joblin, C., Deville, Y., et al. 2007, A&A, 469, 575
- Bernstein et al. (1996) Bernstein, M. P., Sandford, S. A., & Allamandola, L. J. 1996, The Astrophysical Journal, 472, L127
- Bianchin et al. (2023) Bianchin, M., U, V., Song, Y., et al. 2023, arXiv e-prints, arXiv:2308.00209
- Bohn et al. (2023) Bohn, T., Inami, H., Diaz-Santos, T., et al. 2023, ApJ, 942, L36
- Boulais et al. (2021) Boulais, A., Berné, O., Faury, G., & Deville, Y. 2021, A&A, 647, A105
- Chown et al. (2023) Chown, R., Sidhu, A., Peeters, E., et al. 2023, arXiv e-prints, arXiv:2308.16733
- Draine et al. (2007) Draine, B. T., Dale, D. A., Bendo, G., et al. 2007, ApJ, 663, 866
- Evans et al. (2022) Evans, A. S., Frayer, D. T., Charmandaris, V., et al. 2022, ApJ, 940, L8
- Foschino et al. (2019) Foschino, S., Berné, O., & Joblin, C. 2019, A&A, 632, A84
- Habart et al. (2023) Habart, E., Peeters, E., Berné, O., et al. 2023, arXiv e-prints, arXiv:2308.16732
- Habing (1968) Habing, H. J. 1968, 19, 421
- Inami et al. (2022) Inami, H., Surace, J., Armus, L., et al. 2022, ApJ, 940, L6
- Joblin et al. (1996) Joblin, C., Tielens, A. G. G. M., Allamandola, L. J., & Geballe, T. R. 1996, ApJ, 458, 610
- Kim et al. (2012) Kim, J. H., Im, M., Lee, H. M., et al. 2012, ApJ, 760, 120
- Lai et al. (2023) Lai, T. S. Y., Armus, L., Bianchin, M., et al. 2023, ApJ, 957, L26
- Lai et al. (2022) Lai, T. S. Y., Armus, L., U, V., et al. 2022, ApJ, 941, L36
- Lai et al. (2020) Lai, T. S. Y., Smith, J. D. T., Baba, S., Spoon, H. W. W., & Imanishi, M. 2020, ApJ, 905, 55
- Lee & Seung (1999) Lee, D. D. & Seung, H. S. 1999, Nature, 401, 788
- Li (2020) Li, A. 2020, Nature Astronomy, 4, 339
- Linden et al. (2023) Linden, S. T., Evans, A. S., Armus, L., et al. 2023, ApJ, 944, L55
- Marciniak et al. (2021) Marciniak, A., Joblin, C., Mulas, G., Mundlapati, V. R., & Bonnamy, A. 2021, A&A, 652, A42
- McKinney et al. (2020) McKinney, J., Pope, A., Armus, L., et al. 2020, ApJ, 892, 119
- Morabito et al. (2014) Morabito, L. K., Oonk, J. B. R., Salgado, F., et al. 2014, ApJ, 795, L33
- Peeters et al. (2023) Peeters, E., Habart, E., Berne, O., et al. 2023, arXiv e-prints, arXiv:2310.08720
- Pilleri et al. (2015) Pilleri, P., Joblin, C., Boulanger, F., & Onaka, T. 2015, A&A, 577, A16
- Rich et al. (2023) Rich, J., Aalto, S., Evans, A. S., et al. 2023, ApJ, 944, L50
- Riechers et al. (2014) Riechers, D. A., Pope, A., Daddi, E., et al. 2014, ApJ, 786, 31
- Rigopoulou et al. (2021) Rigopoulou, D., Barale, M., Clary, D. C., et al. 2021, MNRAS, 504, 5287
- Sakamoto et al. (2014) Sakamoto, K., Aalto, S., Combes, F., Evans, A., & Peck, A. 2014, ApJ, 797, 90
- Sandstrom et al. (2023) Sandstrom, K., Chastenet, J., Sutter, J., et al. 2023, arXiv e-prints, arXiv:2301.00854
- Spilker et al. (2023) Spilker, J. S., Phadke, K. A., Aravena, M., et al. 2023, arXiv e-prints, arXiv:2306.03152
- U et al. (2022) U, V., Lai, T., Bianchin, M., et al. 2022, ApJ, 940, L5
- Weingartner & Draine (2001) Weingartner, J. C. & Draine, B. T. 2001, ApJS, 134, 263
- Yamagishi et al. (2012) Yamagishi, M., Kaneda, H., Ishihara, D., et al. 2012, A&A, 541, A10
- Yang & Li (2023) Yang, X. & Li, A. 2023, The Astrophysical Journal Supplement Series, 268, 50
- Yang et al. (2020) Yang, X. J., Li, A., & Glaser, R. 2020, ApJS, 247, 1
- Yang et al. (2016a) Yang, X. J., Li, A., Glaser, R., & Zhong, J. X. 2016a, ApJ, 825, 22
- Yang et al. (2016b) Yang, X. J., Li, A., Glaser, R., & Zhong, J. X. 2016b, ApJ, 825, 22
- Yoast-Hull et al. (2013) Yoast-Hull, T. M., Everett, J. E., Gallagher, J. S., I., & Zweibel, E. G. 2013, ApJ, 768, 53
- Yuan et al. (2019) Yuan, C., Murase, K., & Mészáros, P. 2019, ApJ, 878, 76