,
Rotational phase transitions in antifluorite-type osmate and iridate compounds
Abstract
We present temperature-dependent single-crystal diffraction results on seven antifluorite-type compounds with =Os or Ir: K2OsCl6, OsBr6 with =K, Rb, Cs and NH4, and K2Ir with =Cl and Br. The structural transitions in this family arise from octahedron rotations that generate a rich variety of symmetries depending on the rotation axis and stacking schemes. In order to search for local distortions in the high-symmetry phase we perform refinements of anharmonic atomic displacement parameters with comprehensive data sets. Even at temperatures close to the onset of structural distortions, these refinements only yield a small improvement indicating only small anharmonic effects. The phase transitions in these antifluorites are essentially of displacive character. However, some harmonic displacement parameters are very large reflecting soft phonon modes with the softening covering large parts of the Brillouin zone. The occurrence of the rotational transitions in the antifluorite-type family can be remarkably well analyzed in terms of a tolerance factor of ionic radii.
Keywords: Frustrated magnetism, Crystal structure, Phase transition, X-ray diffraction
1 Introduction
The rich physics of spin-orbit entangled states in iridates paves the way to the search of the Kitaev quantum spin liquid [1], either with Ir ions arranged in a 2D honeycomb lattice [2] (and related materials [3]) or with 3D honeycomb structures [4]. Double perovskites of type where Ir ions form an lattice became also candidates to host such exotic physics [5]. The quest continued with iridate antifluorite-type materials, as their lattice can be regarded as a double-perovskite structure with an empty site. In K2IrCl6, which remains cubic down to the lowest temperature and which preserves the ideal octahedral environment at the Ir site, the Kitaev coupling is estimated to be half of the Heisenberg nearest-neighbor exchange coupling [6]. Despite structural instabilities, the antiferromagnetic ground state of K2IrBr6 is consistent with an extended Heisenberg-Kitaev model with a sizable AFM Kitaev coupling [7]. It was argued that the non-cubic crystal-field splitting is small in comparison to Ir oxides preserving the ground state [8].
The antifluorite compounds of chemical formula , where the cation is an alkaline element, a halide, and a four-valent transition metal, crystallize in the K2PtCl6 structure type at room temperature, see Figure 1. In contrast to perovskites and related materials, octahedra are not connected by a shared ligand site. Therefore, the coupling of the halide ions is fully asymmetric with a strong bond only to a single ion. Each halide ion feels thus a steep but asymmetric potential along the bond direction and much flatter ones in the transversal directions. The antifluorite structure is thus intrinsically unstable against a mostly rigid rotation of the octahedra around an arbitrary axis. The absence of shared ligands also results in a weaker coupling between rotations at neighboring sites compared to the three-dimensional or layered perovskites, where such rotations are tightly coupled. In perovskites, only for a rotation around a bond direction and only along this direction, the stacking of the rotations can vary. Indeed, numerous rotational phase transitions are reported for members of the family — see for instance a non-exhaustive list of materials and their associated transition temperatures discussed in terms of cations and halide sizes [9].
The reduced constraints for the rotations in antifluorite-type materials opens the question about the character of the structural phase transitions. In general structural phase transitions are classified as of order-disorder or of purely displacive type [10]. The rotational transition in SrTiO3 is the textbook example for a displacive transition that is accompanied by the softening of an associated phonon mode [10], while the rotation of molecular units such as NO2 [10] or NH4 [11] can give rise to order-disorder-type transitions. However, there is no clear cut between the two cases and most structural phase transitions have a mixed character, with a crossover between the two regimes [12, 13]. For K2ReCl6 evidence for partial order-disorder character was recently deduced from Raman experiments [14]. The atomic displacement parameter (ADP) of the halide ion perpendicular to the bond () is significantly larger than the one parallel to the bond (), reported for instance in K2IrBr6 [8] or in K2IrCl6 [6], but so far it remains unclear whether this enhancement is just a dynamic effect caused by the soft phonon modes, or whether it results from local disorder. The aim of this work is to quantitatively analyze the role of local distortions in several members of the antifluorite-type family by refinements of anharmonic models of the ADPs.
As an example, K2ReCl6 undergoes a series of structural transitions understood in terms of octahedra rotations [15]. The transitions to a tetragonal and monoclinic space group are characterized by the softening of soft rotary phonon modes at the and points in the Brillouin zone. As a consequence of the symmetry lowering, ferroelastic domains emerge and their relation to the magnetic order is at the origin of a huge magnetoelastic anomaly [15]. Furthermore, following the work of [16], this material would constitute an ideal framework to investigate the occurrence of an unconventional Jahn-Teller distortion driven by spin-orbit coupling.
In the case of the =Os transition metal with electronic configuration, the ground state is a non-magnetic singlet unless crystal-field effects dominate. The non-magnetic singlet has been confirmed through the measurement of a temperature independent Van-Vleck paramagnetic susceptibility for three different osmate compounds K2OsCl6, K2OsBr6, and Rb2OsBr6 [17]. Furthermore, the combination of RIXS and optical-spectroscopy measurements permitted the determination of electronic parameters. Despite undergoing a cubic to tetragonal phase transition, a much weaker non cubic crystal-field splitting, smaller by one order of magnitude compared to K2IrBr6, is reported for K2OsCl6, which renders the ground state robust [17].
We report here comprehensive single-crystal X-ray diffraction (XRD) studies at temperatures between 250 and 80 K of five osmate compounds K2OsBr6, K2OsCl6, Rb2OsBr6, Cs2OsBr6, and (NH4)2OsBr6, and of two iridates compounds, K2IrBr6 and K2IrCl6. The emphasis has been laid on the anharmonic treatment of ADPs, in order to characterize the nature of structural phase transitions and the instabilities in this family of materials. In addition we show that the occurrence of the rotational distortion in the broad class of antifluorites can be well understood in terms of a tolerance factor.
2 Methods
The antifluorite compounds were synthesized by chemical conversion of H2OsCl6 (respectively H2OsBr6) with the respective alkali metal chloride (respectively bromide) or ammonium bromide and dissolved in diluted HCl (respectively HBr). Small single crystals with a size of ca. 100 m were grown by controlled evaporation of the solvent during a growth period of 2-5 weeks. The iridate compounds were grown using commercially available K2IrCl6 (respectively K2IrBr6) from diluted HCl (respectively HBr) in a similar way as described above.
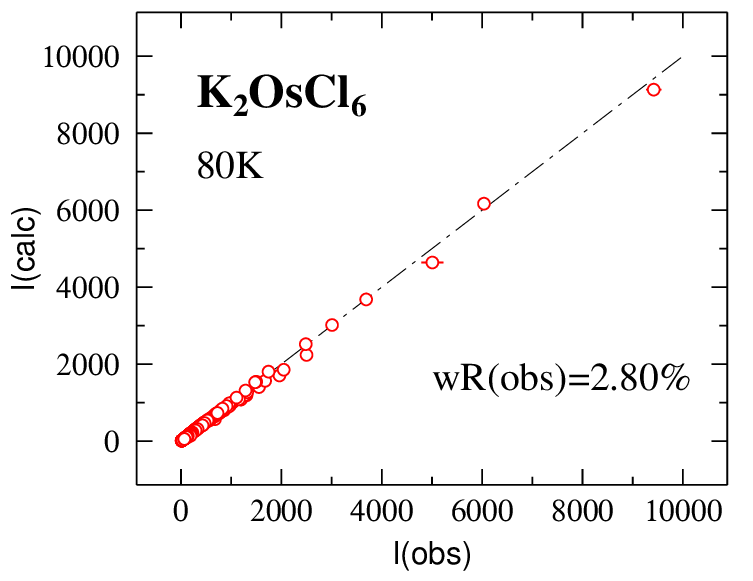
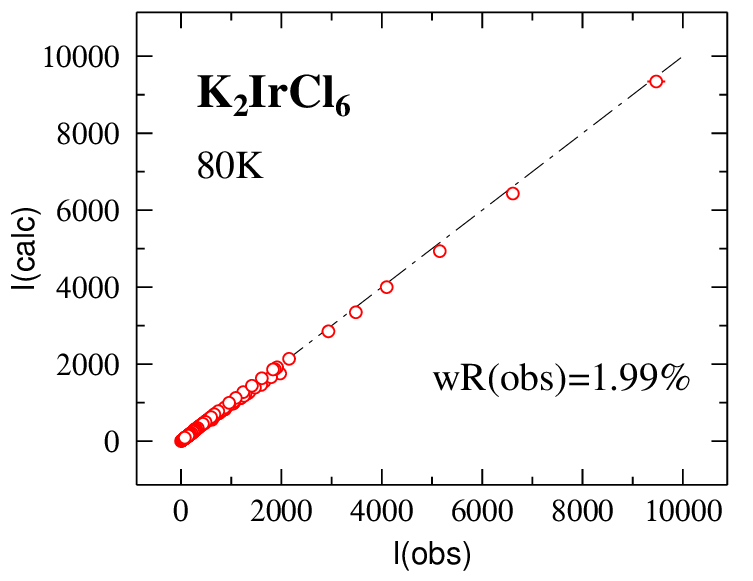
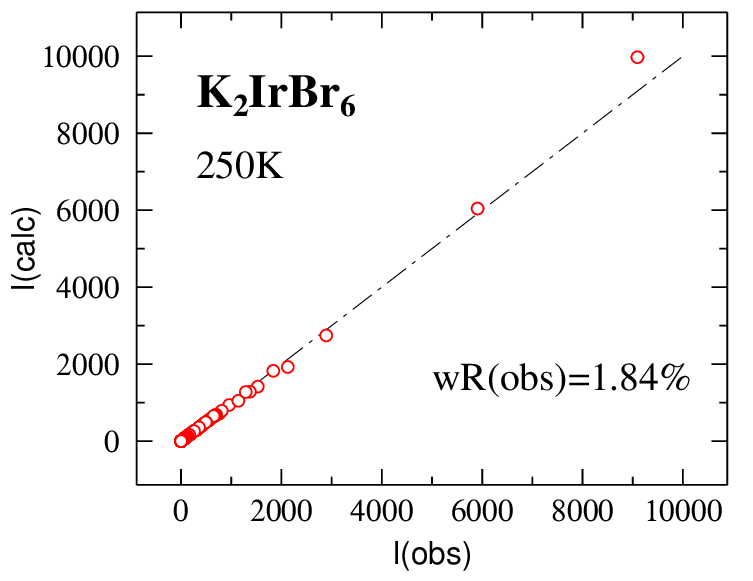
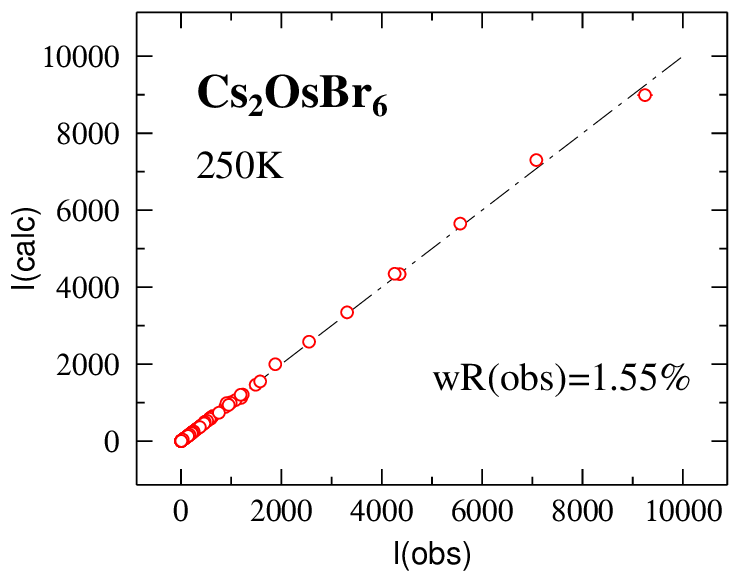
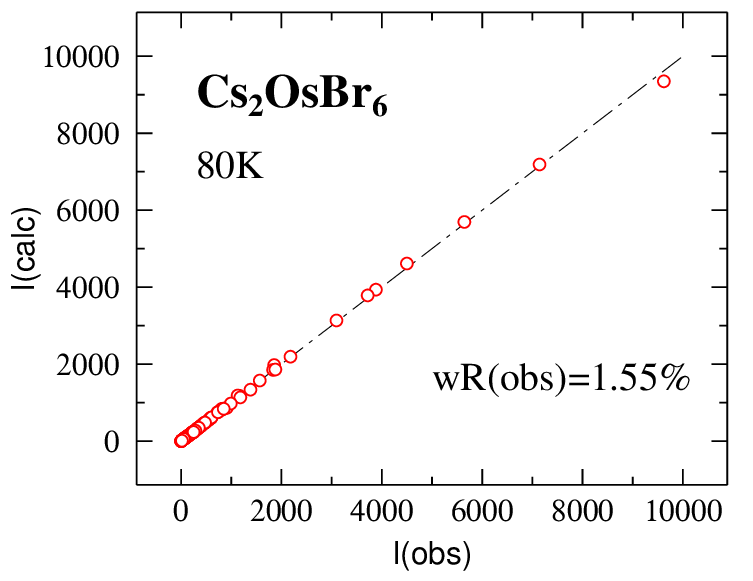
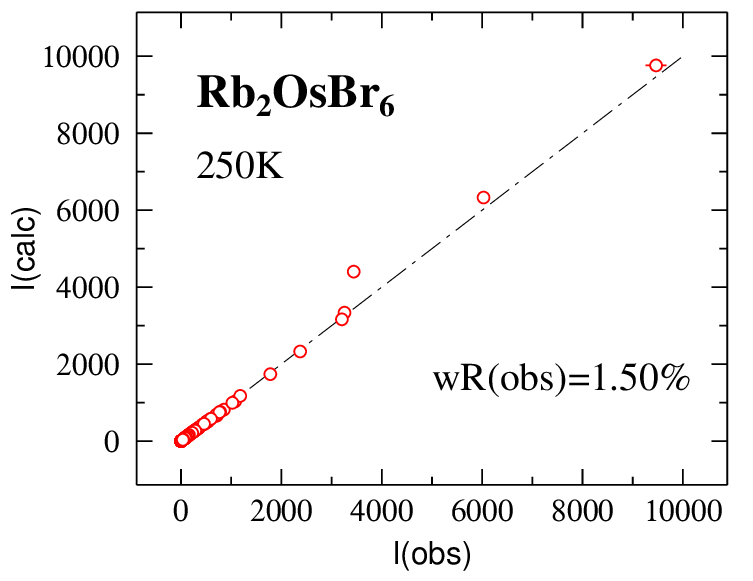
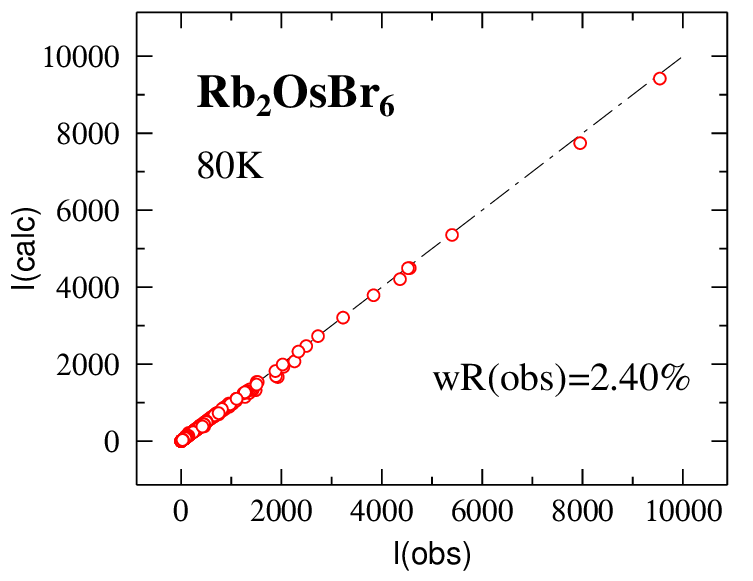
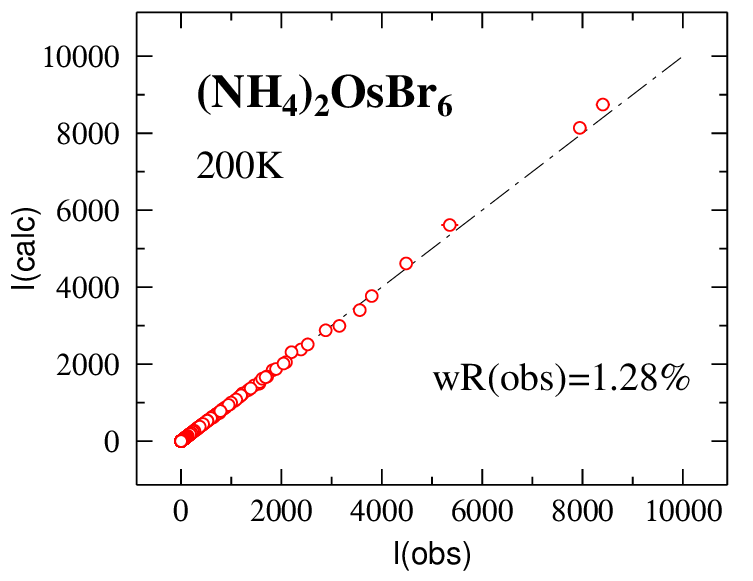
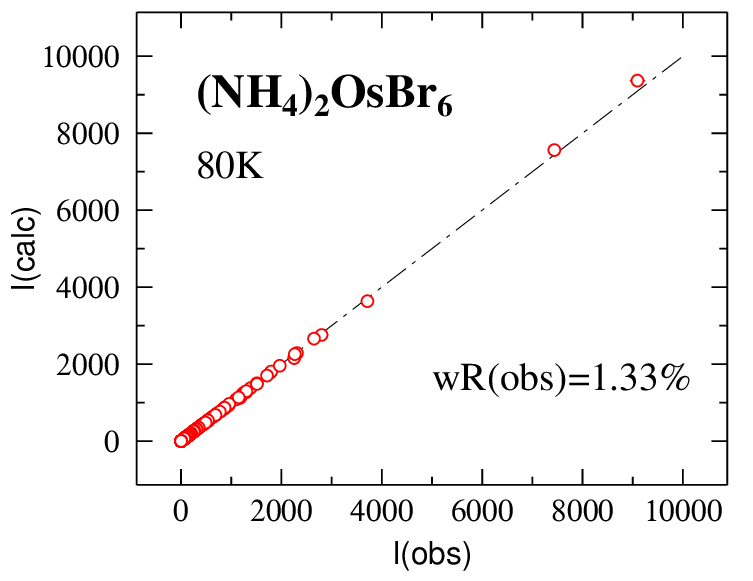
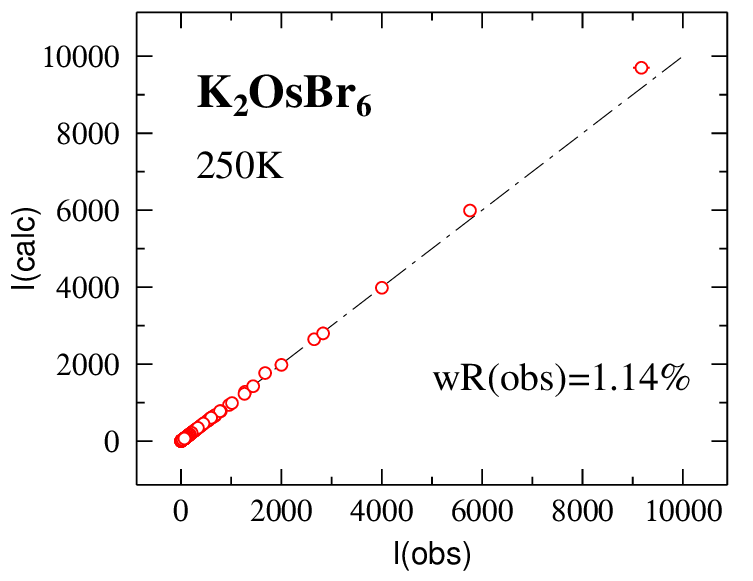
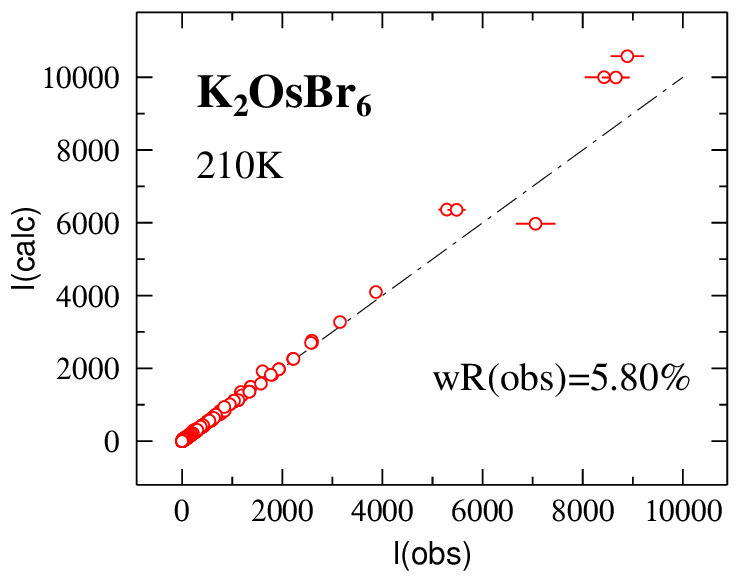
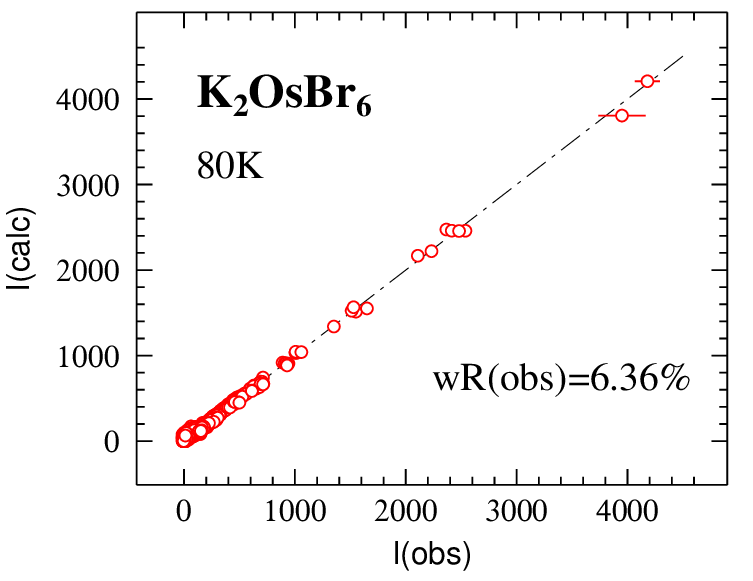
Single-crystal XRD measurements have been performed at various temperatures using a Bruker single-crystal diffractometer D8-Venture with Mo radiation, Å. Reflection intensities have been integrated using the Apex4 software, and absorption correction and scaling performed with the Multiscale algorithm. Refinements have been carried out with Jana2020 [18] applying an extinction correction with an isotropic Becker-Coppens formalism [19]. The quality of each refinements are evaluated from the -factors and GOF parameters provided throughout the main text. Additionally, correlation plots showing the calculated (I(calc)) against the measured (I(obs)) integrated intensities are given in A. The sample sizes have been described by a parallelepiped with dimensions reported in Table 1.
3 Crystal-structure analyses by X-ray diffraction
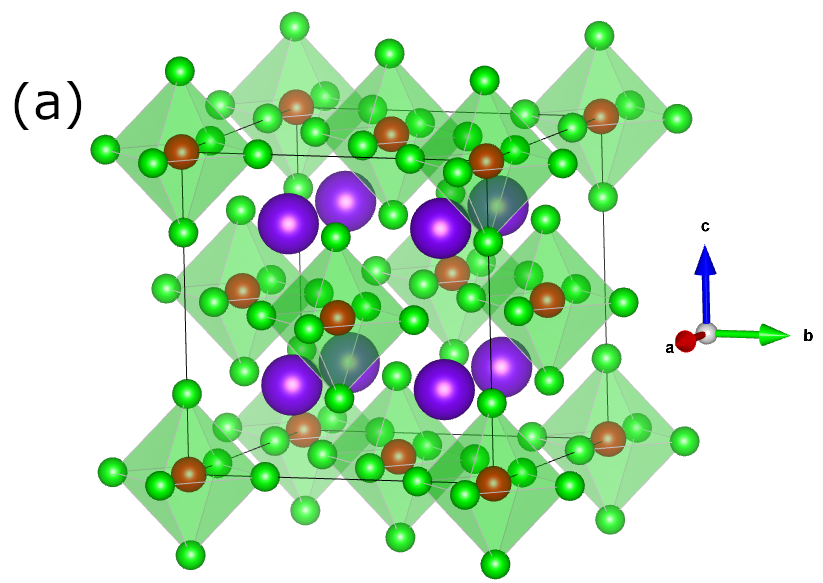
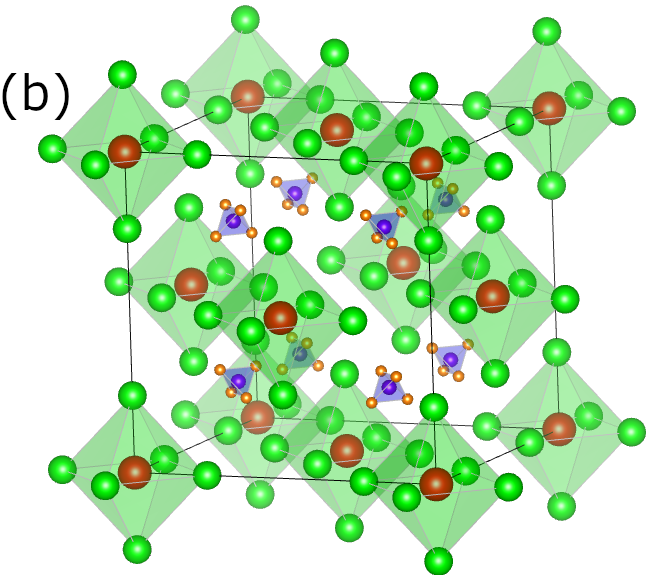
At room temperature, all samples crystallize in an cubic structure shown in Figure 1(a) and described with the space group: and ions occupy the Wyckoff positions (0,0,0), , and (,0,0), respectively. In the ammonium complex, N and H ions occupy the Wyckoff positions , and , respectively. The stoichiometry of the seven samples— with K, Rb, Cs, NH4 Os, Ir and Cl, Br — has been verified using the data sets collected at 250K in the cubic phase (and at 200K for K2IrCl6 and (NH4)2OsBr6). Refinements with symmetry-allowed harmonic ADPs and with keeping the site occupancy of the transition-metal ion to its stoichiometric value have been carried out using the ionic X-ray form factors of K+/Rb+/Cs+, Cl-/Br-, and Os4+/Ir4+. For the ammonium group, the atomic form factors are used. The occupancies of the and ions have been refined and are tabulated in Table 2. For the -factors and GOF parameters given in Table 2, values on the left and right sides of symbol “” correspond to harmonic refinements in stoichiometric and non-stoichiometric conditions, respectively. With the exception of Cs2OsBr6, there is no indication for a significant amount of vacancies or of excess scattering in the Osmate and Iridate samples. While the amount of vacancies at the site with increasing ionic radius seemingly increases, this minor occupational deviation for Rb2OsBr6 can be ascribed to imperfections of the form factors. Therefore, we fixed the site occupations to the ideal ones in all refinements described below. With the 250 K data sets we verified that this does not change any parameters by more than one standard deviation. Only for Cs2OsBr6 the analysis indicates a small but significant amount of the vacancies at the Cs and Br sites.
In the following, crystal structures of the compounds K2OsBr6, K2IrBr6, K2OsCl6, K2IrCl6, Rb2OsBr6, Cs2OsBr6, and (NH4)2OsBr6 will be discussed in details in Section 3.1, Section 3.2, Section 3.3, Section 3.4, Section 3.5, Section 3.6, and Section 3.7, respectively.
-
Sample Rb2OsBr6 K2OsCl6 K2OsBr6 Size m m m T (K) 250K 80K 250K 80K 250K 210K 80K Space group reflect. 39054 36537 39652 38209 39293 139182 111521 Unique 181 279 240 239 175 1665 6748 175 268 240 239 172 988 2757 0.83 Å-1 1 Å-1 1 Å-1 1 Å-1 0.83 Å-1 0.85 Å-1 0.87 Å-1 (Å) 10.4265(15) 10.3518(3) 9.7813(12) 9.7144(6) 10.3187(3) 10.3007(8)a 10.2477(12)a 6.12 % 5.96 % 6.52 % 6.75 % 6.27 % 6.75 % 8.93 % Sample Cs2OsBr6 K2IrBr6 K2IrCl6 (NH4)2OsBr6 Size m m m m T (K) 250K 80K 250K 200K 200K 80K 200K 80K Space group reflect. 31830 21836 48029 130375 92446 95520 88788 118931 Unique 127 127 392 364 336 333 397 393 122 114 375 364 336 333 379 378 0.71 Å-1 0.71 Å-1 1.14 Å-1 1.11 Å-1 1.14 Å-1 1.14 Å-1 1.14 Å-1 1.14 Å-1 (Å) 10.6456(7) 10.5761(4) 10.2826(14) 10.2639(3) 9.7245(4) 9.6790(10) 10.3536(8) 10.3072(5) 7.02 % 7.13 % 6.09 % 5.71 % 6.20 % 6.76 % 5.84 % 6.93 % -
a Integration with a primitive pseudo-cubic unit cell
-
Occ.() Occ.() GOF(all) K2OsCl6 1.00(2) 1.025(8) 2.17/2.10 2.90/2.85 2.56/2.53 K2OsBr6 1.02(1) 1.005(6) 1.34/1.34 1.73/1.72 1.36/1.36 Rb2OsBr6 0.981(7) 0.976(6) 1.90/1.77 1.90/1.80 1.56/1.49 Cs2OsBr6 0.953(5) 0.958(6) 1.54/1.14 1.95/1.30 1.48/1.00 (NH4)2OsBr6 0.98(3)a 0.998(2) 1.28/1.28 1.43/1.42 1.03/1.03 K2IrCl6 1.02(1) 1.015(5) 1.20/1.22 1.83/1.76 1.44/1.39 K2IrBr6 1.01(1) 0.987(4) 2.30/2.35 2.42/2.38 1.53/1.51 -
a Only the occupancy of the N atom is refined in the ammonium molecule. Atomic form factors are used for N and H atoms.
3.1 K2OsBr6
K2OsBr6 undergoes two structural phase transitions, first at K towards a tetragonal symmetry described by the space group, and marked by a pronounced anomaly in specific heat measurements [20]. The second structural phase transition does not show any pronounced feature in thermodynamic measurements, but synchrotron powder diffraction experiments indicate a further symmetry reduction around K to a monoclinic space group , where the monoclinic angle starts to deviate from 90∘ [20]. Therefore, K2OsBr6 exhibits the same sequence of structural phase transitions as the sibling compound K2IrBr6 [8]. Also in the latter compound, fingerprints of the second structural phase transition were not found in thermal expansion or specific heat measurements, but only in powder XRD [8].
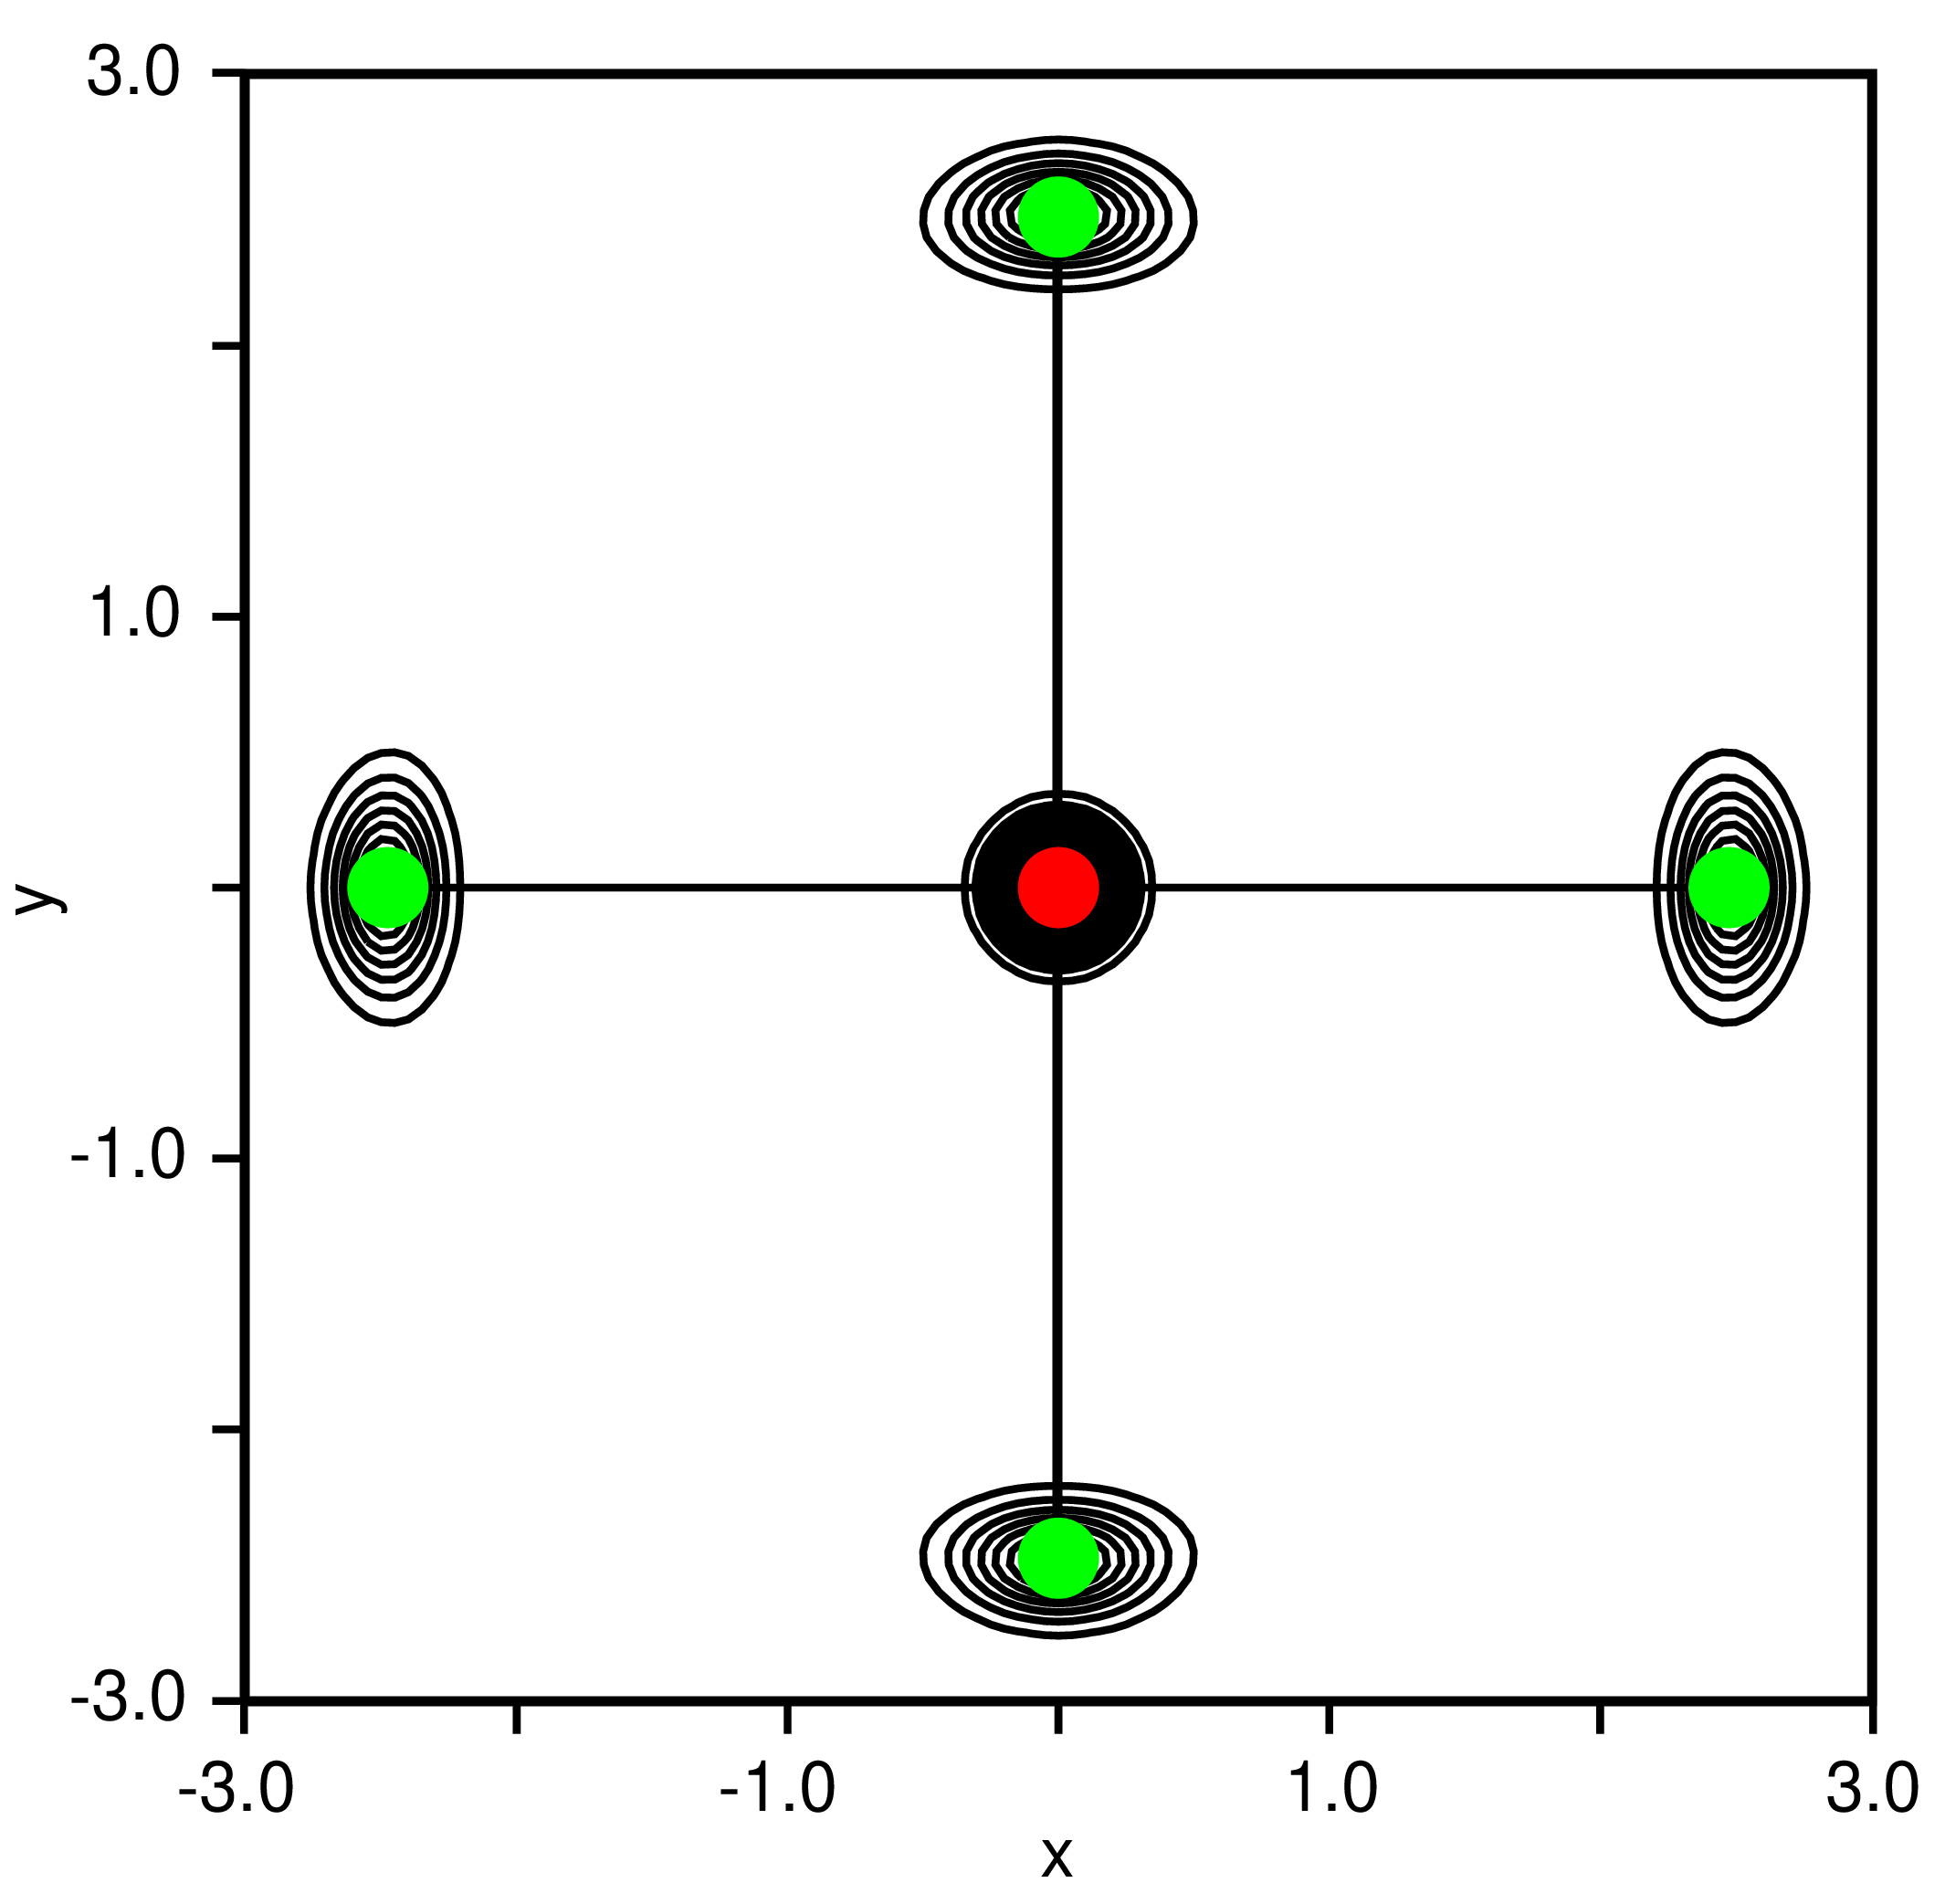
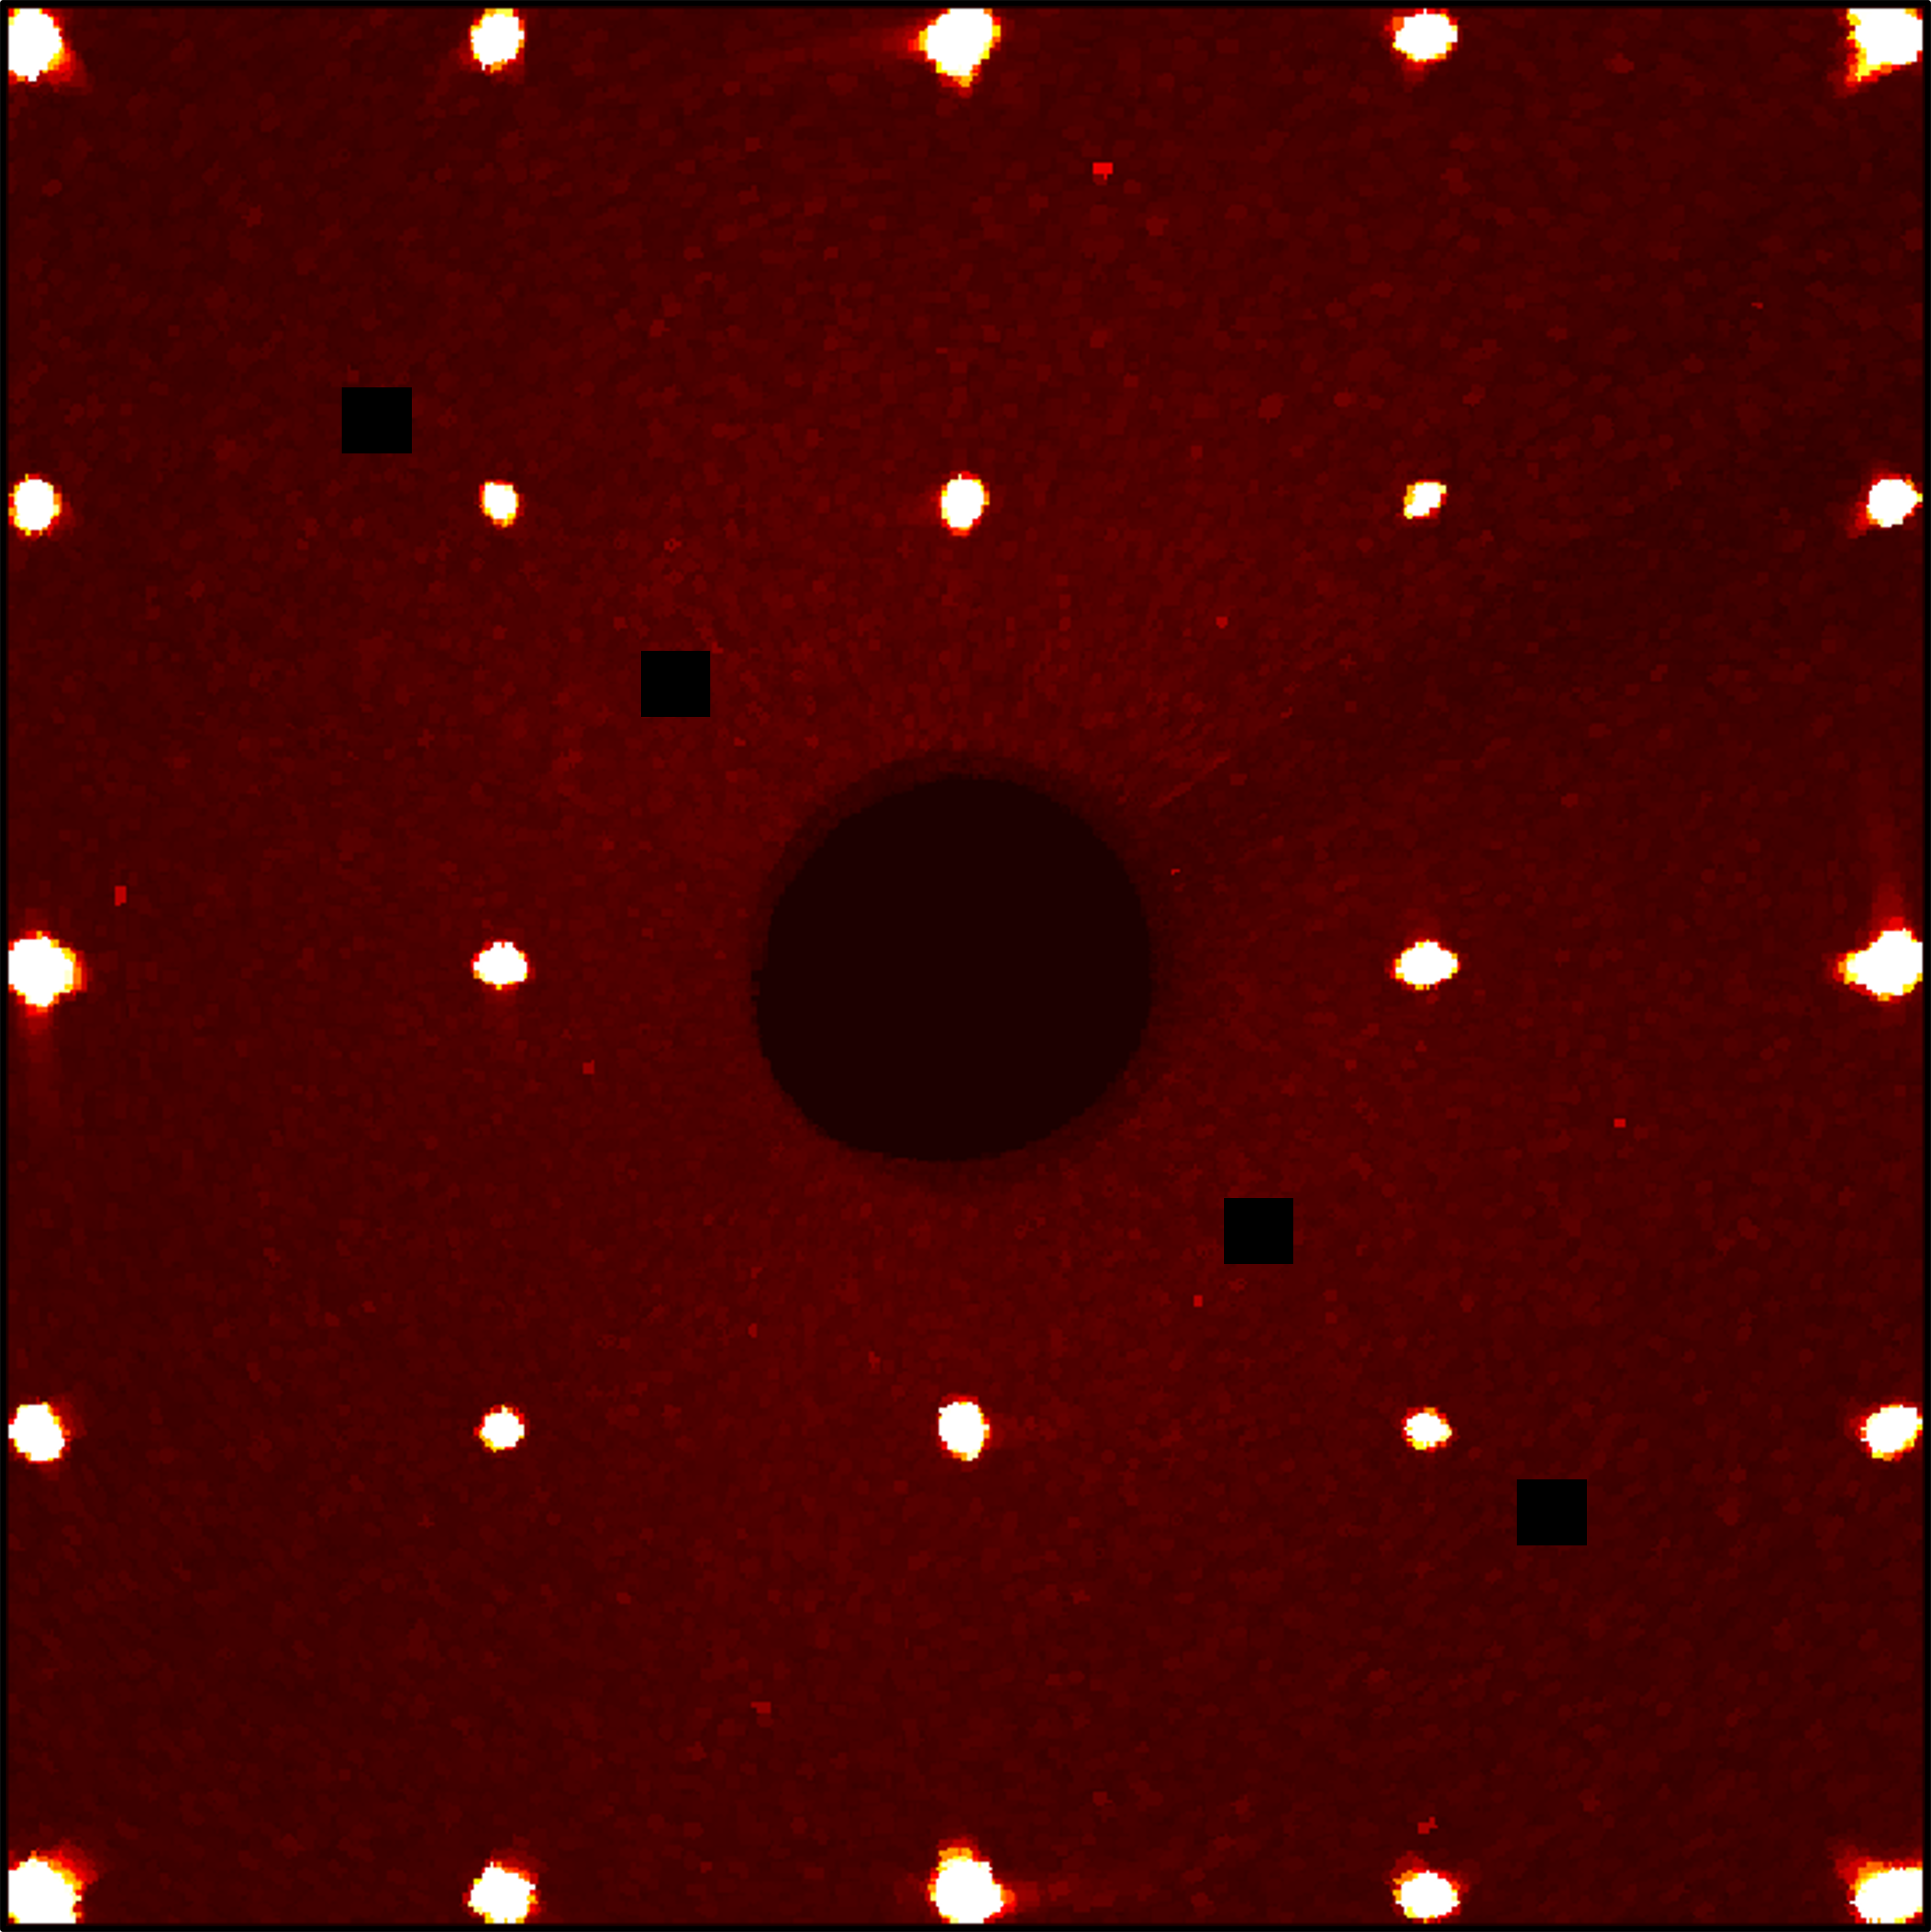
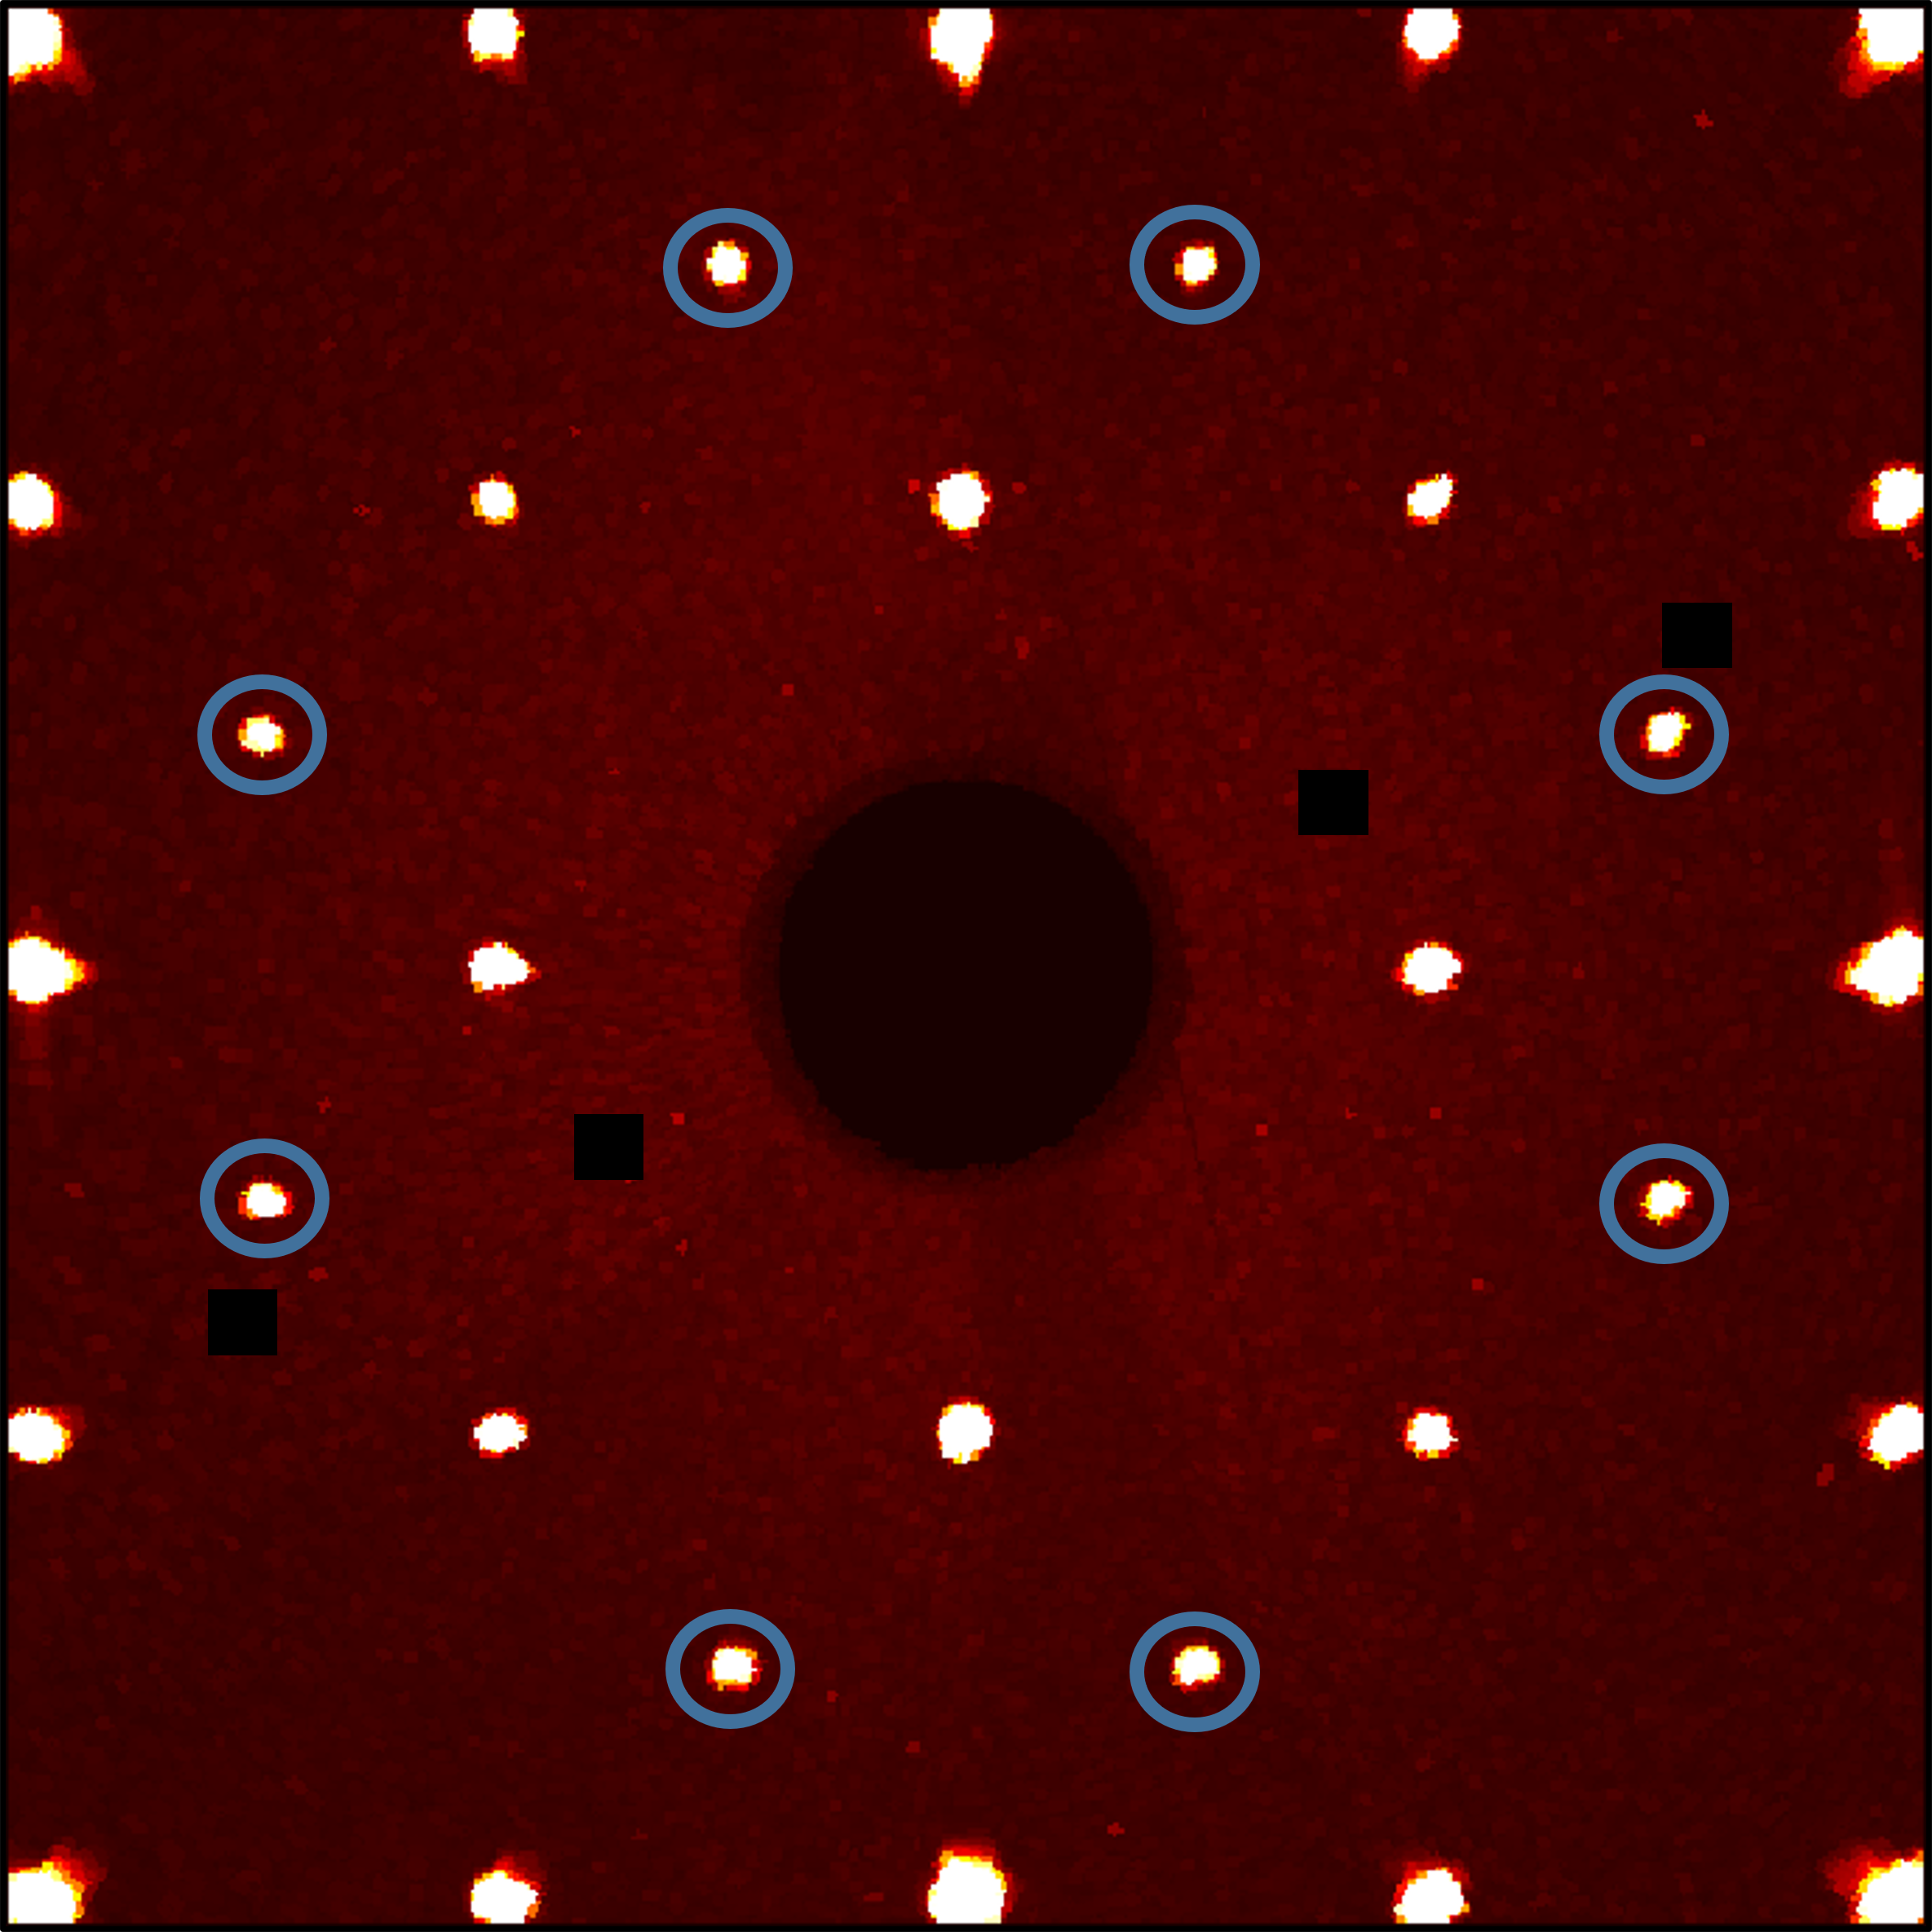
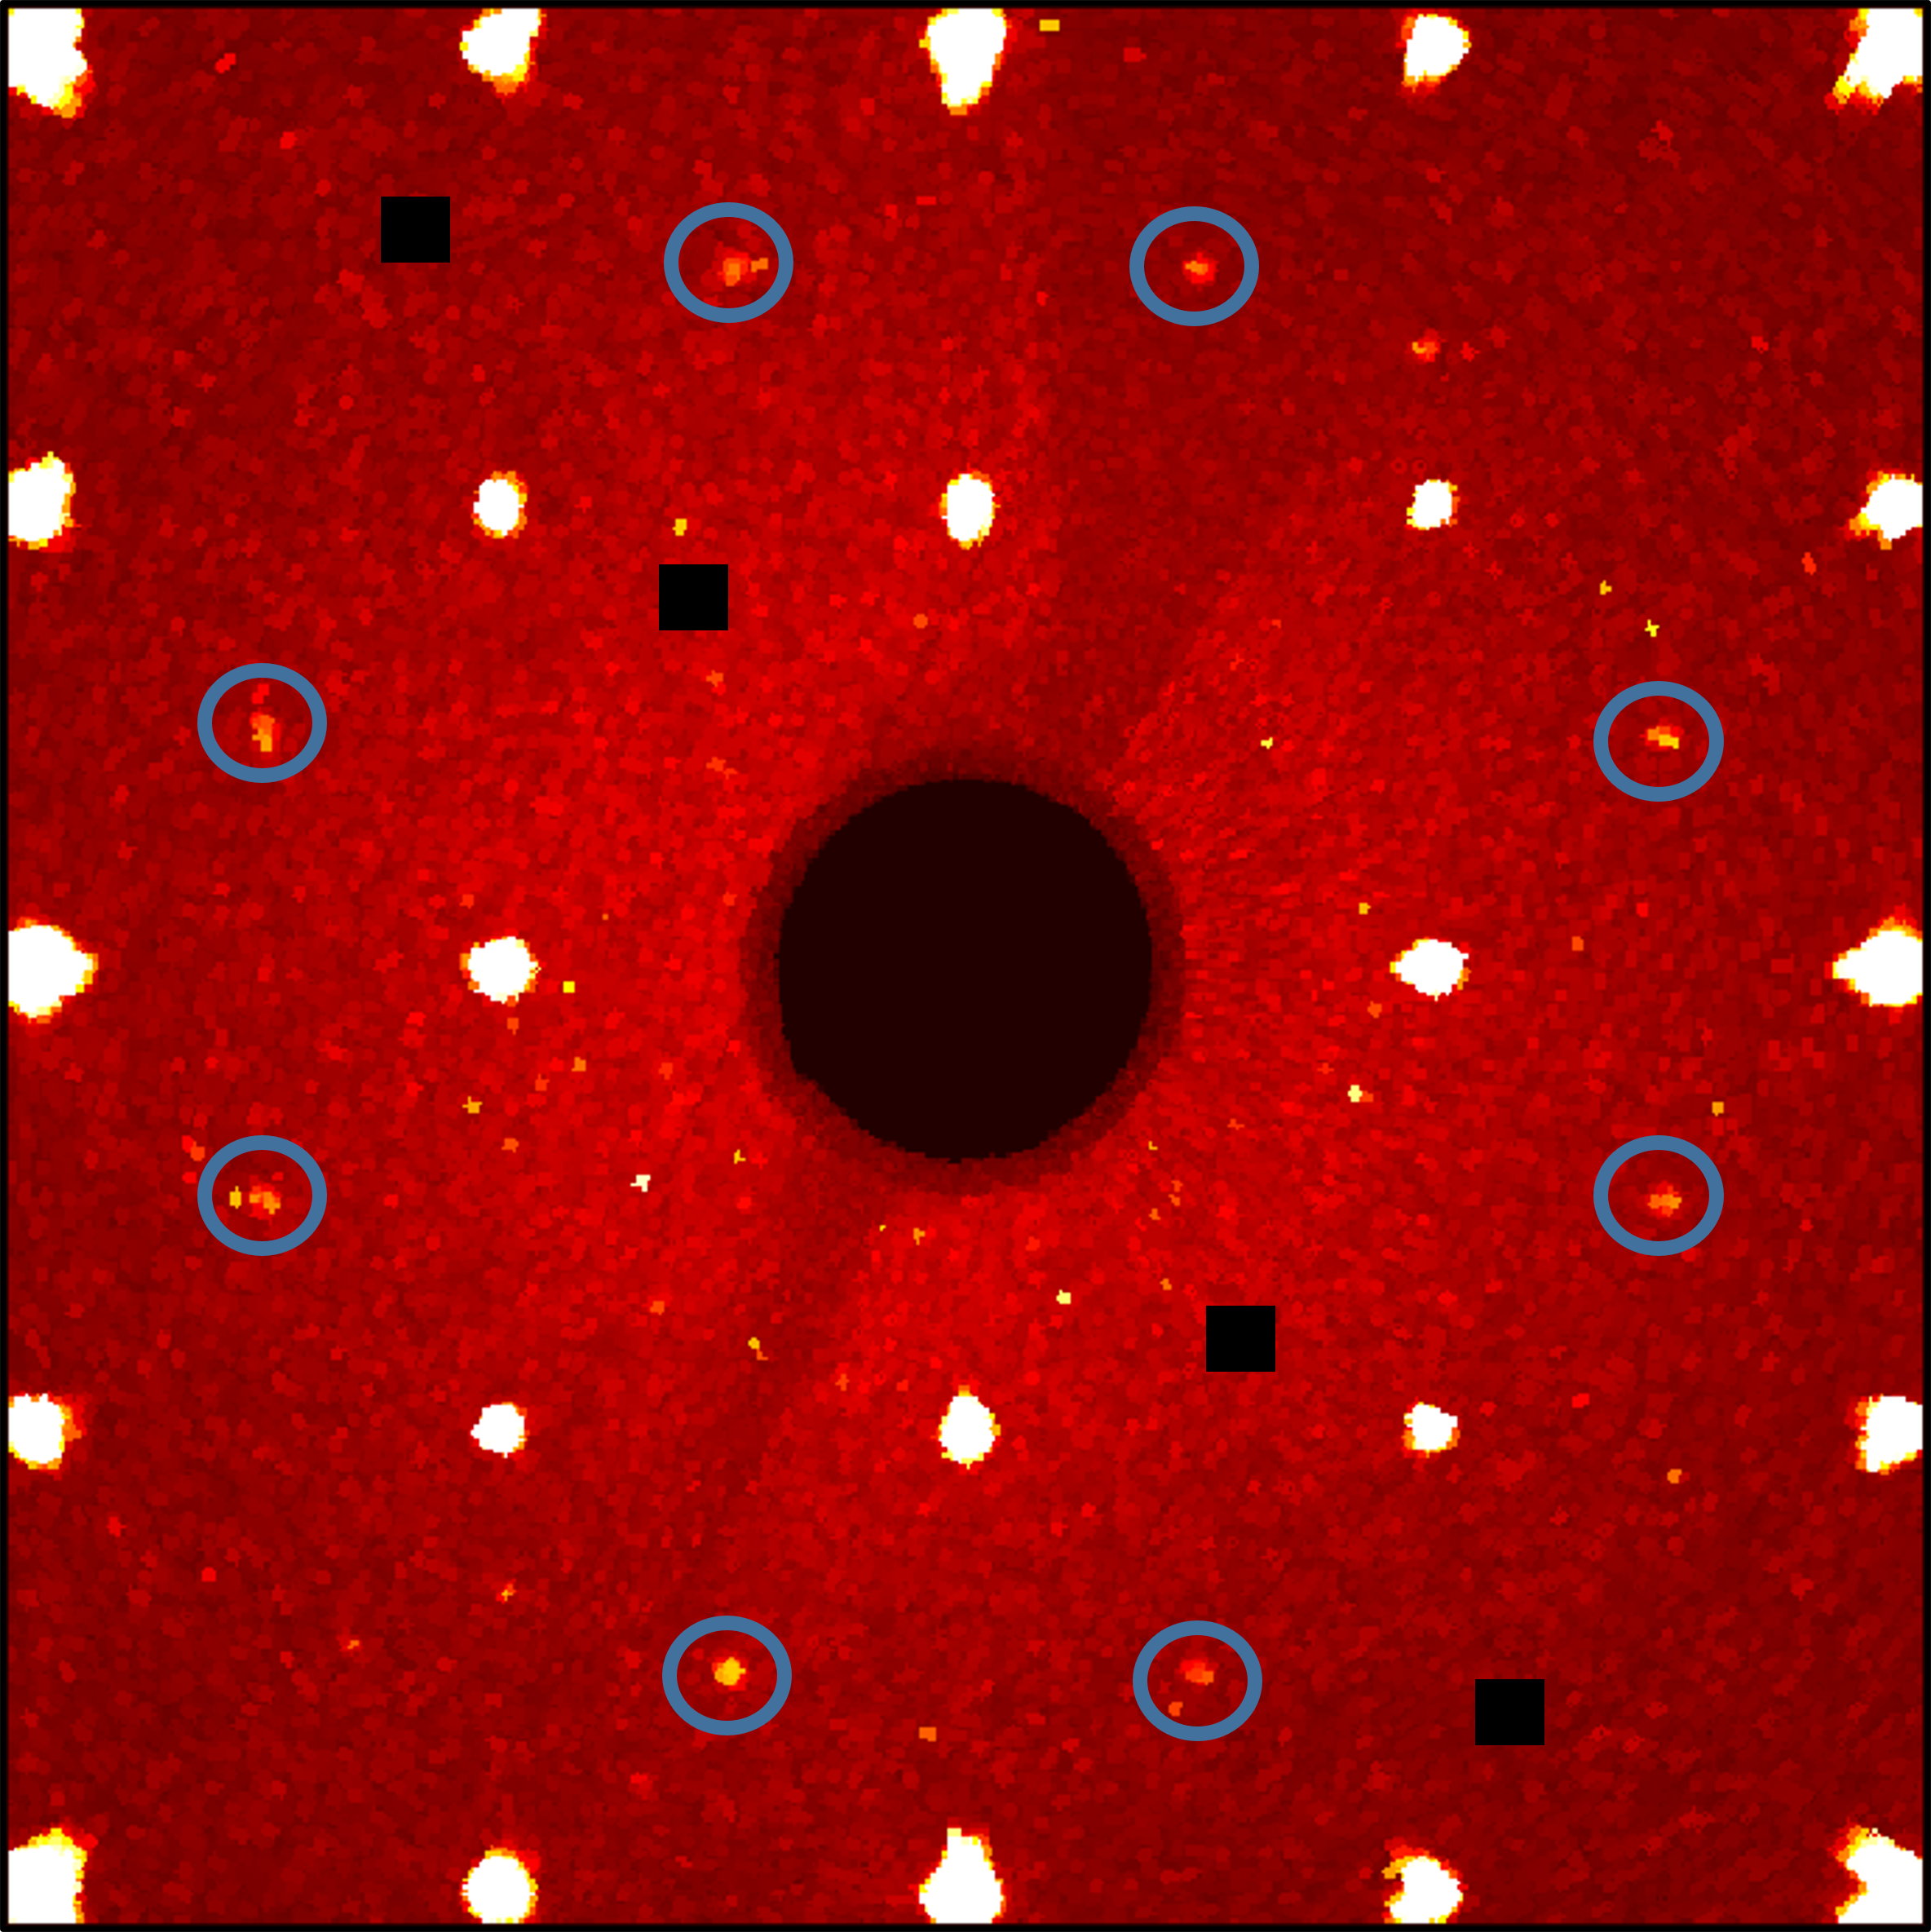
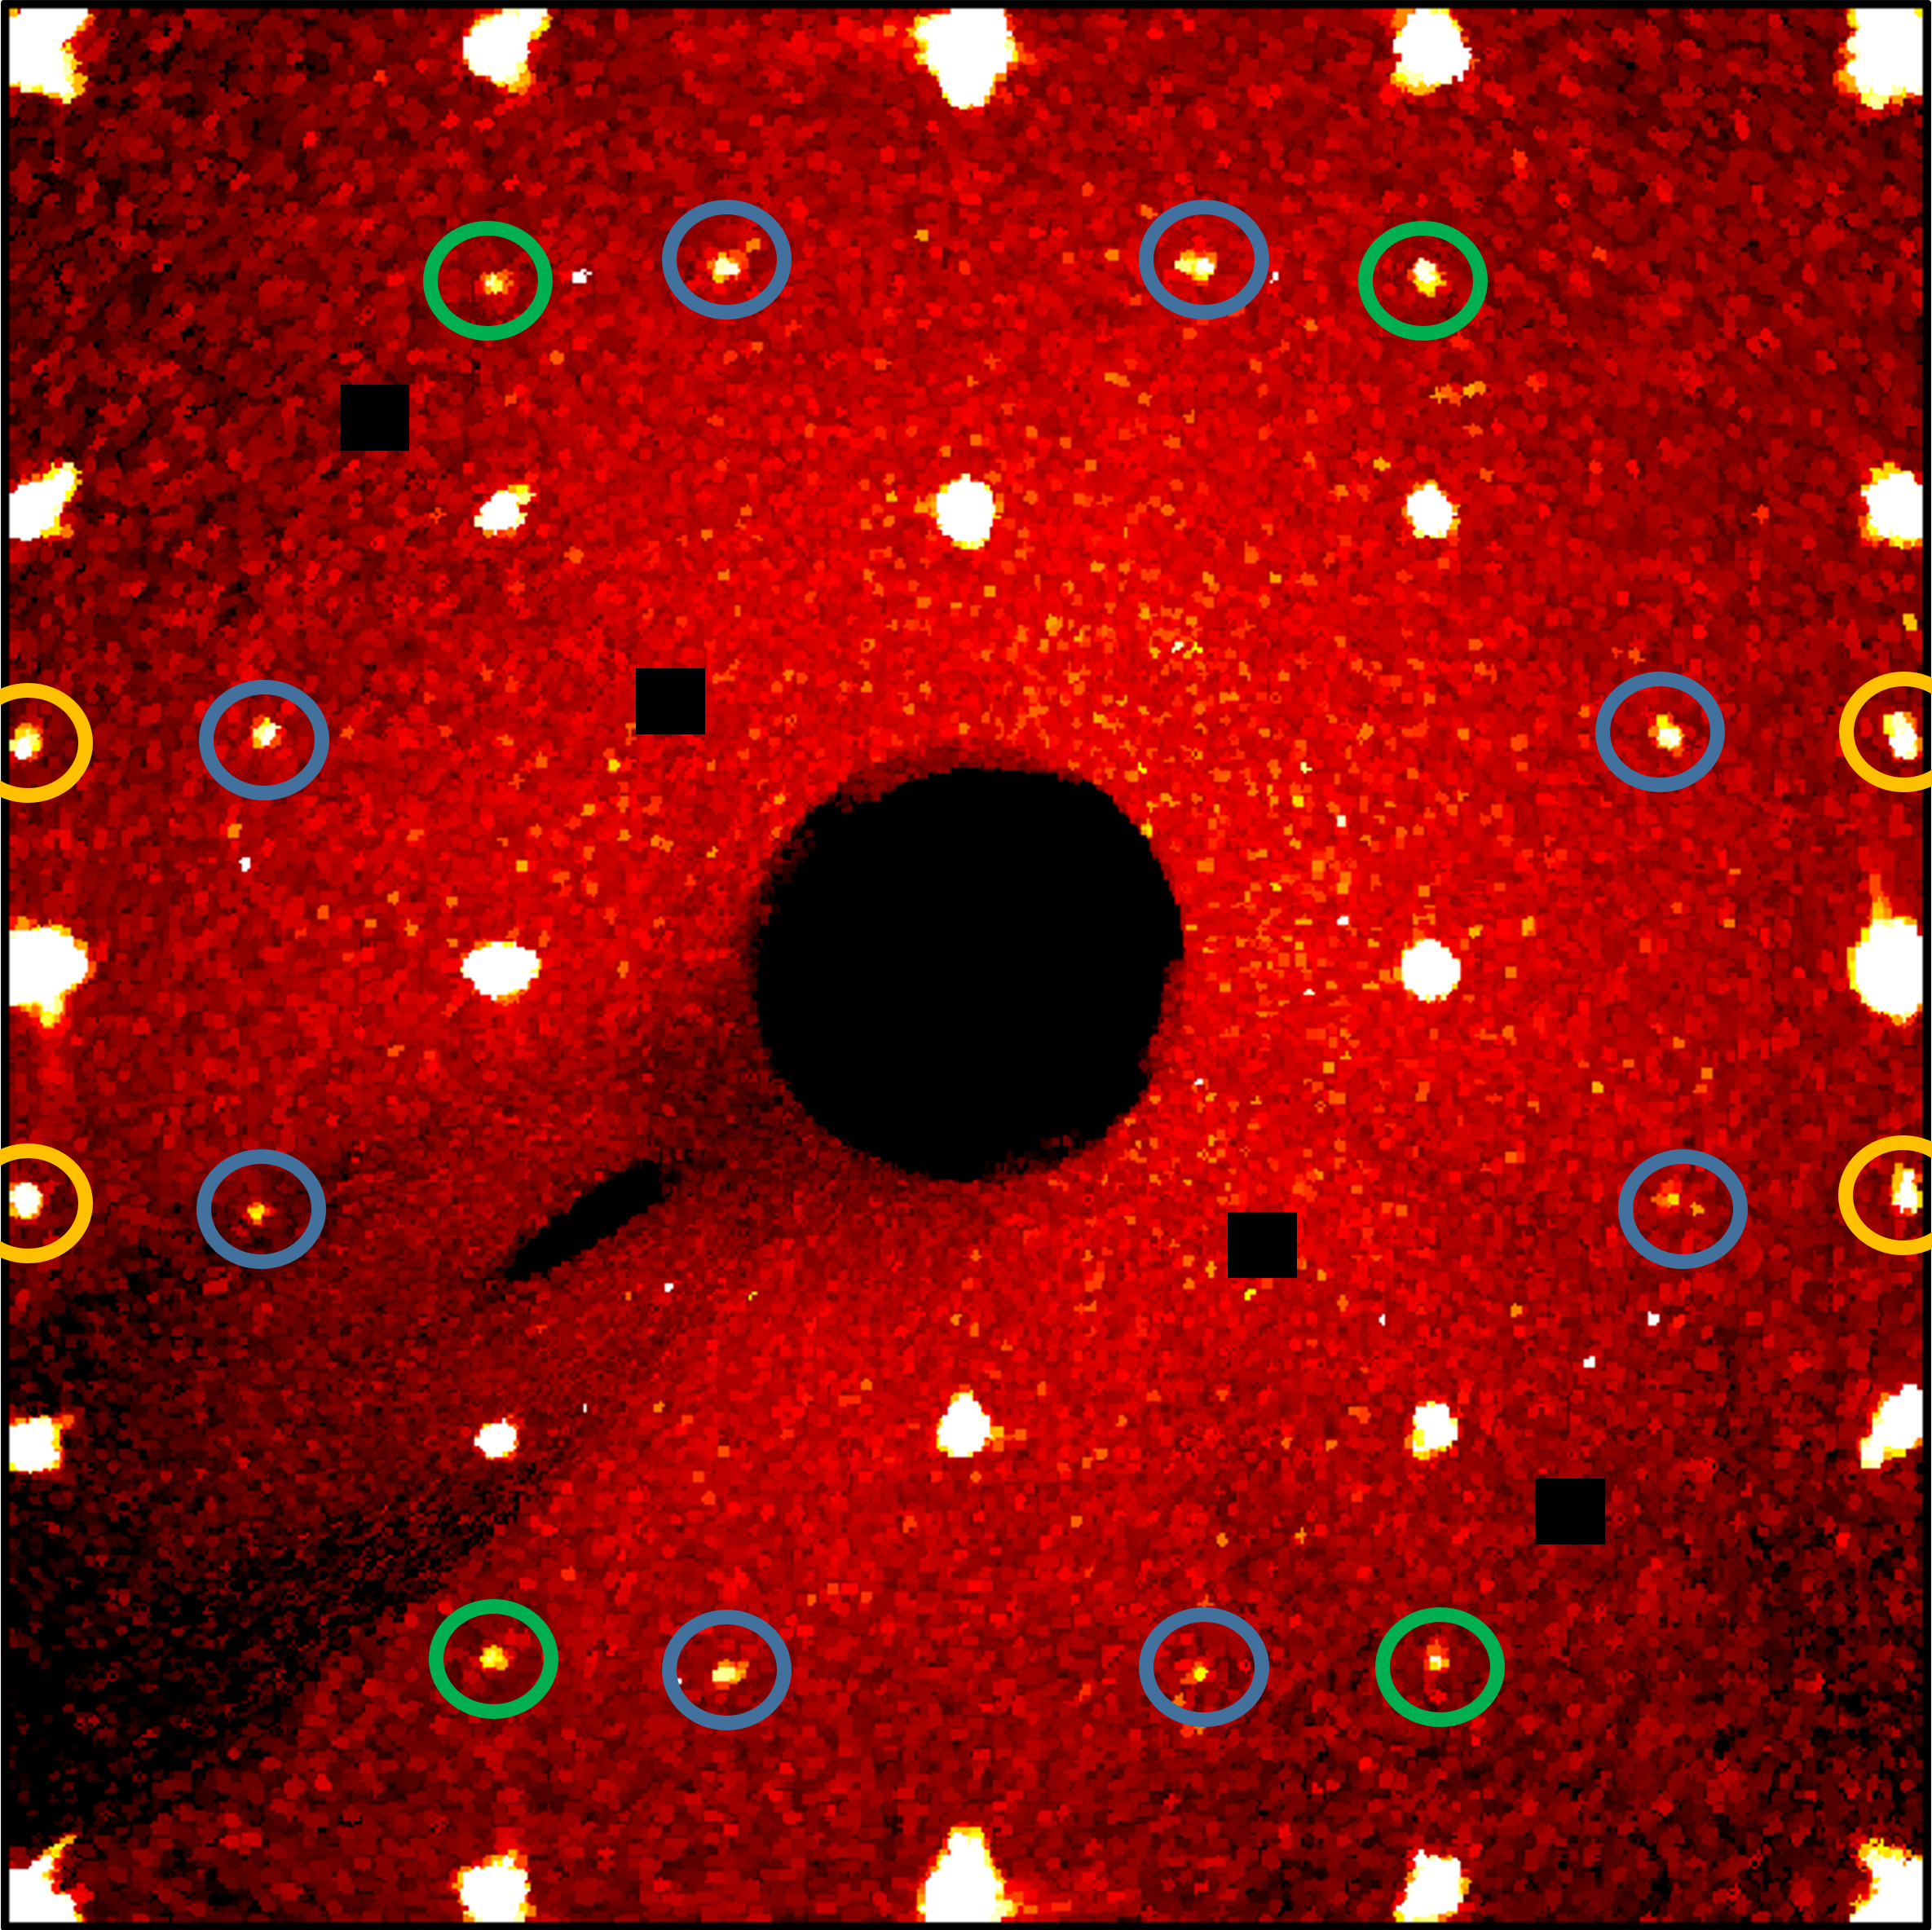
Figure 2 shows calculated precession maps computed for K2OsBr6 with a cubic unit cell demonstrating the excellent crystal quality. Few spurious reflections masked by black squares indicate the presence of an additional weakly scattering grain in the sample. The upper two panels of Figure 2 show the (hk0) reciprocal-space planes at 250K in the cubic phase and at 210K in the tetragonal phase. Strong superstructure reflections of type indicated by the blue circles show the breaking of the centering to a cubic centered cell with the same lattice parameters. The corresponding space group is or in a non-standard notation preserving the cubic lattice constants. In the tetragonal centered lattice with 10 Å lattice parameters, the glide-mirror plane perpendicular to the tetragonal axis with translation component becomes a glide-mirror plane perpendicular to the cubic axis with translation component . Because of this unusual translation component, the glide-mirror is labeled in the non-standard notation used here. The and indexes refer to the cubic and tetragonal basis, respectively. In the latter basis, the in-plane and tetragonal axes are shorter by a factor and rotated by 45∘ with respect to the in-plane cubic axis. These lattice parameters further correspond to the monoclinic and parameter in the phase at low temperatures. The lower two panels of Figure 2 show the (h0l) maps at 210K and at 80K. The blue circles also indicate superstructure reflections of type (301). Since the phase transition is ferroelastic reducing the point-group symmetry from cubic to tetragonal, three orientations of twin-domains arise with mutually perpendicular orientation of the 4-fold axis. Therefore, these reflections still preserve the centering since they arise from -type reflections of another twin orientation. Note that these superstructure reflections are much weaker pointing to a dominance of one twin orientation, in line with the refinement results at 210K and 80K. Additional superstructure reflections are clearly visible in the (h0l) map at 80K, highlighted by green and yellow circles for and -type reflections, unambiguously documenting the breaking of the two glide-mirror symmetry operations belonging to . This is a clear indication of a symmetry lowering phase transition to the monoclinic space group , hence supporting the findings of [20]. This phase transition from tetragonal to monoclinic point-group symmetry is of ferroelastic type again and gives rise to further twinning of the crystal. In total, 12 different twin orientations can be expected in the monoclinic crystal at 80 K.
-
250K 210K 80K () This worka a=10.3187(3)Å a=10.3021(8)Å a=10.2477(12)Å Reference [20] Å Å Å Å Å Å Os (0,0,0) (0,0,0) (0,0,0) (Os) 0.01835(9) 0.0180(1) 0.0131(1) 0.01837(7) K () () 0.4912(3), 0.0303(3), 0.2481(6) (K) 0.0461(4) 0.0423(5) 0.0177(4) 0.0459(3) Br1 0.24028(4), 0, 0 0.24087(6), 0.02294(9), 0 0.2740(2), -0.2092(3), 0.0192(1) 0.23993(4) Br2 0, (Br1), 0 (Br1), (Br1), 0 0.2102(3), 0.2732(2), 0.0128(2) Br3 0, 0, (Br1) 0, 0, 0.2388(1) -0.0349(1), 0.0030(2), 0.2380(1) (Br) 0.0182(2) 0.0590(2) 0.0185(2) 0.0444(2) 0.0141(1) 0.0167(1) 0.0190(3) 0.0585(2) twvol 1,2,3 (%) - 93.4(2), 2.8(1), 3.8(1) 18.3(7), 16.4(2), 2.4(2) twvol 4,5,6 (%) - - 1.0(2), 1.1(2), 0(f) twvol 7,8,9 (%) - - 0.4(2), 1.1(2), 29.8(3) twvol 10,11,12 (%) - - 0.7(2), 27.5(2), 1.5(2) - , - - , , (obs)(%) 1.29 1.61 4.96 5.80 6.17 6.36 1.02 1.14 , (all)(%) 1.34 1.64 7.38 5.95 15.43 6.84 1.07 1.18 GOF (obs/all) 1.27 1.28 3.56 2.81 2.67 1.83 0.91 0.93 -
a For the lower symmetry phases, a primitive pseudo-cubic cell is used for the data integration.
-
K2OsBr6 250K 0(f) -0.00048(5) 0(f) 0(f) 0(f) -0.00021(5) K2IrBr6 250K 0(f) -0.00043(4) 0.00012(3) 0.00004(1) 0.00035(7) -0.00016(4) 200K 0(f) -0.00031(4) 0.00009(3) 0.00005(1) 0.00008(7) -0.00021(4) K2OsCl6 250K 0(f) -0.00002(1) 0(f) 0(f) 0(f) -0.00015(9) 80K 0.0002(1) 0(f) -0.00037(9) -0.00009(2) -0.00028(8) -0.00007(5) K2IrCl6 200K 0(f) -0.00026(5) 0(f) 0(f) 0(f) 0(f) 80K 0(f) 0(f) -0.00011(4) -0.00005(1) -0.00013(4) -0.00004(2) Rb2OsBr6 250K 0(f) -0.00017(4) 0(f) 0.00008(2) 0.00042(7) 0.00007(3) 80K 0(f) -0.00007(3) 0.00006(4) 0.00002(1) 0.00018(4) 0.00003(2) Cs2OsBr6 250K 0.0006(2) 0.00013(8) 0.0003(2) 0(f) 0(f) -0.00007(6) 80K 0.0003(2) 0.00016(9) 0.0003(2) 0.00009(5) 0.0002(1) 0(f) (NH4)2OsBr6 250K 0(f) -0.00010(1) 0(f) 0(f) 0.00008(2) 0(f) 80K 0(f) 0(f) 0(f) 0(f) 0.000024(9) 0(f)
-
Occ. () x y z Br 1 0.24027(4) 0.0158(9) 0 ADPs (Os) (K) (Br) (Br) (Å2) 0.01830(9) 0.0461(4) 0.0184(2) 0.0446(17) -values (%) 1.24 1.54 1.29 1.57 GOF(obs) GOF(all) 1.22 1.24
Single-crystal XRD data have been collected in the three different crystallographic phases: at 250K in the phase, at 210K in the tetragonal phase, and at 80K in the phase. An overview of the data completeness is given in Table 1. Because of the small tetragonal and monoclinic distortion, and because of the twinning inherent to such symmetry lowering, both data sets have been integrated with a pseudo-cubic primitive unit cell with lattice parameters given in Table 1. The refined parameters in each phase are summarized in Table 3. For the cubic phase, the excellent -values and GOF parameters indicate the high sample quality. Within the cubic symmetry, ADPs of Os and K ions stay isotropic, while two anisotropic ADPs are introduced for the Br ions: and describing the atomic displacement parallel and perpendicular to the Os-Br bond, respectively. For the refinements in the lower symmetry phases, ADPs have been constrained to the symmetry allowed ADPs of the cubic phase. Therefore, ADPs of Os and K ions are kept isotropic, and only two harmonic ADPs for the Br ions are used at all temperatures. As it is commonly observed in the antifluorite-type compounds with disconnected octahedra, the transverse displacement of Br ions with regard to the Os-Br bond is about three times larger than that parallel to the bond. Soft rotational modes yield strongly anisotropic ADPs due to their large thermal occupation resulting from the low energies, as it has been quantitatively analyzed in La2-xSrxCuO4 [21]. In the antifluorite-type structure, which can be considered as a double perovskite with one empty site, the rotating octahedra are not connected by shared ligands, which yields a more local character of the rotations and thus a flatter dispersion. The impact of the phonon softening on the ADPs is much enhanced, because the softening occurs in a large fraction of the Brillouin zone.
As expected, all ADPs decrease monotonously with decreasing temperature, and only in the phase, the Br ADPs become almost isotropic. In the tetragonal phase the rotation around only one direction becomes static, while in there are static rotations around three orthogonal directions. In the tetragonal phase, the three domain volumes have been refined, and indicate an almost untwinned sample with a single dominating domain (%). In the monoclinic phase, with now twelve domains to consider, we also find that only 1/3 of the possible domains need to be considered in the refinement, in line with the refinement results in the tetragonal phase.
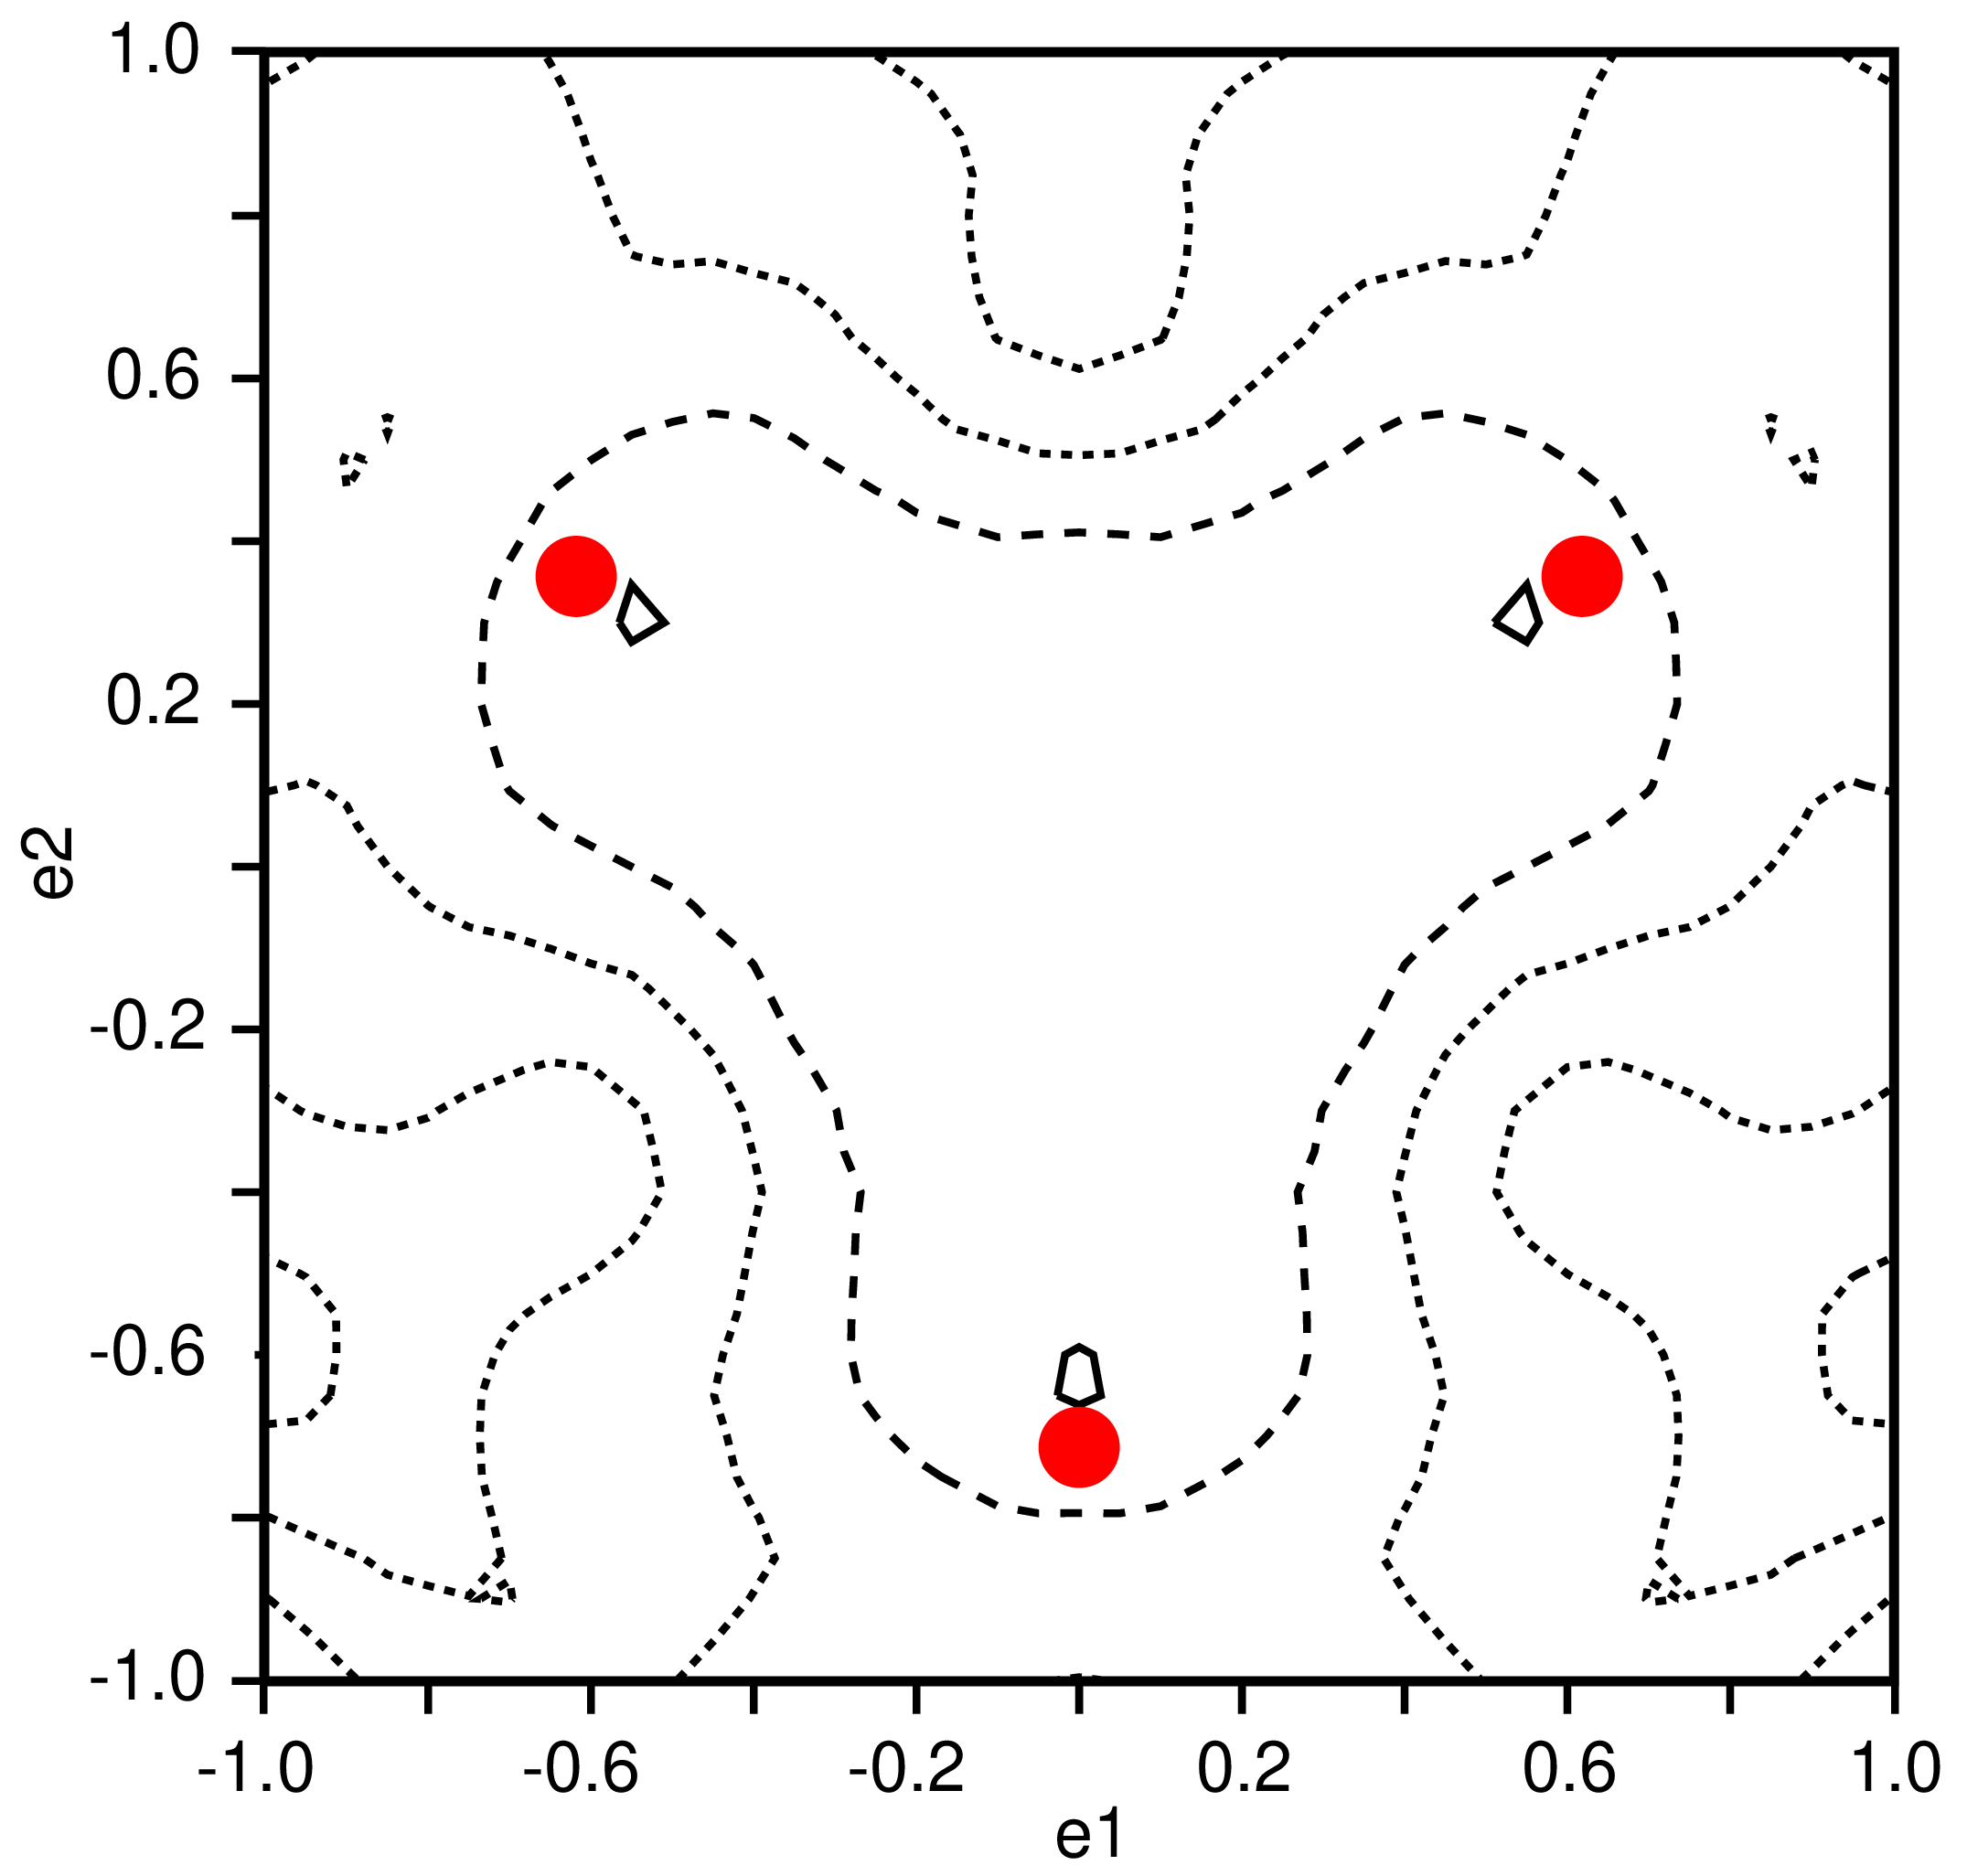
Even though the structural transition from cubic to tetragonal in K2IrBr6 is driven by octahedra rotations, the hysteretic behavior of thermal expansion measurements and the phase coexistence revealed by powder XRD indicate a first-order character, possibly caused by a tetragonal strain [8]. In this case, we may expect very strong anharmonicity of the Br ADPs and even a split probability distribution function. Therefore, a refinement of anharmonic ADPs with the data set collected at 250K in the cubic phase has been conducted. The refined parameters are summarized in Table 3. The table lines starting with the symbol “” indicate the values obtained in the anharmonic model. The refined anharmonic ADPs are tabulated in Table 4. The -values and GOF parameters are significantly improved yielding two anharmonic contributions exceeding at least four times their errors: and . However, we must emphasize that the refinement quality is already very high without the anharmonic terms, which just improve a little bit the description of the detailed probability distribution, which is shown in Figure 3. In this map one sees the bending of the probability ellipsoid at the Br sites that is expected for a rigid octahedron rotation. But the maximum of the probability stays at the high symmetry position ruling out an essential order-disorder character of the structural phase transition in K2OsBr6. The consistency of the anharmonic treatment was further verified by analyzing the residual electron densities. Significant amounts remain in the harmonic refinements close to the Br sites and are fully suppressed by the anharmonic treatment.
Because of the significant anharmonicity of the Br ions, a refinement in the cubic phase has been attempted by considering a disordered Br site, i.e. a split model. In , the Br ions occupy the Wyckoff site with atomic position (). In the split model, an additional degree of freedom is introduced in order to characterize the disorder: the Br atomic positions are now () but the occupancy of the Wyckoff site is maintained (or 1/4 of the full occupancy of the new Wyckoff site with atomic position ()). The refinement results are shown in Table 5. The refinement quality is only slightly improved compared to the one with the standard cubic model shown in Table 3. A significant non-zero deviation from the cubic symmetry is found but a strong correlation – intrinsic to this kind of model – occurs between the (Br1) deviation and (Br). The split displacement is still smaller than the root mean-square displacement in the perpendicular direction, which signifies that the maximum of the probability density stays at the high-symmetry value.
Both the moderate anharmonic ADPs yielding only slight changes in the probability distribution and the failure of the split model to considerably improve the refinement quality exclude a predominant order-disorder character of the structural phase transition in K2OsBr6. The local character of the rotational modes in the antifluorite-type structure results in large and strongly anisotropic ADPs that remain however of dynamic origin.
3.2 K2IrBr6
K2IrBr6 undergoes two structural transitions, first towards a tetragonal phase with SG at K, and then towards a monoclinic phase with space group around K where the monoclinic distortion is inferred from the temperature dependence of the lattice parameters, even though no macroscopic signature is visible [7, 8]. The tetragonal distortion of the octahedra remains negligible at all temperatures while an orthorhombic distortion of % develops in the monoclinic phase [8]. Even though the rotary phonon mode describes the primary order parameter, the hysteretic behavior in thermal expansion measurement and the phase coexistence in powder XRD suggest that the upper structural transition possesses some 1st-order character driven by the emergence of a pronounced tetragonal strain, acting as a secondary order parameter [8]. However this behavior does not imply an order-disorder scenario.
Therefore, single-crystal XRD measurements have been performed at 250K and 200K in the cubic phase, see Table 1 for an overview of the data set completeness. The lattice parameters at both temperatures are consistent with those from neutron and synchrotron powder diffraction measurements [7, 8]. Refinements carried out in space group with harmonic and anharmonic Br ADPs at both temperatures are reported in Table 6. The transverse Br ADP value is similar to the one deduced for K2OsBr6. It is the strongest among the investigated compounds, probably due to the proximity of the structural phase transition in this temperature range for K2IrBr6. The anharmonic treatment improves the quality of the refinement, as shown by the pronounced reduction of the -factors and the GOF parameters. Together with K2OsBr6, the anharmonic treatment in the cubic phase of K2IrBr6 has the most significant impact among the investigated compounds, see Table 4. However, these parameters shrink upon cooling to 200K, when approaching the upper structural phase transition. In addition, the anharmonic treatment does not reduce the large . Therefore, the anharmonic refinements do not support an order-disorder character.
RIXS measurements on K2IrBr6 evidenced a splitting of the spin-orbit exciton peak, a signature of the split low-lying quadruplet, and interpreted it as a fingerprint of a non-cubic crystal-field splitting meV [7, 8]. More importantly, this splitting already exists at room temperature, and the strength of decreases with temperature while approaching the upper structural transition [8]. These features were also confirmed by IR spectroscopy [22]. While the orthorhombic octahedra distortion appearing in the monoclinic phase, and the tetragonal strain in the intermediate phase can explain a non-cubic crystal-field splitting, the room-temperature feature was ascribed to the pronounced transverse motion of the Br ions breaking the cubic environment locally. However, at room temperature in the cubic phase, there was no evidence for a non-cubic crystal-field in K2OsBr6 in RIXS and IR spectroscopy [17]. Our XRD analysis shows that at 250K, the transverse motion of the Br ion deduced from the anharmonic refinement is Å2 and Å2 for K2IrBr6 and for K2OsBr6, respectively. Therefore, similar to K2OsBr6, the strong Br displacement perpendicular to the Ir-Br bond in the high temperature phase must be of dynamic origin. The local environment thus remains cubic and cannot explain the origin of a non-cubic distortion. Actually, recent works have reinterpreted the RIXS spectra of K2RuCl6 [23] and K2IrCl6 [24] in terms of the dynamic effects.
-
250K 200K (Br) 0.23976(4) 0.23940(4) 0.24014(4)0.23984(5) (Ir) 0.02427(6) 0.02436(5) 0.01943(6)0.01946(6) (K) 0.0516(4)0.0513(3) 0.0418(4)0.0415(3) (Br) 0.0242(1)0.0252(3) 0.0190(1)0.0202(3) (Br) 0.0613(2)0.0621(4) 0.0544(2)0.0541(4) 2.121.85 2.482.26 2.321.84 2.832.43 2.221.94 2.482.26 2.341.86 2.832.43 GOF(obs) 1.501.20 2.301.99 GOF(all) 1.481.19 2.30 1.99
3.3 K2OsCl6
K2OsCl6 undergoes a structural phase transition at K marked by a -type anomaly in specific heat measurements [25]. Inelastic neutron scattering experiments have evidenced the softening of an optical phonon branch, identified as a rotary phonon mode, at both the Brillouin zone center and at the Brillouin zone boundary (001). The mode is claimed to drive the structural phase transition since it softens more rapidly [26]. This is in line with neutron diffraction experiments revealing the emergence of the superstructure reflections (117) and (337) at the transition temperature which do not break the centering [27]. Furthermore, no superstructure reflections breaking the centering have been found using neutron powder diffraction, and Rietveld refinements with these patterns were carried out with the tetragonal space group [20].
Single-crystal XRD measurements have been performed at both temperatures 250K and 80K in the cubic phase, see Table 1 for an overview of the data set completeness. The room-temperature lattice parameter Å agrees with powder XRD data [28]. Refinements with data sets collected at both temperatures have been carried out in space group and are summarized in Table 7. -factors and goodness-of-fit (GOF) parameters indicate the good quality of the refinements. We found that , in line with the impact of soft rotation modes. A refinement with anharmonic parameters up to rank four for the Br ions has been carried out. At 250K, the anharmonic refinement does not clearly improve the values of the harmonic refinement, and none of the refined anharmonic parameters is significant, see Table 4. However, when approaching the transition temperature at 80 K, the GOF parameters and the -values are slightly improved compared to the harmonic refinement. The amplitude of the two Br harmonic ADPs is reduced, and two anharmonic ADPs — and — exceed , see Table 4. In agreement with the softening of the phonon rotary mode at the Brillouin zone center pointing to a displacive structural phase transition, anharmonic effects remain moderate in the high-temperature phase of K2OsCl6. In view of possible local distortions as an explanation for the large transversal ADP of the Cl, one has to inspect its temperature dependence. The very large value that at 250K corresponds to a root mean-square displacement of more than 0.2 Å strongly shrinks upon cooling to 80K excluding a local disorder scenario.
-
250K 80K (Cl) 0.2385(1)0.2382(2) 0.2403(1)0.2405(2) (Os) 0.01685(9)0.01685(9) 0.0073(1)0.00721(9) (K) 0.0368(4)0.0368(4) 0.0150(3)0.0151(2) (Cl) 0.0174(4)0.0174(4) 0.0085(3)0.0053(8) (Cl) 0.0421(4)0.0416(5) 0.0191(3)0.0171(6) 2.182.15 1.961.99 2.882.84 3.062.80 2.182.15 1.961.99 2.882.84 3.062.80 GOF(obs) 2.542.52 2.802.58 GOF(all) 2.542.52 2.802.58
3.4 K2IrCl6
Synchrotron powder XRD measurements have shown that K2IrCl6 remains cubic down to 20K, and no evidence in thermodynamic measurements point to a structural phase transition down to the Néel temperature K [6]. Later on, neutron powder diffraction experiments indicated that the structure remains cubic while crossing [7]. High-field ESR measurements result in a factor consistent with a local cubic environment in the paramagnetic state [29]. Despite the absence of structural phase transitions, the splitting of the low lying quartet into at least two doublets already at room temperature as observed with RIXS spectroscopy [7], IR spectroscopy [22], and Raman spectroscopy [30], is interpreted as a deviation from the local cubic environment at the Ir site, with a non cubic crystal-field meV slightly stronger than in the bromide counterpart [7].
In order to investigate the local symmetry breaking, single-crystal XRD measurements have been performed at 200K and 80K, see Table 1 for an overview of the data set completeness. The lattice parameters at both temperatures are consistent with those reported from high-resolution synchrotron XRD [6]. Refinements carried out in space group with harmonic and anharmonic ADPs at both temperatures are reported in Table 8. First, if (Cl) is consistent with the value reported in literature [6], (Cl) is larger at 200K and shrinks upon cooling compared to the temperature independent behavior reported in [6]. Also, the Cl ADPs are slightly smaller than the Br ones in K2OsBr6 at 80K. Even though Cl atoms are lighter elements, a displacive structural transition is absent in the Ir case. The anharmonic treatment does not improve the quality of the refinement at 200K, and very little at 80K. Note however that at 80K, the anharmonic treatment induces a reduction of the harmonic Cl ADPs, as it is also seen in K2OsCl6. This observation was not found in any other of the investigated compounds. The anharmonic parameters listed in Table 4 are much weaker compared to the Br counterpart. Therefore, the relevance or not of anharmonic effects in the atomic displacements is a reliable indicator of a subsequent/absent structural phase transition at lower temperature.
Following the conclusions of Sec. 3.2, there is no indication of local disorder in K2IrCl6, and the splitting observed in the RIXS spectra cannot be accounted for by the static structure. Instead dynamic processes should be taken into consideration.
-
200K 80K (Cl) 0.23867(7)0.23833(9) 0.23992(7)0.23992(7) (Ir) 0.01140(4)0.01140(4) 0.00431(4)0.00427(4) (K) 0.0273(2)0.0273(2) 0.0118(1)0.0118(1) (Cl) 0.0125(2)0.0125(2) 0.0057(2)0.0042(5) (Cl) 0.0308(2)0.0308(2) 0.0144(1)0.0130(3) 1.171.12 1.711.69 1.781.72 2.131.99 1.171.12 1.711.69 1.781.72 2.131.99 GOF(obs) 1.401.35 1.851.74 GOF(all) 1.401.35 1.851.74
3.5 Rb2OsBr6
Single-crystal XRD measurements have been performed at both temperatures 250K and 80K, see Table 1 for an overview of the data set completeness. At room temperature, Rb2OsBr6 crystallizes in the cubic structure . The room-temperature lattice parameter Å agrees with powder XRD data [28]. A structural sequence of phase transitions is not documented for Rb2OsBr6, and temperature dependent powder diffraction data are lacking. However, no hints for structural phase transitions are visible in our experiments since no superstructure reflections could be resolved in the computed precession maps upon cooling down to 80K. Thus, refinements at both temperatures have been carried out with space group and are summarized in Table 9. -factors and GOF parameters indicate the good quality of the refinements, and confirmed the cubic structure down to at least 80K. Again, we found that . As in the two other cases, the relative large amplitude of the Br ADP perpendicular to the bond stems from the softness of the rotation modes. Therefore, a refinement with anharmonic ADPs up to rank four for the Br ions has been carried out. Already at 250K, and without the proximity of a structural phase transition, -values of the anharmonic refinement are slightly improved compared to the refinement with only harmonic ADPs, see Table 9. The refined anharmonic parameters are tabulated in Table 4. Only , probing the anharmonicity perpendicular to the Os-Br bond, attains a significant value compared to its standard deviation. However, decreases with lower temperatures and therefore does not agree with the premises of an order-disorder structural phase transition at low temperature. Also in this material the anomalous transversal ADP of the halide strongly shrinks upon cooling indicating its fully dynamic origin.
-
250K 80K (Br) 0.23882(4)0.23862(5) 0.24032(4)0.24017(5) (Os) 0.0213(1)0.02142(9) 0.01003(8)0.01014(8) (Rb) 0.0372(2)0.0374(2) 0.0156(1)0.0158(1) (Br) 0.0216(2)0.0219(2) 0.0104(1)0.0109(4) (Br) 0.0373(2)0.0400(4) 0.0159(1)0.0174(3) 1.761.60 1.941.82 1.781.50 2.562.40 1.791.63 2.091.98 1.791.51 2.592.43 GOF(obs) 1.491.27 2.081.97 GOF(all) 1.461.25 2.061.95
3.6 Cs2OsBr6
Except for IR spectroscopy measurements at 2K [31] stressing the resemblance of absorption spectra with those reported for Os4+ doped in Cs2ZrBr6 which preserve the octahedral environment at the Os site [32], the crystal structure of Cs2OsBr6 is not documented. Single-crystal XRD measurements have been performed at both temperatures 250K and 80K, see Table 1 for an overview of the data set completeness. At 250K, the crystal structure is cubic, and no superstructure reflections are visible down to 80K. Therefore refinements at both temperatures are performed with space group . Structural parameters are summarized in Table 10, together with -factors and GOF parameters indicative of the good refinement quality and confirming the correct space group assignment. The dynamical behavior of the bromide ion is very similar to Rb2OsBr6, see Section 3.5. Analogous refinements with anharmonic ADPS up to rank four for the Br ion are carried out, but none of them attains a significant values, see Table 4. Although at 250K, considerably shrinks upon cooling and the Br thermal ellipsoid becomes almost isotropic. Therefore, there are no hints for a low temperature structural distortion of neither long-range nor local character.
-
250K 80K (Br) 0.23464(6)0.2350(1) 0.23618(7)0.2364(1) (Os) 0.0195(2)0.0196(2) 0.0092(2)0.0094(2) (Cs) 0.0303(2)0.0303(2) 0.0140(2)0.0141(2) (Br) 0.0212(3)0.0225(7) 0.0110(3)0.0126(9) (Br) 0.0310(2)0.0306(3) 0.0141(2)0.0149(6) 1.321.23 1.341.26 1.701.55 1.621.55 1.411.32 1.591.50 1.751.61 1.681.61 GOF(obs) 1.321.23 1.141.11 GOF(all) 1.331.25 1.111.09
3.7 (NH4)2OsBr6
The replacement of the cation by an ammonium group NH4 introduces additional degrees of freedom. The rotational orientation of the NH4 group can give rise to structural transitions with order-disorder character. The tendency towards an ordered state is enhanced in deuterated samples simply due to the larger mass. For instance, in (NH4)2TeCl6, the deuterated sample exhibits two additional structural transitions interpreted as localization of the deuterium in a triangular potential well, while in the protonated counterpart the tetrahedra remain fluctuating [33, 34, 35]. An other striking example is the order-disorder transition in (ND4)2PdCl6, which is absent in (NH4)2PdCl6 [36].
(NH4)2OsBr6 crystallizes at room temperature in the common antifluorite-type structure [28, 37]. No hint for a structural transition is visible in differential scanning calorimetry and thermogravimetry from 113K up to the decomposition temperature at 673K, and powder XRD data confirm the cubic structure with from room temperature up to 673K [37].
Single-crystal XRD measurements have been performed at 200K and 80K, see Table 1 for an overview of the data set completeness. No superstructure reflections were visible at both temperatures and refinements were performed with the cubic space group . Because of the very weak X-ray form factor of the H atom, the isotropic Debye-Waller factor used in our refinements was linearly scaled from the value Å2 deduced from powder XRD at room temperature [37], i.e. Å2 and Å2 at 200K and 80K, respectively. Prior to focusing on the dynamics of the OsBr6 octahedra, the static ordering of the NH4 tetrahedra will be discussed. In the ammonium antifluorites, the tetrahedra are oriented in such a way that the N-H bonds are aligned along the 3-fold axis [111]. Following the methodology of [38], two ordered models are considered:
-
.
In the normal tetrahedron orientation (model M1) the H atoms point towards the nearest neighboring Os ions
-
.
In the inverted tetrahedron orientation (model M2), H atoms are closer to the empty sites of the double perovskite structure, as it is illustrated in Fig 1(b)
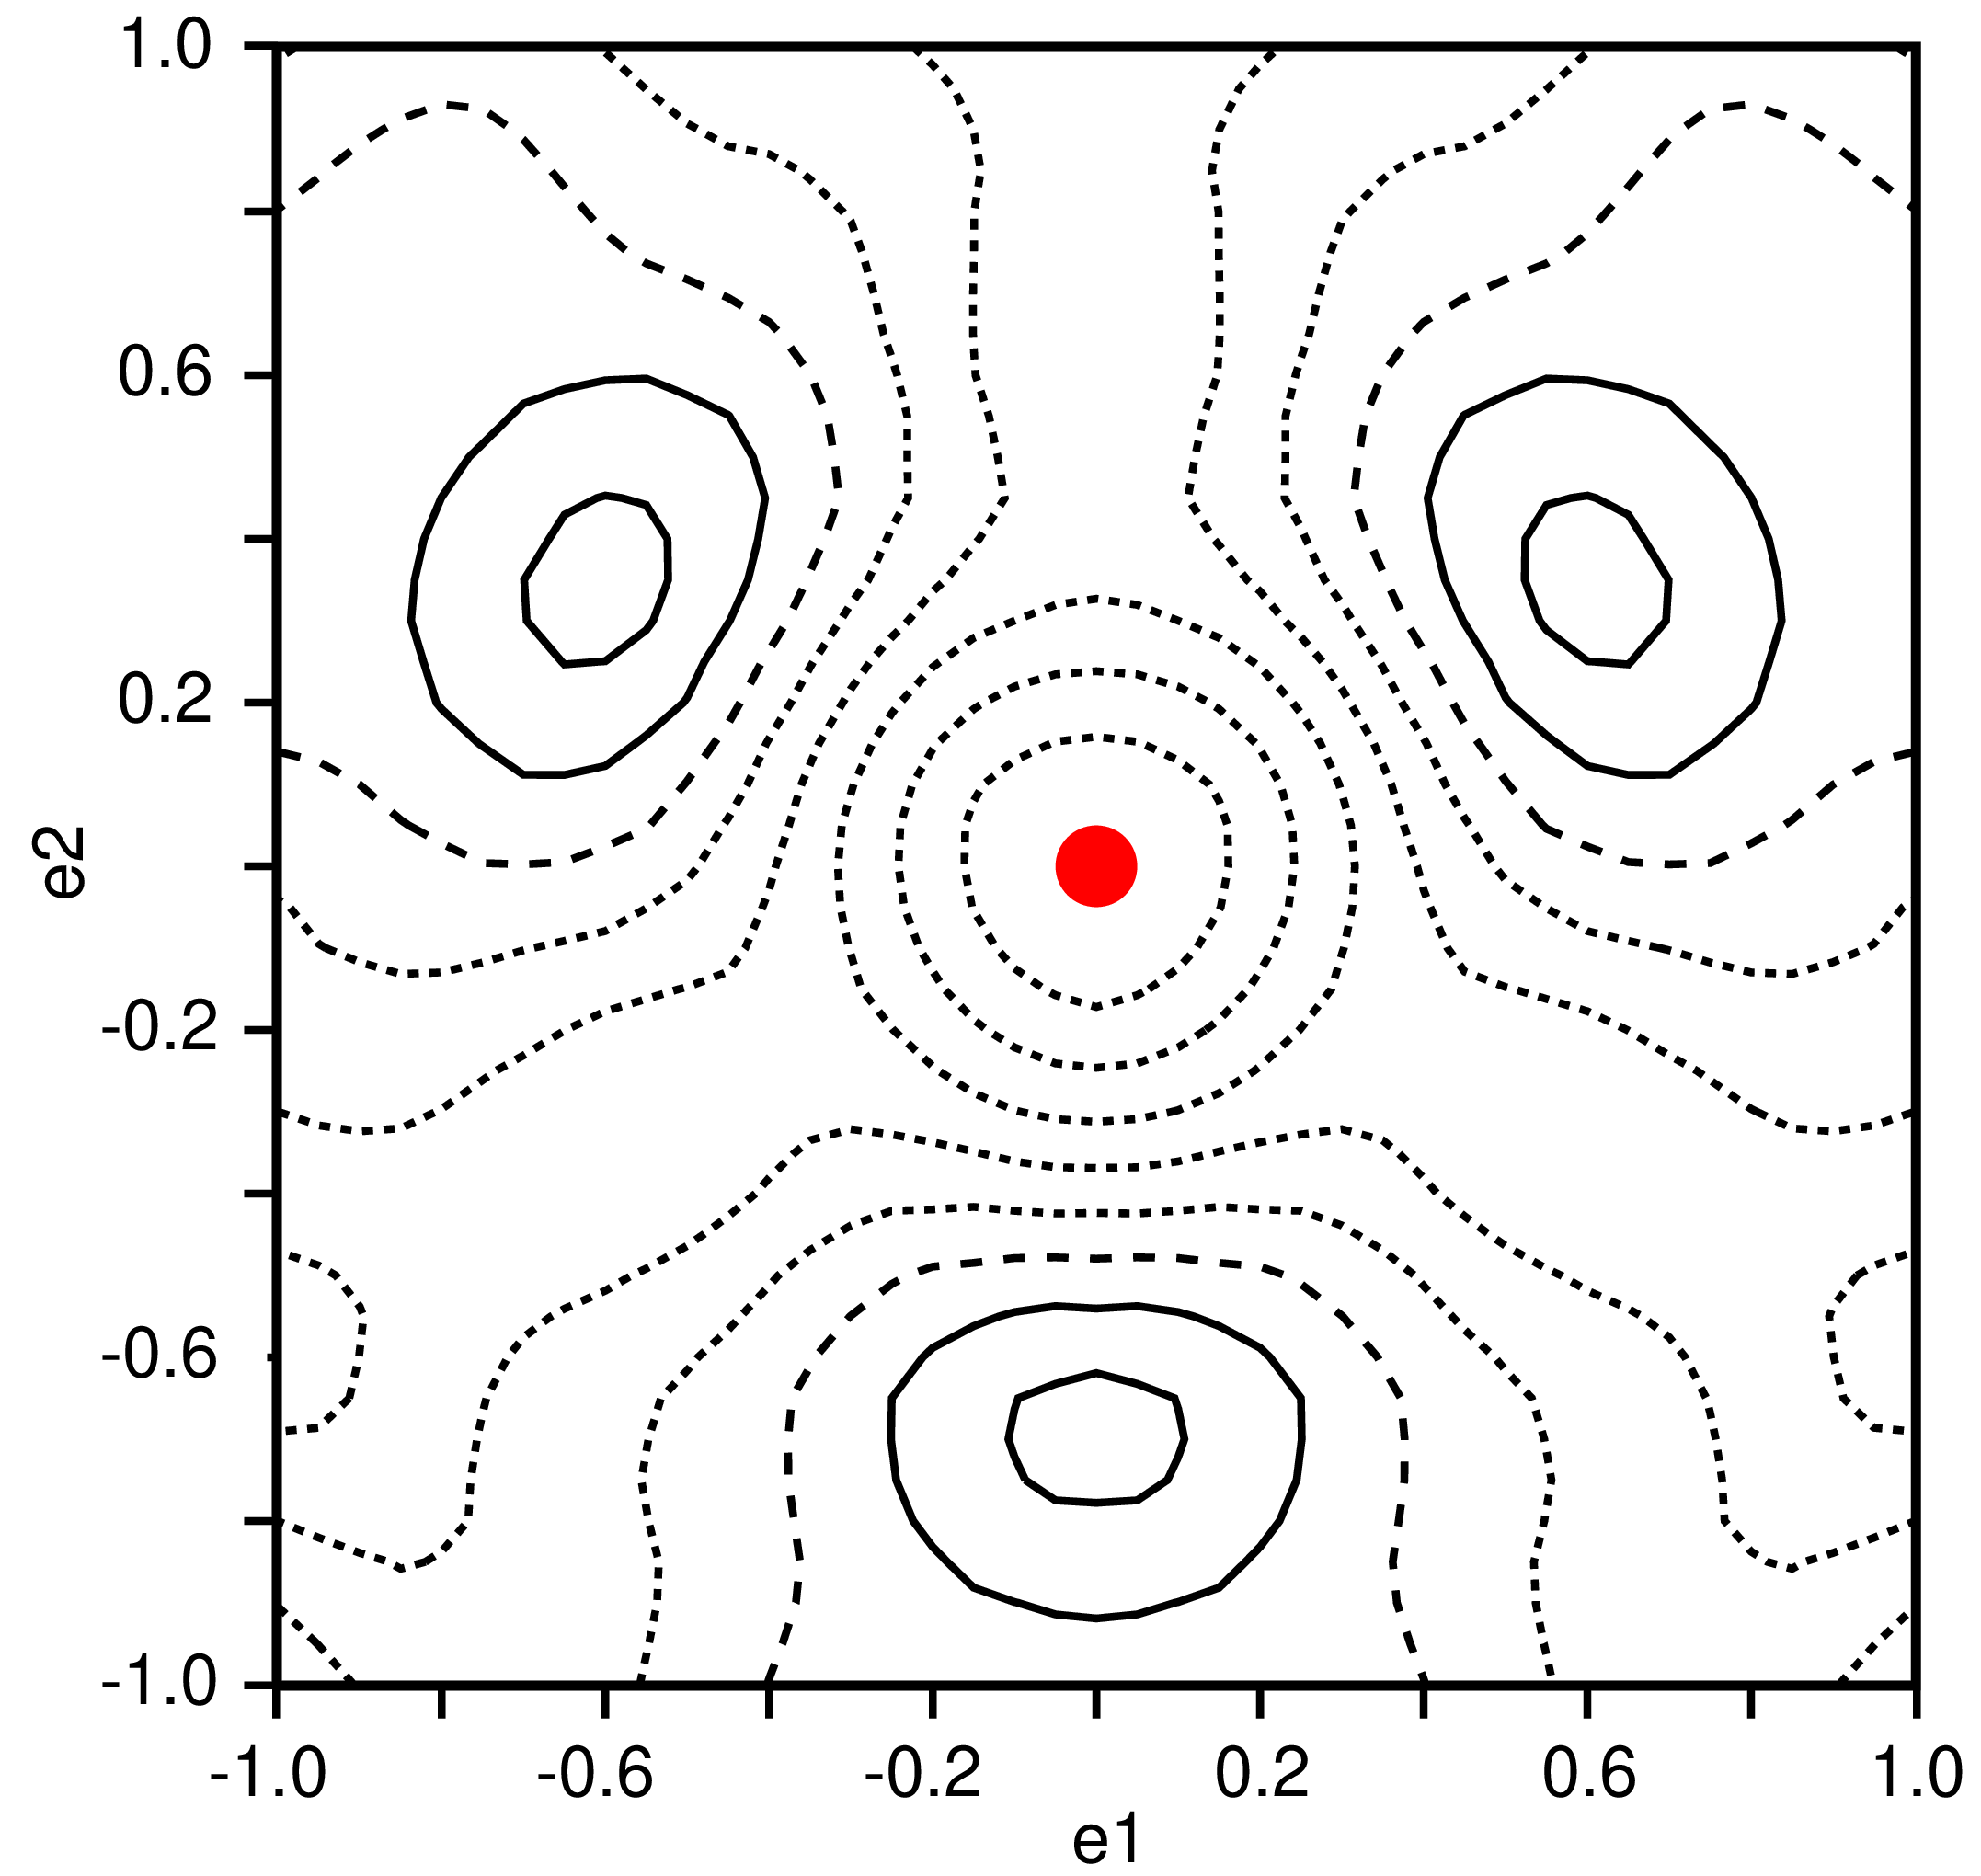
Note that model M2 results from model M1 by applying a space inversion with respect to the central N position. Refinement results in with these two models at both temperatures are summarized in Table 11. The main difference between these models is the position of the H atom occupying the Wyckoff site: and 0.292(1) at 200K for model M1 and model M2, respectively. Regarding the -factors and the GOF parameters, it is clear that model M2 best describes the data set. For completeness, the residual scattering density at 200K, calculated as (obs)-(calc), is computed in the (111) plane with the center being the Wyckoff position () for model M1 (left panel) and model M2 (right panel) in Figure 4. For model M1, there is a maximum of negative RSD at the center, where the H atom shown in red is located, surrounded by three maxima of positive RSD. When applying model M2 the map does not show any residual scattering density anymore 111At 200K, a superposition of the two static models give an H occupation of 34(11)% and 66(11)% for model M1 and M2, respectively. Model M2 is still favored but the H occupation for model M1 does not fully vanish.. This inverted ordering of the tetrahedra was found for instance in (NH4)2TeCl6 [39]. Powder XRD measurements concluded that (NH4)2OsBr6 adopts the fully ordered ammonium molecule corresponding to model M1 in our discussion [37]. However, the two different tetrahedra orientations have not been investigated. The refinements presented in Section 3 checking the stoichiometry of our sample, but also forthcoming refinements with anharmonic ADPs for Br ions, are performed starting with H positional parameters of model M2.
-
200K 80K M1 0.208(1) 0.24005(2) 0.0273(6) 0.208(1) 0.24112(2) 0.0127(3) 0.01289(6) 0.02795(6) 0.01299(4) 0.00619(5) 0.01406(5) 0.00603(3) GOF(obs/all) 1.21/1.33 1.55/1.58 1.15/1.14 0.99/1.08 1.53/1.56 1.27/1.26 M2 0.292(1) 0.24000(2) 0.0274(5) 0.292(1) 0.24108(1) 0.0127(3) 0.01286(6) 0.02793(6) 0.01298(3) 0.00617(4) 0.01405(4) 0.00603(3) GOF(obs/all) 1.16/1.28 1.42/1.45 1.05/1.05 0.92/1.01 1.35/1.37 1.11/1.12
In a last step, we investigate the dynamics of the OsBr6 octahedra. Starting from model M2, refinements with harmonic and anharmonic Br ADPs at both temperatures are compared in Table 12. Contrary to the two other discussed Os compounds showing no indication of structural transitions — Cs2OsBr6 and Rb2OsBr6 — where the Br ADPs become almost isotropic upon cooling, in (NH4)2OsBr6 at 80K, a situation reminiscent of K2OsCl6, which shows a structural transition at lower temperature. Anharmonic treatment of Br ADPs at 200K slightly improve the refinement quality, and the relevant anharmonic parameters are gathered in Table 4. However, contrary to K2OsCl6, there is no improvement of the harmonic refinement with anharmonic parameters upon cooling and the anharmonic parameters vanish at 80K. Similar to the discussion above, this excludes local distortions playing a significant role.
-
200K 80K (Br) 0.23400(2)0.23987(2) 0.24108(1)0.24108(1) (H) 0.292(1)0.294(1) 0.292(1)0.293(1) (Os) 0.01298(3)0.01303(3) 0.00603(3)0.00604(3) (N) 0.0274(5)0.0271(5) 0.0127(3)0.0127(3) (Br) 0.01286(6)0.01280(5) 0.00617(4)0.00614(5) (Br) 0.02793(6)0.0284(1) 0.01405(4)0.01423(8) 1.161.08 0.920.91 1.421.28 1.351.33 1.281.19 1.011.01 1.451.31 1.371.36 GOF(obs) 1.050.95 1.111.10 GOF(all) 1.050.95 1.121.11
4 Discussion
The tendency of antifluorite-type compounds to distort has been initially discussed in accordance with the radius ratio, defined as the ionic radii of the cation divided by the cavity space available for [40]. The smaller the radius ratio is, the more distorted are the antifluorite-type compounds at room temperature. Authors of [9] pointed out that the structural transition temperature decreases with decreasing the anion size, varying the metal ion across the / shells, and increasing the cation size. A more quantitative analysis is obtained in terms of the ionic radii of the different ions and the perovskite Goldschmidt’s tolerance factor () that describes a well-known criterion for the occurrence of rotational phase transitions in perovskites [41, 42, 43].
Motivated by these previous studies, we discuss the structural instability in the antifluorite-type compounds in terms of the tolerance factor by analyzing the octahedra rotation and tilting angles and the large ADP () perpendicular to the bond. Additionally to the data obtained in this work, we include our single-crystal XRD data for K2ReCl6 and K2SnCl6 [15]. We, furthermore, include data from the literature as it is specified in the note 222Structural information reported in the main text: K2WCl6 [44]; K2SeBr6 [45, 46]; K2PtI6 [47]; K2PtBr6 [48, 49]; K2PtCl6 [50]; K2ReBr6 [48]; K2SnBr6 [51]; K2TeBr6 [40]; K2TeI6 [52, 53]; K2TcCl6 [54]; K2TaCl6 [55]; K2ReI6 [56]; K2NbCl6 [57]; (NH4)2PtI6 [58, 59]; (NH4)2PtBr6[58, 60, 61]; (NH4)2RuCl6 [60];(NH4)2TeCl6 [62, 63, 64] (transition to a trigonal space group, octahedra rotation angle around (111)c); (NH4)2TeBr6 [65, 66]; (NH4)2TeI6 [67, 68]; (NH4)2ReI6 [69, 70]; (NH4)2SnBr6[71, 72, 73]; (NH4)2SnBr6 [74, 75]; (NH4)2PbCl6 [76] (transition to a trigonal space group, octahedra rotation angle around (111)c); Rb2PtI6 [58, 61]; Rb2TeBr6 [77]; Rb2TeI6 [78]; Rb2TaCl6 [55]; Rb2NbCl6 [57] ( at 120K, scaled at 250K); Cs2PtI6 [47]; Cs2TaCl6 [55, 79] ( at 200K, scaled at 250K); Cs2NbCl6 [57]. If not documented elsewhere, transition temperature are taken from [9].. We analyze three entities: the structural transition temperature from the high temperature cubic phase to a lower symmetry phase, the anisotropic ADP taken from available room-temperature XRD or from neutron diffraction measurements and linearly scaled to K, and the octahedra rotation angle around the axis and the tilt angle around the monoclinic unique axis taken at the lowest available temperature. In the case of a symmetry lower than tetragonal, is the average rotation angle calculated from the octahedra basal plane ions and , and is calculated with the apical ion.
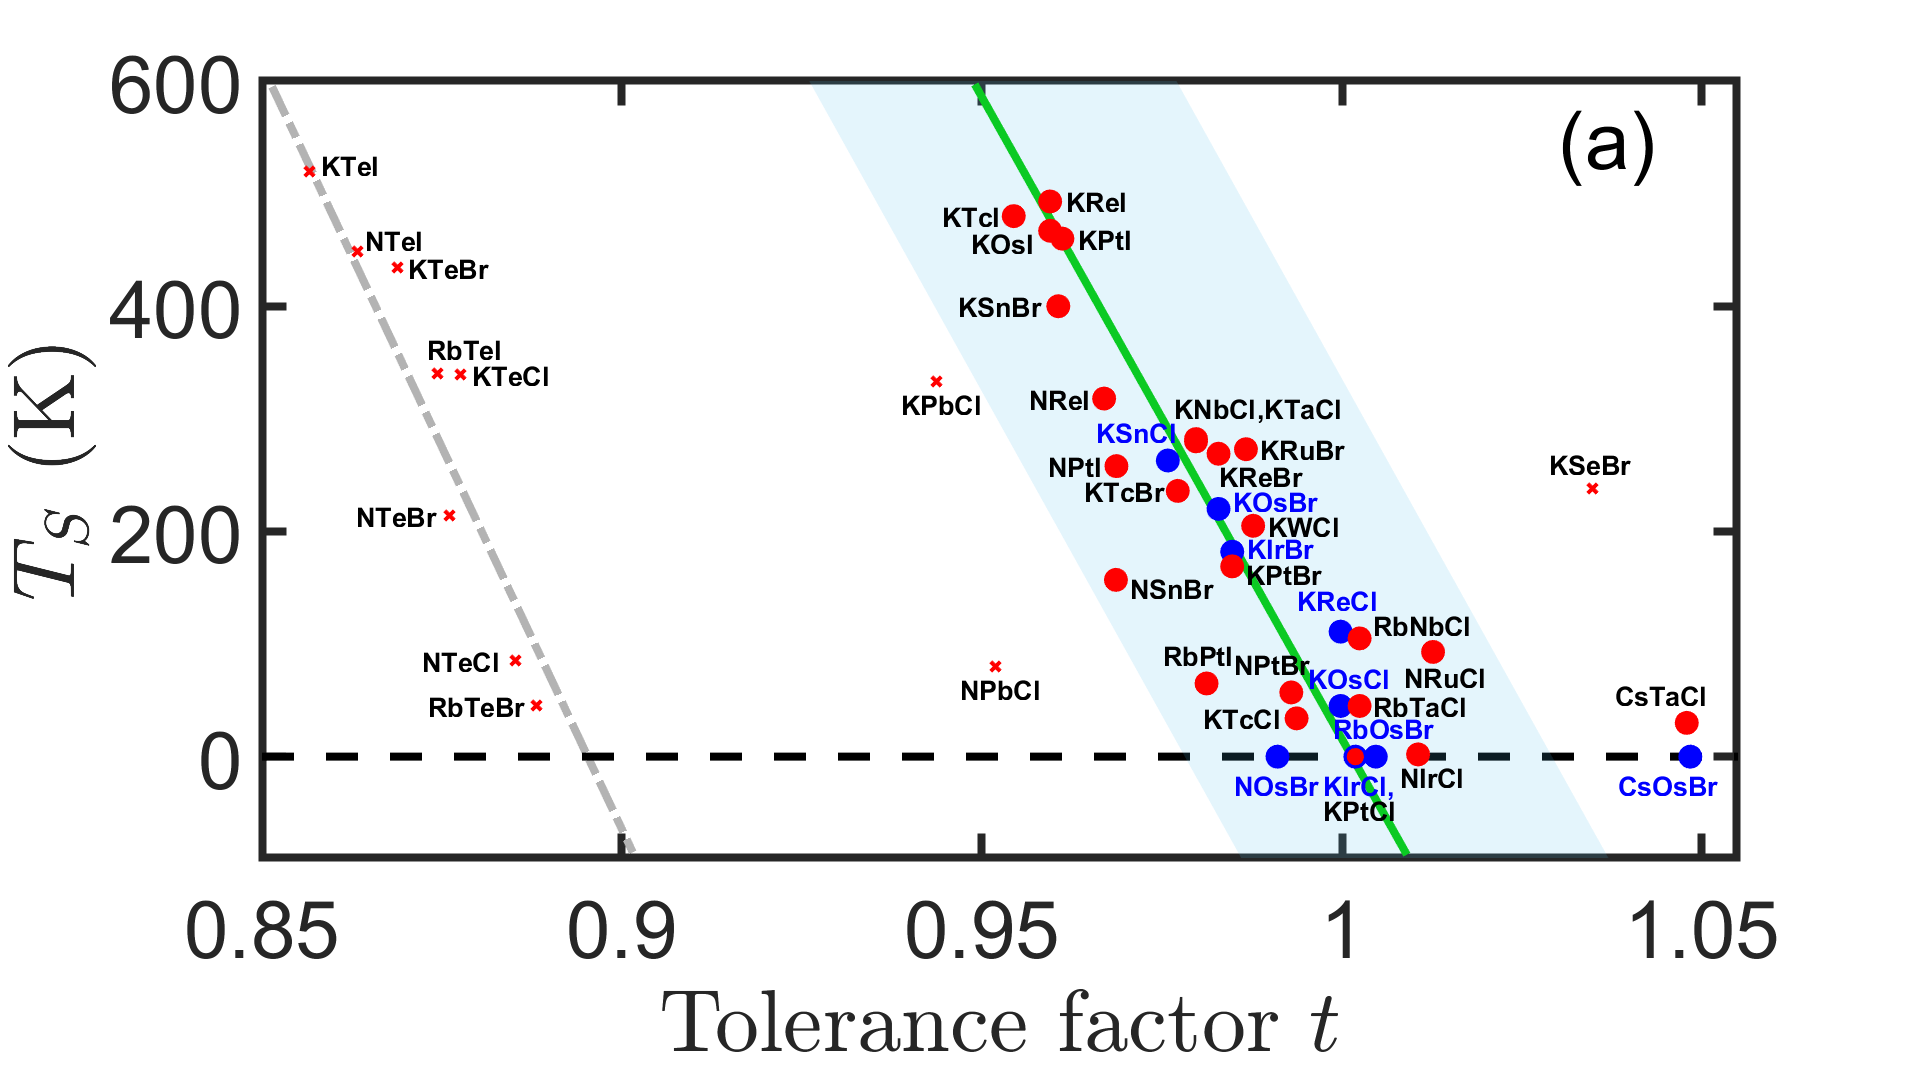
The highest transition temperature is plotted in Figure 5(a) against the tolerance factor . Effective radii are taken from [80], and for the ammonium group NH4 from [81]. The blue-shaded area indicates antifluorite-type samples with a / transition metal (Nb, Tc, Ru, Ta, W, Re, Os, Ir, Pt) or Sn. When the tolerance factor is lower than one, the transition temperature increases linearly, as emphasized by the green line. It may appear surprising that the simple perovskite tolerance factor describes the occurrence of the rotational transitions so well. The empty position in antifluorites compared to a perovskite does not invalidate such analysis; however, it causes an enhancement of the critical tolerance factor to while perovskites can tolerate a larger mismatch up to . The empty site thus enhances the instability, as the negative charge of the halide it not shared by two neighboring cations. Following this analysis, it is obvious that Cs compounds of antifluorite-type do not exhibit the rotational transition. Note that the structural distortion in Cs2TaCl6 is of a different character [55].
Antifluorite-type compounds with Te, Pb, and Se do not follow the seemingly linear behavior of against for a transition metal. These clear deviations illustrate that the tabulated ionic radii for Te, Pb, and Se in a four-valent configuration are not applicable and cannot be used in the tolerance factor calculation, partially due to the character of the bond being not essentially ionic. Furthermore, Sb single crystals are reported to have a mixture of Sb3+ and Sb5+ rather than Sb4+ [82]. Note however that for compounds with Te, follows also a linear tendency against suggesting an effective ionic radius of 0.67Å (instead of 0.97Å) for Te4+ in this material class. The Te- bond distances for several antifluorite compounds calculated with this corrected Te ionic radius agree better with the experimental values , than those calculated with the literature value, see Tab.13.
-
a Average bond distance for lower symmetry phase.
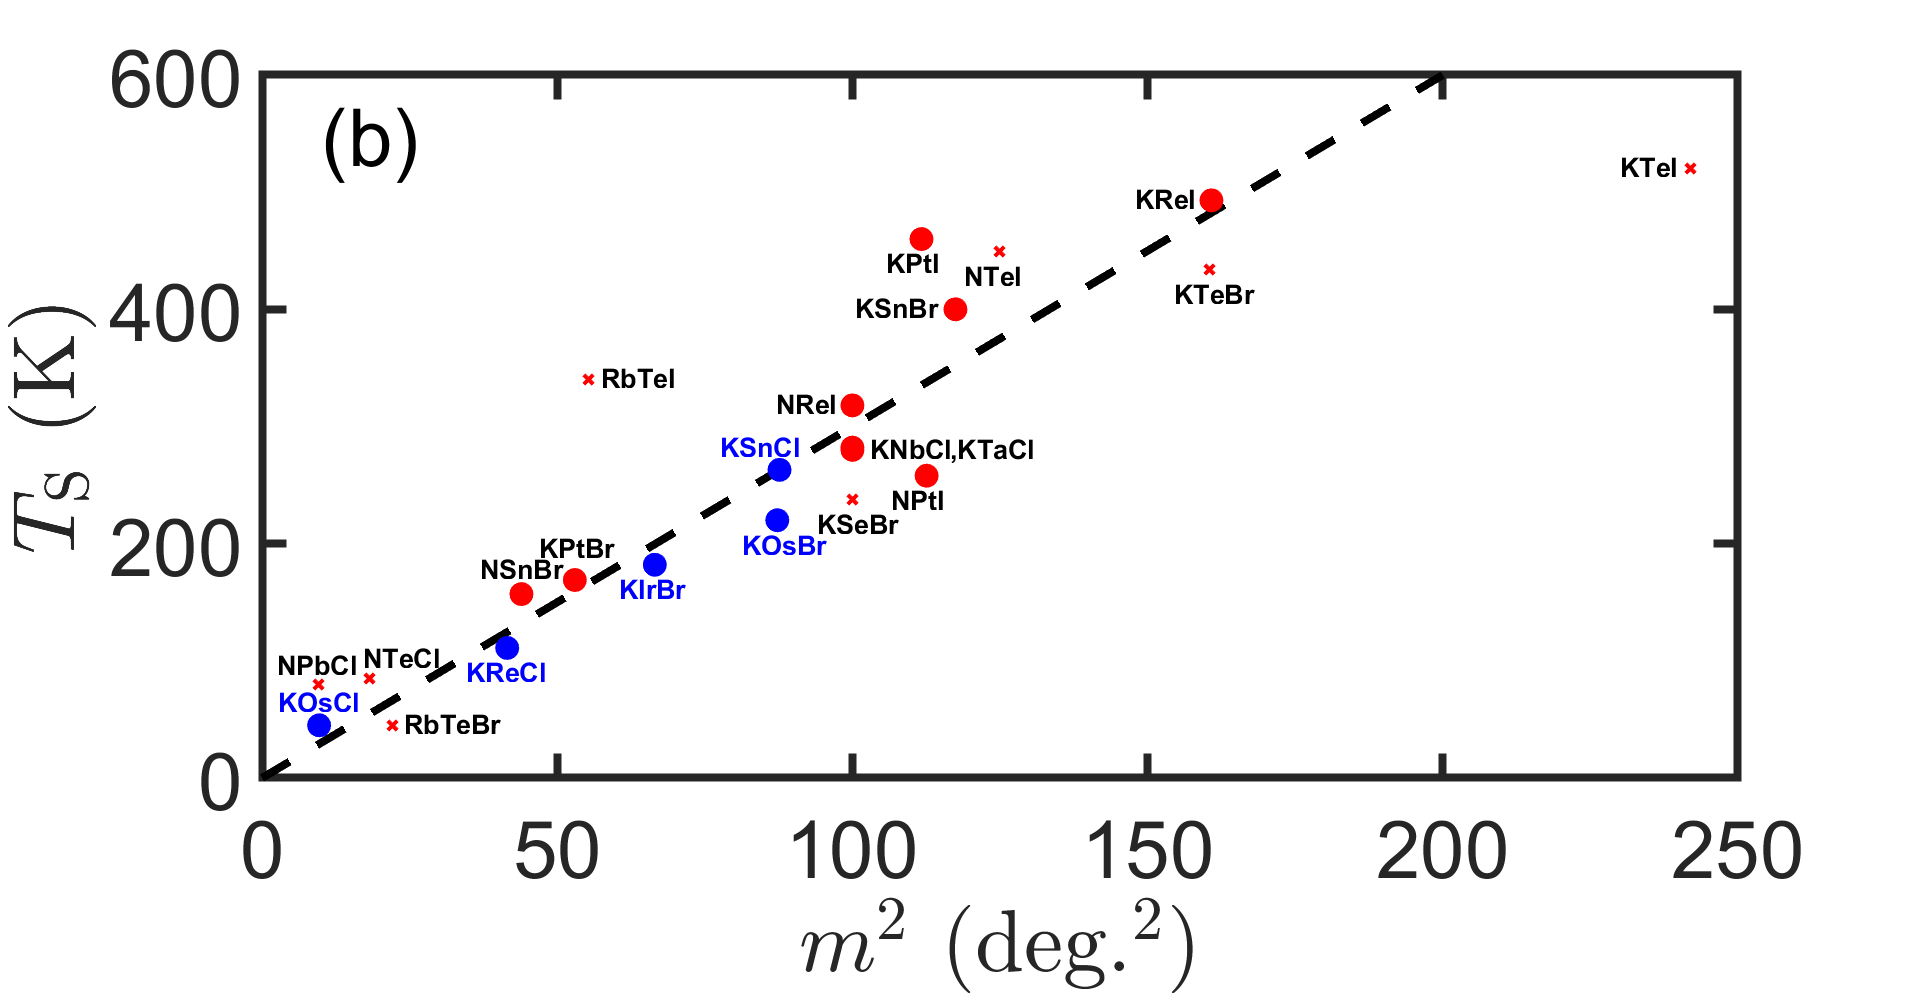
Because the structural distortions in the antifluorite-type compounds correspond to octahedra rotation and tilting, the absolute size of the order parameter can be defined as , where and are the tilt angle around the axis and the rotation angle around the monoclinic axis, respectively. The transition temperature , gauging the energy scale that triggers the structural transition, is plotted against the square of this order parameter in Figure 5(b). Note that in a simple elastic model the square of the structural order parameter represents the elastic lattice energy (Hook law). The proportionality between this order parameter square and the transitions temperature underlines the ubiquitous character of the rotation instability in this family of compounds. There are only two exceptions. According to the authors of [52], intensities of single-crystal XRD data of K2TeI6 could not be collected precisely. Therefore, the octahedra rotation angles calculated from the atomic positions may not be reliably determined, and the order parameter may be overestimated. With regards to Rb2TeI6 [78], the XRD data have been collected at room temperature, close to the cubic to tetragonal transition K. But additional structural transitions are expected at lower temperatures [85] suggesting that the order parameter is strongly underestimated. The convincing scaling of with the tolerance factor and with illustrate the general character of the rotational instability in this broad class of materials.
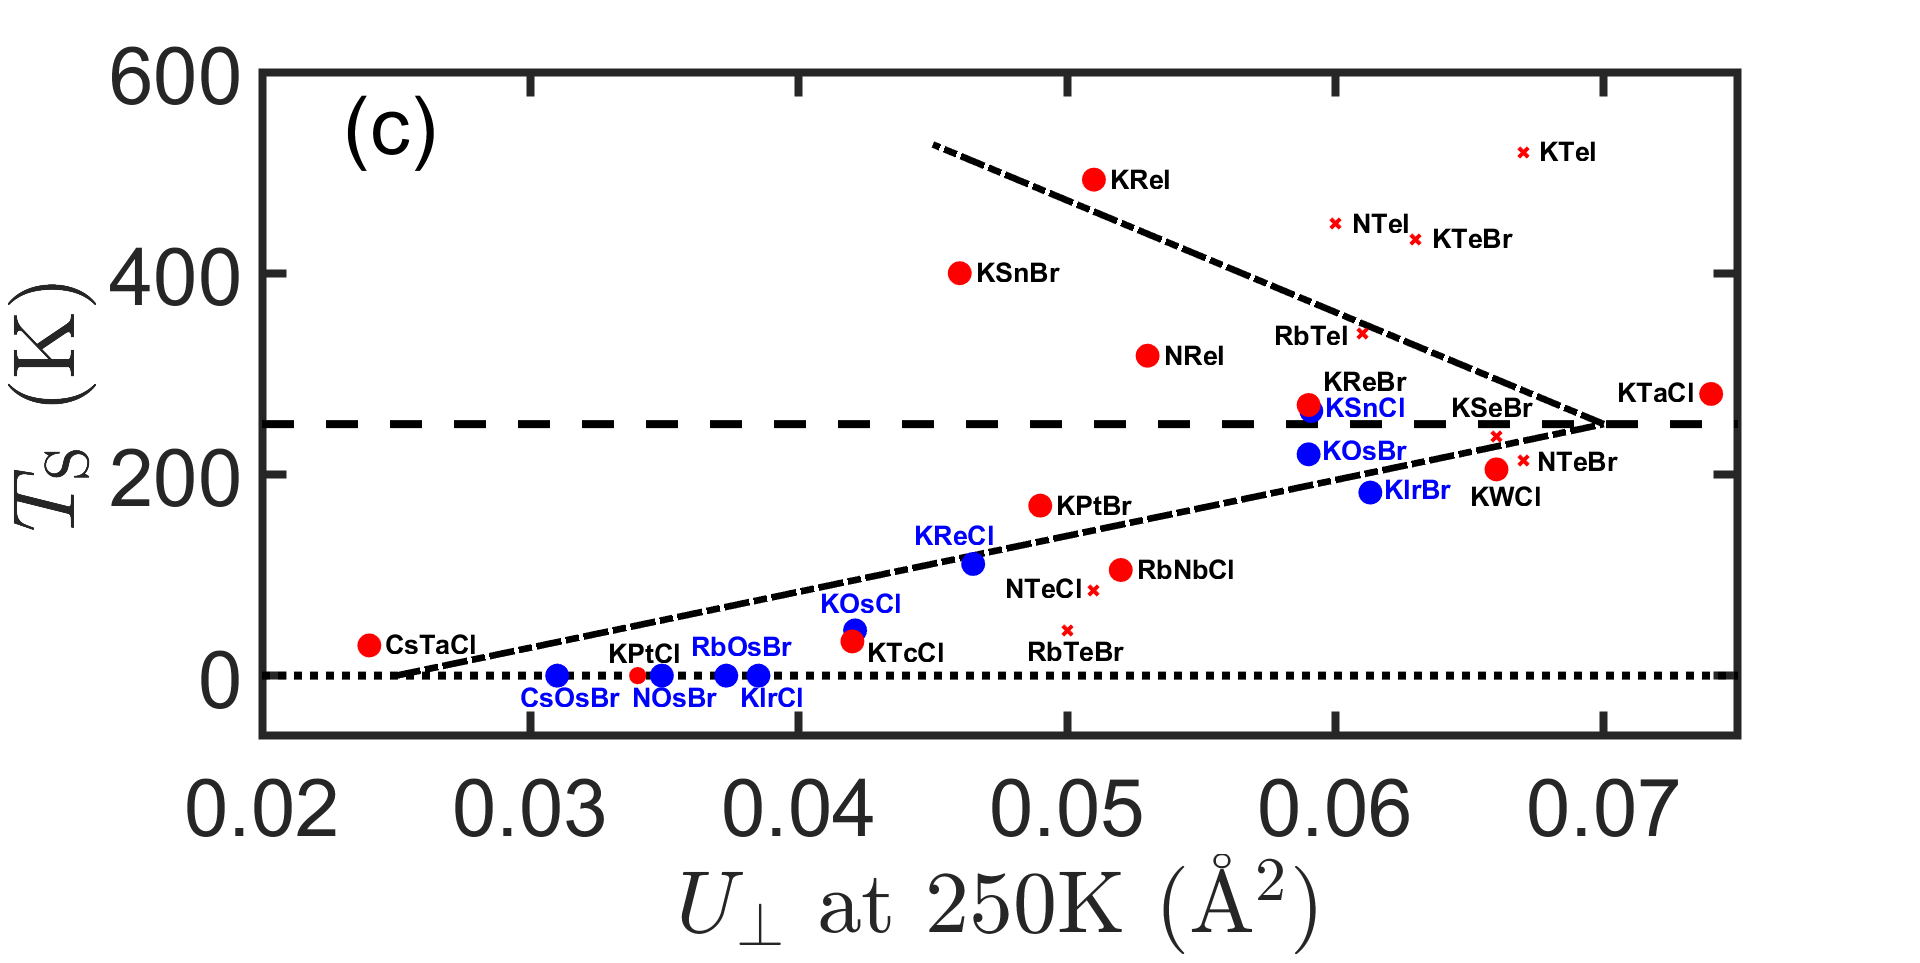
As discussed previously, in the entire antifluorite-type family, () is much larger than (). The determined in the literature by means of X-ray or neutron diffraction at room temperature (unless stated otherwise), are plotted against the transition temperature in Figure 5(c). All data are linearly scaled to T=250 K. In the case of a monoclinic structure realized already at room temperature, corresponds to the largest eigenvalue of the ADP matrices. The closer is to 250 K, indicated by the horizontal dotted line, the larger the transverse motion of the ADP is, which points to the role of phonon softening close to . As expected, when the structural transition is shifted far above or below room temperature, , probing the structural instability at 250 K, decreases. The dashed-dotted lines in Figure 5(c) emphasize this behavior. This confirms our general conclusion that the large ADPs arise from the dynamics and not from local disorder.
5 Conclusions
Comprehensive single-crystal diffraction studies on K2OsBr6, K2IrBr6, K2OsCl6, K2IrCl6, Rb2OsBr6, and (NH4)2OsBr6 reveal that none of these materials is suffering from significant chemical disorder or vacancies, except Cs2OsBr6, which was found to exhibit a small amount of vacancies. The most remarkable structural feature visible in all the compounds concerns the general structural instability of the antifluorite-type family against rotation or tilting of the -halide octahedra, which causes two structural phase transitions in K2OsBr6 and K2IrBr6, and a single one in K2OsCl6. This instability is associated with soft phonon modes that cover a large part of the Brillouin zone due to a reduced dispersion. In consequence the impact of these soft phonons is remarkably high resulting in strongly anisotropic ADPs at the halide site. However the large transversal ADP of the halide that senses octahedron rotations strongly shrinks upon cooling underlining its dynamic character. Refinements of anharmonic ADPs yield some improvement in the description of the Bragg intensities, but these improvements are small. The anharmonic treatment of the four compounds K2OsBr6, K2IrBr6, K2OsCl6, and K2IrCl6 precludes local disorder in the cubic phase as origin of the non cubic crystal-field seen in the iridates, but absent in the osmate materials. In these antifluorite-type materials, the characters of the instability and of the structural phase transitions remain essentially displacive and the large values of the ADPs arise from the dynamics.
Comparing our structural data with studies on numerous other compounds, we find a convincing scaling of the upper transition temperature with the simple tolerance factor known for perovskites. The empty sites just imply a shift of the critical tolerance factor to . Also the scaling between the transition temperature and the square sum of the low-temperature octahedron rotation angles underlines the general character of the rotational instability in this broad class of materials.
Appendix A Correlation plots
In order to further asses the quality of all the refinements discussed in the main text, we report in Figure 6, Figure 7 and Figure 8 the calculated I(calc) versus measured I(obs) integrated intensities plots of all unique reflections listed in Table 1. All plots correspond to refinements performed with space group and anharmonic ADPs, with the exception of K2OsBr6 at 210K and 80K, where refinements have been carried out with space groups and , respectively, and with harmonic ADPs.


References
References
- [1] Kitaev A 2006 Annals of Physics 321 2–111 ISSN 0003-4916 January Special Issue
- [2] Chaloupka J, Jackeli G and Khaliullin G 2010 Phys. Rev. Lett. 105(2) 027204
- [3] Banerjee A, Bridges C A, Yan J Q, Aczel A A, Li L, Stone M B, Granroth G E, Lumsden M D, Yiu Y, Knolle J, Bhattacharjee S, Kovrizhin D L, Moessner R, Tennant D A, Mandrus D G and Nagler S E 2016 Nature Materials 15 733–740
- [4] Takayama T, Kato A, Dinnebier R, Nuss J, Kono H, Veiga L S I, Fabbris G, Haskel D and Takagi H 2015 Phys. Rev. Lett. 114(7) 077202
- [5] Aczel A A, Clancy J P, Chen Q, Zhou H D, Reig-i Plessis D, MacDougall G J, Ruff J P C, Upton M H, Islam Z, Williams T J, Calder S and Yan J Q 2019 Phys. Rev. B 99(13) 134417
- [6] Khan N, Prishchenko D, Skourski Y, Mazurenko V G and Tsirlin A A 2019 Phys. Rev. B 99(14) 144425
- [7] Reig-i Plessis D, Johnson T A, Lu K, Chen Q, Ruff J P C, Upton M H, Williams T J, Calder S, Zhou H D, Clancy J P, Aczel A A and MacDougall G J 2020 Phys. Rev. Mater. 4(12) 124407
- [8] Khan N, Prishchenko D, Upton M H, Mazurenko V G and Tsirlin A A 2021 Phys. Rev. B 103(12) 125158
- [9] Rössler K and Winter J 1977 Chemical Physics Letters 46 566–570 ISSN 0009-2614
- [10] Cowley R 1980 Advances in Physics 29 1–110
- [11] Brüning D, Fröhlich T, Langenbach M, Leich T, Meven M, Becker P, Bohatý L, Grüninger M, Braden M and Lorenz T 2020 Phys. Rev. B 102(5) 054413
- [12] Armstrong R L 1989 Progress in Nuclear Magnetic Resonance Spectroscopy 21 151–173 ISSN 0079-6565
- [13] Bussmann-Holder A and Dalal N 2007 Order/Disorder Versus or with Displacive Dynamics in Ferroelectric Systems (Berlin, Heidelberg: Springer Berlin Heidelberg) pp 1–21 ISBN 978-3-540-49604-5
- [14] Stein P, Koethe T C, Bohatý L, Becker P, Grüninger M and van Loosdrecht P H M 2023 Phys. Rev. B 107(21) 214301
- [15] Bertin A, Dey T, Brüning D, Gorkov D, Jenni K, Krause A, Becker P, Bohatý L, Khomskii D, Braden M and Lorenz T 2022 Interplay of magnetic order and ferroelasticticity in the spin-orbit coupled antiferromagnet K2ReCl6
- [16] Streltsov S V and Khomskii D I 2020 Phys. Rev. X 10(3) 031043
- [17] Warzanowski P, Magnaterra M, Stein P, Schlicht G, Faure Q, Sahle C J, Lorenz T, Becker P, Bohatý L, Moretti Sala M, Monaco G, van Loosdrecht P H M and Grüninger M 2023 Phys. Rev. B 108(12) 125120
- [18] Petříček V, Dušek M and Palatinus L 2014 Zeitschrift für Kristallographie - Crystalline Materials 229 345–352
- [19] Becker P J and Coppens P 1974 Acta Crystallographica Section A 30 148–153
- [20] Saura-Múzquiz M, Avdeev M, Brand H E A and Kennedy B J 2022 Inorganic Chemistry 61 15961–15972 pMID: 36153995
- [21] Braden M, Meven M, Reichardt W, Pintschovius L, Fernandez-Diaz M T, Heger G, Nakamura F and Fujita T 2001 Phys. Rev. B 63(14) 140510
- [22] Meggle F, Mikuta M, Saule M, Hermann V, Khan N, Tsirlin A A and Kuntscher C A 2023 Phys. Rev. B 107(23) 235142
- [23] Iwahara N and Shikano S 2023 Phys. Rev. Res. 5(2) 023051
- [24] Iwahara N and Furukawa W 2023 Phys. Rev. B 108(7) 075136
- [25] Novotny V, Martin C A, Armstrong R L and Meincke P P M 1977 Phys. Rev. B 15(1) 382–387
- [26] Mintz D, Armstrong R L, Powell B M and Buyers W J L 1979 Phys. Rev. B 19(1) 448–451
- [27] Armstrong R L, Mintz D, Powell B M and Buyers W J L 1978 Phys. Rev. B 17(3) 1260–1265
- [28] Fergusson J and Heveldt P 1974 Aus. J. Chem. 27 661–3
- [29] Bhaskaran L, Ponomaryov A N, Wosnitza J, Khan N, Tsirlin A A, Zhitomirsky M E and Zvyagin S A 2021 Phys. Rev. B 104(18) 184404
- [30] Lee S, Kim B H, Seong M J and Choi K Y 2022 Phys. Rev. B 105(18) 184433
- [31] Schmidtke H H, Lehnert N and Giesbers M 1997 Spectrochimica Acta Part A: Molecular and Biomolecular Spectroscopy 53 789–803 ISSN 1386-1425
- [32] Kozikowski B and Keiderling T 1980 Chemical Physics 53 323–331 ISSN 0301-0104
- [33] Dimitropoulos C, Pelzl J and Borsa F 1990 Phys. Rev. B 41(7) 3914–3919
- [34] Kume Y, Miyazaki Y, Matsuo T, Suga H, David W I F and Ibberson R M 1991 Europhysics Letters 16 265
- [35] Arnscheidt B, Müller S, Pelzl J and Höck K H 1992 Solid State Communications 82 845–849 ISSN 0038-1098
- [36] Swainson I, Powell B and Weir R 1997 Journal of Solid State Chemistry 131 221–230 ISSN 0022-4596
- [37] Kohlmann H 2022 Zeitschrift für anorganische und allgemeine Chemie 648 e202100375
- [38] Yamamuro O, Okishiro K, Matsuo T, Onoda-Yamamuro N, Oikawa K, Kamiyama T, Kume Y and Izumi F 1997 The Journal of Chemical Physics 107 8004–8011 ISSN 0021-9606
- [39] Armstrong R L, Dufort P and Powell B M 1991 Canadian Journal of Physics 69 137–141
- [40] Brown I D 1964 Canadian Journal of Chemistry 42 2758–2767
- [41] Cai Y, Xie W, Ding H, Chen Y, Thirumal K, Wong L H, Mathews N, Mhaisalkar S G, Sherburne M and Asta M 2017 Chemistry of Materials 29 7740–7749
- [42] Fedorovskiy A E, Drigo N A and Nazeeruddin M K 2020 Small Methods 4 1900426
- [43] Rahim W, Cheng A, Lyu C, Shi T, Wang Z, Scanlon D O and Palgrave R G 2020 Chemistry of Materials 32 9573–9583
- [44] Xu W and Zheng Y Q 2005 Zeitschrift für Kristallographie - New Crystal Structures 220 343–343
- [45] Noda Y, Ishii T, Mori M and Yamada Y 1980 Journal of the Physical Society of Japan 48 1279–1287
- [46] Abriel W and White M A 1990 The Journal of Chemical Physics 93 8321–8327 ISSN 0021-9606
- [47] Bennett C J, Brand H E, Yuen A K, Nicholas M K and Kennedy B J 2024 Journal of Solid State Chemistry 329 124427 ISSN 0022-4596
- [48] Grundy H D and Brown I D 1970 Canadian Journal of Chemistry 48 1151–1154
- [49] Armstrong R L, Morra R M and Powell B M 1985 Canadian Journal of Physics 63 988–996
- [50] Schefer J, Schwarzenbach D, Fischer P, Koetzle T, Larsen F K, Haussühl S, Rüdlinger M, McIntyre G, Birkedal H and Bürgi H B 1998 Acta Crystallographica Section B 54 121–128
- [51] Higashi T, Syoyama S and Osaki K 1979 Acta Crystallographica Section B 35 144–146
- [52] Syoyama S, Osaki K and Kusanagi S 1972 Inorganic and Nuclear Chemistry Letters 8 181–184 ISSN 0020-1650
- [53] Peresh E, Sidey V and Zubaka O 2005 Inorganic Materials 41 298–302
- [54] Elder M, Fergusson J, Gainsford G, Hickford J and Penfold B 1967 Journal of the Chemical Society A: Inorganic, Physical, Theoretical 1423–1425
- [55] Ishikawa H, Takayama T, Kremer R K, Nuss J, Dinnebier R, Kitagawa K, Ishii K and Takagi H 2019 Phys. Rev. B 100(4) 045142
- [56] Gui X, Calder S, Cao H, Yu T and Xie W 2019 The Journal of Physical Chemistry C 123 1645–1652
- [57] Henke H 2007 Zeitschrift für Kristallographie 222 477–486
- [58] Sutton M, Armstrong R L, Powell B M and Buyers W J L 1981 Canadian Journal of Physics 59 449–456
- [59] McElroy R G, Hwang J Y and Armstrong R L 1980 Journal of Magnetic Resonance (1969) 37 49–52 ISSN 0022-2364
- [60] Weir R D and Westrum, Jr E F 2002 The Journal of Chemical Thermodynamics 34 133–153 ISSN 0021-9614
- [61] McElroy R G C and Armstrong R L 1978 Phys. Rev. B 18(3) 1352–1355
- [62] Armstrong R L, Dufort P and Powell B M 1991 Canadian Journal of Physics 69 137–141
- [63] Hazell A 1966 Acta Chem. Scand 20
- [64] Kawald U, Müller S, Pelzl J and Dimitropoulos C 1988 Solid State Communications 67 239–241 ISSN 0038-1098
- [65] Das A K and Brown I D 1966 Canadian Journal of Chemistry 44 939–943
- [66] Das A K and Brown I D 1969 Canadian Journal of Chemistry 47 4288–4289
- [67] Abriel W and du Bois A 1989 Zeitschrift für Naturforschung B 44 1187–1194
- [68] Furukawa Y and Nakamura D 1989 Berichte der Bunsengesellschaft für physikalische Chemie 93 13–18
- [69] González R, Chiozzone R, Kremer C, De Munno G, Nicolò F, Lloret F, Julve M and Faus J 2003 Inorganic Chemistry 42 2512–2518
- [70] Kochel A 2004 Materials Science-Wroclaw- 22 69–75
- [71] Negita K, Nakamura N and Chihara H 1980 Solid State Communications 34 949–951 ISSN 0038-1098
- [72] Negita K, Nakamura N and Chihara H 1982 Journal of the Physical Society of Japan 51 858–863
- [73] Armstrong R L, Morra R M, Powell B M and Buyers W J L 1983 Canadian Journal of Physics 61 997–1002
- [74] Brill T B, Gearhart R C and Welsh W A 1974 Journal of Magnetic Resonance (1969) 13 27–37 ISSN 0022-2364
- [75] Lerbscher J A and Trotter J 1976 Acta Crystallographica Section B 32 2671–2672
- [76] Armstrong R L, Lo B and Powell B M 1989 Canadian Journal of Physics 67 1040–1043
- [77] Abriel W and Ihringer J 1984 Journal of Solid State Chemistry 52 274–280 ISSN 0022-4596
- [78] Abriel W 1982 Materials Research Bulletin 17 1341–1346 ISSN 0025-5408
- [79] Yun H and Jang G J 2007 Acta Crystallographica Section E 63 i22–i23
- [80] Shannon R D 1976 Acta Crystallographica Section A 32 751–767
- [81] Sidey V 2016 Acta Crystallographica Section B 72 626–633
- [82] Lawton S L and Jacobson R A 1966 Inorganic Chemistry 5 743–749
- [83] Webster M and Collins P H 1973 J. Chem. Soc., Dalton Trans. (6) 588–594
- [84] Abriel W and Zehnder E J 1987 Zeitschrift für Naturforschung B 42 1273–1281
- [85] Nakamura D and Kubo M 1964 The Journal of Physical Chemistry 68 2986–2991