Enhanced quantum yields and efficiency in a quantum dot photocell modeled by a multi-level system
Abstract
To absorb the photons below the band-gap energy effectively, we proposed a quantum dot (QD) photocell modeled by multi-level system for the quantum yields and photo-to-charge efficiency limits. The theoretical results show the quantum yields are enhanced as compared to the single band-gap solar cell, and the photo-to-charge efficiencies are larger than Shockley and Queisser efficiency in the same absorbed spectrum. What’s more, at the room temperature the efficiency limits are well beyond 63 achieved by Luque and Marti (Ref26 ) due to absorbing the low-energy photons via two sub-bands in this proposed photocell system. The achievements may reveal a novel theoretical approach to enhance the QD photocell performance modeled a multi-level absorbing photons system.
- PACS numbers
-
42.50.Gy
- Keywords
-
Quantum dot photocell modeled by a multi-level system; photo-to-charge efficiency; quantum yields; low-energy photons;
I INTRODUCTION
Sunlight is the most abundant energy source available on earth. Thus, solar cell attracts the enduring interests from the scientists in the world, but the photo-to-charge efficiency limit is still a challenge for them. Therefore, various materials and device concepts, such as the inorganic material cell1 , organic photovoltaics2 ; 3 ; 4 ; 5 , hybrid perovskites6 and nanostructured solar cells7 have been proposed to enhance the conversion efficiencies 8 ; 9 . In addition to these, one of the main research and development directions is toward reducing the fundamental losses in the solar cells10 ; a . However, a better understanding of the losses shall provide new insights into the quantum process. Thus, quantum coherence 10 ; 11 ; 12 ; 13 ; 14 ; 15 ; 16 ; 17 ; 18 has been demonstrated to break the detailed balance and resulting in enhancement of the output power in solar cells. It has been shown that the Fano interference can lead to suppression of absorption in an optical system12 ; 13 ; 14 . Recently, Fano interference reveals the enhancement of absorption light and the power across the load15 in a photocell. A scheme of photon ratchet intermediate band solar cellb was introduced due to the increasing lifetime of the intermediate states, which can reduce unnecessary entropy generation and the Boltzmann loss through radiative emission. Another important direction is to find efficient absorbers for increasing the efficiency limit. Then, split spectrum solar cells19 ; 20 , multi-junction solar cells21 and tandem solar cells22 were introduced for the multi-photon absorption.
With the multi-photon absorption contributing to the quantum yields in heart, we propose an enhanced quantum yields scheme in a QD photocell modeled by a multi-level system, which can fully absorb the low-energy photons. And the introduced intermediate band in this proposed photocell model may be achieved by super-lattices and organized quantum dots23 ; 24 . Thus, the separated state may be created due to quantum size effects25 , and two solar photons below the energy gap can be absorbed by two sub-bands simultaneously. As facilitates the increasing carriers forming the delocalized state in the intermediate band. Thus, the multi-photon absorption process enhances the quantum yields and the photo-to-charge efficiency limit as compared to the achieved efficiencies by Luque and Marti in 199726 .
In the following, the work is organized as follows: the proposed quantum dot photocell model with an intermediate band is described in Sec.2. And the current-voltage characteristic , power and photo-to-charge efficiency are evaluated by different optimum parameters in Sec.3. Sec.4 presents our conclusions and outlook.
II The proposed quantum dot photocell model with multi-level system
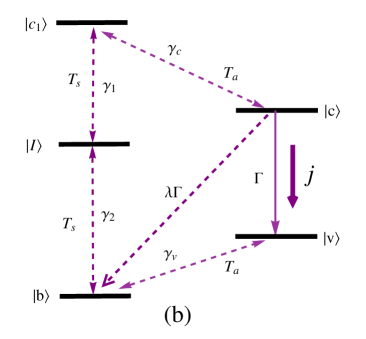
We proposed the quantum dot photocell modeled by a multi-level model generated from the theoretical prototype mentioned in Ref.13 , and an intermediate band was introduced in this multi-level quantum dot photocell. The intermediate band may be grown by super-lattices or organized quantum dots23 ; 24 , and , represent chemical potentials of a cathode in the conduction band and an anode in the valence band [seen Fig.1(a)]. Therefore, the single band-gap between the conduction and valence band was divided into two sub-bands, i.e., the upper sub-band gap and the lower sub-band gap . Two solar photons , with energy below the semiconductor band gap are absorbed resonantly by the two subdivided energy gaps shown in Fig.1(a), which resulted in more excited electrons transfering from the intermediate band to the conduction band . Fig. 1(b) is the corresponding multi-level diagram for Fig.1(a), in which the upper level depicts the conduction band and level is on behalf of the valence band, and the level is interpreted as the intermediate band. When the electronic system interacts with radiation and phonon thermal reservoirs, the thermal solar photons with frequency and are assumed to direct onto the photocell. They drive and transitions with the average occupation numbers = , and = , where , are the two divided energy gaps and is the solar temperature. The ambient thermal phonons at temperature drive the two low-energy transitions and . Their corresponding phonon occupation numbers are = and = , where and are their corresponding energy gaps, respectively.

The interaction Hamiltonian describing the electronic system interacting with radiation and phonon thermal reservoirs in the rotating-wave approximation is given as follows,
| (1) | |||||
where are the coupling constants for the corresponding transitions, is the energy spacing between levels and . is the photon or phonon frequency, and , are the photon annihilation operators and phonon annihilation operators, respectively. is the Pauli rise or fall operator. The equation of motion for the electronic density operator reads
| (2) | |||||
where the density operator describes the phonon thermal reservoirs. In the Weisskopf-Wigner approximation, the master equations describing the the electronic system interacting with radiation and phonon thermal reservoirs are obtained in the following,
where is modeled the electrons’ decaying process as spontaneous decay rates of the corresponding transitions [see Fig.1(b)]. In this model, levels and are connected to a load, and the load is yielding a decay of the level into level at a rate . The recombination between the acceptor and the donor is modeled by a decay rate of [also see Fig. 1(b)], where is a dimensionless fraction. And we focus on steady-state operation of the photocell model, voltage across the load is expressed in terms of populations of the levels and as11 ; 12 ; 13 ; 14 ,
| (4) |
where , is the ambient temperature circumstance. The current through the cell is interpreted as and power delivered to the load is = which is supplied by the incident solar radiation power 11 . Then, the the photo-to-charge efficiency can be calculated as the ratio between the output power and incident solar radiation power ,
| (5) |
where describes the different energy gaps, and the incident solar radiation power equals to with the fundamental charge of an electron being .
III Quantum yields within the energy gap range [0.5, 1.25]
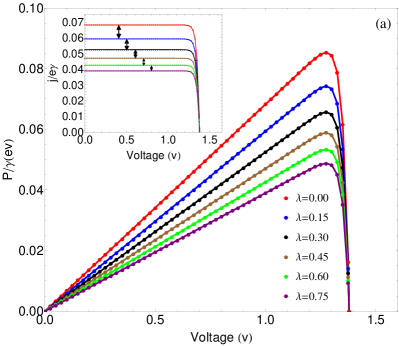
Shockley and Queisser efficiency27 indicates that semiconductors can present the photovoltaic effect within band gaps ranging from about 1.25 to 1.45 , while the solar spectrum in the range of [354, 2480] contains photons with energies ranging from 0.5 ev to 3.5 ev. Photons with energy below the semiconductor band gap, i.e., in the range of [0.5, 1.25] are not absorbed. In this work, we discuss the quantum yields with two sub-band energy gaps falling in the range of [0.5, 1.25], in which the solar photons are called low-energy photons. The radiative recombination between the acceptor and the donor is often regarded as the fundamental losses in the cells, and it intuitively affects linearly the quantum yields. Fig.2(a) shows our results about the quantum yields versus the voltage with the optimum values of at the room temperature =0.0259, and their corresponding current-voltage characteristic diagram is inserted in Fig.2(a). The lengths of black double-arrow lines in the insert diagram indicate that the radiative recombination decreases the current-voltage characteristic nonlinearly. The nonlinear reduction can also be shown by the peak power curves in Fig.2(a). These counter-intuitive results demonstrate that there is other quantum loss in the quantum yields except the radiative recombination. We also notice that the output current is about 0.038 and the corresponding peak power is about 0.048 at , which are larger than those with full noise-induced coherence in Ref 13 , respectively. These results indicate two sub-bands can substantially enhance the quantum yields. The underlying mechanism is that the carriers delocalized in the intermediate sate can increase the possibility of carriers transiting to the conduction band, which ultimately improves the quantum yields greatly.
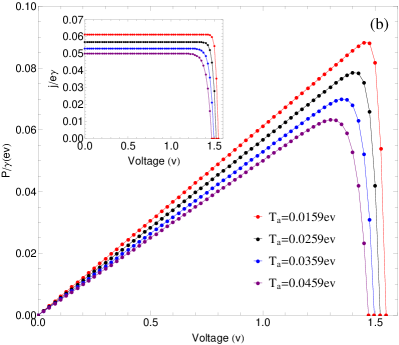
The ambient circumstance temperature selected as the optimum parameters is shown in Fig.2(b). And one can see that some different features are manifested by the curves of the current-voltage characteristic and output power. The output current and peak power decrease with the ambient temperatures , and the data displays that the current declines from 0.062 to 0.05 and the peak power varies from 0.085 to 0.063 when the ambient circumstance temperature increases by 0.01 . So, the higher ambient circumstance temperature decreases the quantum yields prominently. In this proposed photocell model, we also notice that the quantum yields, i.e., current-voltage characteristic and output power are significantly improved as compared to those in Ref 13 at =0.0259, and the peak power is more than twice as much as that in Ref13 with the full coherence. What’s more, the higher ambient circumstance temperature causes the shrinks of the voltages in Fig.2(b), which is different from the radiative recombination effects in Fig.2(a). These results demonstrate that sub-bands absorbed photons within the low-energy region can enhance the quantum yields greatly. However, the quantum behavior of the charge carriers (electrons and holes) in the transporting to the conduction band is greatly affected by the ambient temperature.
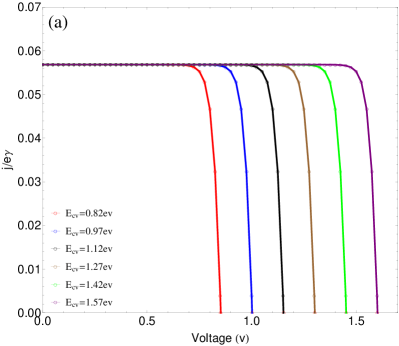
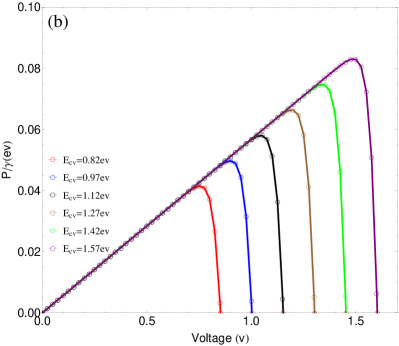
We consider the influence of energy spacing on the quantum yields in Fig.3. The other selected parameters are the same as those in Fig.2. It shows that the currents remain the same values while the voltage increases in tandem with the optimum value of by the current-voltage characteristic curves (Seen in Fig.3(a)). The peak power and voltage monotonically increase with the optimum values of . The optimum energy spacing displays a linear and monotonic enhance for the voltage and for the peak power, while it sprinkles no effect on the output current. When the optimum value of is large enough the photocell generates more power. This provides an approach to improve the output voltage and peak power while outputs the steady current.
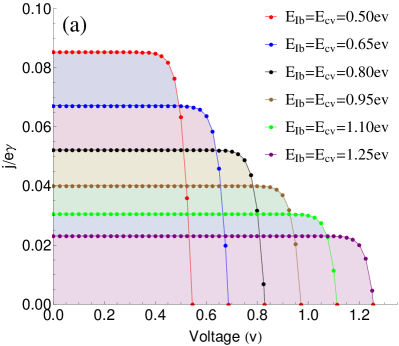
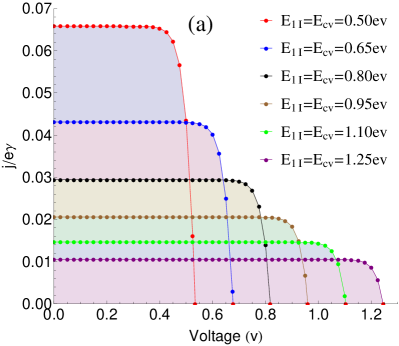
The introduced intermediate band is the characteristic of this QD photocell with multi-level system, and it provides the optimum values of the two sub-band gaps. The previous results demonstrate the sub-band gaps absorbing the low-energy solar photons can enhance the quantum yields greatly. Now the question, that whether the optimum values of the upper or lower sub-band energy gaps affect the quantum yields identically or not comes out, and Fig.4 and Fig.5 give the answers with the synchronous optimization of the upper and lower sub-band energy gaps, and . Although the current-voltage characteristic displays the same evolutionary characteristics versus the voltage in Fig.4(a) and Fig.5(a), i.e., the output currents decrease with the upper or lower sub-band gaps, or , we also notice that the output currents in Fig.4(a) are larger than those in Fig.5(a) with the same optimum values of the two sub-band energy gaps. When ==0.5, the output current is 0.085 in Fig.4(a) and 0.066 in Fig.5(a). It indicates that the different function between the lower and upper sub-band gaps and that the low-energy solar photons absorbed by the lower sub-band contribute the current more than those by the upper sub-band. The comparison between Fig.4(a) and Fig.5(a) reveals the underlying mechanism that the narrower lower sub-band can absorb much more low-energy solar photons shored in the intermediate band, which promotes the possibility for carriers transiting to the conduction band and forming the output current.

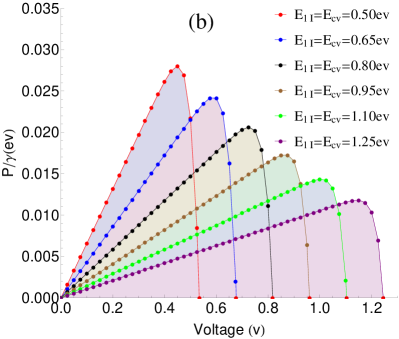
However, the influences between the lower and upper sub-bands , are not completely the same on the output peak power in Fig.4(b) and Fig.5(b). The output peak power monotonously decreases with the upper sub-band in Fig.5(b), while there is a slight increment then decrease in the output peak power during the increment of the lower sub-band in Fig.4(b). These results signify much fewer low-energy solar photons are absorbed by the wider upper sub-band gap in the energy gap of [0.5, 1.25], and that much fewer carriers produced in the conduction band incurs the decreasing output peak power. The wider band-gap of the lower sub-band can absorb much high-energy solar photons in the range [0.5, 1.25], but the much higher-energy solar photons absorbed by the wider lower sub-band lose as multiple phonon emission because of the photo-generated carriers with much larger kinetic energy. These cause to the slight increment then decrease in the peak power in Fig.4(b).
IV Photo-to-charge efficiency within solar spectrum
As is well known, semiconductors generate the Shockley and Queisser efficiency27 within the band-gap ranging from about 1.25 to 1.45 . That’s to say, the absorbed spectrums for the Shockley and Queisser efficiency ranges about in [855 , 992 ] (the green areas shown in Fig.6 (a) and (b)). However, the solar spectrum ranges from about 354 to 2480 . In Fig.6, we simulate the two sub-bands and to absorb all the solar photons from the solar spectrum, and examine the photo-to-charge efficiency with different optimum ambient temperatures .
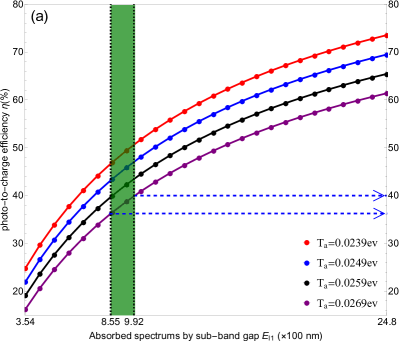
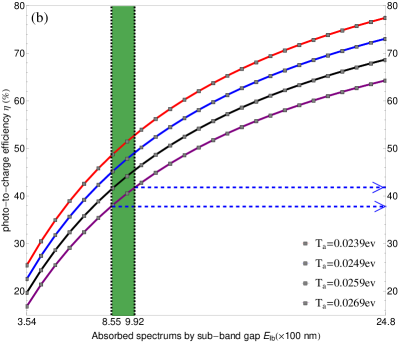
Investigation to Fig.6 (a) and (b), three significant results were achieved straightly. Firstly, the photo-to-charge efficiency decreases with the ambient temperatures . What’s more, the influence on caused by is much stronger in the long wavelength region than those in the short wavelength region, which can be drawn from the spacings between the curves both in Fig.6 (a) and (b). As demonstrates that the higher energy photons in the short wavelength region have the greater possibility to transit to the conduction band and bring out little efficiency variation in a higher circumstance temperature. The larger in the long wavelength region indicates the absorbed low-energy photons is a good optimum approach to enhance in this proposed QD photocell model. Secondly, in this proposed QD photocell are larger than the Shockley and Queisser efficiency in green areas with photons energy ranging in [1.25, 1.45]. At =0.0269 in the green areas shown by Fig.6 (a) and (b), this proposed QD photocell outputs the smallest with the different optimum values of . The values of are about 36 and 38 with absorbing wavelength 855 , and 40 and 42 with absorbing wavelength 992 in Fig.6 (a) and (b), respectively. The result owns to the carriers generated by the two sub-band gaps absorbing more low-energy photons than those in the Shockley and Queisser efficiency model. We also achieve the third knowledge from the comparison of the absorbed spectrums by with . At the ambient circumstance temperature =0.0269, the values of at the wavelength 855 and 992 in Fig.6 (a) are smaller than those in Fig.6(b), respectively. Which shows the different roles of the two sub-bands and in the output efficiency in this proposed photocell model. Not only that, but the photo-to-charge efficiency limits are about 65.42 and 68.88 at the room temperature =0.0259 in Fig.6 (a) and (b), respectively, which is larger than the efficiency limit 63 achieved by Luque and Marti in 199726 .
Before concluding this paper, we would like to emphasize the following points. First, our current work is focused on how the sub-band energy gaps to affect the quantum yields. Furthermore, our central results indicate that the enhanced quantum yields are achieved as compared to the Ref13 by the absorbed low-energy photons, and the photo-to-charge efficiency is larger than the Shockley and Queisser efficiency with different optimum ambient temperatures. Second, we only discuss the photons absorbed resonantly by this proposed QD photocell, while for energies above the band gap charge carriers with an excess kinetic energy are not considered here. Third, the interband transition rate of the carriers is also not discussed here. But the above mentioned points does not influence to reveal the significance of the current work. And we believe our future work will bring some important insights into these fundamental problems.
V Summary and discussion
In summary, by simulating a QD solar cell with a multi-level system, we discussed its quantum yields with the sub-bands absorbing solar photons ranging in [0.5, 1.25]. Under different optimum parameters, the quantum yields were enhanced as compared to the single band-gap quantum dot photocell. In the same solar absorbed spectrum region, the achieved photo-to-charge efficiencies are larger than the Shockley and Queisser efficiency, and the efficiency limits at the room temperature are also larger than 63 obtained by Luque and Marti. Thus, it points out a novel approach to enhance the QD photocell performance via the full absorbing the low-energy photons.
Acknowledgements.
We thank the financial supports from the National Natural Science Foundation of China ( Grant Nos. 61205205 and 61565008 ), and the General Program of Yunnan Applied Basic Research Project, China ( Grant No. 2016FB009 ).References
- [1] Hossain M, Alharbi F, Mater Technol: Adv. Perform. Mater. 28, 88 (2013).
- [2] Darling S B, You F, Rsc. Adv. 3, 17633 (2013).
- [3] Carl J E , Krebs F C, Sol. Energy Mater. Solar Cells 119, 309 (2013).
- [4] Ameri T, Khoram P, Min J, Brabec C J, Adv. Mater. 25, 4245 (2013).
- [5] Ingans O, Adv. Mater. 1800388 (2018).
- [6] McGehee M D, Nature 501, 323 (2013).
- [7] Liang D, Kang Y, Huo Y, Chen Y, Cui Y, Harris J S, Nano Lett. 13, 4850 (2013).
- [8] Li H, Wang X, Zhang T, Gong X, et. al., Adv. Funct. Mater. 1903293 (2019).
- [9] Zhang T, Dement D B, Ferry V E, Holmes R J, Nat. Commu. 10, 1156 (2019).
- [10] Scully M O , Phys. Rev. Lett. 104, 207701 (2010).
- [11] Louise C H and Nicholas J E, Prog. Photovolt: Res. Appl. 19, 286 (2011).
- [12] Svidzinsky A A, Dorfman K E, and Scully M O, Phys. Rev. A 84, 053818 (2011).
- [13] Dorfman K E, Chapin K R, Raymond Ooi C H, Svidzinsky A A, and Scully M O, AIP Conference Proceedings 1411, 256 (2011).
- [14] Scully M O, Chapin K R, Dorfman K E, Barnabas Kim M, and Svidzinsky A A, PNAS 108, 15097 (2011).
- [15] Creatore C, Parker M A, Emmott S, and Chin A W, Phys. Rev. Lett. 111, 253601 (2013).
- [16] Svidzinsky A A, Dorfman K E, and Scully M O, Coherent Optical Phenomena 2, 7 (2013).
- [17] Zhang Y, Oh S, Alharbi F H, Engelc G S, and Kais S, Phys. Chem. Chem. Phys. 17, 5743 (2015).
- [18] Ernzerhof M, Blanger M A, Mayou D, and Aram T N, J. Chem. Phys. 144, 134102 (2016).
- [19] Aram T N, Ernzerhof M, Asgari A, and Mayou D, J. Chem. Phys. 146, 034103 (2017).
- [20] Green M A, Ho-Baillie A, Prog. Photovolt: Res. Appl. 18, 42 (2010).
- [21] Yoshida M, Ekins-Daukes N J, Farrell D J, and Phillips C C,Appl. Phys. Lett. 100, 263902 (2012).
- [22] Hossain M I, Bousselham A, Alharbi F H, J.Phys. D: Appl. Phys. 47, 075101 (2014).
- [23] Waldau A J, Sol. Energy 77, 667 (2004).
- [24] Nattestad A, Mozer A J, Fischer M K R, et.al., Nat. mater. 9, 31 (2010).
- [25] Yang X G, et al., Chin. Phys. Lett. 28, 038401 (2011).
- [26] Beattie N S, et al., ACS Photonics 4, 2745 (2017).
- [27] Yu H, Yun J, Lee K, Lee J, Hwang D, Kang J, Kim S K and Jang J, J. Mater. Chem. A 32, 116834, (2017).
- [28] Luque A, Marti A, Phys. Rev. Lett. 78, 5014 (1997).
- [29] Shockley W, Queisser H J, J. Appl. Phys. 32, 510 (1961).