tcb@breakable
Measuring Multimodal Mathematical Reasoning with
MATH-Vision Dataset
Abstract
Recent advancements in Large Multimodal Models (LMMs) have shown promising results in mathematical reasoning within visual contexts, with models approaching human-level performance on existing benchmarks such as MathVista. However, we observe significant limitations in the diversity of questions and breadth of subjects covered by these benchmarks. To address this issue, we present the MATH-Vision (MATH-V) dataset, a meticulously curated collection of 3,040 high-quality mathematical problems with visual contexts sourced from real math competitions. Spanning 16 distinct mathematical disciplines and graded across 5 levels of difficulty, our dataset provides a comprehensive and diverse set of challenges for evaluating the mathematical reasoning abilities of LMMs. Through extensive experimentation, we unveil a notable performance gap between current LMMs and human performance on MATH-V, underscoring the imperative for further advancements in LMMs. Moreover, our detailed categorization allows for a thorough error analysis of LMMs, offering valuable insights to guide future research and development.
![[Uncaptioned image]](/html/2402.14804/assets/x1.png)
(a) Subjects
![[Uncaptioned image]](/html/2402.14804/assets/x2.png)
(b) Levels
1 Introduction
The latest advancements in Large Language Models (LLMs) OpenAI (2023a); Touvron et al. (2023); Anil et al. (2023a); Almazrouei et al. (2023); Team (2023b) and Large Multimodal Models (LMMs) OpenAI (2023b); Team (2023a); Dong et al. (2024); Lin et al. (2023); Liu et al. (2023a); Bai et al. (2023) have demonstrated remarkable capabilities, achieving impressive performance on a diverse array of language and visual-language tasks Zhao et al. (2023); Yang et al. (2023); Rozière et al. (2024); Brown et al. (2020); Goyal et al. (2017); Huang et al. (2023); Zhang et al. (2023b); Cui et al. (2024); Zhang et al. (2023a). As a result of these strides, recent LMMs like GPT-4V OpenAI (2023b), InternLM-XComposer2-VL Zhang et al. (2023c) and Gemini Team (2023a) are approaching the performance level of average humans on multimodal mathematical reasoning. Specifically on MathVista Lu et al. (2023), which serves as the most commonly used test-bed to assess the LMMs’ ability in mathematical reasoning in visual contexts, current models achieve 57.6 compared to humans’ 60.3, and for some subtasks like geometry problem solving, math word problems, LMMs can even surpass average humans. This development raises a critical question: Can the numbers indicate that the mathematical reasoning ability of LMMs is comparable to average humans?
To answer this question, we conducted a thorough examination of the data within MathVista, which unifies math questions on figures in nearly all existing datasets and is considered the most comprehensive benchmark for mathematical reasoning in visual contexts by now. MathVista comprises an extensive collection of math-related visual-question-answering (VQA) instances gathered from diverse sources including 19 existing VQA datasets, nearly all existing math-VQA datasets, and 3 newly collected ones. Our analysis of MathVista reveals two key issues: Firstly, although a significant portion of its visual data exhibits diversity, the questions regarding the visual data are quite limited in question types and contents. For example, we identified that among the 375 questions on “abstract scene”, the majority can be categorized into just three types of questions: (1) Object Counting, (2) Length Measurement with a given reference, and (3) Time Inquiry based on a clock. Questions are generally simple and seldom require in-depth mathematical reasoning. Similar problems also exist in image contexts of “function plots”, “synthetic scenes”, “natural images”, etc. This tendency towards monotonous question patterns is commonly observed in data derived from 19 VQA datasets where annotators are designated to create math-related questions following the collection of contextual images.
Secondly, the data originating from Math-QA datasets is confined to a narrow scope of mathematical subjects. These datasets compile questions directly from math tests and textbooks, accompanied by visual contexts. However, the range of subjects remains limited, primarily encompassing topics like plane geometry, tables, and chart question-answer pairs. Although three newly collected datasets show considerable diversity in the problems they present, the overall number of problems per subject remains notably sparse.
Therefore, recognizing the limitations of existing benchmarks and aiming to more comprehensively evaluate the mathematical reasoning skills of LMMs, we introduce the MATH-Vision (MATH-V) dataset. This dataset comprises 3,040 high-quality mathematical problems within visual contexts across 12 grades, carefully selected from 19 math competitions. To ensure a high-quality standard, all data within our dataset were cross-validated and filtered by multiple expert annotators to make sure to have a unique and correct answer. The dataset is well-balanced, featuring 1,532 problems in an open-ended format and 1,508 in a multiple-choice format. In order to better provide insight regarding model performance on our proposed dataset, we categorize all problems by difficulty levels ranging from 1 to 5, and 16 distinct mathematical disciplines, such as logic, arithmetic, graph theory, topology, analytic geometry, combinatorial geometry, and solid geometry, among others. This classification also undergoes a human verification system to ensure accuracy and reliability. We hope that this categorization can facilitate better analysis of mathematical problem-solving skills across various levels of difficulty and subject areas.
We conduct extensive experiments with our datasets aiming at providing insights into the mathematical reasoning ability of current LMMs on human tests. As depicted in Figure 3, the initial observation is a substantial gap in mathematical reasoning within visual contexts between LMMs and humans, with respective scores of 22.76 and 75.66. Our MATH-V benchmark establishes a significant challenge for LMMs but is relatively easy for humans to achieve a good score. Within existing LMMs, the performance of the model trained with internal data (i.e., GPT-4V, Gemini) is still better than that of the model trained with publicly available data (i.e., SPHINX Lin et al. (2023), InternLM-XComposer2-VL). While the top-performing models (GPT-4V and Gemini) excel at basic computational tasks, they cannot comprehend the invariant properties of geometric objects under continuous deformations, such as stretching, twisting, crumpling, and bending. This suggests current top-tier LMMs are not yet comparable to average humans in terms of mathematical reasoning in visual contexts. Therefore, there remains a significant margin for improvement for LMMs to reach human-level performance. In conclusion, the contributions of this study are listed as follows:
-
•
We propose the MATH-V benchmark comprised of 3k problems with visual context selected from real math competitions. All problems are classified into 5 difficulty levels and 16 distinct mathematical disciplines.
-
•
We benchmark several open-source and proprietary LMMs with MATH-V and there exists a big gap in mathematical reasoning within visual context between humans and LMMs.
-
•
Finally, benefiting from the fine-grained categorization, we provided a very comprehensive error analysis of current LMMs, providing insights for improvement.
2 Related Works
2.1 Mathematical Reasoning Benchmarks
Various benchmark datasets Hendrycks et al. (2020); ling-etal-2017-program; Hendrycks et al. (2021); patel-etal-2021-nlp; Amini et al. (2019) have been proposed to assess a model’s mathematical reasoning capabilities. However, current multimodal benchmarks Agrawal et al. (2015); Masry et al. (2022); Mobasher et al. (2022); Gurari et al. (2018) primarily focus on visual recognition tasks, and multimodal math reasoning benchmarks are less common. Early multimodal reasoning benchmarks, such as Lu et al. (2021) and GeoQA+ Chen et al. (2021), are very limited in subjects, primarily focused on plane geometry. Among recent multimodal benchmarks, MMMU Yue et al. (2023) stands out, though it is limited to multiple-choice questions and only a small fraction of its content is mathematical. Another recent benchmark, MathVista Lu et al. (2023), evaluates mathematical reasoning abilities within diverse visual contexts. However, it lacks a detailed classification of mathematical subdomains and emphasizes visual abilities rather than mathematical reasoning. In contrast, our benchmark contains math problems rigorous in both mathematical reasoning and visual recognition, categorized by clear difficulty levels and covering 16 representative subjects.
2.2 LMMs for Math
Recently, math-specific LLMs such as Llemma Azerbayev et al. (2023) and Mathcoder Wang et al. (2024) have demonstrated significant capabilities in text-only mathematical reasoning tasks and are competitive with general large language models like GPT-4 OpenAI (2023a); Zhou et al. (2024) and PaLM-2 Anil et al. (2023b) at a much smaller scale. Notably, AlphaGeometry Trinh et al. (2024) has shown impressive performance in solving challenging geometry problems, though it lacks the ability to process images and must rely on text descriptions of images. Current math-specific multimodal models, such as G-LLaVA Gao et al. (2023), UniMath Liang et al. (2023), MatCha Liu et al. (2022), and UniChart Masry et al. (2023), are primarily focused on plane geometry or chart-based problems and still lag behind general multimodal models such as GPT-4V OpenAI (2023b). To facilitate better evaluation of the mathematical reasoning abilities of multimodal models, we introduce our benchmark, featuring high-quality problems demanding expertise in both mathematical reasoning and visual recognition.
2.3 Multimodal Foundation Models
With the success of LLMs, MiniGPT-4 Zhu et al. (2023), LLaMA-Adapter Zhang et al. (2023d), and LLaVa Liu et al. (2023b, a) have attempted to construct multimodal models from text-only models. Subsequently, various large multimodal models such as GPT-4V OpenAI (2023b), Gemini Team (2023a), Qwen-VL Bai et al. (2023), InternLM-XComposer-VL Zhang et al. (2023c); Dong et al. (2024), and SPHINX Lin et al. (2023) have been created, demonstrating impressive performance on benchmarks like MMMU Yue et al. (2023) and MathVista Lu et al. (2023). Notably, some open-sourced models have even received scores higher than GPT-4V by a significant margin on these benchmarks. However, on our benchmark, GPT-4V performs considerably better than the other models, showing that open-source models still lack generalization abilities, especially on questions very different from those in fine-tuning datasets.
| Statistic | Number |
| Total questions | 3,040 |
| - multiple-choice questions | 1,532 (50.4%) |
| - Free-form questions | 1,508 (49.6%) |
| - Questions in the testmini set | 304 (10.0%) |
| Multiple-choice questions | 1,532 |
| - Proportion of answers A | 299(19.5%) |
| - Proportion of answers B | 311(20.3%) |
| - Proportion of answers C | 320(20.9%) |
| - Proportion of answers D | 326(21.2%) |
| - Proportion of answers E | 278(18.1%) |
| Unique number of images | 3,472 |
| Unique number of answers | 370 |
| Levels | 5 |
| Subjects | 16 |
| Source competitions | 19 |
| - Math Kangaroo | 1,499 |
| - UK (Grey,Pink,Junior,Senior) | 535 |
| - AMC (8,10,12), AIME | 759 |
| Maximum question length | 280 |
| Minimum question length | 5 |
| Average question length | 42.3 |

3 Dataset
3.1 Overview
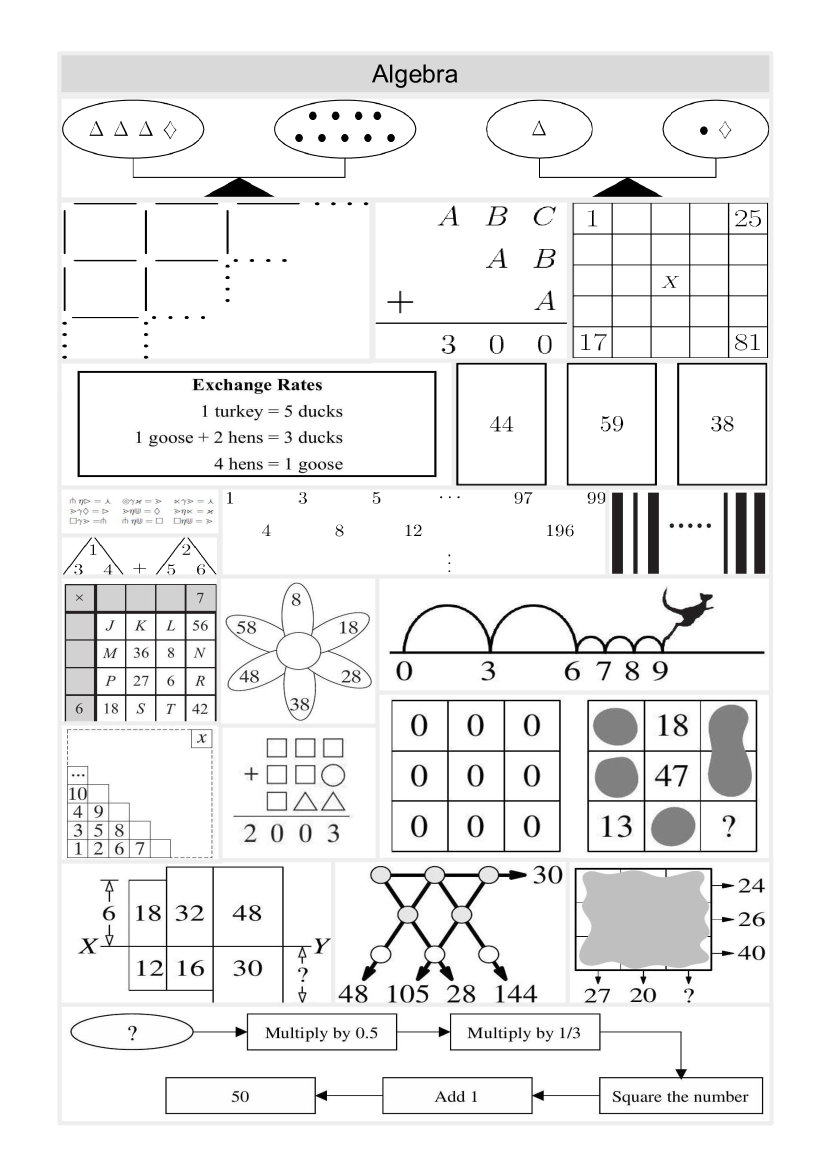
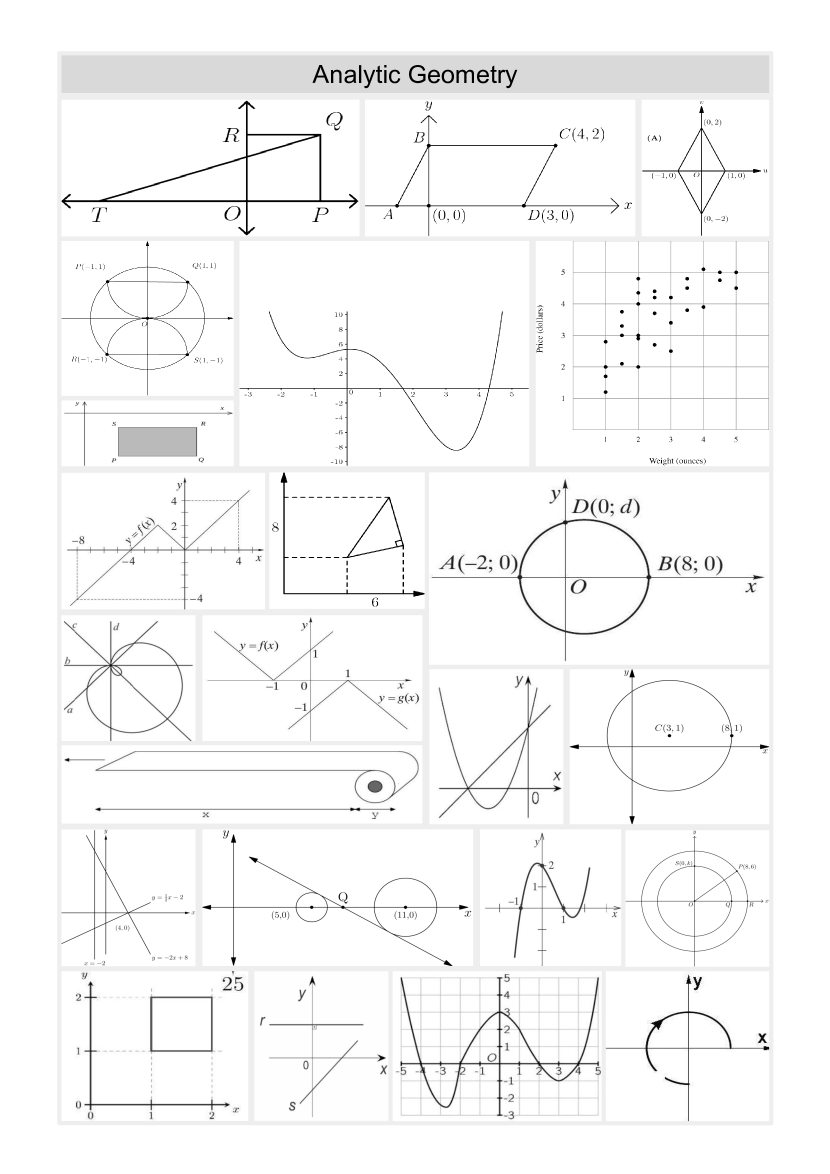
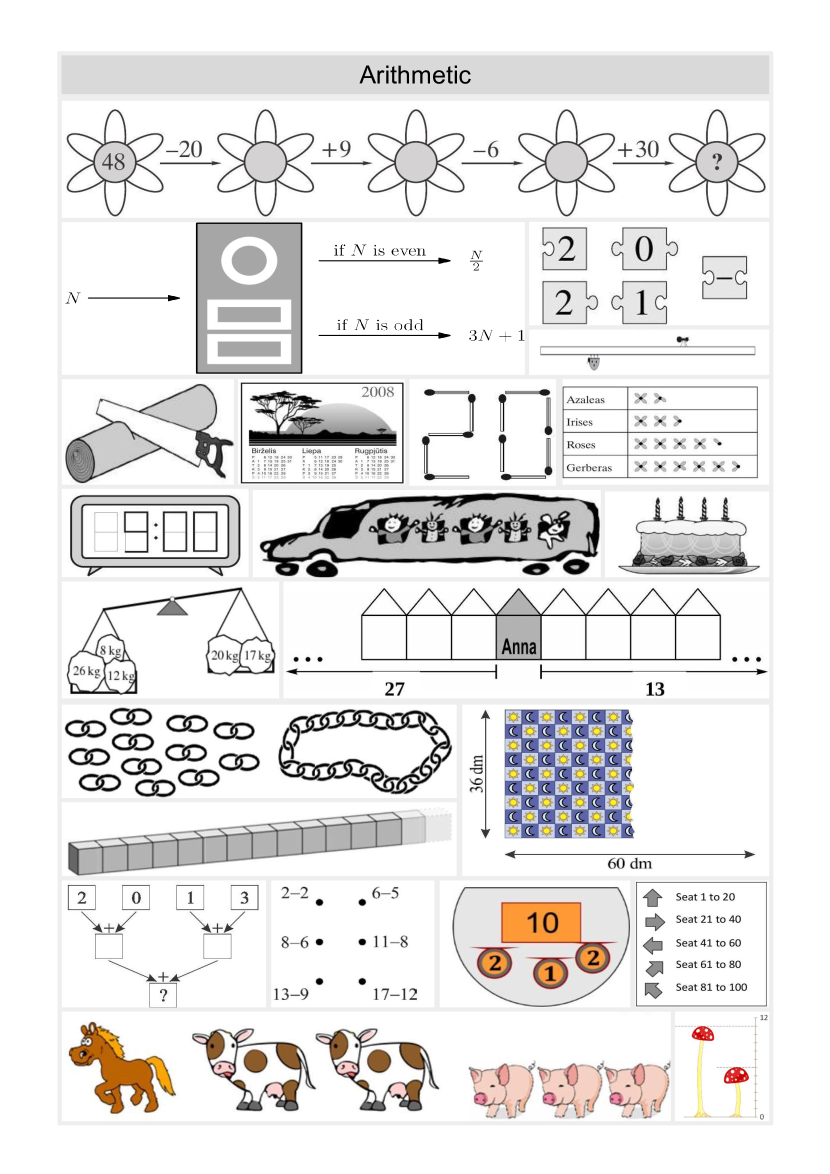
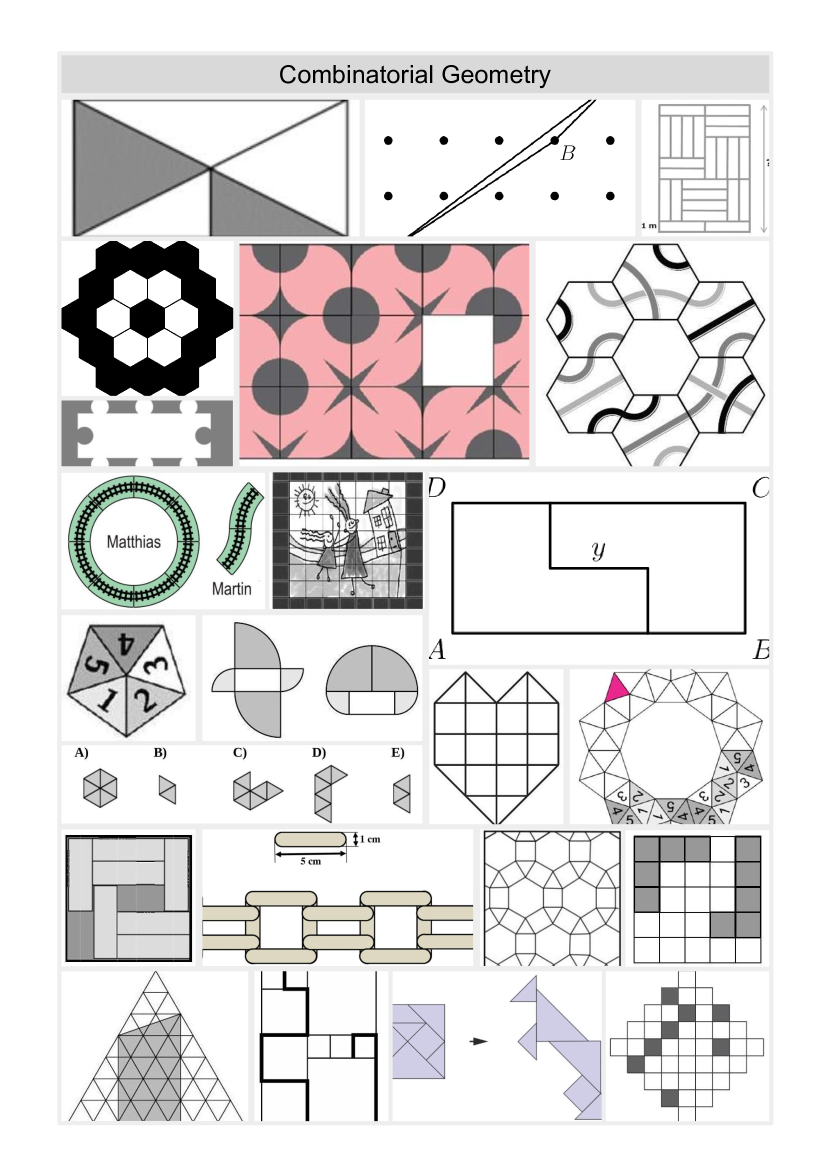
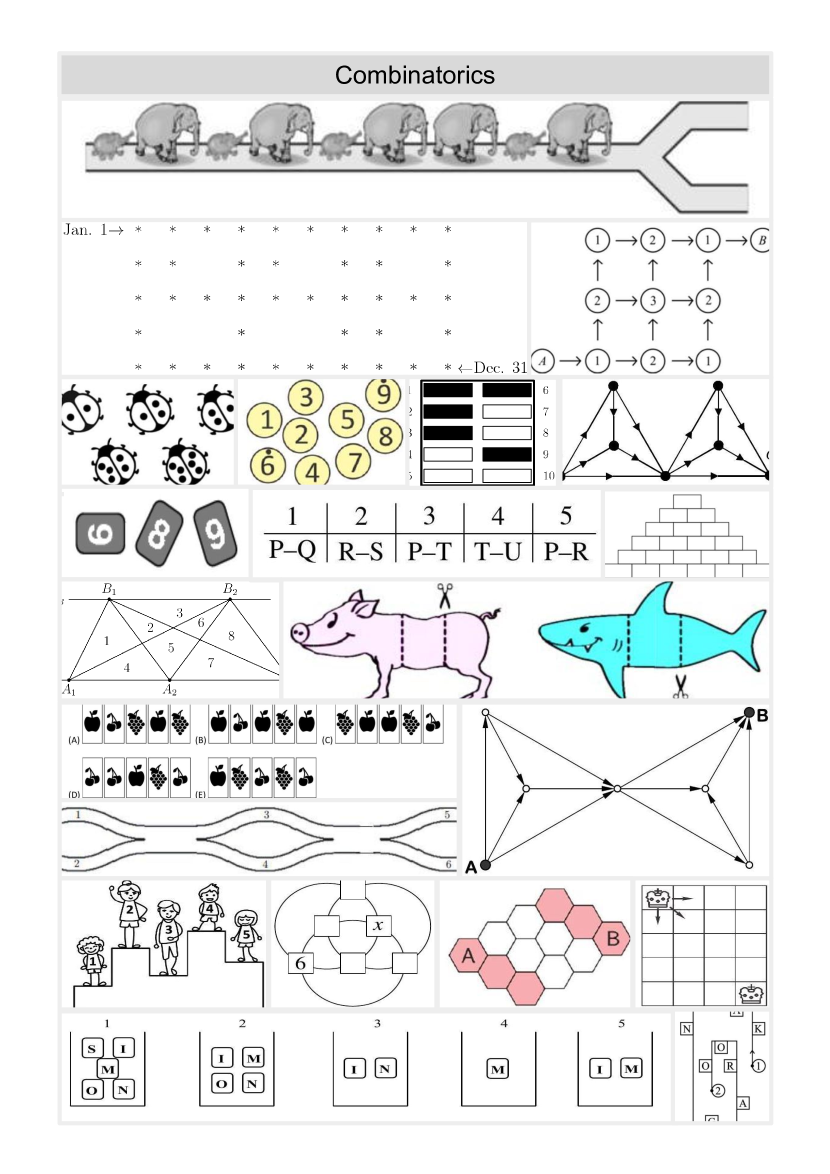
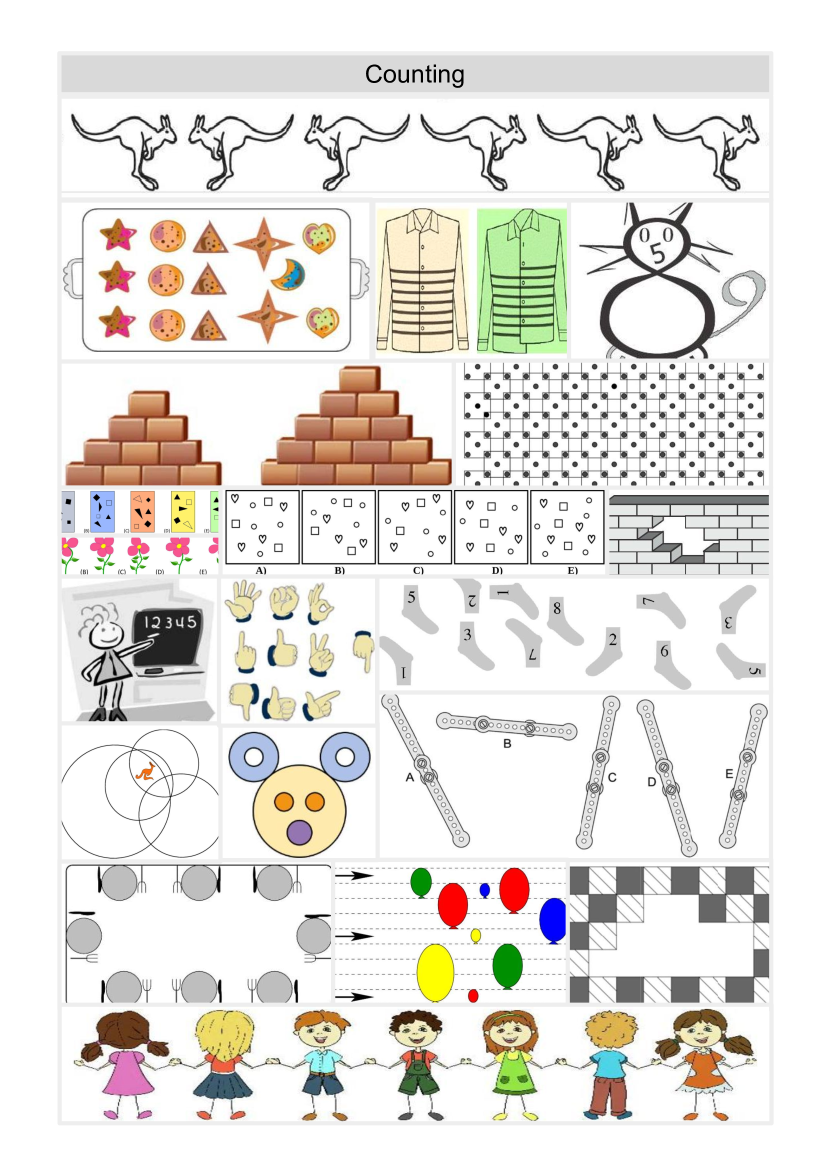
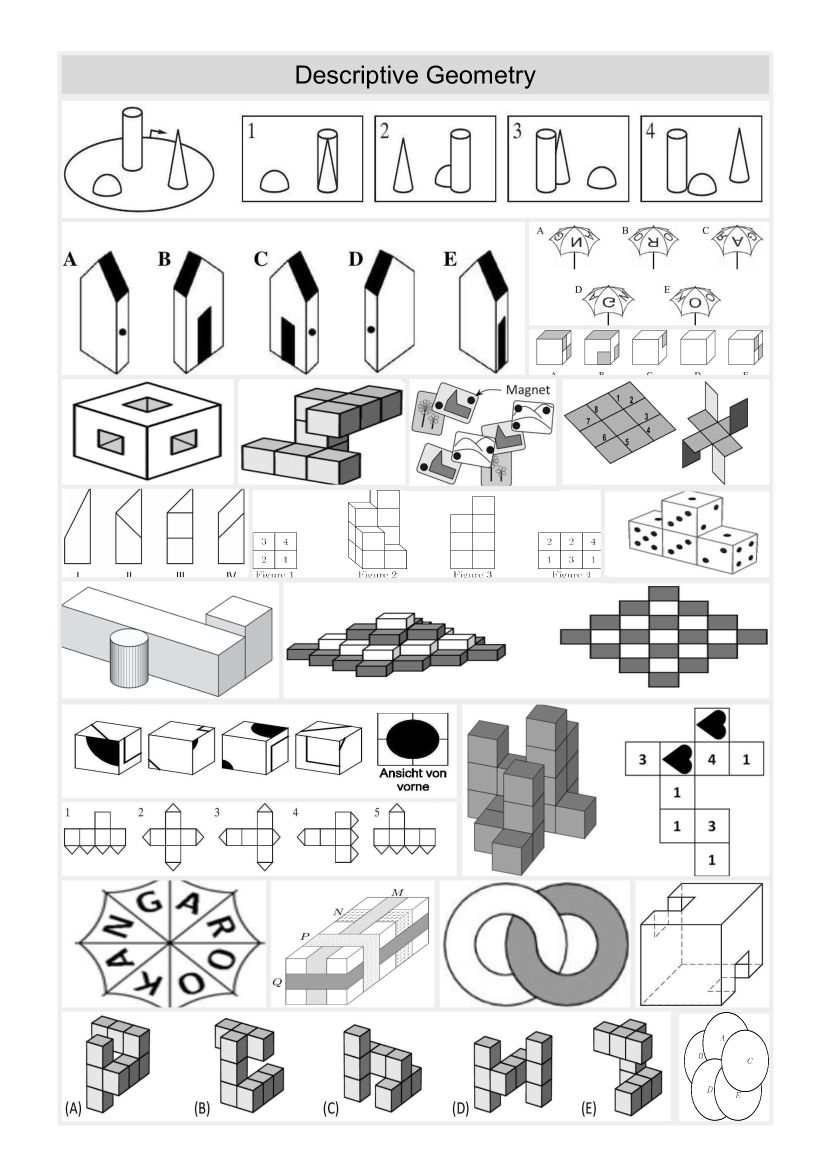
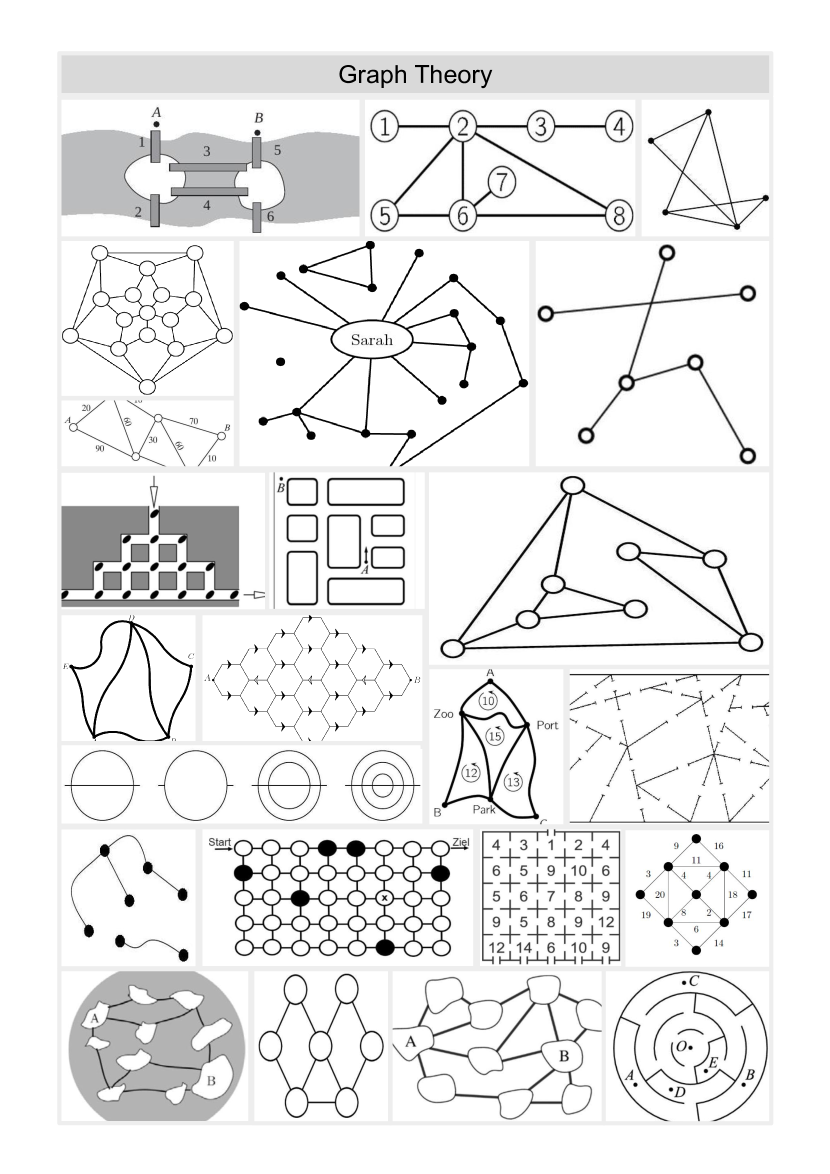
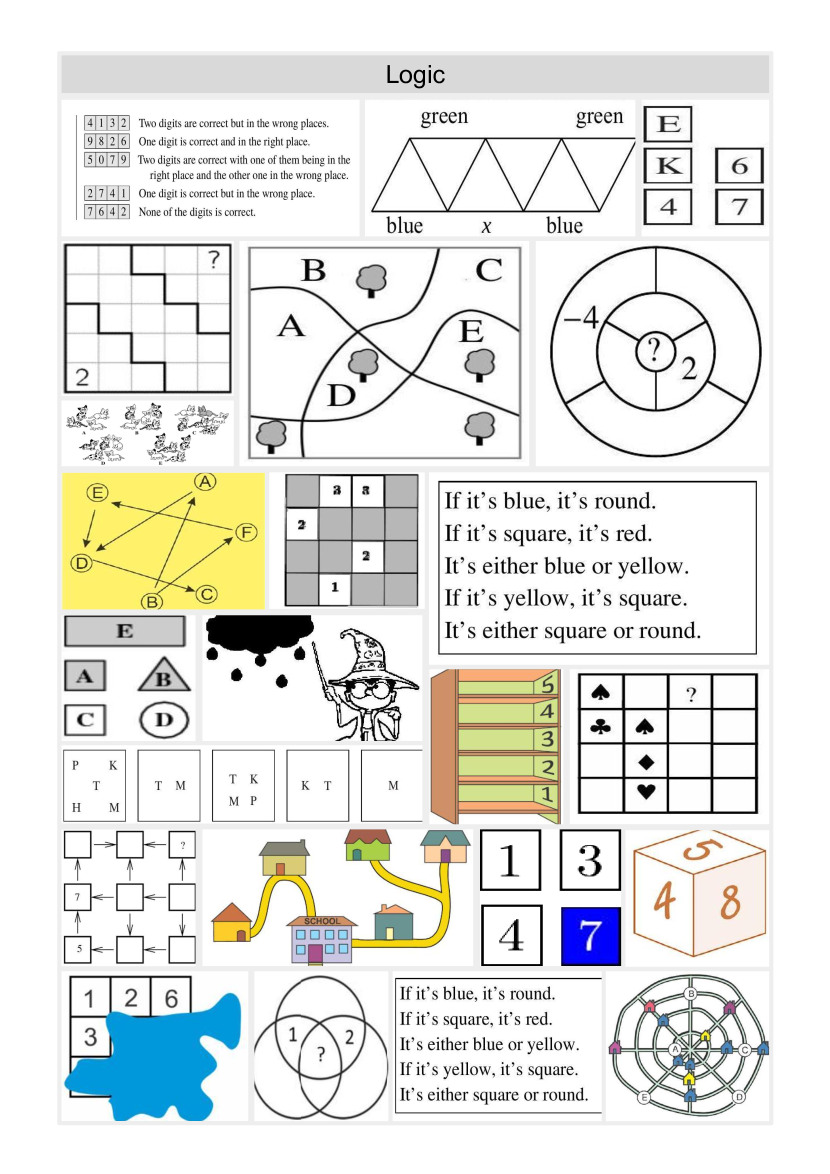
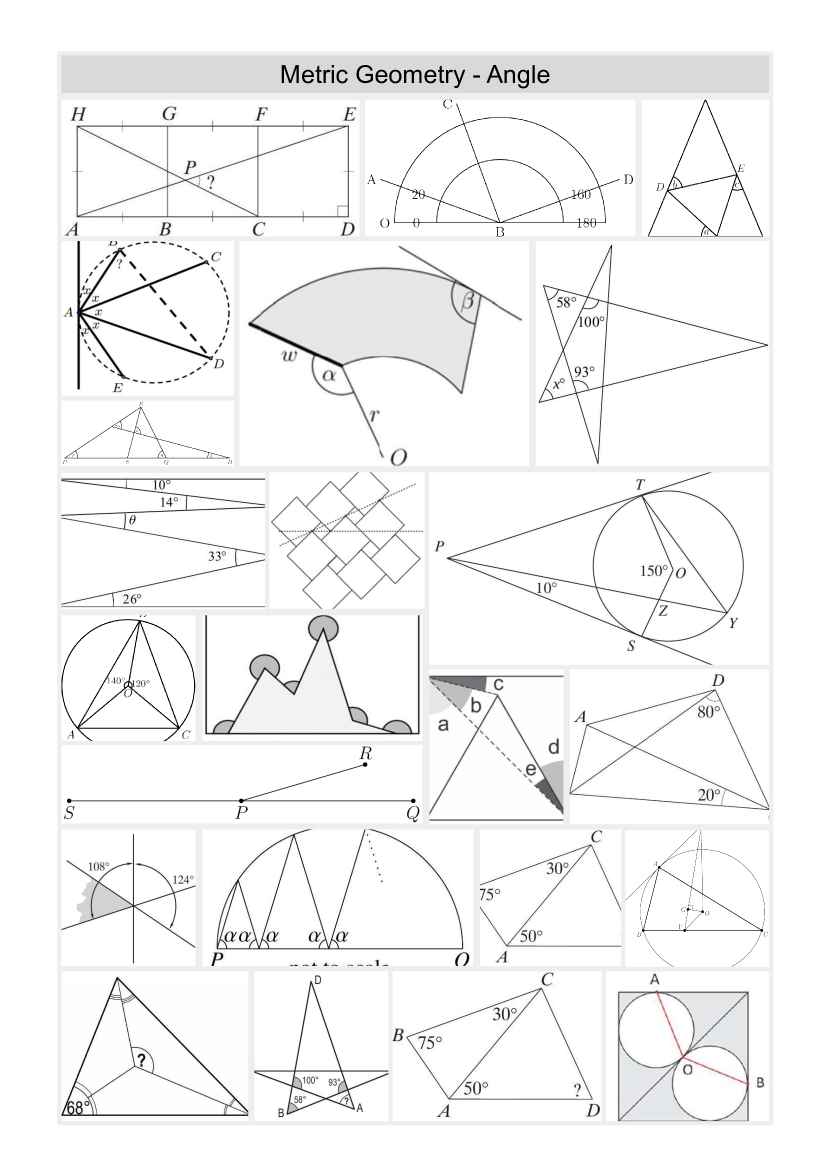
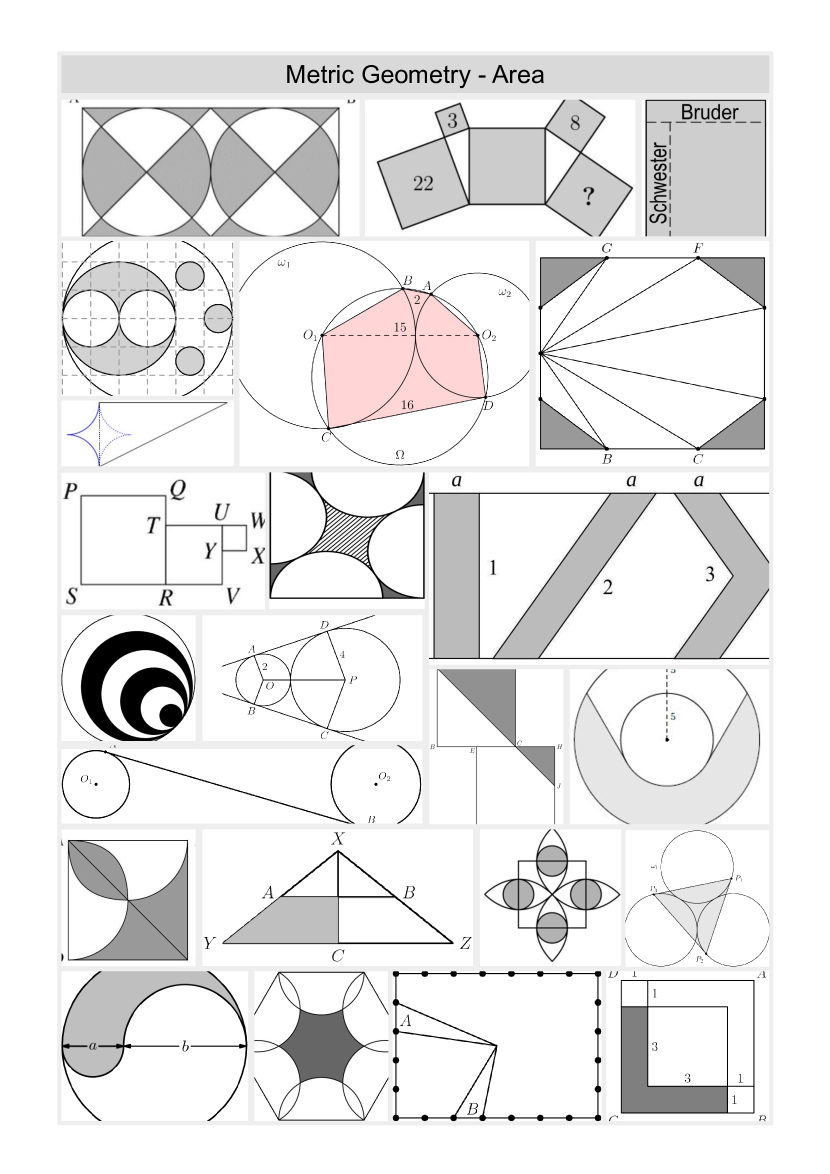
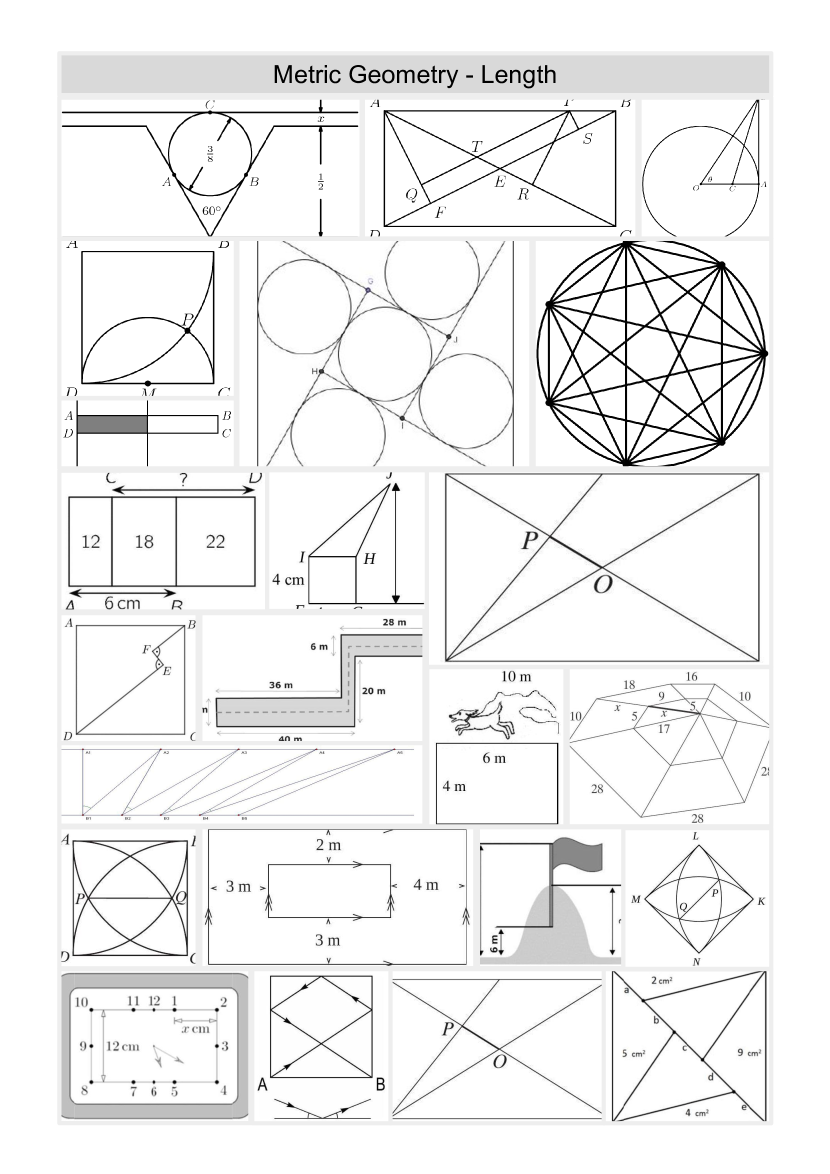
We introduce the MATH-Vision (MATH-V) benchmark, a curated benchmark designed to evaluate the multimodal mathematical reasoning capabilities of foundation models across a wide range of mathematical tasks with visual contexts. We particularly emphasize the challenges posed by the need for both expert-level visual perception and deliberate reasoning with subject-specific knowledge. This challenge is exemplified in our tasks, which require the processing of various heterogeneous image types and necessitate a model’s proficiency in utilizing domain-specific knowledge to deeply comprehend both text and images, and to reason accordingly. This extends far beyond basic visual perception and calls for an advanced approach that combines sophisticated multimodal analysis with mathematical reasoning. The proposed benchmark encompasses 16 subjects over 5 levels of difficulty, including Algebra, Analytic Geometry, Arithmetic, Combinatorial Geometry, Combinatorics, Counting, Descriptive Geometry, Graph Theory, Logic, Metric Geometry, Solid Geometry, Statistics, Topology, and Transformation Geometry. The questions in our benchmark were manually collected from 19 competitions. The division of difficulty levels is primarily based on the recommended grades of these competitions, and details are shown in Appendix D.2.
3.2 Data Collection
Data collection
Our benchmark collection comprises two stages. In the first stage, we gather a list of various mathematical competitions, both international and national. The selection is based on the criterion that visual inputs should be frequently utilized in the competition questions to provide significant insights, and the questions should be categorizable into different levels, such as AMC8, AMC10, AMC12, and AIME. Competitions like the International Mathematical Olympiad (IMO) are excluded due to the excessive difficulty of the questions and the rare use of visual inputs. Consequently, we select 19 competitions from various countries. In the second stage, we filter through online resources to identify problems where questions are interspersed with images. We adhere strictly to copyright and licensing regulations, ensuring that we avoid data from sites that prohibit copying and redistribution. Given the concerns surrounding data contamination in LMMs, we prioritize selecting questions that lack readily available answers, such as those found in separate documents or pages. For questions formatted as PDFs, we use the Mathpix API to extract text and images. This approach allows us to curate a diverse collection of 9,000 questions from various sources, with 3,500 of them accompanied by image context.
Data curation
To improve the quality of our data, we undergo a four-stage data curation process with the help of 10 annotators (senior college students from science-related majors). In the first stage, we verify the alignment of text questions and images, as Mathpix might return them in an incorrect order. We also eliminate questions with missing text or incorrect images and those with private information or offensive content. All results are cross-verified between different annotators. 3,352 math-VQA data are left after this stage. In the second stage, we use lexical overlap and Levenshtein distance to identify potential duplicate questions. These suspected duplicates are then reviewed to identify and remove any duplication. As a result of these steps, we obtain the final 3,040 math-VQA data for our benchmark. In the third stage, we categorize the problems into 16 different subjects. Our annotators are divided into three groups, each independently labeling all the questions, and we also utilized GPT-4V OpenAI (2023b) and Gemini Pro Team (2023a) for subject advice. Annotations from various groups and models are consolidated through a majority voting system involving three expert annotators. In the final stage, we assign difficulty levels with reference to the grade requirements of the original competitions.
3.3 Comparison with Existing Benchmarks
We describe the differences between MATH-V and 2 established benchmarks: MathVista Lu et al. (2023) and MMMU Yue et al. (2023).
Comparing with MathVista
MathVista is a comprehensive multimodal mathematical reasoning benchmark derived from 28 existing math-related multimodal datasets and 3 newly collected ones. However, within MathVista, approximately 20 datasets exhibit a trend where questions are annotated post-image collection by annotators, resulting in a relatively limited variability of questions, as discussed in Sec. 1. In contrast to MathVista, all math-VQA data including both questions and images in MATH-V are newly collected from real math competitions, thus no additional annotation is required. This difference in obtaining question annotations is reflected in the average question length, which stands at 42.3 for MATH-V, significantly surpassing the 15.6 average of MathVista. A longer question length offers numerous advantages, particularly in facilitating richer mathematical reasoning by providing additional context. Further qualitative comparisons of math-VQA data between our dataset and MathVista are provided in Appendix C.1. Moreover, for MATH-V we also provide 18 fine-grained categorizations of different math subjects, which can gain deeper insights into individuals’ strengths and weaknesses in specific areas of mathematics, compared to MathVista’s 7. Finally, all problems within our datasets are labeled with one of the five levels of difficulty, while MathVista has only three levels, with a considerable portion of problems (37.7%) classified under the not applicable category.
Comparing with MMMU
Different from MathVista and our MATH-V , MMMU Yue et al. (2023) is designed to evaluate the multi-discipline multimodal understanding and reasoning abilities of LMMs with college-level problems. In terms of Math, it spans eight distinctive subjects with a total of 500 questions, whereas subjects like Operation Research, Graph Theory, and Group Theory require sophisticated domain knowledge such as "DFS search" and "Cayley diagram". In contrast, our MATH-V focus on mathematics problems from elementary school to high school which contains little domain knowledge and can test the general visual perception and mathematical reasoning abilities of LMMs. Our dataset is 6 times larger than MMMU-Math, providing a significantly larger and more diverse set of challenges for analysis and evaluation. Specific to subjects, our datasets not only offer better coverage of subjects but also have more problems per subject on average (190 v.s. 63). Note that in 3/8 subjects (Linear Algebra, Group Theory, and Logic) covered by MMMU-Math, there are less than 10 problems. More qualitative comparisons can be found in Appendix C.2.
| Model | Overall | Alg | AnaG | Ari | CombG | Comb | Cnt | DescG | GrphT | Log | Angle | Area | Len | SolG | Stat | Topo | TransG |
| Random Chance | 7.17 | 1.5 | 11.9 | 7.1 | 9.7 | 4.8 | 6.0 | 22.1 | 1.1 | 7.6 | 0.6 | 9.4 | 6.7 | 8.2 | 8.6 | 13.0 | 7.1 |
| LLMs (Text Only) | |||||||||||||||||
| GPT4-CoT | 8.16 | 12.8 | 10.7 | 15.7 | 4.9 | 10.7 | 10.5 | 1.9 | 5.6 | 8.4 | 8.1 | 6.2 | 8.7 | 8.6 | 3.5 | 4.4 | 4.8 |
| LLMs (Text + Image Caption) | |||||||||||||||||
| ChatGPT 3.5-CoT | 9.74 | 10.7 | 20.0 | 18.6 | 10.1 | 7.7 | 17.9 | 16.4 | 10.0 | 13.5 | 6.4 | 5.8 | 6.5 | 9.4 | 12.1 | 4.4 | 10.7 |
| GPT 4-CoT | 13.10 | 16.5 | 20.2 | 34.3 | 10.4 | 17.9 | 19.4 | 7.7 | 11.1 | 10.1 | 9.8 | 9.6 | 9.1 | 13.5 | 13.8 | 8.7 | 12.5 |
| Open-source LMMs (Text + Image) | |||||||||||||||||
| LLaVA-v1.5-7B | 8.52 | 7.0 | 7.1 | 10.7 | 7.1 | 4.8 | 10.5 | 7.7 | 10.0 | 9.2 | 15.6 | 10.2 | 9.8 | 5.3 | 8.6 | 4.4 | 4.8 |
| SPHINX (V2) | 9.70 | 6.7 | 7.1 | 12.9 | 7.5 | 7.7 | 6.0 | 9.6 | 16.7 | 10.1 | 11.0 | 11.8 | 12.5 | 8.2 | 8.6 | 8.7 | 6.0 |
| ShareGPT4V-7B | 10.53 | 5.5 | 3.6 | 12.9 | 10.1 | 4.8 | 7.5 | 11.5 | 14.4 | 10.9 | 16.2 | 11.8 | 12.3 | 9.8 | 15.5 | 17.4 | 11.3 |
| LLaVA-v1.5-13B | 11.12 | 7.0 | 14.3 | 14.3 | 9.1 | 6.6 | 6.0 | 13.5 | 5.6 | 13.5 | 10.4 | 12.6 | 14.7 | 11.5 | 13.8 | 13.0 | 10.7 |
| ShareGPT4V-13B | 11.88 | 7.5 | 15.5 | 16.4 | 10.7 | 8.9 | 9.0 | 11.5 | 8.9 | 7.6 | 11.6 | 13.0 | 17.4 | 10.3 | 8.6 | 8.7 | 12.5 |
| SPHINX-MoE | 14.18 | 7.8 | 17.9 | 14.3 | 15.6 | 9.5 | 11.9 | 12.5 | 15.6 | 12.6 | 16.2 | 15.6 | 17.8 | 13.5 | 12.1 | 8.7 | 16.1 |
| InternLM-XComposer2-VL | 14.54 | 9.3 | 15.5 | 12.1 | 15.3 | 11.3 | 10.5 | 14.4 | 22.2 | 19.3 | 19.7 | 15.6 | 15.0 | 11.9 | 15.5 | 26.1 | 15.5 |
| Closed-source LMMs (Text + Image) | |||||||||||||||||
| Qwen-VL-Plus | 10.72 | 11.3 | 17.9 | 14.3 | 12.7 | 4.8 | 10.5 | 15.4 | 8.9 | 14.3 | 11.6 | 6.4 | 10.0 | 14.3 | 6.9 | 8.7 | 11.31 |
| Qwen-VL-Max | 15.59 | 10.7 | 19.1 | 20.0 | 16.9 | 12.5 | 17.9 | 16.4 | 12.2 | 21.0 | 13.3 | 14.2 | 19.8 | 11.5 | 20.7 | 13.0 | 17.3 |
| Gemini Pro | 17.66 | 15.1 | 10.7 | 20.7 | 20.1 | 11.9 | 7.5 | 20.2 | 21.1 | 16.8 | 19.1 | 19.0 | 20.0 | 14.3 | 13.8 | 17.4 | 20.8 |
| GPT4V | 22.76 | 27.3 | 32.1 | 35.7 | 21.1 | 16.7 | 13.4 | 22.1 | 14.4 | 16.8 | 22.0 | 22.2 | 20.9 | 23.8 | 24.1 | 21.7 | 25.6 |
| Human Performance | |||||||||||||||||
| Human (testmini) | 75.66 | 57.9 | 79.0 | 100.0 | 100.0 | 47.4 | 94.7 | 89.5 | 63.2 | 63.2 | 36.8 | 52.6 | 73.7 | 89.5 | 89.5 | 100.0 | 73.7 |
| Model | CoT | Overall | Alg | AnaG | Ari | CombG | Comb | Cnt | DescG | GrphT | Log | Angle | Area | Len | SolG | Stat | Topo | TransG |
| GPT4V | ✗ | 22.76 | 27.3 | 32.1 | 35.7 | 21.1 | 16.7 | 13.4 | 22.1 | 14.4 | 16.8 | 22.0 | 22.2 | 20.9 | 23.8 | 24.1 | 21.7 | 25.6 |
| ✓ | 23.98 | 26.7 | 26.2 | 38.6 | 22.1 | 24.4 | 19.4 | 27.9 | 23.3 | 25.2 | 17.3 | 21.4 | 23.4 | 23.8 | 25.9 | 4.4 | 25.6 | |
| +1.22 | -0.58 | -5.95 | +2.86 | +0.98 | +7.73 | +5.97 | +5.76 | +8.89 | +8.4 | -4.63 | -0.8 | +2.45 | - | -1.72 | -17.39 | - | ||
| Gemini Pro | ✗ | 17.66 | 15.1 | 10.7 | 20.7 | 20.1 | 11.9 | 7.5 | 20.2 | 21.1 | 16.8 | 19.1 | 19.0 | 20.0 | 14.3 | 13.8 | 17.4 | 20.8 |
| ✓ | 14.34 | 13.9 | 19.1 | 27.9 | 14.0 | 9.5 | 11.9 | 18.3 | 14.4 | 14.3 | 15.6 | 13.2 | 13.1 | 10.3 | 12.1 | 13.0 | 17.9 | |
| -3.32 | -1.16 | +8.34 | +7.15 | -6.17 | -2.38 | +4.48 | -1.92 | -6.67 | -2.52 | -3.47 | -5.8 | -6.9 | -4.09 | -1.72 | -4.35 | -2.97 | ||
| Qwen-VL-Max | ✗ | 15.59 | 10.7 | 19.1 | 20.0 | 16.9 | 12.5 | 17.9 | 16.4 | 12.2 | 21.0 | 13.3 | 14.2 | 19.8 | 11.5 | 20.7 | 13.0 | 17.3 |
| ✓ | 12.63 | 10.4 | 22.6 | 20.0 | 12.3 | 5.4 | 13.4 | 19.2 | 13.3 | 18.5 | 12.1 | 10.4 | 12.3 | 10.7 | 19.0 | 8.7 | 14.3 | |
| -2.96 | -0.29 | +3.57 | - | -4.54 | -7.14 | -4.48 | +2.88 | +1.11 | -2.52 | -1.15 | -3.8 | -7.57 | -0.82 | -1.72 | -4.34 | -2.97 | ||
| InternLM-XComposer2-VL | ✗ | 14.54 | 9.3 | 15.5 | 12.1 | 15.3 | 11.3 | 10.5 | 14.4 | 22.2 | 19.3 | 19.7 | 15.6 | 14.9 | 11.9 | 15.5 | 26.1 | 15.5 |
| ✓ | 14.37 | 10.4 | 14.3 | 14.3 | 15.9 | 14.3 | 7.5 | 16.4 | 26.7 | 19.3 | 15.0 | 15.2 | 11.4 | 13.1 | 8.6 | 26.1 | 18.5 | |
| -0.17 | +1.15 | -1.19 | +2.15 | +0.65 | +2.98 | -2.99 | +1.93 | +4.45 | - | -4.62 | -0.4 | -3.56 | +1.22 | -6.9 | - | +2.97 |
4 Experiments
In this section, we conduct experiments to evaluate performance on the MATH-V dataset. Our findings indicate that accuracy remains low across even the most advanced models. We assess a variety of models, including Large Language Models (LLMs) and Large Multimodal Models (LMMs), and compare both closed- and open-source models, observing that closed-source models perform better. We also did a detailed error analysis of the best-performing model GPT-4V, delving into its error distribution and providing corresponding qualitative examples.
4.1 Experimental Setup
Models. We conducted experiments on (a) LLMs: ChatGPT-3.5 Brown et al. (2020) and GPT-4 OpenAI (2023a), augmented with image captions generated by GPT-4V, (b) Open-source LMMs: LLaVA-v1.5 Liu et al. (2023b), SPHINX Lin et al. (2023), ShareGPT-4V Chen et al. (2023) and InternLM-Xcomposer2-VL Dong et al. (2024), (c) Closed-source models: Qwen-VL Bai et al. (2023), Gemini Pro Team (2023a) and GPT-4V OpenAI (2023b).
Implementation details. Our evaluations are carried out in a zero-shot setting, both with and without Chain-of-Thought prompting Wei et al. (2023) on several prominent, to determine the models’ ability to produce accurate answers without the need for fine-tuning or few-shot demonstrations on our benchmark. For human performance, we recruited 30 college or master students, and they were asked to solve the questions in the testmini subset of MATH-V independently, thereby obtaining the human performance baseline. Details can be found in G.3. For other models, we utilize the default prompts provided for multiple-choice or open-ended questions, when available. In cases where models do not offer prompts for the task types present in the MATH-V dataset, we engage in prompt engineering and select the most effective prompt for use in the zero-shot configuration during the main experiments. Detailed information about our prompts is available in the Appendix B.
4.2 Experimental Results
In this section, we compare the performance of several best-performing Large Language Models (LLMs) and Large Multimodal Models (LMMs) on MATH-V, as detailed in Table 2 and Table 3.
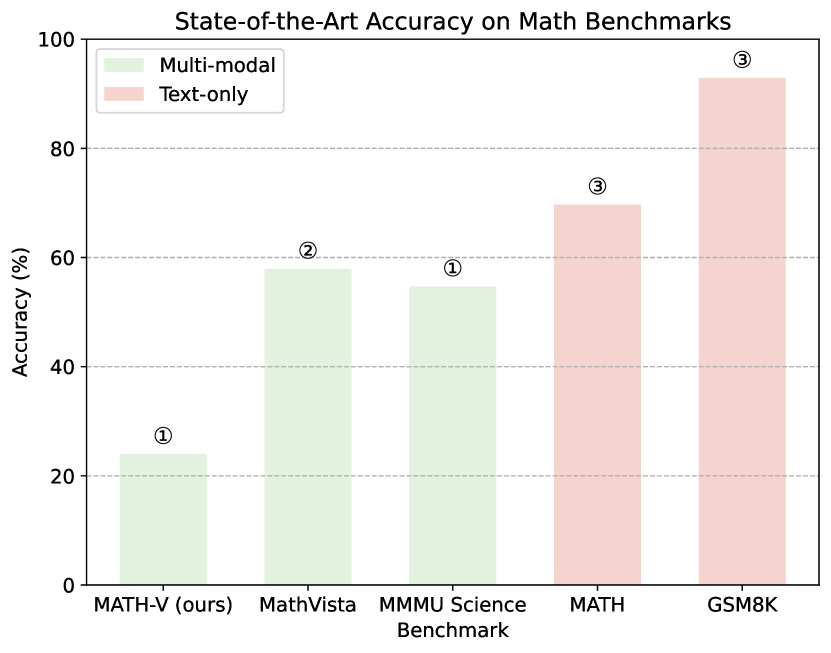
Challenging nature of MATH-V. The data presented in Table 2 highlights the challenging nature of MATH-V. Notably, the overall accuracy for the leading model, GPT-4V, is only 22.76%, which, while being the highest, still indicates a significant challenge in tackling the dataset. The difficulties are further emphasized by the performance of open-source models, all of which register accuracies below 15%. When compared with other benchmarks, as shown in Figure 5, the low accuracy of state-of-the-art models also underscores that MATH-V is challenging. However, the comparison of models’ performance with random chance (7.17% overall) demonstrates the promising potential of Large Language Models (LLMs) in addressing the challenges posed by MATH-V. Even LLaVA-v1.5-7B, an early baseline model not specifically enhanced for mathematical reasoning, surpasses random chance by 1.35%. These results indicate that these models are capable of learning and understanding the underlying mathematical concepts to a certain extent, even if they are not yet able to achieve high accuracy across the board.
Comparison among different subjects. The dataset encompasses a wide range of mathematical subjects, from algebra to transformation geometry, each presenting its own set of complexities. For example, even the best-performing GPT-4V struggles to surpass 15% accuracy in subjects like counting, and Gemini Pro only scores 7.5%. This is in stark contrast to the relatively higher accuracy in arithmetic, where GPT-4V and Gemini Pro reach 35.7% and 20.7%, respectively. Such disparities across subjects and models not only highlight the models’ strengths in numeric calculation and weaknesses in handling specific types of mathematical problems that require more complex vision recognition and reasoning but also underline the diverse and intricate nature of the dataset.
Disparity of closed- and open-source models. A significant performance disparity exists between closed- and open-source models. Closed-source models, such as GPT-4V and Gemini Pro, often outperform their open-source counterparts. For instance, GPT-4V achieved the highest overall accuracy of 22.76%, leading in subjects such as algebra (27.3%), analytic geometry (32.1%), and arithmetic (35.7%). Conversely, the best-performing open-source model, InternLM-XComposer2-VL, attained an overall accuracy of only 14.54%, with its highest subject accuracy in transformation geometry (15.5%). Contrary to these findings, results from MathVista show that the accuracy of InternLM-XComposer2-VL-7B is 7.7% and 12.4% higher than that of GPT-4V and Gemini Pro, respectively. This discrepancy not only highlights the excellent generalization capability of the closed-source state-of-the-art model but also suggests potential issues with data contamination.
Failure of CoT prompting on several models. Chain-of-Thought (CoT) prompting did not consistently enhance performance across models. While GPT-4V benefited from CoT (22.76% 23.98%), other models like Gemini Pro and Qwen-VL-Max saw a decrease in performance when CoT was applied. Gemini Pro’s overall accuracy dropped by 3.32%, and Qwen-VL-Max saw a decrease of 2.96%. This suggests that the step-by-step reasoning capabilities of LMMs are still not mature and cannot be fully exploited by CoT prompting.
4.3 Error Analysis
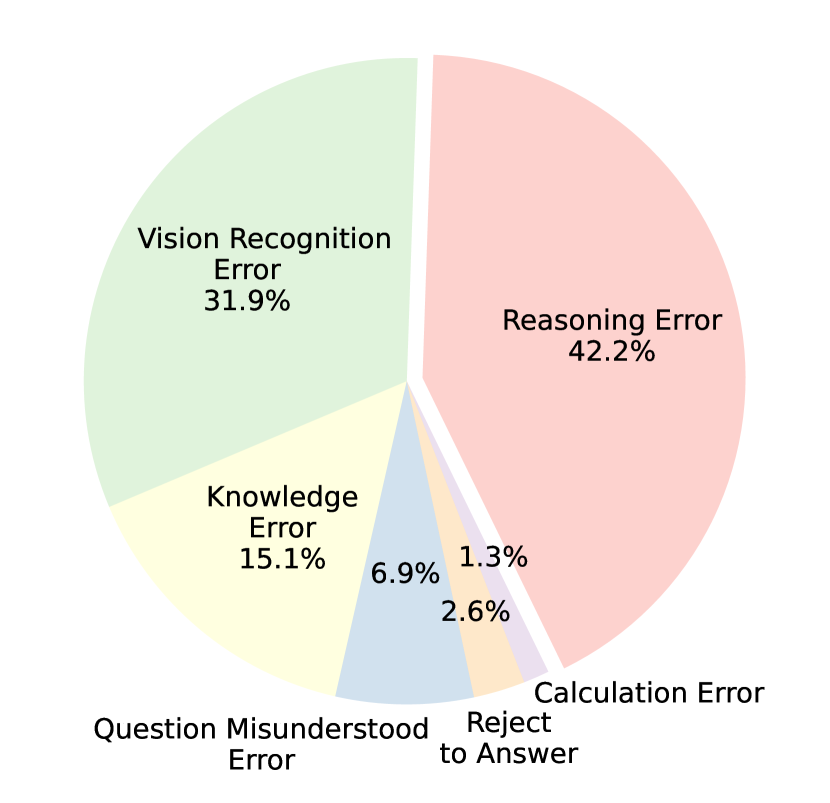
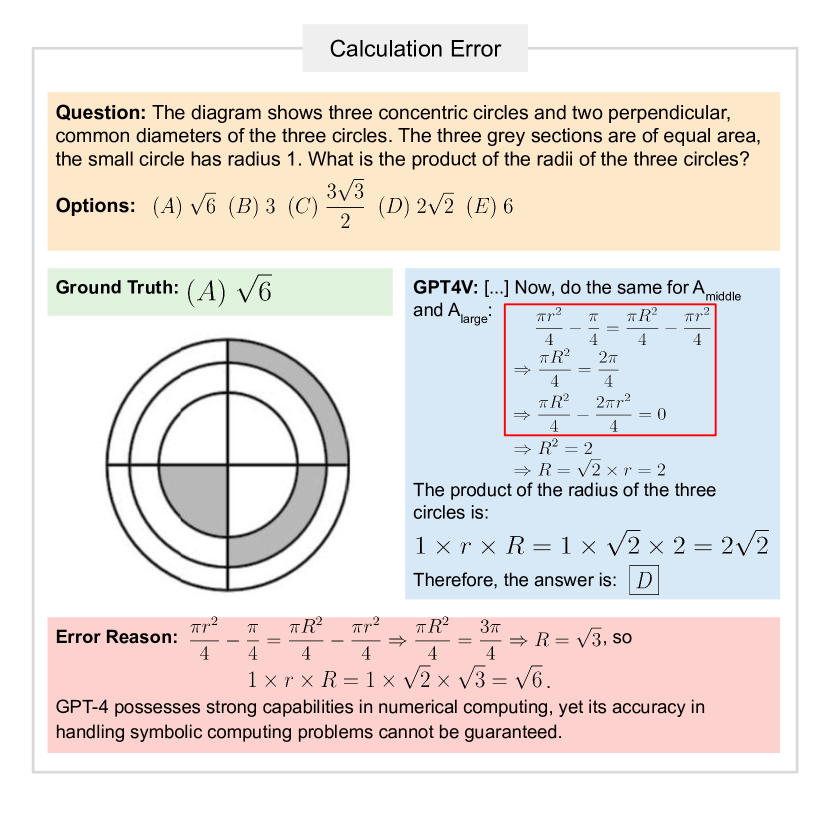
Quantitative and qualitative analysis on GPT-4V. In this section, we meticulously analyzed the causes of errors in GPT-4V through both quantitative and qualitative approaches, detailed in Figure 7 and Figure 7. The most prevalent cause of errors, accounting for 42.2%, was identified as Reasoning Error. This indicates a significant challenge in the model’s logical processing and inferential reasoning capabilities. Following closely, Vision Recognition Error was the second most common issue, responsible for 31.9% of errors. This highlights difficulties in accurately interpreting visual data, suggesting that the vision encoder remains a bottleneck in multi-modal models. Knowledge Error, making up 15.1% of the total errors, pointed to gaps in the model’s information database or its application. Furthermore, Calculation Error accounted for the smallest percentage of errors at 1.3%, indicating that GPT-4V is relatively robust in numerical and computational tasks, which historically have been challenging for language models. Notably, all errors in the Calculation Error category related to symbolic computation, as shown in Figure 7, rather than numerical computation, suggesting a potential area for future improvement. Detailed examples of these errors can be found in Appendix E.
Qualitative analysis on GPT-4 with image captions. The integration of image captions generated by GPT-4V enables GPT-4 to reach a performance level of 13.10, comparable to that of SPHNIX and Qwen-VL. The quality of visual information produced by vision models plays a crucial role in enhancing accurate visual perception, which, in turn, significantly influences the final mathematical reasoning performance. An in-depth examination across 16 mathematical subjects reveals noteworthy insights. In disciplines such as algebra, analytic geometry, arithmetic, combinatorics, and counting, GPT-4 with image captions outperforms all other models except GPT-4V. Conversely, in other subjects, its performance notably lags behind these models. Through qualitative analysis of these categories, we observed that subjects like algebra and analytic geometry are more likely to receive relatively accurate descriptions from GPT-4V, unlike other disciplines. This discrepancy underscores the need for LMMs to enhance their capabilities in fine-grained image understanding and description. Remarkably, in some areas (e.g., combinatorics and counting), GPT-4 with image captions even surpasses GPT-4V. This success can be attributed to the former model’s more detailed image descriptions, which evidently contribute to a better understanding and solving of problems. Examples supporting this qualitative analysis are provided in the Appendix F.
5 Conclusion
In this paper, we propose a benchmark dataset, called MATH-V, for evaluating the mathematical reasoning abilities of multimodal models. MATH-V consists of 3,040 challenging math reasoning problems, each accompanied by images and texts. We have carefully evaluated a variety of open-source and closed-source models using our MATH-V and conducted a systematic analysis. Our benchmark reveals a significant gap between human performance and that of current multimodal models in the task of multimodal reasoning, and facilitates more effective evaluation for future studies in this field.
6 Limitations
The problems in our benchmarks are all in English. We did not include problems in other languages; therefore, the dataset cannot evaluate models’ abilities to reason in languages other than English. Another limitation is that we only included math problems and did not collect multimodal reasoning problems in other subjects, such as physics and chemistry. Also, the images in our benchmark are all abstract, with no pictures taken in real life. These limitations are important and warrant further investigation.
7 Ethics statement
All questions of MATH-V are from publicly available sources. Although we do not commercialize MATH-V, we should like to demonstrate that we are far from the boundary for action or infringement.
Legal compliance. MATH-V problems are created by the the Mathematical Association of America (MAA), Kangaroo of Mathematics in Austria (KMA) and United Kingdom Maths Trust (UKMT). For decades, the MAA has not protected its problem IP even from separate organizations which sell MAA problems, such as AoPS. Courts have ruled that this implies the IP rights are permanently forfeited. Both of the KMA and UKMT are leading charities that advances the education of young people in mathematics, and MATH-V only contains free test questions published on their official website.
For MATH-V, we abide by Fair Use §107: “the fair use of a copyrighted work, including such use by scholarship, or research, is not an infringement of copyright”, where fair use is determined by “the purpose and character of the use, including whether such use is of a commercial nature or is for nonprofit educational purposes” and “the effect of the use upon the potential market for or value of the copyrighted work.”
Dataset intended usage and license. We document the MATH-V dataset within the paper and note that the MATH-V and code for results reproduction will be publicly available. The MATH-V dataset is not supposed, though the risk exists, to be used to train models for cheating. We intend for researchers to use this dataset to better evaluate LMMs’ mathematical reasoning capabilities and consequently facilitate future studies in this area. We bear all responsibility in case of violation of rights. The MATH-V data and our open-source code are under an MIT license.
References
- Agrawal et al. (2015) Aishwarya Agrawal, Jiasen Lu, Stanislaw Antol, Margaret Mitchell, C. Lawrence Zitnick, Devi Parikh, and Dhruv Batra. 2015. Vqa: Visual question answering. International Journal of Computer Vision, 123:4 – 31.
- Almazrouei et al. (2023) Ebtesam Almazrouei, Hamza Alobeidli, Abdulaziz Alshamsi, Alessandro Cappelli, Ruxandra Cojocaru, Mérouane Debbah, Étienne Goffinet, Daniel Hesslow, Julien Launay, Quentin Malartic, Daniele Mazzotta, Badreddine Noune, Baptiste Pannier, and Guilherme Penedo. 2023. The falcon series of open language models.
- Amini et al. (2019) Aida Amini, Saadia Gabriel, Shanchuan Lin, Rik Koncel-Kedziorski, Yejin Choi, and Hannaneh Hajishirzi. 2019. Mathqa: Towards interpretable math word problem solving with operation-based formalisms. ArXiv, abs/1905.13319.
- Anil et al. (2023a) Rohan Anil, Andrew M. Dai, Orhan Firat, Melvin Johnson, Dmitry Lepikhin, Alexandre Passos, Siamak Shakeri, Emanuel Taropa, Paige Bailey, Zhifeng Chen, Eric Chu, Jonathan H. Clark, Laurent El Shafey, Yanping Huang, Kathy Meier-Hellstern, Gaurav Mishra, Erica Moreira, Mark Omernick, Kevin Robinson, Sebastian Ruder, Yi Tay, Kefan Xiao, Yuanzhong Xu, Yujing Zhang, Gustavo Hernandez Abrego, Junwhan Ahn, Jacob Austin, Paul Barham, Jan Botha, James Bradbury, Siddhartha Brahma, Kevin Brooks, Michele Catasta, Yong Cheng, Colin Cherry, Christopher A. Choquette-Choo, Aakanksha Chowdhery, Clément Crepy, Shachi Dave, Mostafa Dehghani, Sunipa Dev, Jacob Devlin, Mark Díaz, Nan Du, Ethan Dyer, Vlad Feinberg, Fangxiaoyu Feng, Vlad Fienber, Markus Freitag, Xavier Garcia, Sebastian Gehrmann, Lucas Gonzalez, Guy Gur-Ari, Steven Hand, Hadi Hashemi, Le Hou, Joshua Howland, Andrea Hu, Jeffrey Hui, Jeremy Hurwitz, Michael Isard, Abe Ittycheriah, Matthew Jagielski, Wenhao Jia, Kathleen Kenealy, Maxim Krikun, Sneha Kudugunta, Chang Lan, Katherine Lee, Benjamin Lee, Eric Li, Music Li, Wei Li, YaGuang Li, Jian Li, Hyeontaek Lim, Hanzhao Lin, Zhongtao Liu, Frederick Liu, Marcello Maggioni, Aroma Mahendru, Joshua Maynez, Vedant Misra, Maysam Moussalem, Zachary Nado, John Nham, Eric Ni, Andrew Nystrom, Alicia Parrish, Marie Pellat, Martin Polacek, Alex Polozov, Reiner Pope, Siyuan Qiao, Emily Reif, Bryan Richter, Parker Riley, Alex Castro Ros, Aurko Roy, Brennan Saeta, Rajkumar Samuel, Renee Shelby, Ambrose Slone, Daniel Smilkov, David R. So, Daniel Sohn, Simon Tokumine, Dasha Valter, Vijay Vasudevan, Kiran Vodrahalli, Xuezhi Wang, Pidong Wang, Zirui Wang, Tao Wang, John Wieting, Yuhuai Wu, Kelvin Xu, Yunhan Xu, Linting Xue, Pengcheng Yin, Jiahui Yu, Qiao Zhang, Steven Zheng, Ce Zheng, Weikang Zhou, Denny Zhou, Slav Petrov, and Yonghui Wu. 2023a. Palm 2 technical report.
- Anil et al. (2023b) Rohan Anil, Andrew M Dai, Orhan Firat, Melvin Johnson, Dmitry Lepikhin, Alexandre Passos, Siamak Shakeri, Emanuel Taropa, Paige Bailey, Zhifeng Chen, et al. 2023b. Palm 2 technical report. arXiv preprint arXiv:2305.10403.
- Azerbayev et al. (2023) Zhangir Azerbayev, Hailey Schoelkopf, Keiran Paster, Marco Dos Santos, Stephen McAleer, Albert Q. Jiang, Jia Deng, Stella Biderman, and Sean Welleck. 2023. Llemma: An open language model for mathematics.
- Bai et al. (2023) Jinze Bai, Shuai Bai, Shusheng Yang, Shijie Wang, Sinan Tan, Peng Wang, Junyang Lin, Chang Zhou, and Jingren Zhou. 2023. Qwen-vl: A versatile vision-language model for understanding, localization, text reading, and beyond.
- Brown et al. (2020) Tom Brown, Benjamin Mann, Nick Ryder, Melanie Subbiah, Jared D Kaplan, Prafulla Dhariwal, Arvind Neelakantan, Pranav Shyam, Girish Sastry, Amanda Askell, et al. 2020. Language models are few-shot learners. Advances in neural information processing systems, 33:1877–1901.
- Chen et al. (2021) Jiaqi Chen, Jianheng Tang, Jinghui Qin, Xiaodan Liang, Lingbo Liu, Eric P. Xing, and Liang Lin. 2021. Geoqa: A geometric question answering benchmark towards multimodal numerical reasoning. ArXiv, abs/2105.14517.
- Chen et al. (2023) Lin Chen, Jisong Li, Xiaoyi Dong, Pan Zhang, Conghui He, Jiaqi Wang, Feng Zhao, and Dahua Lin. 2023. Sharegpt4v: Improving large multi-modal models with better captions. arXiv preprint arXiv:2311.12793.
- Cui et al. (2024) Can Cui, Yunsheng Ma, Xu Cao, Wenqian Ye, Yang Zhou, Kaizhao Liang, Jintai Chen, Juanwu Lu, Zichong Yang, Kuei-Da Liao, et al. 2024. A survey on multimodal large language models for autonomous driving. In Proceedings of the IEEE/CVF Winter Conference on Applications of Computer Vision, pages 958–979.
- Dong et al. (2024) Xiaoyi Dong, Pan Zhang, Yuhang Zang, Yuhang Cao, Bin Wang, Linke Ouyang, Xilin Wei, Songyang Zhang, Haodong Duan, Maosong Cao, Wenwei Zhang, Yining Li, Hang Yan, Yang Gao, Xinyue Zhang, Wei Li, Jingwen Li, Kai Chen, Conghui He, Xingcheng Zhang, Yu Qiao, Dahua Lin, and Jiaqi Wang. 2024. Internlm-xcomposer2: Mastering free-form text-image composition and comprehension in vision-language large model. arXiv preprint arXiv:2401.16420.
- Gao et al. (2023) Jiahui Gao, Renjie Pi, Jipeng Zhang, Jiacheng Ye, Wanjun Zhong, Yufei Wang, Lanqing Hong, Jianhua Han, Hang Xu, Zhenguo Li, and Lingpeng Kong. 2023. G-llava: Solving geometric problem with multi-modal large language model. ArXiv, abs/2312.11370.
- Goyal et al. (2017) Yash Goyal, Tejas Khot, Douglas Summers-Stay, Dhruv Batra, and Devi Parikh. 2017. Making the v in vqa matter: Elevating the role of image understanding in visual question answering.
- Gurari et al. (2018) Danna Gurari, Qing Li, Abigale Stangl, Anhong Guo, Chi Lin, Kristen Grauman, Jiebo Luo, and Jeffrey P. Bigham. 2018. Vizwiz grand challenge: Answering visual questions from blind people. 2018 IEEE/CVF Conference on Computer Vision and Pattern Recognition, pages 3608–3617.
- Hendrycks et al. (2020) Dan Hendrycks, Collin Burns, Steven Basart, Andy Zou, Mantas Mazeika, Dawn Xiaodong Song, and Jacob Steinhardt. 2020. Measuring massive multitask language understanding. ArXiv, abs/2009.03300.
- Hendrycks et al. (2021) Dan Hendrycks, Collin Burns, Saurav Kadavath, Akul Arora, Steven Basart, Eric Tang, Dawn Song, and Jacob Steinhardt. 2021. Measuring mathematical problem solving with the math dataset. arXiv preprint arXiv:2103.03874.
- Huang et al. (2023) Yupan Huang, Zaiqiao Meng, Fangyu Liu, Yixuan Su, Nigel Collier, and Yutong Lu. 2023. Sparkles: Unlocking chats across multiple images for multimodal instruction-following models.
- Liang et al. (2023) Zhenwen Liang, Tianyu Yang, Jipeng Zhang, and Xiangliang Zhang. 2023. Unimath: A foundational and multimodal mathematical reasoner. In Conference on Empirical Methods in Natural Language Processing.
- Lin et al. (2023) Ziyi Lin, Chris Liu, Renrui Zhang, Peng Gao, Longtian Qiu, Han Xiao, Han Qiu, Chen Lin, Wenqi Shao, Keqin Chen, Jiaming Han, Siyuan Huang, Yichi Zhang, Xuming He, Hongsheng Li, and Yu Qiao. 2023. Sphinx: The joint mixing of weights, tasks, and visual embeddings for multi-modal large language models.
- Liu et al. (2022) Fangyu Liu, Francesco Piccinno, Syrine Krichene, Chenxi Pang, Kenton Lee, Mandar Joshi, Yasemin Altun, Nigel Collier, and Julian Martin Eisenschlos. 2022. Matcha: Enhancing visual language pretraining with math reasoning and chart derendering. In Annual Meeting of the Association for Computational Linguistics.
- Liu et al. (2023a) Haotian Liu, Chunyuan Li, Yuheng Li, and Yong Jae Lee. 2023a. Improved baselines with visual instruction tuning.
- Liu et al. (2023b) Haotian Liu, Chunyuan Li, Qingyang Wu, and Yong Jae Lee. 2023b. Visual instruction tuning.
- Lu et al. (2023) Pan Lu, Hritik Bansal, Tony Xia, Jiacheng Liu, Chun yue Li, Hannaneh Hajishirzi, Hao Cheng, Kai-Wei Chang, Michel Galley, and Jianfeng Gao. 2023. Mathvista: Evaluating math reasoning in visual contexts with gpt-4v, bard, and other large multimodal models. ArXiv, abs/2310.02255.
- Lu et al. (2021) Pan Lu, Ran Gong, Shibiao Jiang, Liang Qiu, Siyuan Huang, Xiaodan Liang, and Song-Chun Zhu. 2021. Inter-gps: Interpretable geometry problem solving with formal language and symbolic reasoning. In Annual Meeting of the Association for Computational Linguistics.
- Masry et al. (2022) Ahmed Masry, Xuan Long Do, Jia Qing Tan, Shafiq R. Joty, and Enamul Hoque. 2022. Chartqa: A benchmark for question answering about charts with visual and logical reasoning. ArXiv, abs/2203.10244.
- Masry et al. (2023) Ahmed Masry, Parsa Kavehzadeh, Xuan Long Do, Enamul Hoque, and Shafiq R. Joty. 2023. Unichart: A universal vision-language pretrained model for chart comprehension and reasoning. ArXiv, abs/2305.14761.
- Mobasher et al. (2022) Shaghayegh Mobasher, Ghazal Zamaninejad, Maryam Hashemi, Melika Nobakhtian, and Sauleh Eetemadi. 2022. Parsvqa-caps: A benchmark for visual question answering and image captioning in persian. In The 2022 Conference on Empirical Methods in Natural Language Processing.
- OpenAI (2023a) OpenAI. 2023a. Gpt-4 technical report.
- OpenAI (2023b) OpenAI. 2023b. Gpt-4v(ision) system card. In technical report.
- Rozière et al. (2024) Baptiste Rozière, Jonas Gehring, Fabian Gloeckle, Sten Sootla, Itai Gat, Xiaoqing Ellen Tan, Yossi Adi, Jingyu Liu, Romain Sauvestre, Tal Remez, Jérémy Rapin, Artyom Kozhevnikov, Ivan Evtimov, Joanna Bitton, Manish Bhatt, Cristian Canton Ferrer, Aaron Grattafiori, Wenhan Xiong, Alexandre Défossez, Jade Copet, Faisal Azhar, Hugo Touvron, Louis Martin, Nicolas Usunier, Thomas Scialom, and Gabriel Synnaeve. 2024. Code llama: Open foundation models for code.
- Team (2023a) Gemini Team. 2023a. Gemini: A family of highly capable multimodal models.
- Team (2023b) InternLM Team. 2023b. Internlm: A multilingual language model with progressively enhanced capabilities. https://github.com/InternLM/InternLM-techreport.
- Touvron et al. (2023) Hugo Touvron, Louis Martin, Kevin Stone, Peter Albert, Amjad Almahairi, Yasmine Babaei, Nikolay Bashlykov, Soumya Batra, Prajjwal Bhargava, Shruti Bhosale, Dan Bikel, Lukas Blecher, Cristian Canton Ferrer, Moya Chen, Guillem Cucurull, David Esiobu, Jude Fernandes, Jeremy Fu, Wenyin Fu, Brian Fuller, Cynthia Gao, Vedanuj Goswami, Naman Goyal, Anthony Hartshorn, Saghar Hosseini, Rui Hou, Hakan Inan, Marcin Kardas, Viktor Kerkez, Madian Khabsa, Isabel Kloumann, Artem Korenev, Punit Singh Koura, Marie-Anne Lachaux, Thibaut Lavril, Jenya Lee, Diana Liskovich, Yinghai Lu, Yuning Mao, Xavier Martinet, Todor Mihaylov, Pushkar Mishra, Igor Molybog, Yixin Nie, Andrew Poulton, Jeremy Reizenstein, Rashi Rungta, Kalyan Saladi, Alan Schelten, Ruan Silva, Eric Michael Smith, Ranjan Subramanian, Xiaoqing Ellen Tan, Binh Tang, Ross Taylor, Adina Williams, Jian Xiang Kuan, Puxin Xu, Zheng Yan, Iliyan Zarov, Yuchen Zhang, Angela Fan, Melanie Kambadur, Sharan Narang, Aurelien Rodriguez, Robert Stojnic, Sergey Edunov, and Thomas Scialom. 2023. Llama 2: Open foundation and fine-tuned chat models.
- Trinh et al. (2024) Trieu H. Trinh, Yuhuai Wu, Quoc V. Le, He He, and Thang Luong. 2024. Solving olympiad geometry without human demonstrations. Nature, 625:476–482.
- Wang et al. (2024) Ke Wang, Houxing Ren, Aojun Zhou, Zimu Lu, Sichun Luo, Weikang Shi, Renrui Zhang, Linqi Song, Mingjie Zhan, and Hongsheng Li. 2024. Mathcoder: Seamless code integration in llms for enhanced mathematical reasoning. In The Twelfth International Conference on Learning Representations.
- Wei et al. (2023) Jason Wei, Xuezhi Wang, Dale Schuurmans, Maarten Bosma, Brian Ichter, Fei Xia, Ed Chi, Quoc Le, and Denny Zhou. 2023. Chain-of-thought prompting elicits reasoning in large language models.
- Yang et al. (2023) Zhenjie Yang, Xiaosong Jia, Hongyang Li, and Junchi Yan. 2023. Llm4drive: A survey of large language models for autonomous driving.
- Yue et al. (2023) Xiang Yue, Yuansheng Ni, Kai Zhang, Tianyu Zheng, Ruoqi Liu, Ge Zhang, Samuel Stevens, Dongfu Jiang, Weiming Ren, Yuxuan Sun, Cong Wei, Botao Yu, Ruibin Yuan, Renliang Sun, Ming Yin, Boyuan Zheng, Zhenzhu Yang, Yibo Liu, Wenhao Huang, Huan Sun, Yu Su, and Wenhu Chen. 2023. Mmmu: A massive multi-discipline multimodal understanding and reasoning benchmark for expert agi. ArXiv, abs/2311.16502.
- Zhang et al. (2023a) Ao Zhang, Yuan Yao, Wei Ji, Zhiyuan Liu, and Tat-Seng Chua. 2023a. Next-chat: An lmm for chat, detection and segmentation.
- Zhang et al. (2023b) Jingyi Zhang, Jiaxing Huang, Sheng Jin, and Shijian Lu. 2023b. Vision-language models for vision tasks: A survey.
- Zhang et al. (2023c) Pan Zhang, Xiaoyi Dong, Bin Wang, Yuhang Cao, Chao Xu, Linke Ouyang, Zhiyuan Zhao, Shuangrui Ding, Songyang Zhang, Haodong Duan, Wenwei Zhang, Hang Yan, Xinyue Zhang, Wei Li, Jingwen Li, Kai Chen, Conghui He, Xingcheng Zhang, Yu Qiao, Dahua Lin, and Jiaqi Wang. 2023c. Internlm-xcomposer: A vision-language large model for advanced text-image comprehension and composition. arXiv preprint arXiv:2309.15112.
- Zhang et al. (2023d) Renrui Zhang, Jiaming Han, Chris Liu, Peng Gao, Aojun Zhou, Xiangfei Hu, Shilin Yan, Pan Lu, Hongsheng Li, and Yu Qiao. 2023d. Llama-adapter: Efficient fine-tuning of language models with zero-init attention.
- Zhao et al. (2023) Wayne Xin Zhao, Kun Zhou, Junyi Li, Tianyi Tang, Xiaolei Wang, Yupeng Hou, Yingqian Min, Beichen Zhang, Junjie Zhang, Zican Dong, Yifan Du, Chen Yang, Yushuo Chen, Zhipeng Chen, Jinhao Jiang, Ruiyang Ren, Yifan Li, Xinyu Tang, Zikang Liu, Peiyu Liu, Jian-Yun Nie, and Ji-Rong Wen. 2023. A survey of large language models.
- Zhou et al. (2024) Aojun Zhou, Ke Wang, Zimu Lu, Weikang Shi, Sichun Luo, Zipeng Qin, Shaoqing Lu, Anya Jia, Linqi Song, Mingjie Zhan, and Hongsheng Li. 2024. Solving challenging math word problems using gpt-4 code interpreter with code-based self-verification. In The Twelfth International Conference on Learning Representations.
- Zhu et al. (2023) Deyao Zhu, Jun Chen, Xiaoqian Shen, Xiang Li, and Mohamed Elhoseiny. 2023. Minigpt-4: Enhancing vision-language understanding with advanced large language models. arXiv preprint arXiv:2304.10592.
Appendix
Appendix A Testmini
| Model | Overall | Alg | AnaG | Ari | CombG | Comb | Cnt | DescG | GrphT | Log | Angle | Area | Len | SolG | Stat | Topo | TransG |
| Random Chance | 7.17 | 1.5 | 11.9 | 7.1 | 9.7 | 4.8 | 6.0 | 22.1 | 1.1 | 7.6 | 0.6 | 9.4 | 6.7 | 8.2 | 8.6 | 13.0 | 7.1 |
| Testmini | 9.87 | 0.0 | 15.8 | 10.5 | 15.7 | 0.0 | 0.0 | 36.84 | 0.0 | 15.8 | 0.0 | 10.5 | 21.1 | 5.3 | 10.5 | 15.8 | 0.0 |
| +2.7 | -1.5 | +3.9 | +3.4 | +6.0 | -4.8 | -6.0 | +14.74 | -1.1 | +8.2 | -0.6 | +1.1 | +14.4 | -2.9 | +1.9 | +2.8 | -7.1 | |
| LLMs (Text Only) | |||||||||||||||||
| GPT4-CoT | 8.16 | 12.8 | 10.7 | 15.7 | 4.9 | 10.7 | 10.5 | 1.9 | 5.6 | 8.4 | 8.1 | 6.2 | 8.7 | 8.6 | 3.5 | 4.4 | 4.8 |
| Testmini | 6.58 | 5.3 | 10.5 | 15.8 | 0.0 | 21.1 | 10.5 | 5.3 | 0.0 | 5.3 | 10.5 | 5.3 | 0.0 | 5.3 | 5.3 | 5.3 | 0.0 |
| -1.58 | -7.5 | -0.2 | +0.1 | -4.9 | +10.4 | 0.0 | +3.4 | -5.6 | -3.1 | +2.4 | -0.9 | -8.7 | -3.3 | +1.8 | +0.9 | -4.8 | |
| LLMs (Text + Image Caption) | |||||||||||||||||
| ChatGPT 3.5-CoT | 9.74 | 10.7 | 20.0 | 18.6 | 10.1 | 7.7 | 17.9 | 16.4 | 10.0 | 13.5 | 6.4 | 5.8 | 6.5 | 9.4 | 12.1 | 4.4 | 10.7 |
| Testmini | 10.20 | 10.5 | 26.3 | 5.3 | 0.0 | 10.5 | 21.1 | 15.8 | 10.5 | 0.0 | 10.5 | 0.0 | 5.3 | 21.1 | 5.3 | 10.5 | 5.3 |
| +0.46 | -0.2 | +6.3 | -13.3 | -10.1 | +2.8 | +3.2 | -0.6 | +0.5 | -13.5 | +4.1 | -5.8 | -1.2 | +11.7 | -6.8 | +6.1 | -5.4 | |
| GPT 4-CoT | 13.10 | 16.5 | 20.2 | 34.3 | 10.4 | 17.9 | 19.4 | 7.7 | 11.1 | 10.1 | 9.8 | 9.6 | 9.1 | 13.5 | 13.8 | 8.7 | 12.5 |
| Testmini | 12.50 | 15.8 | 10.5 | 31.6 | 5.3 | 15.8 | 31.6 | 10.5 | 15.8 | 15.8 | 0.0 | 5.3 | 5.3 | 0.0 | 21.1 | 10.5 | 5.3 |
| -0.6 | -0.7 | -9.7 | -2.7 | -5.1 | -2.1 | +12.2 | +2.8 | +4.7 | +5.7 | -9.8 | -4.3 | -3.8 | -13.5 | +7.3 | +1.8 | -7.2 | |
| Open-source LMMs (Text + Image) | |||||||||||||||||
| LLaVA-v1.5-7B | 8.52 | 7.0 | 7.1 | 10.7 | 7.1 | 4.8 | 10.5 | 7.7 | 10.0 | 9.2 | 15.6 | 10.2 | 9.8 | 5.3 | 8.6 | 4.4 | 4.8 |
| Testmini | 10.20 | 0.0 | 10.5 | 15.8 | 5.3 | 5.3 | 15.8 | 10.5 | 10.5 | 15.8 | 21.1 | 15.8 | 15.8 | 5.3 | 10.5 | 0.0 | 5.3 |
| +1.68 | -7.0 | +3.4 | +5.1 | -1.8 | +0.5 | +5.3 | +2.8 | +0.5 | +6.6 | +5.5 | +5.6 | +6.0 | 0.0 | +1.9 | -4.4 | +0.5 | |
| SPHINX (V2) | 9.70 | 6.7 | 7.1 | 12.9 | 7.5 | 7.7 | 6.0 | 9.6 | 16.7 | 10.1 | 11.0 | 11.8 | 12.5 | 8.2 | 8.6 | 8.7 | 6.0 |
| Testmini | 9.21 | 5.3 | 10.5 | 10.5 | 0.0 | 21.1 | 10.5 | 10.5 | 15.8 | 10.5 | 15.8 | 5.3 | 10.5 | 0.0 | 5.3 | 5.3 | 10.5 |
| -0.49 | -1.4 | +3.4 | -2.4 | -7.5 | +13.4 | +4.5 | +0.9 | -0.9 | +0.4 | +4.8 | -6.5 | -2.0 | -8.2 | -3.3 | -3.4 | +4.5 | |
| ShareGPT4V-7B | 10.53 | 5.5 | 3.6 | 12.9 | 10.1 | 4.8 | 7.5 | 11.5 | 14.4 | 10.9 | 16.2 | 11.8 | 12.3 | 9.8 | 15.5 | 17.4 | 11.3 |
| Testmini | 12.50 | 5.3 | 0.0 | 10.5 | 21.1 | 5.3 | 5.3 | 26.3 | 15.8 | 15.8 | 15.8 | 10.5 | 21.1 | 15.8 | 15.8 | 10.5 | 5.3 |
| +1.97 | -0.2 | -3.6 | -2.4 | +11.0 | +0.5 | -2.2 | +14.8 | +1.4 | +4.9 | -0.4 | -1.3 | +8.8 | +6.0 | +0.3 | -6.9 | -6.0 | |
| LLaVA-v1.5-13B | 11.12 | 7.0 | 14.3 | 14.3 | 9.1 | 6.6 | 6.0 | 13.5 | 5.6 | 13.5 | 10.4 | 12.6 | 14.7 | 11.5 | 13.8 | 13.0 | 10.7 |
| Testmini | 13.10 | 10.4 | 5.3 | 15.8 | 5.3 | 10.5 | 10.5 | 26.3 | 5.3 | 15.8 | 5.3 | 15.8 | 31.6 | 10.5 | 15.8 | 15.8 | 10.5 |
| +1.98 | +3.4 | -9.0 | +1.5 | -3.8 | +3.9 | +4.5 | +12.8 | -0.3 | +2.3 | -5.1 | +3.2 | +16.9 | -1.0 | +2.0 | +2.8 | -0.2 | |
| ShareGPT4V-13B | 11.88 | 7.5 | 15.5 | 16.4 | 10.7 | 8.9 | 9.0 | 11.5 | 8.9 | 7.6 | 11.6 | 13.0 | 17.4 | 10.3 | 8. 6 | 8.7 | 12.5 |
| Testmini | 13.49 | 15.8 | 21.1 | 10.5 | 5.3 | 15.8 | 10.5 | 15.8 | 10.5 | 15.8 | 5.3 | 10.5 | 36.8 | 21.1 | 5.3 | 10.5 | 5.3 |
| +1.61 | +8.3 | +5.6 | -5.9 | -5.4 | +6.9 | +1.5 | +4.3 | +1.6 | +8.2 | -6.3 | -2.5 | +19.4 | +10.8 | -3.3 | +1.8 | -7.2 | |
| SPHINX-MoE | 14.18 | 7.8 | 17.9 | 14.3 | 15.6 | 9.5 | 11.9 | 12.5 | 15.6 | 12.6 | 16.2 | 15.6 | 17.8 | 13.5 | 12.1 | 8.7 | 16.1 |
| Testmini | 13.49 | 10.5 | 15.8 | 15.8 | 15.8 | 10.5 | 10.5 | 10.5 | 15.8 | 10.5 | 15.8 | 15.8 | 15.8 | 15.8 | 10.5 | 10.5 | 15.8 |
| -0.69 | +2.7 | -2.1 | +1.5 | +0.2 | +1.0 | -1.4 | -2.0 | +0.2 | -2.1 | -0.4 | +0.2 | -2.0 | +2.3 | -1.6 | +1.8 | -0.3 | |
| InternLM-XComposer2-VL | 14.54 | 9.3 | 15.5 | 12.1 | 15.3 | 11.3 | 10.5 | 14.4 | 22.2 | 19.3 | 19.7 | 15.6 | 15.0 | 11.9 | 15.5 | 26.1 | 15.5 |
| Testmini | 15.79 | 10.5 | 15.8 | 10.5 | 15.8 | 10.5 | 10.5 | 15.8 | 21.1 | 21.1 | 21.1 | 15.8 | 15.8 | 10.5 | 15.8 | 26.3 | 15.8 |
| +1.25 | +1.2 | +0.3 | -1.6 | +0.5 | -0.8 | 0.0 | +1.4 | -1.1 | +1.8 | +1.4 | +0.2 | +0.8 | -1.4 | +0.3 | +0.2 | +0.3 | |
| Closed-source LMMs (Text + Image) | |||||||||||||||||
| Qwen-VL-Plus | 10.72 | 11.3 | 17.9 | 14.3 | 12.7 | 4.8 | 10.5 | 15.4 | 8.9 | 14.3 | 11.6 | 6.4 | 10.0 | 14.3 | 6.9 | 8.7 | 11.31 |
| Testmini | 10.53 | 26.3 | 10.5 | 10.5 | 15.8 | 10.5 | 21.1 | 5.3 | 10.5 | 10.5 | 10.5 | 5.3 | 10.5 | 10.5 | 5.3 | 5.3 | 0.0 |
| -0.19 | +15.0 | -7.4 | -3.8 | +3.1 | +5.7 | +10.6 | -10.1 | +1.6 | -3.8 | -1.1 | -1.1 | +0.5 | -3.8 | -1.6 | -3.4 | -11.31 | |
| Qwen-VL-Max | 15.59 | 10.7 | 19.1 | 20.0 | 16.9 | 12.5 | 17.9 | 16.4 | 12.2 | 21.0 | 13.3 | 14.2 | 19.8 | 11.5 | 20.7 | 13.0 | 17.3 |
| Testmini | 16.1 | 10.5 | 21.1 | 21.1 | 15.8 | 15.8 | 15.8 | 15.8 | 10.5 | 21.1 | 10.5 | 15.8 | 21.1 | 10.5 | 21.1 | 15.8 | 15.8 |
| +0.51 | -0.2 | +2.0 | +1.1 | -1.1 | +3.3 | -2.1 | -0.6 | -1.7 | +0.1 | -2.8 | +1.6 | +1.3 | -1.0 | +0.4 | +2.8 | -1.5 | |
| Gemini Pro | 17.66 | 15.1 | 10.7 | 20.7 | 20.1 | 11.9 | 7.5 | 20.2 | 21.1 | 16.8 | 19.1 | 19.0 | 20.0 | 14.3 | 13.8 | 17.4 | 20.8 |
| Testmini | 17.11 | 15.8 | 10.5 | 21.1 | 21.1 | 10.5 | 5.3 | 21.1 | 21.1 | 15.8 | 21.1 | 21.1 | 21.1 | 15.8 | 15.8 | 15.8 | 21.1 |
| -0.55 | +0.7 | -0.2 | +0.4 | +1.0 | -1.4 | -2.2 | +0.9 | 0.0 | -1.0 | +2.0 | +2.1 | +1.1 | +1.5 | +2.0 | -1.6 | +0.3 | |
| GPT4V | 22.76 | 27.3 | 32.1 | 35.7 | 21.1 | 16.7 | 13.4 | 22.1 | 14.4 | 16.8 | 22.0 | 22.2 | 20.9 | 23.8 | 24.1 | 21.7 | 25.6 |
| Testmini | 22.37 | 26.3 | 31.6 | 36.8 | 21.1 | 15.8 | 10.5 | 21.1 | 15.8 | 15.8 | 21.1 | 21.1 | 21.1 | 26.3 | 26.3 | 21.1 | 26.3 |
| -0.39 | -1.0 | -0.5 | +1.1 | - | -0.9 | -2.9 | -1.0 | +1.4 | -1.0 | -0.9 | -1.1 | +0.2 | +2.5 | +2.2 | -0.6 | +0.7 | |
In this section, we show the effectiveness of the testmini subset in mirroring the performance trends observed in the full test set across a diverse range of mathematical subjects. The detailed results are presented in Table 4. We find that the model performances, when evaluated on both the entire set and testmini, exhibit close parallelism in trend. For instance, the performance delta between the full test set and testmini for the Qwen-VL-Plus model is a mere 0.19%, indicating a high degree of similarity in model behavior across the two datasets. Similarly, the GPT4V model also exhibits a negligible performance difference of -0.39%, further corroborating the testmini subset’s capability to accurately reflect the full test set’s characteristics. Furthermore, even for LLaVA-v1.5-13B and Share-GPT4V-7B, two models with the largest performance variations, where differences of 1.98% and 1.97% are observed respectively, the deviation remains within 2%, underscoring the testmini subset’s reliability for performance evaluation. These findings suggest that models’ performance on the testmini subset should be indicative of their performance on the full test set, thereby providing a reliable means for preliminary evaluation and comparison of models across various mathematical subjects.
Appendix B Evaluation Details
We conduct all experiments on A100 80G GPUs.
B.1 Prompts for Response Generation
| Model | Prompt |
| GPT4-CoT | Please solve the problem step by step and put your |
| (Text Only) | answer in one "". If it is a multiple choice question, |
| only one letter is allowed in the "". | |
| ChatGPT 3.5-CoT | Please first solve the problem step by step, then put |
| (Text + Image Caption ) | your final answer or a single letter (if it is a multiple |
| choice question) in one "". | |
| GPT4-CoT | Please first solve the problem step by step, then put |
| (Text + Image Caption ) | your final answer or a single letter (if it is a multiple |
| multiple choice question) in one "". | |
| LLaVa-v1.5-7B | Answer the question using a single word or phrase. |
| SPHINX (V2) | Answer the question using a single word or phrase. |
| ShareGPT4V-7B | Answer the question using a single word or phrase. |
| LLaVa-v1.5-13B | Answer the question using a single word or phrase. |
| ShareGPT4V-13B | Answer the question using a single word or phrase. |
| SPHINX-MoE | Answer the question using a single word or phrase. |
| InternLM-XComposer2-VL | Please solve the problem and put your answer in one |
| "". If it is a multiple choice question, only one letter | |
| letter is allowed in the "". | |
| InternLM-XComposer2-VL | Please solve the problem step by step and put your |
| -CoT | answer in one "". If it is a multiple choice question, |
| only one letter is allowed in the "". | |
| Qwen-VL-Plus | Answer the question using a single word or phrase. |
| Qwen-VL-Max | Answer the question using a single word or phrase. |
| Qwen-VL-Max-CoT | Please solve the problem step by step and put your |
| answer in one "". If it is a multiple choice question, | |
| only one letter is allowed in the "". | |
| Gemini Pro | Answer the question using a single letter or number |
| or word. | |
| Gemini Pro-CoT | Please first solve the problem step by step, then put |
| your final answer or a single letter (if it is a multiple | |
| choice question) in one "". | |
| GPT4V | Please solve the problem and put your answer in one |
| "". If it is a multiple choice question, only one letter | |
| letter is allowed in the "". | |
| GPT4V-CoT | Please solve the problem step by step and put your |
| answer in one "". If it is a multiple choice question, | |
| only one letter is allowed in the "". |
In this section, we present details of the prompts used for the evaluation of response generation models. The prompts are designed to ensure that the models generate responses that are consistent with the input question and the image. The prompts used for the evaluation of response generation models are shown in Table 5.
B.2 Prompt for Caption Generation
The prompt for caption generation is as follows: Here is a diagram of a math problem, please describe the diagram in complete detail so that your description can be used to replace the diagram for math problem-solving.
B.3 Models
We present the source of the models used in the evaluation in Table 6. The models are sourced from OpenAI, Google, Alibaba, and Hugging Face. The models from OpenAI, Google and Alibaba are accessed from their respective platforms through API calls.
Appendix C Comparison Details
C.1 Comparing with MathVista
| Template | Proportion | Examples |
| IconQA | ||
| Object Counting | 106/400 | What number is shown? |
| Perimeter Calculation | 51/400 | What is the perimeter of the square? |
| Length Measurement with a given reference | 150/400 | Move the ruler to measure the length of the line to the nearest centimeter. The line is about centimeters long. |
| Time Inquiry based on a clock | 67/400 | What time is shown? |
| CLEVR-Math | ||
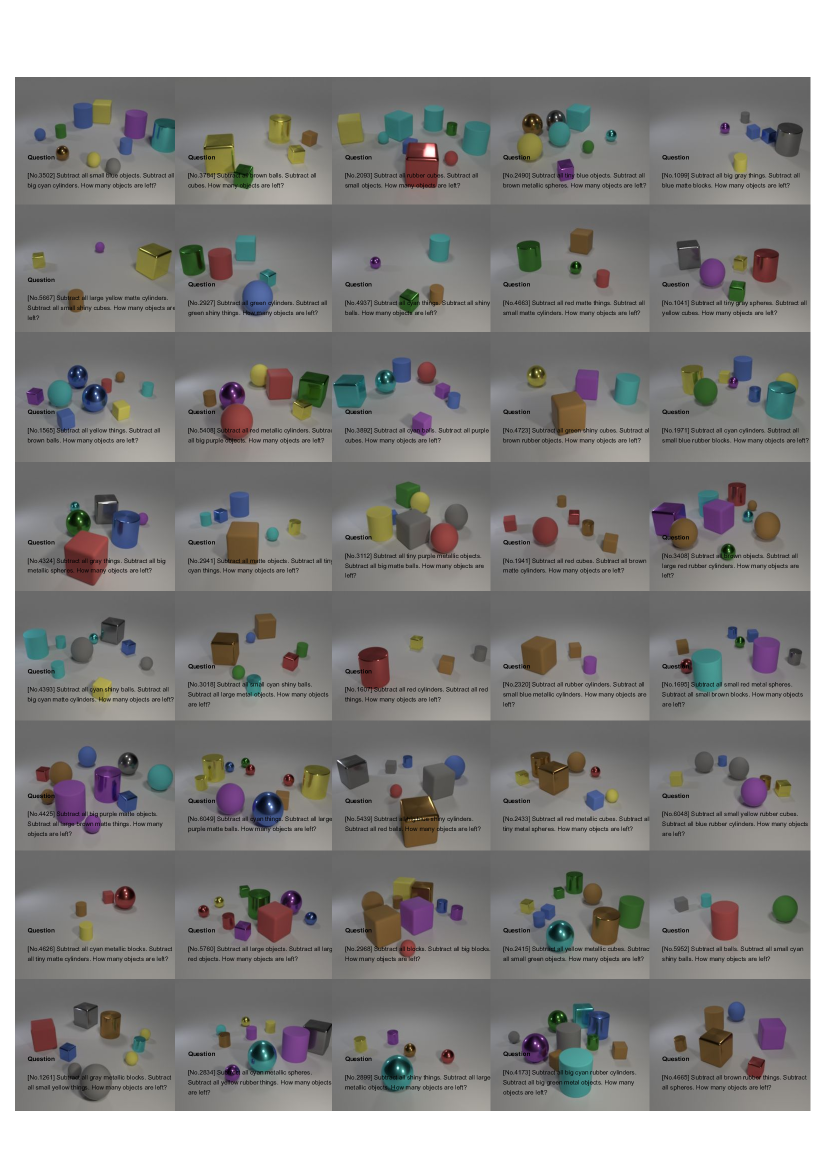
| Subtract … How many objects are left? | 400/400 | Subtract all metallic cylinders. Subtract all gray things. How many objects are left? |
| FigureQA | ||
| Is X the …? | 176/400 | Is Khaki the minimum/maximum/ low median/high median/smoothest/ roughest? |
| Does X have the …? | 86/400 | Does Brown have the maximum/ minimum area under the curve? (the highest/lowest value?) |
| Is X … Y? | 117/400 | Is Hot Pink less/greater than Black? |
| Does X intersect Y? | 21/400 | Does Slate intersect Light Salmon? |
| Super-CLEVEL | ||
| Are there … X than Y? | 146/400 | Are there fewer/more tiny gray cars than small red sedans? |
| Is the number of X … than Y? | 232/400 | Is the number of regular buss less/greater than the number of brown rubber minivans? |
| Others | 22/400 | How many cyan double buss have the same size as the matte aeroplane? |
| KVQA | ||
| What is the age gap between the …? | 310/382 | What is the age gap between these two people in image? |
| How many people in the image were born …? | 72/382 | How many people in the image were born after the end of World War II? |
| PlotQA | ||
| In how many years, is the X greater than Y? | 57/105 | In how many years, is the population in the largest city greater than 26 %? |
| What is the difference between …? | 31/105 | What is the difference between two consecutive major ticks on the Y-axis? |
| Others | 17/105 | What is the average rating of statistical capacity in Bolivia per year? |
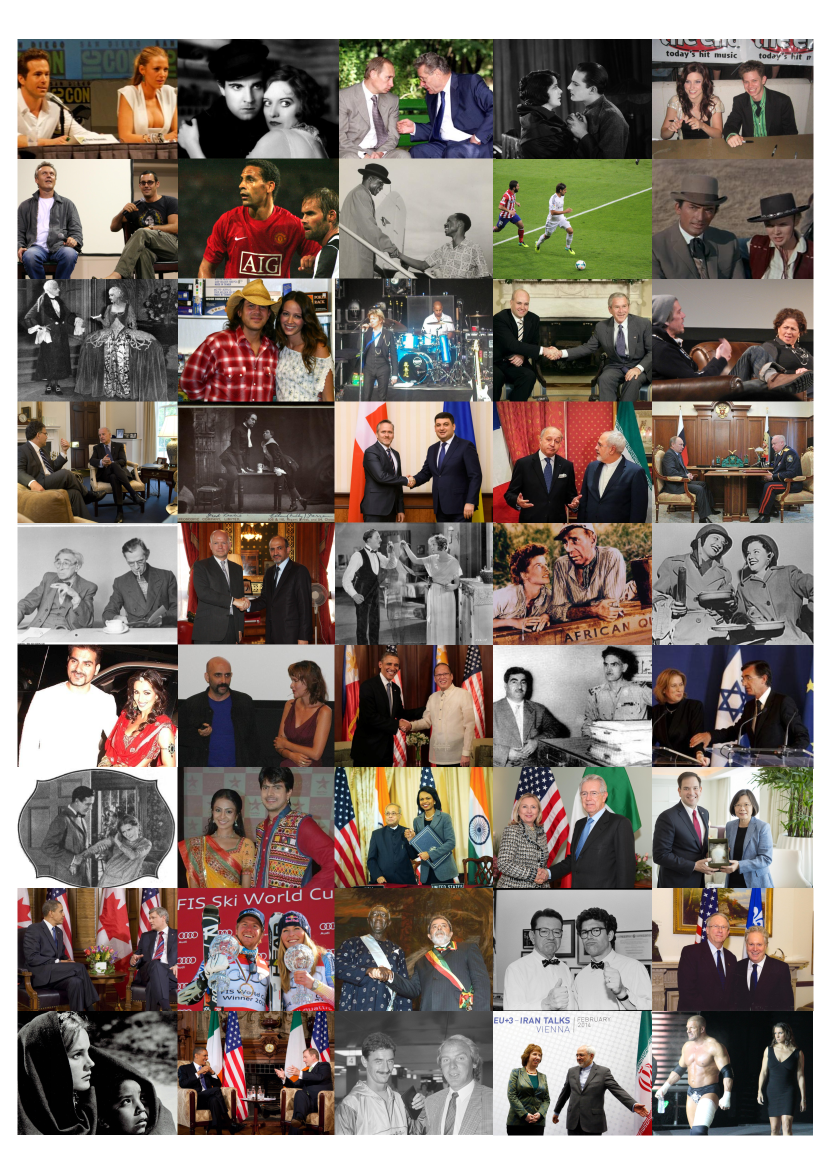
Mathvista contains numerous similar questions with restricted question variability across a variety of source datasets. After eliminating questions with identical stem text, only 4740 questions remain. For instance, among the 6141 questions in MathVista, the question "What is the age gap between these two people in the image?" appears 270 times. Some images of this question are shown in Figure 8. Furthermore, there are many template questions within its collection that merely alter a few words. For instance, questions containing "What is the age gap between" appear 310 times. Another example is questions like "Subtract all … objects. How many objects are left?". Figure 9 illustrates this type of question involving very similar geometry recognition, which occurs 400 times. In Table 7, we present detailed statistics on similar questions.
We also provide some qualitative comparisons illustrating the different question lengths between MathVista and our dataset. Figure 11 presents the 3 main types of questions featuring an abstract scene in MathVista, constituting over 90% of the total questions, as discussed in Section. 1. We also showcase representative questions in MathVista that involve a function plot in Figure 12, which pose similar, straightforward, and concise inquiries regarding the depicted function graph. For comparison, we present examples of our MATH-V on analytic geometry in Figure 11, which feature longer questions and incorporate more complex function concepts, such as mutual symmetry and iterative functions. Moreover, Figure 13 and Figure 14 exhibit topology and graph theory-related questions in our dataset, two categories absent in MathVista, and require intricate visual recognition and mathematical reasoning.
Object Counting (37%)
Image:
![[Uncaptioned image]](/html/2402.14804/assets/x9.png) Question: What number is shown?
Question: What number is shown?
Length Measurement (38.5%)
Image:
![[Uncaptioned image]](/html/2402.14804/assets/x10.png) Question: Move the ruler to measure the length of the line to the nearest centimeter. The line is about (_) centimeters long.
Time Inquiry (16.5%)
Image:
Question: Move the ruler to measure the length of the line to the nearest centimeter. The line is about (_) centimeters long.
Time Inquiry (16.5%)
Image:
![[Uncaptioned image]](/html/2402.14804/assets/x11.png) Question: What time does the clock show?
Question: What time does the clock show?
mutual symmetry of functions
Image:
![[Uncaptioned image]](/html/2402.14804/assets/x12.png) Question: The figure shows graphs of functions and defined on real numbers. Each graph consists of two perpendicular halflines. Which is satisfied for every real number ?
(A)
(B)
(C)
(D)
(E)
quadratic function discriminant
Image:
Question: The figure shows graphs of functions and defined on real numbers. Each graph consists of two perpendicular halflines. Which is satisfied for every real number ?
(A)
(B)
(C)
(D)
(E)
quadratic function discriminant
Image:
![[Uncaptioned image]](/html/2402.14804/assets/x13.png) Question: In the (x,y)-plane the coordinate axes are positioned as usual. Point which is on the parabola was marked. Afterwards the coordinate axis and the majority of the parabola were deleted. Which of the following statements could be false?
(A) (B) …
find roots of iterative functions
Image:
Question: In the (x,y)-plane the coordinate axes are positioned as usual. Point which is on the parabola was marked. Afterwards the coordinate axis and the majority of the parabola were deleted. Which of the following statements could be false?
(A) (B) …
find roots of iterative functions
Image:
![[Uncaptioned image]](/html/2402.14804/assets/x14.png) Question: The graph of the function , defined for all real numbers, is formed by two half-lines and one segment, as illustrated in the picture. Clearly, -8 is a solution of the equation , because . Find all the solutions of the equation .
Question: The graph of the function , defined for all real numbers, is formed by two half-lines and one segment, as illustrated in the picture. Clearly, -8 is a solution of the equation , because . Find all the solutions of the equation .
Function symmetry, etc.
Image:
![[Uncaptioned image]](/html/2402.14804/assets/x15.png) Question1:
Is this an odd function?
(A) Yes (B) No
Question2: How many zeros does this function have?
Question3: What is the value of f(0)?
Question4: Is this function differentiable at each point?
Question5: f(2) is ____ zero.
Question6: The derivative of this function at x=0 is ____
Question7: What is this function most likely be?
(A) a polynomial
(B) a trigonometric function
(C) an exponential function
(D) a logarithmic function
Function monotonicity, etc.
Image:
Question1:
Is this an odd function?
(A) Yes (B) No
Question2: How many zeros does this function have?
Question3: What is the value of f(0)?
Question4: Is this function differentiable at each point?
Question5: f(2) is ____ zero.
Question6: The derivative of this function at x=0 is ____
Question7: What is this function most likely be?
(A) a polynomial
(B) a trigonometric function
(C) an exponential function
(D) a logarithmic function
Function monotonicity, etc.
Image:
![[Uncaptioned image]](/html/2402.14804/assets/x16.png) Question1: Which function is monotonic in range [0, pi]?
(A) the red one
(B) the blue one
(C) both
(D) none of them
Question2: At x=1, the value of the red curve is ____ that of the blue curve.
Question3: Which function is even?
Question4: Which function is odd?
Question5: Which function is periodic?
Question6: What is the value of the red curve at x=0?
Question7: What is the value of the blue curve at x=0?
Function roots, etc.
Image:
Question1: Which function is monotonic in range [0, pi]?
(A) the red one
(B) the blue one
(C) both
(D) none of them
Question2: At x=1, the value of the red curve is ____ that of the blue curve.
Question3: Which function is even?
Question4: Which function is odd?
Question5: Which function is periodic?
Question6: What is the value of the red curve at x=0?
Question7: What is the value of the blue curve at x=0?
Function roots, etc.
Image:
![[Uncaptioned image]](/html/2402.14804/assets/x17.png) Question1: How many zeros does this function have?
Question2: What is the zero of this function?
Question3: The derivative of y at x=6 is ____ that at x=8.
Question4: What is the value of y at x=2?
Question5: What is the value of y at x=1?
Question6: If this function invertible?
Question7: What is this function most likely be?
A a polynomial
B a trigonometric function
C an exponential function
D a logarithmic function
Question1: How many zeros does this function have?
Question2: What is the zero of this function?
Question3: The derivative of y at x=6 is ____ that at x=8.
Question4: What is the value of y at x=2?
Question5: What is the value of y at x=1?
Question6: If this function invertible?
Question7: What is this function most likely be?
A a polynomial
B a trigonometric function
C an exponential function
D a logarithmic function
String Knot Probability Puzzle
Image:
![[Uncaptioned image]](/html/2402.14804/assets/x18.png) Question: A piece of string is lying on the table. It is partially covered by three coins as seen in the figure. Under each coin the string is equally likely to pass over itself like this: <image1> or like this: <image2>. What is the probability that the string is knotted after its ends are pulled?
Village Map Sketching Challenge
Image:
Question: A piece of string is lying on the table. It is partially covered by three coins as seen in the figure. Under each coin the string is equally likely to pass over itself like this: <image1> or like this: <image2>. What is the probability that the string is knotted after its ends are pulled?
Village Map Sketching Challenge
Image:
![[Uncaptioned image]](/html/2402.14804/assets/x19.png) Question: During a rough sailing trip, Jacques tried to sketch a map of his village. He managed to draw the four streets, the seven places where they cross and the houses of his friends. The houses are marked on the correct streets, and the intersections are correct, however, in reality, Arrow Street, Nail Street and Ruler Street are all absolutely straight. The fourth street is Curvy Street. Who lives on Curvy Street?
(A) Adeline
(B) Benjamin
(C) Carole
(D) David
(E) It is impossible to tell without a better map
Borromaic Rings
Image:
Question: During a rough sailing trip, Jacques tried to sketch a map of his village. He managed to draw the four streets, the seven places where they cross and the houses of his friends. The houses are marked on the correct streets, and the intersections are correct, however, in reality, Arrow Street, Nail Street and Ruler Street are all absolutely straight. The fourth street is Curvy Street. Who lives on Curvy Street?
(A) Adeline
(B) Benjamin
(C) Carole
(D) David
(E) It is impossible to tell without a better map
Borromaic Rings
Image:
![[Uncaptioned image]](/html/2402.14804/assets/x20.png) Question: The "Borromaic Rings" have an extraordinary property. Although no two are interlocked, they are strongly connected within each other. If one ring is cut through, the other two fall apart. Which of the following diagrams shows the picture of "Borromaic Rings"?
Question: The "Borromaic Rings" have an extraordinary property. Although no two are interlocked, they are strongly connected within each other. If one ring is cut through, the other two fall apart. Which of the following diagrams shows the picture of "Borromaic Rings"?
Adjacent Coloring Puzzle
Image:
![[Uncaptioned image]](/html/2402.14804/assets/x21.png) Question: In the diagram we want to colour the fields with the colours A, B, C D so that adjacent fields are always in different colours. (Even fields that share only one corner, count as adjacent.) Some fields have already been coloured in. In which colour can the grey field be coloured in?
Coloring Options
Image:
Question: In the diagram we want to colour the fields with the colours A, B, C D so that adjacent fields are always in different colours. (Even fields that share only one corner, count as adjacent.) Some fields have already been coloured in. In which colour can the grey field be coloured in?
Coloring Options
Image:
![[Uncaptioned image]](/html/2402.14804/assets/x22.png) Question: The figure below shows a ring made of six small sections which you are to paint on a wall. You have four paint colors available and will paint each of the six sections a solid color. Find the number of ways you can choose to paint each of the six sections if no two adjacent section can be painted with the same color.
Optimal Line Additions
Image:
Question: The figure below shows a ring made of six small sections which you are to paint on a wall. You have four paint colors available and will paint each of the six sections a solid color. Find the number of ways you can choose to paint each of the six sections if no two adjacent section can be painted with the same color.
Optimal Line Additions
Image:
![[Uncaptioned image]](/html/2402.14804/assets/x23.png) Question: The picture shows seven points and the connections between them. What is the least number of connecting lines that could be added to the picture so that each of the seven points has the same number of connections with other points? (Connecting lines are allowed to cross each other.)
Question: The picture shows seven points and the connections between them. What is the least number of connecting lines that could be added to the picture so that each of the seven points has the same number of connections with other points? (Connecting lines are allowed to cross each other.)
C.2 Comparing with MMMU
In this section, we showcase some examples of different subjects of MMMU demanding sophisticated college-level domain knowledge. Figure 15, Figure 16, and Figure 17 present the subject of Graph Theory, Group Theory, and Operation Research, respectively. Moreover, typical examples of Topology and Graph Theory in our MATH-V are displayed in Figure 14 and Figure 14. Although both sets of subjects are intricate mathematical disciplines, they exhibit notable differences in the nature of their posed questions. Questions in the MMMU dataset often involve advanced college-level mathematical concepts such as Kruskal’s algorithm, alternating group structures, and DFS Spanning Tree. In contrast, the questions in our dataset predominantly comprise puzzles that are readily solvable by middle and high school students.
Kruskal’s Algorithm
Image:
![[Uncaptioned image]](/html/2402.14804/assets/examples/figures/test_Math_10.jpg) Question: Using Kruskal’s algorithm find a minimal spanning tree of <image 1>. Show the list of chosen edges only in alphabet order. Is ’AB, AF, BC, BG, DG, EF’ the correct answer?
(A) Yes
(B) No
Prüfer Code
Image:
Question: Using Kruskal’s algorithm find a minimal spanning tree of <image 1>. Show the list of chosen edges only in alphabet order. Is ’AB, AF, BC, BG, DG, EF’ the correct answer?
(A) Yes
(B) No
Prüfer Code
Image:
![[Uncaptioned image]](/html/2402.14804/assets/examples/figures/test_Math_26.jpg) Question: Give the Prüfer code of <image 1>
(A) 2,4,4,6,6
(B) 2,3,3,6,6
(C) 2,2,4,6,6
(D) 2,4,4,6,7
DFS Spanning Tree
Image:
Question: Give the Prüfer code of <image 1>
(A) 2,4,4,6,6
(B) 2,3,3,6,6
(C) 2,2,4,6,6
(D) 2,4,4,6,7
DFS Spanning Tree
Image:
![[Uncaptioned image]](/html/2402.14804/assets/examples/figures/test_Math_102.jpg) Question: Apply DFS Spanning Tree Algorithm to <image 1> with vertex pre-ordering a, b, c, e, i, h, g, d, f. Show the list of chosen edges only in alphabet order.
(A) ab,be,ci,cd,ce,dh,fg,gh
(B) ab,ai,be,bf,cd,ci,fg,fh
Question: Apply DFS Spanning Tree Algorithm to <image 1> with vertex pre-ordering a, b, c, e, i, h, g, d, f. Show the list of chosen edges only in alphabet order.
(A) ab,be,ci,cd,ce,dh,fg,gh
(B) ab,ai,be,bf,cd,ci,fg,fh
Alternating Group
Image:
![[Uncaptioned image]](/html/2402.14804/assets/examples/figures/test_Math_34.jpg) Question: Is <image 1> an Alternating group?
(A) Yes
(B) No
Cayley Diagram
Image:
Question: Is <image 1> an Alternating group?
(A) Yes
(B) No
Cayley Diagram
Image:
![[Uncaptioned image]](/html/2402.14804/assets/examples/figures/test_Math_110.jpg) Question: Is <image 1> a Cayley diagram?
(A) Yes
(B) No
Symmetric Group
Image:
Question: Is <image 1> a Cayley diagram?
(A) Yes
(B) No
Symmetric Group
Image:
![[Uncaptioned image]](/html/2402.14804/assets/examples/figures/test_Math_479.jpg) Question: Is <image 1> a Symmetric group?
(A) Yes
(B) No
Question: Is <image 1> a Symmetric group?
(A) Yes
(B) No
Graph Minimum Path
Image:
![[Uncaptioned image]](/html/2402.14804/assets/x24.png) Question: Find the minimum path from v0 to v7 in the graph G of figure 1. Notice that it has no circuit whose length is negative. <image 1>
(A) (v0, v1, v2, v3, v4, v5, v6, v7) with length 10
(B) (v0, v2, v3, v4, v6, v7) with length -12
(C) (v0, v1, v3, v5, v6, v7) with length 8
(D) (v0, v2, v4, v5, v6, v7) with length 6
Ford and Fulkerson Algorithm
Image:
Question: Find the minimum path from v0 to v7 in the graph G of figure 1. Notice that it has no circuit whose length is negative. <image 1>
(A) (v0, v1, v2, v3, v4, v5, v6, v7) with length 10
(B) (v0, v2, v3, v4, v6, v7) with length -12
(C) (v0, v1, v3, v5, v6, v7) with length 8
(D) (v0, v2, v4, v5, v6, v7) with length 6
Ford and Fulkerson Algorithm
Image:
![[Uncaptioned image]](/html/2402.14804/assets/x25.png) Question: Consider the network shown in Fig. 1. The problem is to maximize the flow from node 1 to node 6 given the capacities shown on the arcs. Solve by Ford and Fulkerson algorithm. <image 1>
(A) 5 units
(B) 7 units
(C) 9 units
(D) 11 units
Linear Programming
Image:
Question: Consider the network shown in Fig. 1. The problem is to maximize the flow from node 1 to node 6 given the capacities shown on the arcs. Solve by Ford and Fulkerson algorithm. <image 1>
(A) 5 units
(B) 7 units
(C) 9 units
(D) 11 units
Linear Programming
Image:
![[Uncaptioned image]](/html/2402.14804/assets/x26.png) Question:
Consider the following problem: Minimize Subject to . Solve by the graphical approach. <image 1>
(A) The problem has a unique feasible solution.
(B) The problem has multiple feasible solutions.
(C) The problem is infeasible.
(D) The problem is unbounded.
Question:
Consider the following problem: Minimize Subject to . Solve by the graphical approach. <image 1>
(A) The problem has a unique feasible solution.
(B) The problem has multiple feasible solutions.
(C) The problem is infeasible.
(D) The problem is unbounded.
Appendix D More Dataset Details
D.1 Question Distribution
All questions in MATH-V are written in English. As illustrated in Table 1, the average number of words in a question is 42.3, with a maximum of 280 words and a minimum of 5 words. Figure 18 further elucidates the distribution of word counts, highlighting the diverse patterns of questions. We can see that the median word count and the average word count are close, indicating that the distribution is not skewed. The distribution of word counts is near a normal distribution, with more than 98.75% of questions having a word count of less than 100.
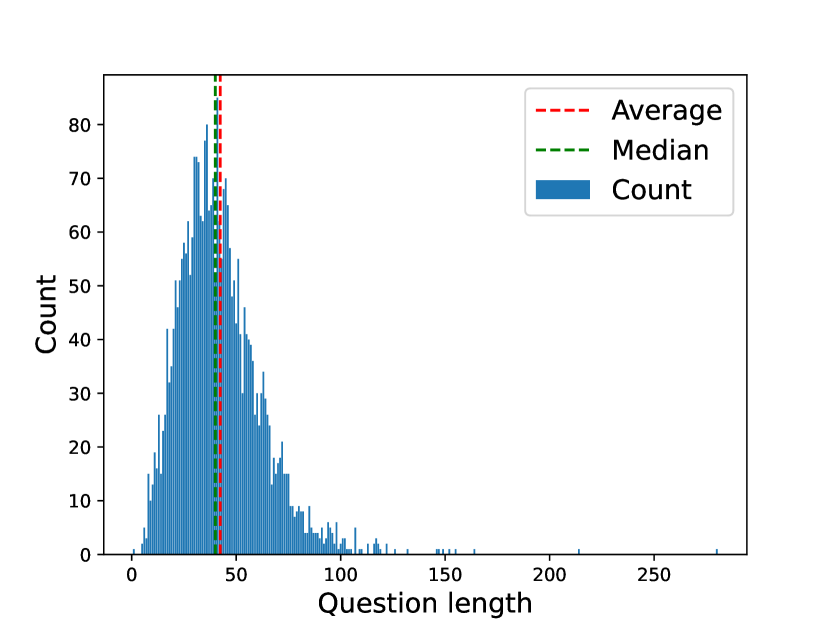
D.2 Division of Levels
In this section, we detail the division of MATH-V’s difficulty levels. Our difficulty classification is divided into two steps. The first step involves roughly dividing the difficulty levels based on the grades of the contestants as specified in the competition. The second step entails manually checking and correcting any unreasonable divisions.
Step 1. The existing competition’s grade requirements span grades 1 to 12. Because the questions for grades 1 and 2 are considered too simple, we classify them separately as level 1. The questions for grades 3, 4, 5, and 6 are similar in difficulty, so we classify them as level 2. Grades 7 and 8 are categorized as level 3, grades 9 and 10 as level 4, and grades 11 and above as level 5.
Step 2. We manually review the questions in each level and adjust the classification according to the actual difficulty of the questions. This step is necessary because, within the same exam, the difficulty range of the questions can be quite broad. For instance, the most difficult question in grade 4 might be more challenging than the easiest question in grade 5. In such cases, we make manual adjustments.
Figure 19 shows a comparison of the level distribution between our MATH-V and the MATH dataset. We observe that both datasets have the fewest number of questions in level 1 and a similar number of questions in the other levels. Figure 3.b illustrates the models’ accuracy across different levels. It is evident that the accuracy of the models decreases as the difficulty level increases, which aligns with the expectation that the difficulty of the questions escalates with the level.
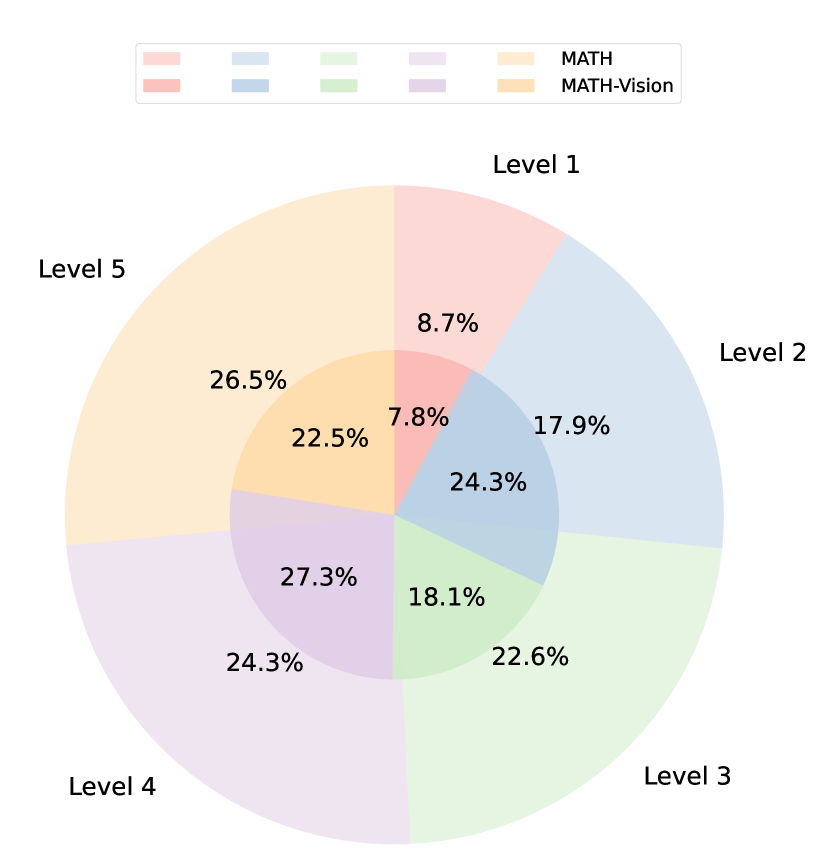
D.3 Images by Subjects
In this section, we demonstrate some images from the problems in our dataset. Figure 21, Figure 22, Figure 23, Figure 24, Figure 25, Figure 26, Figure 27, Figure 28, Figure 29, Figure 30, Figure 31, Figure 32, Figure 33, Figure 34, Figure 35 and Figure 36 show images from the problems under the category of Algebra, Analytic Geometry, Arithmetic, Combinatorial Geometry, Combinatorics, Counting, Descriptive Geometry, Graph Theory, Logic, Metric Geometry - Angle, Metric Geometry - Area, Metric Geometry - Length, Solid Geometry, Statistics, Topology and Transformation Geometry, respectively.
We can see that the images are diverse among different categories, and the images in the same category have similar visual patterns. For example, the images in the category of Statistics are mainly various types of charts and tables, while the images in the category of Arithmetic and Counting, which are categories mainly for primary school students, are more colorful and have more cartoon characters or real-world objects, and, conversely, the images in the category of Analytic Geometry are more complex and abstract.
D.4 Introduction of Subjects
Algebra. Algebra is a branch of mathematics that deals with symbols and the rules for manipulating these symbols. It is a unifying thread of almost all of mathematics and includes everything from solving simple equations to studying abstractions such as groups, rings, and fields. Algebra allows us to express relationships and solve problems where we don’t initially know the values of certain quantities. It serves as the foundation for more advanced topics in mathematics and sciences, enabling the formulation and solving of equations and inequalities.
Analytic Geometry. Analytic Geometry, also known as coordinate geometry, merges algebra and geometry to discuss shapes and figures using a coordinate system. This branch of mathematics allows the representation of geometric shapes in a numerical way by translating them into equations and vice versa. It enables the study of geometric properties and relationships by means of algebraic equations, thus providing a powerful tool for solving geometric problems.
Arithmetic. Arithmetic is the most basic branch of mathematics, dealing with the study of numbers and the traditional operations on them: addition, subtraction, multiplication, and division. It forms the foundation upon which more advanced mathematical concepts are built. Arithmetic is used in everyday life for counting, measuring, and performing calculations. It is the first type of math that students are introduced to and remains fundamental for understanding more complex areas of mathematics.
Combinatorial Geometry. Combinatorial Geometry is a field of mathematics that studies geometric objects and their arrangement, with a particular focus on discrete and combinatorial aspects. It involves the investigation of geometric structures and their properties under various combinatorial processes, such as counting, arrangement, and partitioning. This branch often intersects with areas like graph theory and combinatorics, exploring problems related to the configuration of points, lines, and other geometric figures.
Combinatorics. Combinatorics is a branch of mathematics concerned with counting, arrangement, and combination of objects. It deals with questions of how many different ways such objects can be chosen, arranged, and combined under certain conditions. Combinatorics has applications in numerous areas, including computer science, optimization, and probability theory. It is fundamental in developing analytical skills and understanding complex mathematical concepts.
Counting. Counting is the most basic and fundamental concept in mathematics, involving the enumeration of objects in a set. It serves as the foundation for more advanced mathematical concepts, such as arithmetic and combinatorics. Counting is not only about determining the total number of items in a collection but also includes understanding and applying principles like one-to-one correspondence, the counting principle, permutations, and combinations.
Descriptive Geometry. Descriptive Geometry is the branch of geometry that allows the representation of three-dimensional objects in two dimensions, through the use of projections or perspective drawings. It is a method of visually communicating complex geometric shapes and is fundamental in fields such as engineering, architecture, and design. Descriptive geometry provides tools and techniques for solving spatial problems and for understanding the spatial relationships between objects.
Graph Theory. Graph Theory is a branch of mathematics that studies graphs, which are mathematical structures used to model pairwise relations between objects. A graph is made up of vertices (or nodes) and edges (or arcs) that connect them. Graph theory is used to study networks and their properties, such as paths, cycles, and connectivity, and has applications in computer science, biology, transportation, social sciences, and more.
Logic. Logic is the foundation of mathematical reasoning, focusing on the study of argument validity, structure, and form. It involves the analysis of propositions and their relationships to determine the truth values of statements. Logic is used to construct and analyze mathematical proofs, ensuring that conclusions follow logically from premises. It encompasses various systems, such as propositional logic, predicate logic, and modal logic, each with its own rules and applications.
Metric Geometry - Angle. Metric Geometry concerning angles focuses on the properties and measurements of angles within various geometric figures. It involves understanding the types of angles (acute, right, obtuse, and straight), their relationships, and how they can be measured and used to determine other geometric properties. This aspect of metric geometry is crucial in solving problems related to shapes, patterns, and designs in both two and three dimensions.
Metric Geometry - Area. Metric Geometry in the context of area deals with the measurement of the surface enclosed within geometric figures. It involves calculating the extent of two-dimensional shapes, such as squares, rectangles, triangles, and circles, using various formulas. Understanding area is essential in numerous practical applications, including architecture, land surveying, and crafting, where the determination of space is necessary.
Metric Geometry - Length. Metric Geometry concerning length involves the measurement of distance between points in geometric figures. It is the foundation for determining the perimeter of shapes, the distance around a figure, and the concept of metric spaces in more advanced mathematics. Length measurements are fundamental in various real-world applications, such as construction, fabrication, and navigation.
Solid Geometry. Solid Geometry is the branch of mathematics that deals with the study of three-dimensional figures, including spheres, cubes, cylinders, and pyramids, among others. It involves understanding the properties, measurements, and relationships of these figures, such as volume, surface area, and the angles between intersecting planes. Solid geometry is essential in fields such as engineering, architecture, and physics, where three-dimensional models are crucial.
Statistics. Statistics is the branch of mathematics that deals with collecting, analyzing, interpreting, and presenting data. It involves the use of theories of probability to make inferences about populations from samples. Statistics is applied in a wide range of disciplines, including economics, social sciences, biology, and engineering, to make decisions or predictions based on data analysis.
Topology. Topology is a branch of mathematics concerned with the properties of space that are preserved under continuous transformations, such as stretching and bending, but not tearing or gluing. It is often referred to as "rubber-sheet geometry" because of its focus on the intrinsic properties of spaces. Topology has applications in various areas, including quantum physics, computer science, and biology, and deals with concepts like continuity, compactness, and connectedness.
Transformation Geometry. Transformation Geometry involves the study of geometric figures and the changes they undergo through transformations such as translation, rotation, reflection, and dilation. It focuses on understanding how these transformations affect the properties and relations of shapes and figures. Transformation geometry is fundamental in understanding the symmetry, congruence, and similarity of geometric objects, and it has applications in areas such as computer graphics, robotics, and pattern recognition.
Appendix E Error Examples of GPT-4V
In this section, we present detailed examples of errors made by GPT-4V. We categorize these errors into six types: reasoning error, vision recognition error, knowledge error, question misunderstood error, refusal to answer, and calculation error.
E.1 Reasoning Error (42.2%)
Reasoning errors occur when GPT-4V fails to apply logical steps correctly. In Figure 37, the model incorrectly substitutes an unknown variable with a known value, leading to an incorrect conclusion. Figure 38 shows the model making an illogical hypothesis about the relationships of train wagon numbers.
E.2 Vision Recognition Error (31.9%)
Vision recognition errors highlight the model’s struggles with interpreting visual data. Figure 39 depicts an instance where GPT-4V fails to read information from a simple bar chart. In Figure 40, the error occurs because the model mistakenly believes that 3, 6, and y are on the same side of the triangle. Figure 41 shows the model experiencing severe hallucinations, as there is no balance in the image at all.
E.3 Knowledge Error (15.1%)
E.4 Question Misunderstood Error (6.9%)
These errors occur when GPT-4V misinterprets the user’s query. Figure 44 demonstrates a failure to grasp the query’s intent, resulting in an incorrect answer. Similarly, in Figure 45, the model mistakenly believes that the key below corresponds to the lock above, even though the question does not provide this information.
E.5 Reject to Answer (2.6%)
E.6 Calculation Error (1.3%)
Calculation errors are straightforward mistakes in numerical or symbolic calculations. The model only makes errors when performing symbolic calculations in our analysis. Both Figure 48 and Figure 49 show a simple symbolic computational mistake, undermining the model’s reliability in symbolic calculations.
Appendix F Examples of GPT-4 with Image Captions
In this section, we provide some qualitative examples of GPT-4 with image captions, in comparison to other models like GPT-4V, Gemini Pro, and Qwen-VL-Max.
F.1 Correct Examples
F.2 Wrong Examples
Appendix G Details of Human Annotators
We hire human annotators for three tasks: 1. Verify the alignment of text questions and images; 2. Categorize the problems into 16 different subjects; 3. Evaluate human performance on MATH-V.
G.1 Alignment of Text Questions and Images
We hire ten annotators in stage one, and all of them are senior college students, all majoring in science-related disciplines. We pay them $0.35 per question, and they were asked to judge whether the text of the question matched the corresponding image and whether the image was complete. When the image is incomplete or incorrectly positioned, they are asked to re-capture the image from the original file.
G.2 Subjects Classification
For task two, we have 10 annotators and three authors, to categorize the problems into 16 different subjects independently in three groups with our specially designed annotation tool, as illustrated in Figure 20. We ask them to read our definitions of the 16 subjects in advance as shown in Appendix D.4, and will randomly check their classification of certain topics. If there are mistakes in classification, we will promptly correct them and inform them. We pay $0.45 per question. Notably, we also utilize existing LMMs (such as Gemini and GPT-4V) for subject classification. Detailed instructions to annotators and prompts to models can be found in Table 8. Finally, we will combine the classification results of the three groups with the classification results returned by LMMs to give the final classification.
Instructions for annotators on how to label questions into 16 categories We are constructing a dataset about mathematical problems in visual contexts, and we have collected quantities of questions that require categorization into different mathematical subjects. These categorizations are logic, algebra, counting, arithmetic, combinatorics, graph theory, topology, statistics, combinatorial geometry, solid geometry, metric geometry - angle, metric geometry - area, metric geometry - length, analytic geometry, descriptive geometry, and transformation geometry. Here are the detailed definitions of them: … (definitions in Appendix D.4) If you are unsure about how to categorize the problem into these subjects, choose ’pending’ instead. The prompt for models to get subject advice What branch of mathematics does the problem belong to? Choose from the following: logic, algebra, counting, arithmetic, combinatorics, graph theory, topology, statistics, combinatorial geometry, solid geometry, metric geometry - angle, metric geometry - area, metric geometry - length, analytic geometry, descriptive geometry, transformation geometry, pending. You are not supposed to solve the problem. Wrap your final answer, a word or a short phrase, in .
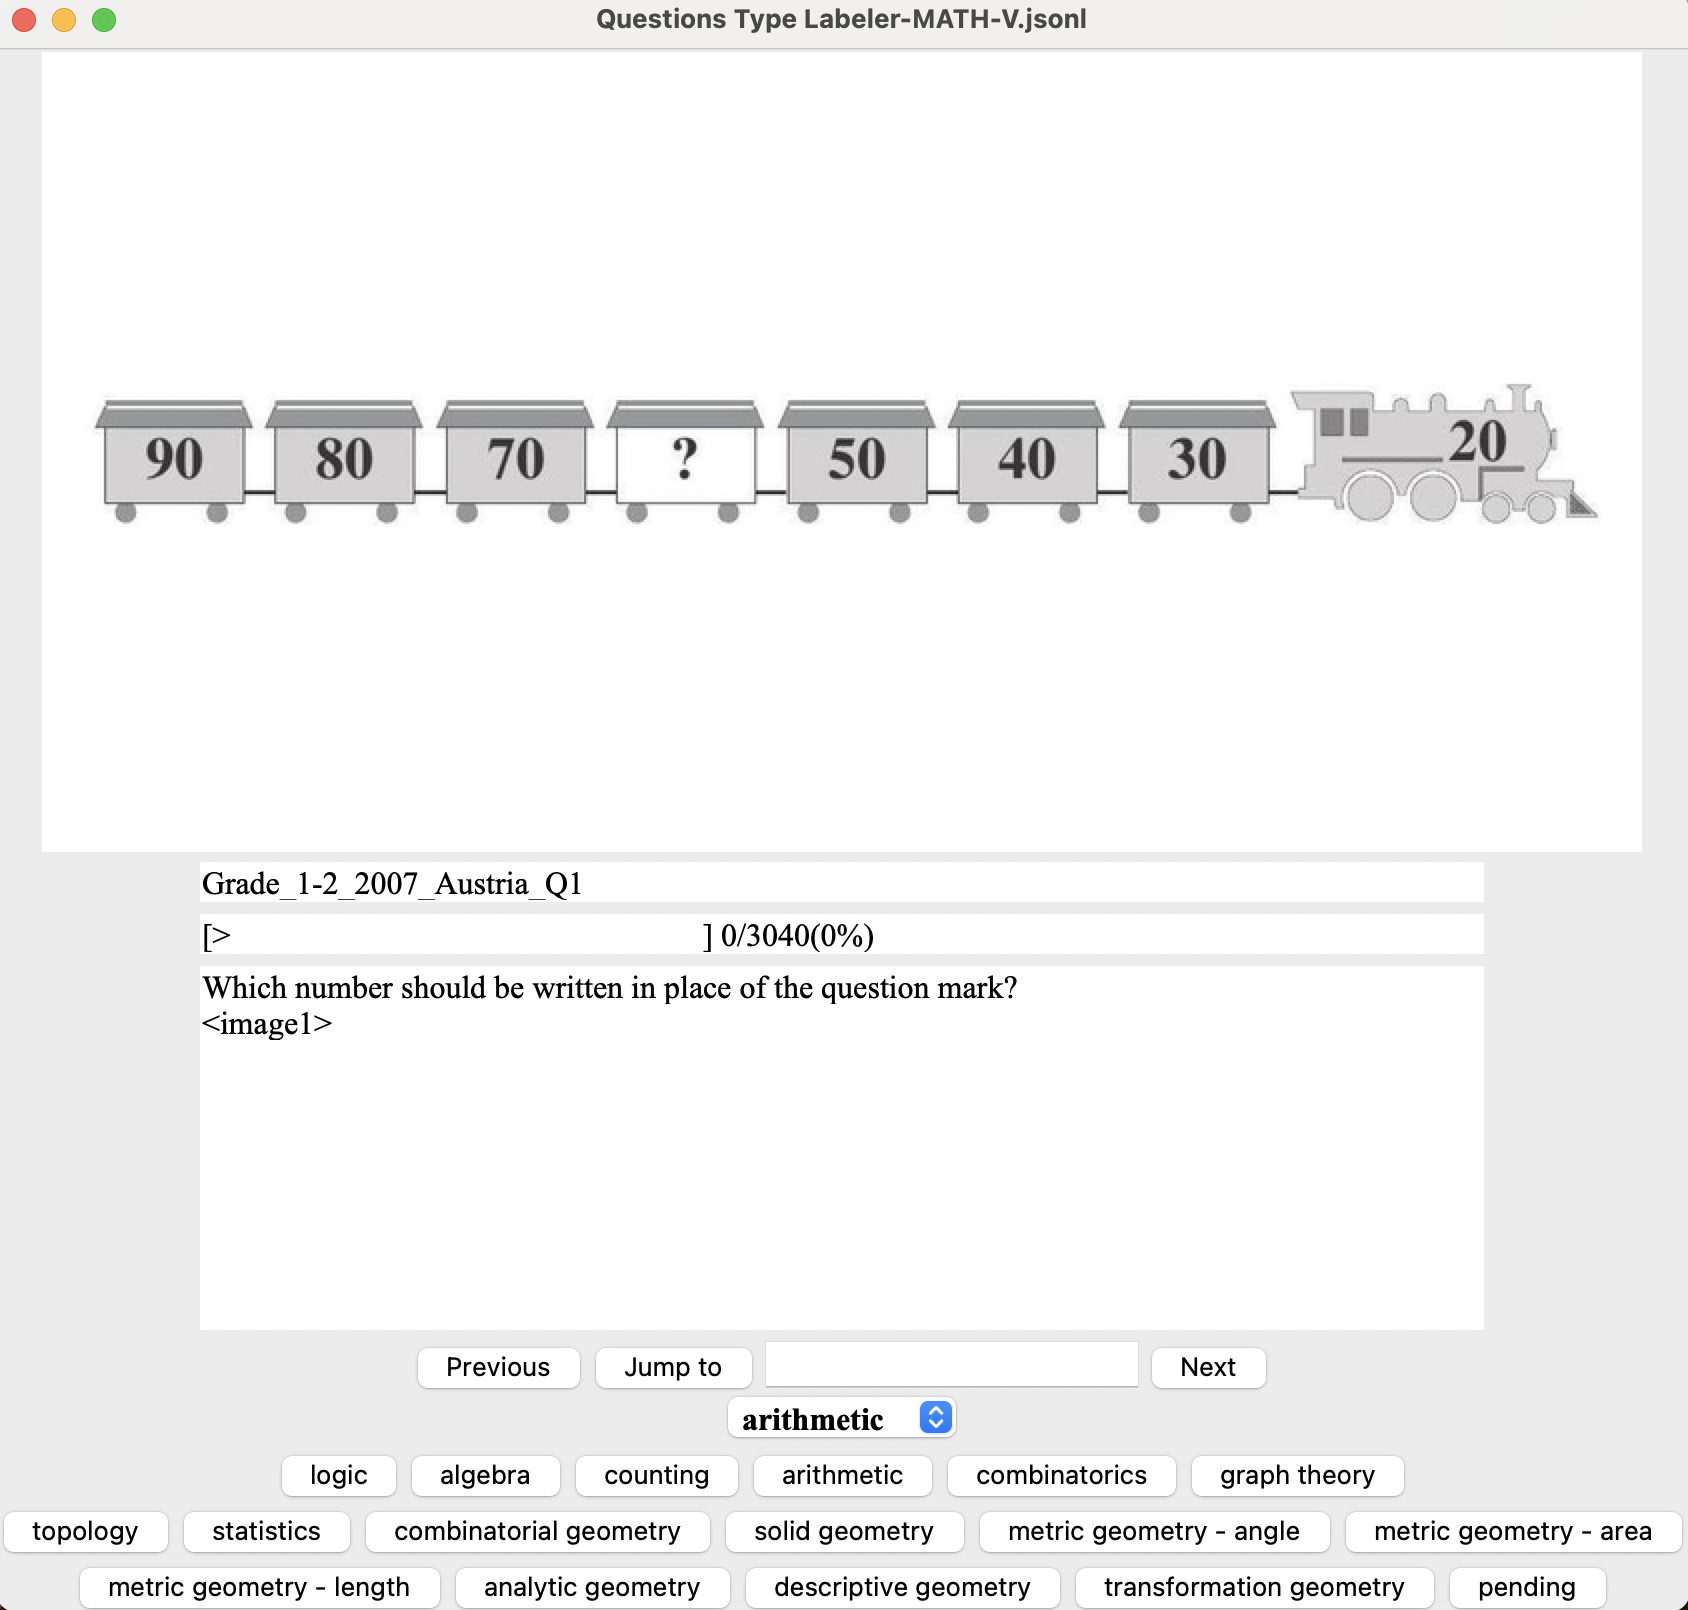
G.3 Human Performance
To obtain average human performance on our benchmark, we recruit 30 college or master students. We divided the 304 questions of testmini into 10 subsets, each containing 30 or 31 questions. Subsequently, we randomly allocated two subsets from this pool to each student. Participants were tasked with completing both subsets within a 70-minute time frame, spread across two separate days. Note that this time limit closely aligns with that of the Kangaroo competition, where participants are assigned a similar duration for a test containing 30 problems. Each participant receives a one-time payment of $45 as compensation for their contribution.