Dust Accumulation near the Magnetospheric Truncation of Protoplanetary Discs. II. The Effects of Opacity and Thermal Evolution
Abstract
Dust trapping in the global pressure bump induced by magnetospheric truncation offers a promising formation mechanism for close-in super-Earths/sub-Neptunes. These planets likely form in evolved protoplanetary discs, where the gas temperature at the expanding truncation radius become amiable to refractory solids. However, dust accumulation may alter the disc opacity such that thermal evolution is inevitable. To better understand how thermodynamics affects this planet formation pathway, we conduct a suite of local dust evolution simulations in an idealized inner disc model. Our calculations take into account self-consistent opacity-dependent temperature changes as well as dust evaporation and vapour condensation. We find that disc thermal evolution regulates dust growth and evolution, discouraging any accumulation of small particles that drives the increase of opacity and temperature. Significant retention of dust mass takes place when the disc environments allow runaway growth of large solids beyond the fragmentation barrier, where small particles are then swept up and preserved. Our results further validate dust accumulation near disc truncation as a promising mechanism to form close-in planets.
keywords:
protoplanetary discs – planets and satellites: formation – accretion – solid state: refractory1 Introduction
Short-period super-Earths (also referred to as sub-Neptunes or Kepler planets) are the most common type of currently observable exoplanets (e.g., Howard et al., 2010; Dressing & Charbonneau, 2015). However, their distinct properties (e.g., tight orbital configurations, insensitivity to host metallicities, mass-radius valley) and the lack of their analogues in the Solar System challenge the conventional planet formation theory (Petigura et al., 2017; Johnson et al., 2017; Fulton et al., 2017; Petigura et al., 2018; Zhu et al., 2018; Kunimoto & Matthews, 2020; Reiners et al., 2022; Stefánsson et al., 2023).
Several formation channels for such super-Earths have been proposed over the years, with a broad consensus that super-Earths are most likely formed out of materials originated from the external disc (i.e., ex situ formation) (Morbidelli & Raymond 2016, see also their Fig. 5 and references therein; Izidoro et al. 2021). The remaining key question is when and where growth takes place during inward migration of solids. If the initial growth of planetary embryos is efficient, they may form in the external disc and then migrate into the tight orbits (e.g., Ida & Lin, 2010; Kley & Nelson, 2012). Pebble accretion may help embryos grow much further during and after migration (e.g., Lambrechts et al., 2014; Bitsch et al., 2015; Johansen & Lambrechts, 2017; Lambrechts et al., 2019).
Alternatively, rapid inward drift of dust into traps induced by pressure bumps at short-period orbits may retain solid mass fast enough to form embryos and supply their further growth. The dead zone inner boundary (DZIB) may serve this purpose, but recent disc modeling suggested that the DZIB either locates far out or may not induce a pressure bump at all (e.g., Chatterjee & Tan, 2014; Hu et al., 2016, 2018; Jankovic et al., 2021, 2022).
In Li et al. (2022, hereafter Paper I), we proposed and demonstrated that the global pressure maxima induced by magnetospheric truncation in evolved discs may trap dust efficiently, providing a promising formation pathway for close-in super-Earths. Specifically, two sub-pathways for effective dust retention operate at different parameter regimes. When the turbulent relative velocity between dust (correlated with the Shakura–Sunyaev -parameter (Shakura & Sunyaev, 1973) and the gas sound speed ) is relatively low and the threshold velocity for fragmentation is high (e.g., due to the sticky surface layer on dust at a high temperature), or when large solids can be rapidly delivered from the outer disc, a fraction of particles may grow fast and surpass the fragmentation barrier. This process triggers an accelerated accumulation of progressively larger particles, eventually reaching the typical size of planetesimals (referred to as the breakthrough scenario). Conversely, in a different scenario characterized by a high turbulent relative velocity and a low threshold velocity for fragmentation, coagulation growth beyond small grains is highly suppressed. However, when the dust supply from the outer disc is substantial enough to counteract the removal through funnel flows, the overall dust mass can still gradually rise, eventually reaching a point where gravitational instability (GI) produces planetesimals (referred to as the feedback+GI scenario).
Dust retention at the truncation radius , which converges with the corotation radius at low accretion rates (e.g., Long et al. 2005; Bouvier et al. 2007; Romanova et al. 2008; Thanathibodee et al. 2023; Zhu et al. 2023; Pittman et al. in prep.), is of great astrophysical interest by itself even if the accumulated dust does not end up in large terrestrial planets. Dust features at these location are one of the favourable explanations proposed for “dipper” stars (e.g., Bouvier et al., 1999; Cody et al., 2014; Ansdell et al., 2016; Stauffer et al., 2017; Robinson et al., 2021; Capistrant et al., 2022). Moreover, small rocky bodies formed from the accumulated dust near may serve as sources of materials that produce complex periodic variables, a new class of variable star (Bouma et al., 2023).
In Paper I, we adopted an idealized model with a static gas disc for simplicity, which allowed us to focus on a preliminary exploration of dust evolution. In this work, we take into account the dynamical thermal evolution of the gas disc caused by dust accumulation and the resulting changes in dust opacity. Our goal is to understand how opacity-driven thermal evolution affects dust evolution as well as this new planet formation pathway.
The paper is organized as follows. Section 2 first describes our dust evolution model, including our new considerations on dust opacity and disc thermal evolution. Section 3 then presents our simulation results. Finally, Section 4 summarizes our key findings and discusses the important implications.
2 Dust Evolution Model with Opacity and evaporation
We use the implicit dust coagulation-fragmentation code Rubble (Paper I) to model the evolution of dust size distribution, dust surface density, and the thermal evolution between dust and vapour at the dust accumulation radius (i.e. the truncation-induced global pressure maximum) , in a radiative disc model initialized based on Ali-Dib et al. (2020). In this work, Rubble has been upgraded to run on graphics processing units (GPUs) by utilizing PyTorch (Paszke et al., 2019), which greatly speeds up our simulations.
In this section, we briefly reiterate our base numerical scheme to model dust size evolution. Sections 2.2 and 2.3 then describe how Rubble calculates dust opacity and solid evaporation and condensation due to temperature changes. Finally, Section 2.4 details the parameters for our simulations.
2.1 Basic Scheme
Rubble solves the Smoluchowski equation
| (1) |
where is the vertically integrated dust surface number density in a mass bin, is the full kernel that consists of coagulation kernel and fragmentation kernel, which elucidates the likelihood of particles of masses and colliding with each other to produce target mass of .
To relate the total dust surface density and , we define the vertically integrated dust surface density distribution per logarithmic bin of grain radius , and
| (2) |
where
| (3) |
where is the vertically integrated dust surface number density in a logarithmic mass interval and is the quantity that our implicit code actually evolves.
2.2 Opacity and Energy Equation
We calculate the dust opacity from a full size distribution using the prescription from Chen et al. (2020), modified from the single-species opacity formula of Ormel (2014). For each size bin in the dust distribution with characteristic size , the metallicity is where is the gas surface density. The total opacity consisting of the dust and gas opacity is (in cgs units)
| (4) |
where and denote the midplane gas density and temperature, is the dust geometric opacity, and is the efficiency coefficient. The first term in the equation above is the gas opacity that only dominates at high temperature ( K or when the gas is dust-free), and the second term denotes the dust opacity that become dominant below K. The gas opacity which dominates at large temperature is approximated by analytical expressions from Bell & Lin (1994). It will be dominated by dust opacity below 2000K 111In principle, may be non-negligible if the gas density and metallicity is very high, as in the case of planetary atmospheres (Valencia et al., 2013; Freedman et al., 2014). However, it is never the case in the context of the work presented here.. Since this opacity matters in the calculation of radiative energy flux of the gas profile (optical depth ), we need to scale the dust cross section to that of per unit gas mass. Thus,
| (5) |
where is the dust internal density, and , where is the peak wavelength of blackbody radiation from Wien’s law.
The disc thermal evolution is then driven by the following energy equation
| (6) | ||||
| (7) |
where erg g-1 K-1 is the specific heat of hydrogen gas, is the viscous-heating source term (Pringle, 1981) at the corotation radius , where the the viscosity and , where is the gas scale height and is the stellar spin period. Ohmic heating near is negligible and the stellar irradiation is also weak in the inner disc region (Garaud & Lin, 2007). The last two terms on the right hand side are the cooling source terms, where is the radiative cooling term and is the dust-to-vapour evaporation cooling term. For the first cooling term, is the Stefan–Boltzmann constant and is the effective surface temperature, which is approximately related to the midplane temperature as
| (8) |
where is the optical depth and the formula above takes into account both optically thin and optically thick situations. For the second cooling term, is proportional to the dust-to-vapour mass conversion rate per unit area , and is the latent heat needed during dust evaporation.
| Setup | ||||||
| [au] | [K] | [g cm-2] | [g cm-2] | [cm] | ||
| A | 1.00e-3 | 0.00313 | 1880.60 | 1451.70 | 1.22e+02 | 1.47e-02 |
| B | 1.78e-3 | 0.00296 | 1676.09 | 915.96 | 2.70e+00 | 1.56e-02 |
| C | 3.16e-3 | 0.00279 | 1493.82 | 577.93 | 3.73e-02 | 1.65e-02 |
| D | 5.62e-3 | 0.00264 | 1331.37 | 364.65 | 3.02e-04 | 1.75e-02 |
| E | 1.00e-2 | 0.00249 | 1186.58 | 230.08 | 1.36e-06 | 1.86e-02 |
| All available choices∗ of , , and | ||||||
| [cm s-1] | 100, 178, 316, 562, 1000 | |||||
| [cm] | 30, 100, 300, 1000 | |||||
| 0.01, 0.05 | ||||||
NOTE — The simulation parameters (except ) listed in this table are the same as those listed in Table 1 in Paper I (see Section 4.3). For all setups, we assume the stellar radius , the strength of the stellar dipole magnetic field kG, the stellar spin period = 8 days, the ratio between the truncation radius and the dust accumulation radius , the accretion rate e yr-1, and au.
2.3 Evaporation and Condensation
To model the dust evolution that includes evaporation and condensation, we assume most solids are silica (e.g., SiO2) and develop a semi-implicit scheme based on the following equations (Schoonenberg & Ormel, 2017)
| (9) | ||||
| (10) |
where the dust-to-vapour conversion rate is and the vapour-to-dust conversion rate is , where is the vapour surface density and the coefficients
| (11) | ||||
| (12) |
are the evaporation rate and condensation rate, respectively, where is the mean molecular weight for SiO2, is the Boltzmann constant, and is the saturated or equilibrium pressure given by the Clausius-Clapeyron equation
| (13) |
where and are constants depending on the species. For SiO2, we use the empirical formula from Visscher & Fegley (2013, see also )
| (14) |
and assume that there is a finite melted liquid boundary layer, where gives a corresponding latent heat erg g-1.
To solve the evaporation and condensation for dust with a size distribution, we re-write Equations 9 and 10 in a discrete, semi-implicit way
| (15) | ||||
| (16) |
where and denote two consecutive time steps and is the length of a time step. We further substitute with from each mass bin and organize the equations into a linear system
| (17) | ||||
| (18) |
where . Equation 18 represents a series of equations with , where is the total number of dust species in the model. The evolution of evaporation and condensation can be then solved in the matrix format
| (19) |
Since the condensation rate depends on the remaining available solid materials, we impose a tiny surface density floor for dust particles smaller than cm such that vapour can condense back to solids when the temperature drops after a full melt-down. We adopt this idealized prescription due to the non-uniform nature of nucleation in such a turbulent disc environment and its potential enhancement by non-linear effects within local eddies (Tang et al., 2022).
Generally speaking, the timescale for thermal evolution is often much shorter than the timescale needed for dust size distribution evolution. However, our calculations are only computationally feasible with time steps based on the latter. Appendix A demonstrates that our thermal module is numerically robust against these time steps. Furthermore, particles that gain or lose too much mass may leave the original size bin and shift to another one, which is not taken into account in this work. However, we carefully examine the net effects of evaporation and condensation in our simulations and find that the consequent relative mass changes in all bins are only of the order of at each time step, much less than the fractional change needed to shift bins () in our setup.
2.4 Numerical Setup
Table 1 summarizes the physical and numerical parameters for our dust evolution simulations, where we adopt the same disc model outlined in Paper I as the initial conditions (see Sections 2 – 4 therein for detailed descriptions). Similarly, the dust evolution is then determined by the -viscosity, the fragmentation velocity threshold , the dust-to-gas ratio of the accreted materials from the external disc , and the maximum supplied particle size .
In this work, we depart from the conventional approach of initializing all solids with a monodispersed distribution at the micron scale, which results in artificially elevated dust opacity. Instead, the initial dust size distribution follows the MRN power-law distribution, ranging from to cm. This choice enables us to maintain self-consistency with our disc model by normalizing the overall dust surface density to be of the gas surface density and achieve a desired initial opacity of . For the MRN distribution, the value of is relatively insensitive to the initial disc temperature.
The vapour surface density is initialized with the equilibrium value that can be derived from 14 given a certain temperature
| (20) |
where is the initial temperature at disc midplane and denotes gas sound speed. During the evolution, we further assume that the accretion funnels remove vapor in the same manner as gas accretion, i.e., .
Our models take into account all the physical ingredients considered in Paper I (e.g., mass transfer, feedback effects), besides the newly included dust thermal evolution. We again only evolve all the models for yr and consider as the criterion for significant solid accumulation.
In this work, we focus on the temperature evolution of the gas disc following Equation 7 and maintain a constant background gas density at the accumulation site for simplicity. In reality, the gas surface density profile could be altered on the viscous timescale because the inflow of materials tends to smooth out discontinuities in the disc accretion rate , which is directly proportional to . However, this alteration occurs on a timescale significantly longer than the thermal evolution and so we simplify our model by neglecting the time evolution of and . Furthermore, the assumption of a constant breaks down in the limit where the vapour surface density is a significant fraction of , which however is never the case in all of our results.
3 Results
We conduct a suite of local dust evolution simulations, incorporating self-consistent opacity-driven disc thermal evolution, with parameters listed in Table 1. Section 3.1 first presents a set of representative cases and elucidate the interplay between the collisional and thermal dust evolution. Section 3.2 then surveys disc conditions that are required to achieve effective dust retention.
3.1 Fiducial Model
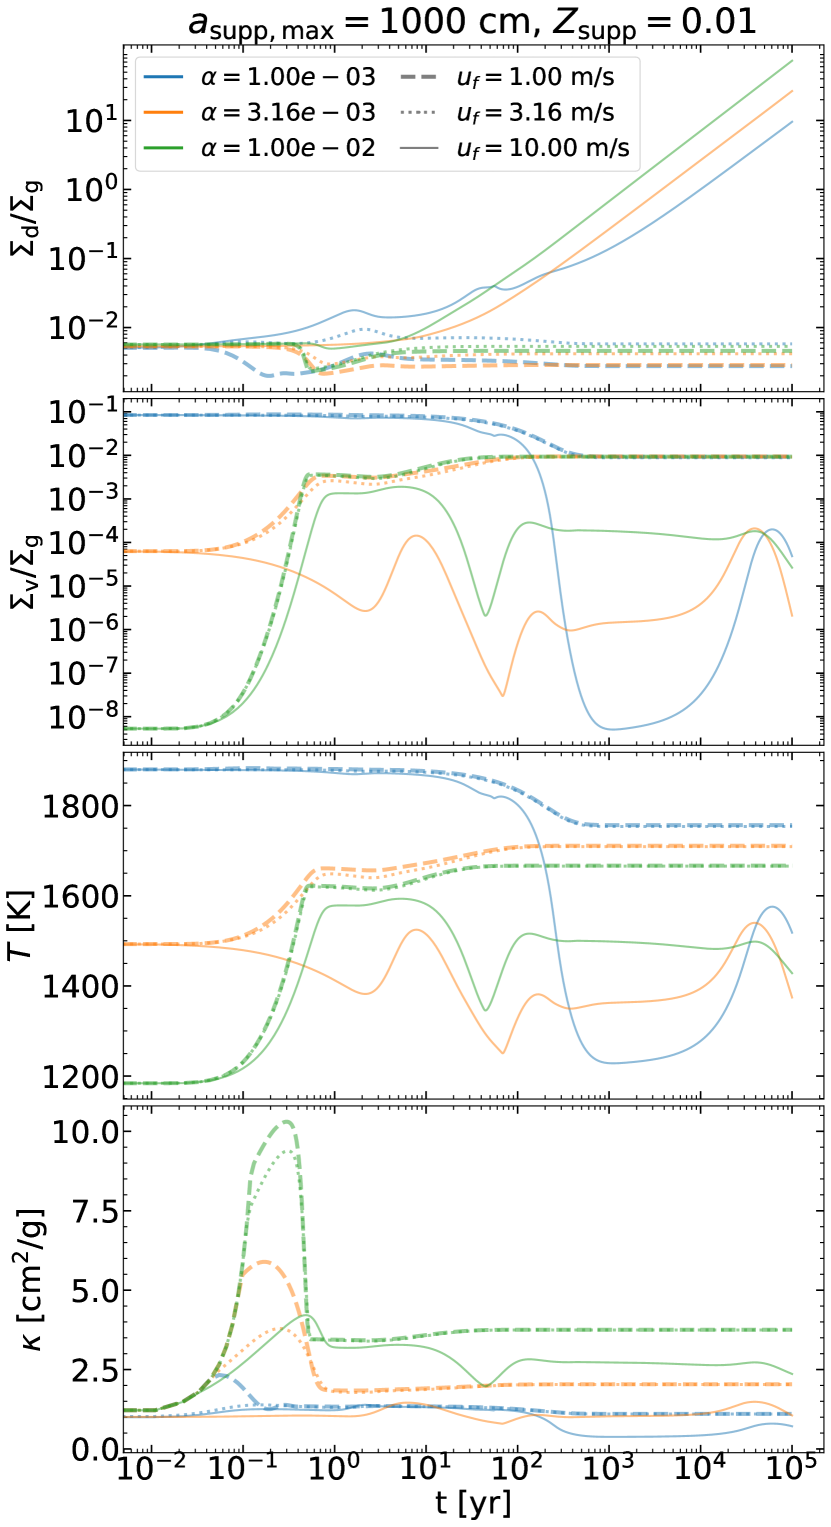
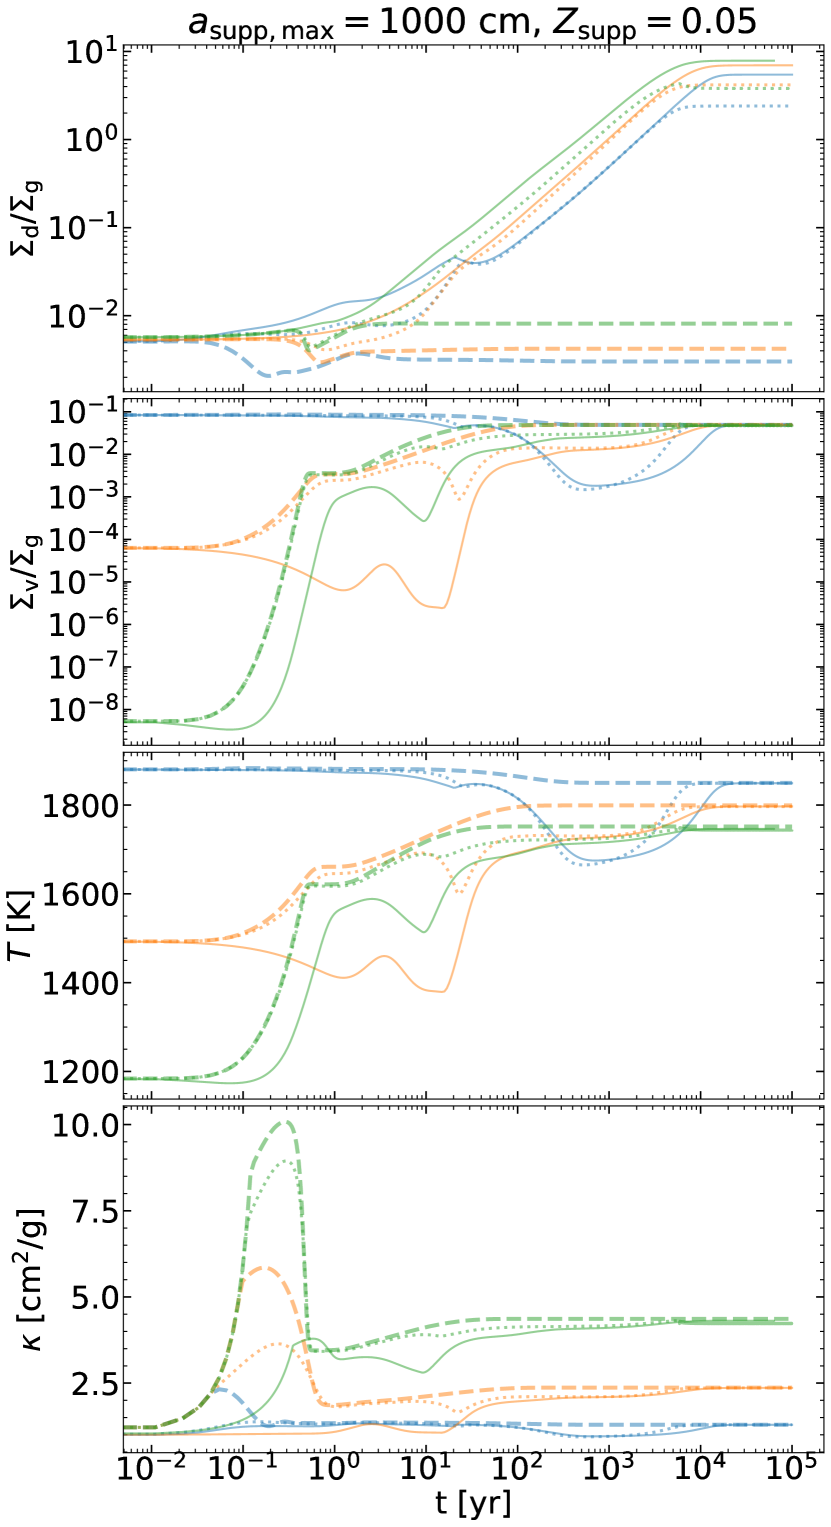
Figs. 1 and 2 compare the time evolution of dust size distribution, the dust/vapour-to-gas ratio, the gas disc temperature, and the total disc opacity between our models with different and , where is fixed to cm and is fixed to .
We find that almost all models experience significant thermal evolution in the very first year, before reaching a steady state or when the external dust supply makes a difference. For cases with a higher and thus a relatively lower initial disc temperature , dust fragments easily and quickly increases the total opacity and disc temperature , unless is high enough. Conversely, in cases with a lower (i.e., higher ), dust particles may melt down faster than fragmentation such that the disc temperature does not change substantially, particularly with a lower where smaller dust dominates.
Efficient breakthrough and sweep-up growth happen in models with a larger , leading to significant dust accumulation. In these cases, the higher fragmentation velocity threshold promotes coagulation and allows the largest supplied particles to pile up, which eventually results in runaway growth and breakthrough. Once there are enough large particles ( cm), sweep-up growth via mass transfer dominates the dust evolution and transports almost all the supplied dust mass into very large particles (Windmark et al., 2012).
Although similar dust retention processes have been seen in Paper I, their dynamic impact to the disc thermal evolution is shown for the first time in this work. We find that the initial pile up of solids near (at yr) cause a deficit of sub-mm dust and consequently a decrease in the total opacity and a sharp drop in the disc temperature. However, a considerably lower disc temperature hinders dust loss due to fragmentation (and funnel flows) and inflates the dust surface density across the entire size distribution, which then in response leads to an upturn for and . After breakthrough happens and most of the solid mass resides in the very large particles, the changes in and become subtle. Furthermore, the final disc temperature always shows a much weaker dependency on in comparison to the initial temperature, regardless of and accompanied by different extent of offset in the opacity from the initial value of unity.
An accelerated external disc dust supply augments the overall reservoir of solid mass, which always facilitates dust accumulation as seen in Paper I. However, when thermal evolution is taken into consideration, this increased supply also elevates the abundance of fine dust particles that raise disc opacity. As illustrated in Figure 2, models with consistently achieve a higher opacity and thus a higher disc temperature when compared to their counterparts in Fig. 2. Therefore, although more cases can generate substantial dust accumulation, the dust-to-gas ratios eventually converge to a plateau after yr, representing a new balance between the thermal evolution and the dust size distribution evolution.
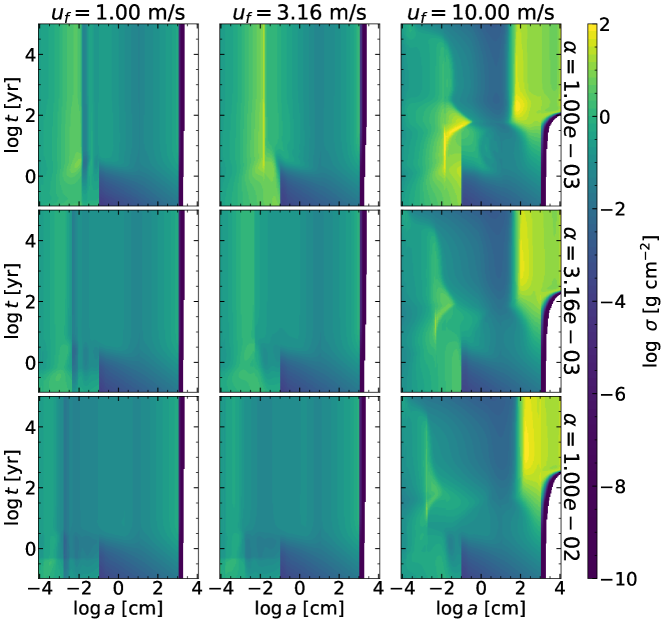
3.2 Threshold for significant dust accumulation
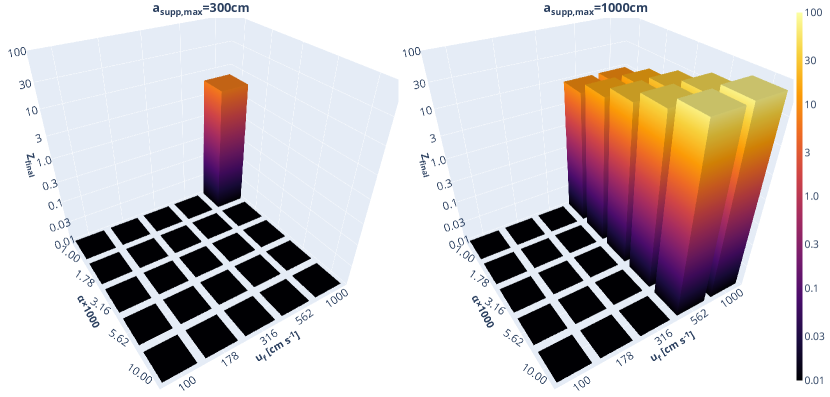
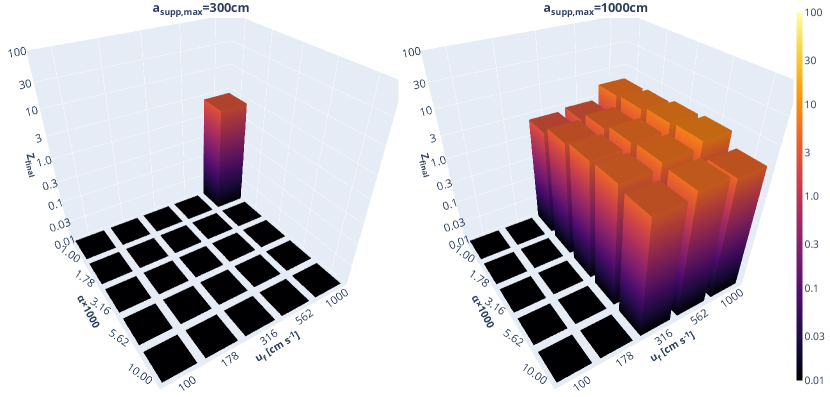
Figs. 4 and 5 present our survey results on parameters listed in Table 1 and show which runs retain substantial dust mass and which do not via the final dust-to-gas ratio . We find that the maximum-supplied size and the fragmentation velocity threshold largely determine the dust evolution, consistent with our findings in the last section. When cm, substantial dust accumulation happens when m s-1 if , or m s-1 if . When , only the corner case (, m s-1) can efficiently retain dust.
As discussed in the previous section, for cm, the number of cases with increases with . However, the values of in these runs with are consistently lower than those in their counterparts with , due to the higher opacity/temperature caused by the richer supply of fine dust grains. Therefore, with thermal evolution taken into account, a larger dust supply may not always yield a positive impact on all aspects of the dust accumulation process. It is possible that a even higher could fully suppress dust retention, which is however beyond the scope of this work given that the choice of is already quite large.
Compared to the previous results that neglected thermal evolution in Paper I, significant accumulation of mm–cm dust through the feedback+GI scenario (i.e., most effective at the low high parameter space) becomes unviable, as small dust particles contribute most to the opacity/temperature enhancement, which in turn quench dust retention. Instead, the breakthrough scenario exhibits a better chance of accumulating solids, with a strong preference for a higher and a moderate preference for a higher , which provides a lower initial disc temperature.
4 Summary and Discussions
In this sequel to our prior work in Paper I, we delve into the intricate dynamic synergy between the local dust distribution evolution and the local disc thermal evolution near the truncated inner boundary of protoplanetary discs. In particular, we improve our model by taking into account the self-consistent intertwined changes, including the change in disc temperature due to the change in opacity, the change in opacity due to the change in dust size distribution, and the evaporation and condensation of solids at all sizes due to the evolving disc temperature.
Our main findings are as follows:
-
•
We find that the dust thermodynamics plays an important role in dust size evolution. Since the total opacity is sensitive to the amount of small ( mm) dust particles, the self-consistent thermal evolution fully suppresses the feedback+GI scenario that builds a mass reservoir in small dust particles until the dust-to-gas ratio exceeds order unity. Thus, significant dust accumulation only happens in the breakthrough scenario that overcomes the fragmentation barrier and builds a mass reservoir in the runaway growth of large rocky particles. Furthermore, the final opacity is self-regulated at the order of a few in all cases, roughly consistent with the assumed unity opacity adopted in the initial radiative disc model.
-
•
A successful breakthrough scenario favours a larger fragmentation velocity threshold and larger particles in the accreted materials from the external disc, which makes breakthrough growth easier. However, a high dust-to-gas ratio in the supplied materials may hinder dust retention as it takes a longer time to process small dust particles in the size distribution evolution, leading to a higher opacity and therefore a hostile higher disc temperature.
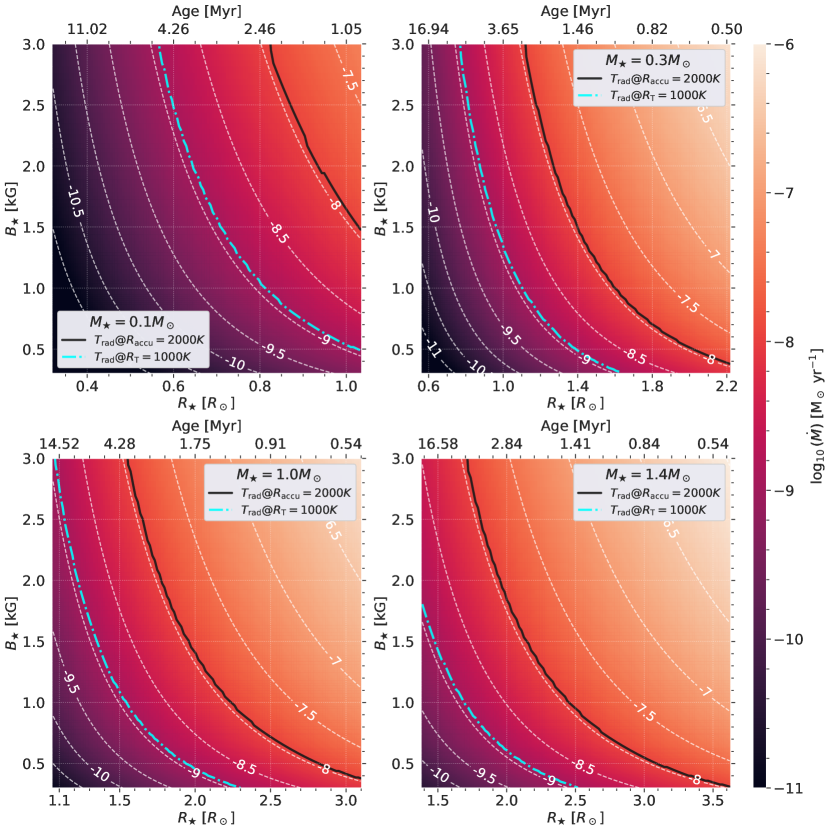
Kunimoto & Matthews (2020) suggested that the occurrence rate of close-in Kepler planets generally increases from early-type to late-type around FGK stars. To explore how the dust evolution scenario proposed in this work varies around stars with different masses, Fig. 6 shows the range of the accretion rate that meets the temperature requirements of our scenario, that is, the initial disc midplane temperature at the truncation radius is above K (such that disc is truncated) and at the dust accumulation radius is below K (such that dust can survive from sublimation), as a function of stellar properties , , and (radius, strength of dipole magnetic field, and mass; similar to Fig. 2 in Paper I).
Under the assumptions of a fixed stellar spin period ( days) and that the corotation radius converges with the truncation radius , we find that the viable accretion rate always 222The reason for the persistent range of is that the disc midplane temperature , where . falls between – yr-1. However, many uncertainties remain. For example, not only evolves with stellar evolution but also exhibits a very broad distribution, particularly for low-mass stars (see Fig. 4 in Reiners et al., 2022). Moreover, decreases with , but with a large scatter within each stellar mass interval. These uncertainties make it hard to pin down the range of stellar age – inferred from based on the stellar evolution model in Baraffe et al. (2015) – for the proposed dust retention scenario to happen.
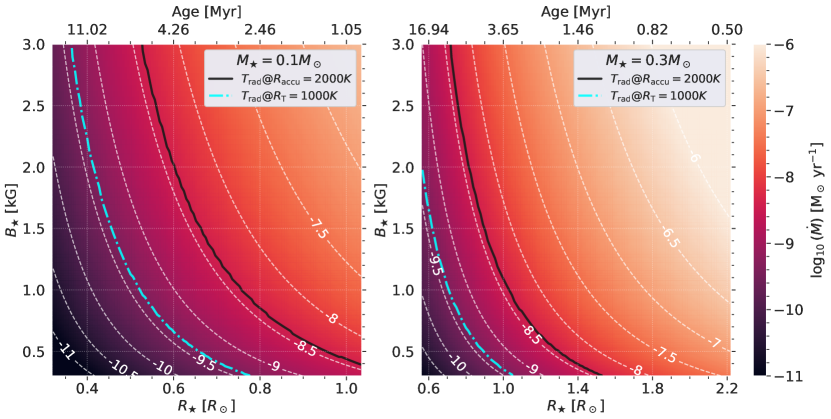
Taking days as an example, Fig. 7 presents the viable accretion rate range for low-mass stars that are rapid rotators. Compared to the slow rotators shown previously in Fig. 6, these rapid ones will need to evolve to an even later stage to set off dust accumulation as the viable range of decreases to – yr-1. This comparison suggests that our proposed scenario for dust retention and potentially subsequent planet formation likely favours slower rotators, which is somewhat more abundant at lower stellar masses (Reiners et al., 2022; Stefánsson et al., 2023), roughly consistent with the occurrence rate findings (Kunimoto & Matthews, 2020).
Acknowledgements
We thank Gibor Basri, Lee Hartmann, Gregory Herczeg, and Caeley Pittman for useful conversation. R.L. acknowledges support from the Heising-Simons Foundation 51 Pegasi b Fellowship.
Data Availability
The data in this article are available from the corresponding author on reasonable request.
References
- Ali-Dib et al. (2020) Ali-Dib M., Cumming A., Lin D. N. C., 2020, MNRAS, 494, 2440
- Ansdell et al. (2016) Ansdell M., et al., 2016, ApJ, 816, 69
- Baraffe et al. (2015) Baraffe I., Homeier D., Allard F., Chabrier G., 2015, A&A, 577, A42
- Bell & Lin (1994) Bell K. R., Lin D. N. C., 1994, ApJ, 427, 987
- Birnstiel et al. (2011) Birnstiel T., Ormel C. W., Dullemond C. P., 2011, A&A, 525, A11
- Bitsch et al. (2015) Bitsch B., Lambrechts M., Johansen A., 2015, A&A, 582, A112
- Bouma et al. (2023) Bouma L. G., Jayaraman R., Rappaport S., Rebull L. M., Hillenbrand L. A., Winn J. N., David-Uraz A., Bakos G. Á., 2023, arXiv e-prints, p. arXiv:2309.06471
- Bouvier et al. (1999) Bouvier J., et al., 1999, A&A, 349, 619
- Bouvier et al. (2007) Bouvier J., Alencar S. H. P., Harries T. J., Johns-Krull C. M., Romanova M. M., 2007, in Reipurth B., Jewitt D., Keil K., eds, Protostars and Planets V. p. 479 (arXiv:astro-ph/0603498)
- Capistrant et al. (2022) Capistrant B. K., et al., 2022, ApJS, 263, 14
- Chatterjee & Tan (2014) Chatterjee S., Tan J. C., 2014, ApJ, 780, 53
- Chen et al. (2020) Chen Y.-X., Li Y.-P., Li H., Lin D. N. C., 2020, ApJ, 896, 135
- Cody et al. (2014) Cody A. M., et al., 2014, AJ, 147, 82
- Dressing & Charbonneau (2015) Dressing C. D., Charbonneau D., 2015, ApJ, 807, 45
- Freedman et al. (2014) Freedman R. S., Lustig-Yaeger J., Fortney J. J., Lupu R. E., Marley M. S., Lodders K., 2014, ApJS, 214, 25
- Fulton et al. (2017) Fulton B. J., et al., 2017, AJ, 154, 109
- Garaud & Lin (2007) Garaud P., Lin D. N. C., 2007, ApJ, 654, 606
- Howard et al. (2010) Howard A. W., et al., 2010, Science, 330, 653
- Hu et al. (2016) Hu X., Zhu Z., Tan J. C., Chatterjee S., 2016, ApJ, 816, 19
- Hu et al. (2018) Hu X., Tan J. C., Zhu Z., Chatterjee S., Birnstiel T., Youdin A. N., Mohanty S., 2018, ApJ, 857, 20
- Ida & Lin (2010) Ida S., Lin D. N. C., 2010, ApJ, 719, 810
- Izidoro et al. (2021) Izidoro A., Bitsch B., Raymond S. N., Johansen A., Morbidelli A., Lambrechts M., Jacobson S. A., 2021, A&A, 650, A152
- Jankovic et al. (2021) Jankovic M. R., Owen J. E., Mohanty S., Tan J. C., 2021, MNRAS, 504, 280
- Jankovic et al. (2022) Jankovic M. R., Mohanty S., Owen J. E., Tan J. C., 2022, MNRAS, 509, 5974
- Johansen & Lambrechts (2017) Johansen A., Lambrechts M., 2017, Annual Review of Earth and Planetary Sciences, 45, 359
- Johnson et al. (2017) Johnson J. A., et al., 2017, AJ, 154, 108
- Kley & Nelson (2012) Kley W., Nelson R. P., 2012, ARA&A, 50, 211
- Kunimoto & Matthews (2020) Kunimoto M., Matthews J. M., 2020, AJ, 159, 248
- Lambrechts et al. (2014) Lambrechts M., Johansen A., Morbidelli A., 2014, A&A, 572, A35
- Lambrechts et al. (2019) Lambrechts M., Morbidelli A., Jacobson S. A., Johansen A., Bitsch B., Izidoro A., Raymond S. N., 2019, A&A, 627, A83
- Li et al. (2022) Li R., Chen Y.-X., Lin D. N. C., 2022, MNRAS, 510, 5246
- Long et al. (2005) Long M., Romanova M. M., Lovelace R. V. E., 2005, ApJ, 634, 1214
- Misener & Schlichting (2022) Misener W., Schlichting H. E., 2022, MNRAS, 514, 6025
- Morbidelli & Raymond (2016) Morbidelli A., Raymond S. N., 2016, Journal of Geophysical Research (Planets), 121, 1962
- Ormel (2014) Ormel C. W., 2014, ApJ, 789, L18
- Paszke et al. (2019) Paszke A., et al., 2019, arXiv e-prints, p. arXiv:1912.01703
- Petigura et al. (2017) Petigura E. A., et al., 2017, AJ, 154, 107
- Petigura et al. (2018) Petigura E. A., et al., 2018, AJ, 155, 89
- Pringle (1981) Pringle J. E., 1981, ARA&A, 19, 137
- Reiners et al. (2022) Reiners A., et al., 2022, A&A, 662, A41
- Robinson et al. (2021) Robinson C. E., Espaillat C. C., Owen J. E., 2021, ApJ, 908, 16
- Romanova et al. (2008) Romanova M. M., Kulkarni A. K., Long M., Lovelace R. V. E., 2008, in Wijnands R., Altamirano D., Soleri P., Degenaar N., Rea N., Casella P., Patruno A., Linares M., eds, American Institute of Physics Conference Series Vol. 1068, A Decade of Accreting MilliSecond X-ray Pulsars. pp 87–94 (arXiv:0812.2890), doi:10.1063/1.3031210
- Schoonenberg & Ormel (2017) Schoonenberg D., Ormel C. W., 2017, A&A, 602, A21
- Shakura & Sunyaev (1973) Shakura N. I., Sunyaev R. A., 1973, A&A, 24, 337
- Stauffer et al. (2017) Stauffer J., et al., 2017, AJ, 153, 152
- Stefánsson et al. (2023) Stefánsson G., et al., 2023, Science, 382, 1031
- Tang et al. (2022) Tang H. Y., Rigopoulos S., Papadakis G., 2022, Journal of Fluid Mechanics, 944, A48
- Thanathibodee et al. (2023) Thanathibodee T., Molina B., Serna J., Calvet N., Hernández J., Muzerolle J., Franco-Hernández R., 2023, ApJ, 944, 90
- Valencia et al. (2013) Valencia D., Guillot T., Parmentier V., Freedman R. S., 2013, ApJ, 775, 10
- Visscher & Fegley (2013) Visscher C., Fegley Bruce J., 2013, ApJ, 767, L12
- Windmark et al. (2012) Windmark F., Birnstiel T., Ormel C. W., Dullemond C. P., 2012, A&A, 544, L16
- Zhu et al. (2018) Zhu W., Petrovich C., Wu Y., Dong S., Xie J., 2018, ApJ, 860, 101
- Zhu et al. (2023) Zhu Z., Stone J. M., Calvet N., 2023, arXiv e-prints, p. arXiv:2309.15318
Appendix A Numerical Tests on Thermodynamics
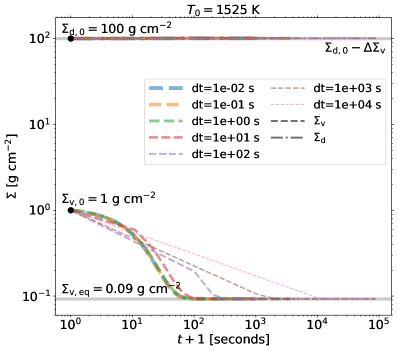
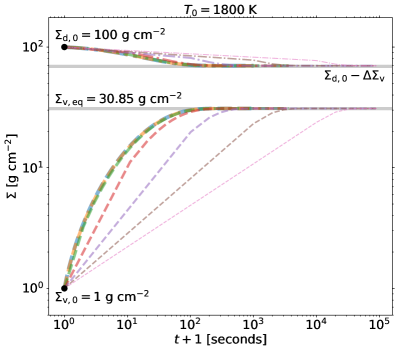
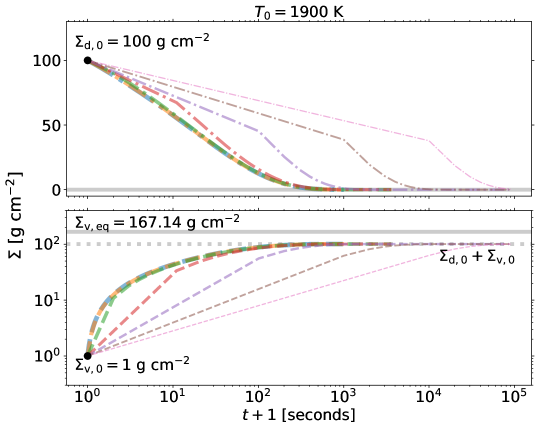
In this section, we test the numerical robustness of the evaporation and condensation module implemented in our code. Particularly, since the timescale for thermal evolution is often much smaller than the timescale for dust size evolution, we do not evolve the dust size distribution and only compute the thermal evolution under a fixed disc temperature against a vast range of time steps, ranging from to seconds.
In all of our tests, we initialize the dust size distribution with an MRN power-law distribution, ranging from and cm, with a total dust surface density of g cm-1. The initial vapour surface density is g cm-1. Under a given temperature, the equilibrium vapour surface density can be derived from Eq. 14 as
| (21) |
where and are the gas scale height and sound speed.
Fig. 8 shows that the evolution of the surface densities of dust and vapour under three different temperatures: K, K, and K. Both and quickly evolve to the expected equilibrium values, regardless of the time step length or the major direction of the thermal evolution (either evaporation or condensation). In the case with , since is larger than the available mass budget, all solids become vapourized.
We have also conducted extra test simulations with different fixed dust size distribution, including monodispersed dust distributions at different sizes, random two-species distributions, or quasi-equilibrium dust distributions in interplanetary discs (Birnstiel et al. 2011; see also Appendix A2 in Paper I), all of which produce similar results. Our comprehensive tests demonstrate that the semi-implicit scheme described in Section 2.3 produces consistent and accurate results, even at a large time steps that are used when computing dust size distribution evolution.