Automating Psychological Hypothesis Generation with AI: Large Language Models Meet Causal Graph
Abstract
Leveraging the synergy between causal knowledge graphs and a large language model (LLM), our study introduces a groundbreaking approach for computational hypothesis generation in psychology. We analyzed 43,312 psychology articles using a LLM to extract causal relation pairs. This analysis produced a specialized causal graph for psychology. Applying link prediction algorithms, we generated 130 potential psychological hypotheses focusing on ‘well-being’, then compared them against research ideas conceived by doctoral scholars and those produced solely by the LLM. Interestingly, our combined approach of a LLM and causal graphs mirrored the expert-level insights in terms of novelty, clearly surpassing the LLM-only hypotheses (t(59) = 3.34, p=0.007 and t(59) = 4.32, p<0.001, respectively). This alignment was further corroborated using deep semantic analysis. Our results show that combining LLM with machine learning techniques such as causal knowledge graphs can revolutionize automated discovery in psychology, extracting novel insights from the extensive literature. This work stands at the crossroads of psychology and artificial intelligence, championing a new enriched paradigm for data-driven hypothesis generation in psychological research.
Keywords: Hypothesis Generation, Causal Reasoning, Large Language Model, Psychological Science, Scientific Discovery
1 Introduction
In an age in which the confluence of artificial intelligence (AI) with various subjects profoundly shapes sectors ranging from academic research to commercial enterprises, dissecting the interplay of these disciplines becomes paramount [williams2023investigating]. In particular, psychology, which serves as a nexus between the humanities and natural sciences, consistently endeavors to demystify the complex web of human behaviors and cognition [hergenhahn2013introduction]. Its profound insights have significantly enriched academia, inspiring innovative applications in AI design. For example, AI models have been molded on hierarchical brain structures [cichy2016comparison] and human attention systems [vaswani2017attention]. Additionally, these AI models reciprocally offer a rejuvenated perspective, deepening our understanding from the foundational cognitive taxonomy to nuanced aesthetic perceptions [battleday2020capturing, tong2021putative]. Nevertheless, the multifaceted domain of psychology, particularly social psychology, has exhibited a measured evolution compared to its tech-centric counterparts. This can be attributed to its enduring reliance on conventional theory-driven methodologies [henrich2010most, shah2015big], a characteristic that stands in stark contrast to the burgeoning paradigms of AI and data-centric research [wang2023scientific, bechmann2019unsupervised].
In the journey of psychological research, each exploration originates from a spark of innovative thought. These research trajectories may arise from established theoretical frameworks, daily event insights, anomalies within data, or intersections of interdisciplinary discoveries [jaccard2019theory]. Hypothesis generation is pivotal in psychology [koehler1994hypothesis, mcguire1973yin], as it facilitates the exploration of multifaceted influencers of human attitudes, actions, and beliefs. The HyGene model [thomas2008diagnostic] elucidated the intricacies of hypothesis generation, encompassing the constraints of working memory and the interplay between ambient and semantic memories. Recently, causal graphs have provided psychology with a systematic framework that enables researchers to construct and simulate intricate systems for a holistic view of “bio-psycho-social” interactions [borsboom2021network, crielaard2022refining]. Yet, the labor-intensive nature of the methodology poses challenges, which requires multidisciplinary expertise in algorithmic development, exacerbating the complexities [crielaard2022refining]. Meanwhile, advancements in AI, exemplified by models such as the generative pretrained transformer (GPT), present new avenues for creativity and hypothesis generation [wang2023scientific].
Building on this, notably large language models (LLMs) such as GPT-3, GPT-4, and Claude-2, which demonstrate profound capabilities to comprehend and infer causality from natural language texts, a promising path has emerged to extract causal knowledge from vast textual data [gu2023conceptgraphs, binz2023using]. Exciting possibilities are seen specific scenarios in which LLMs and causal graphs manifest complementary strengths [pan2023unifying]. Their synergistic combination converges human analytical and systemic thinking, echoing the holistic versus analytic cognition delineated in social psychology [nisbett2001culture]. This amalgamation enables fine-grained semantic analysis and conceptual understanding via LLMs, while causal graphs offer a global perspective on causality, alleviating the interpretability challenges of AI [pan2023unifying]. This integrated methodology efficiently counters the inherent limitations of working and semantic memories in hypothesis generation and, as previous academic endeavors indicate, has proven efficacious across disciplines. For example, a groundbreaking study in physics synthesized 750,000 physics publications, utilizing cutting-edge natural language processing to extract 6,368 pivotal quantum physics concepts, culminating in a semantic network forecasting research trajectories [krenn2020predicting]. Additionally, by integrating knowledge-based causal graphs into the foundation of the LLM, the LLM’s capability for causative inference significantly improves [kiciman2023causal].
To this end, our study seeks to build a pioneering analytical framework, combining the semantic and conceptual extraction proficiency of LLMs with the systemic thinking of the causal graph, with the aim of crafting a comprehensive causal network of semantic concepts within psychology. We meticulously analyzed 43,312 psychological articles, devising an automated method to construct a causal graph, and systematically mining causative concepts and their interconnections. Specifically, the initial sifting and preparation of the data ensures a high-quality corpus, and is followed by employing advanced extraction techniques to identify standardized causal concepts. This results in a graph database that serves as a reservoir of causal knowledge. In conclusion, using node embedding and similarity-based link prediction, we unearthed potential causal relationships, and thus generated the corresponding hypotheses.
To gauge the pragmatic value of our network, we selected 130 hypotheses on ‘well-being’ generated by our framework, comparing them with hypotheses crafted by novice experts (doctoral students in psychology) and the LLM models. The results are encouraging: Our algorithm matches the caliber of novice experts, outshining the hypotheses generated solely by the LLM models in novelty. Additionally, through deep semantic analysis, we demonstrated that our algorithm contains more profound conceptual incorporations and a broader semantic spectrum.
Our study advances the field of psychology in two significant ways. Firstly, it extracts invaluable causal knowledge from the literature and converts it to visual graphics. These aids can feed algorithms to help deduce more latent causal relations and guide models in generating a plethora of novel causal hypotheses. Secondly, our study furnishes novel tools and methodologies for causal analysis and scientific knowledge discovery, representing the seamless fusion of modern AI with traditional research methodologies. This integration serves as a bridge between conventional theory-driven methodologies in psychology and the emerging paradigms of data-centric research, thereby enriching our understanding of the factors influencing psychology, especially within the realm of social psychology.
2 Methodological Framework for Hypothesis Generation
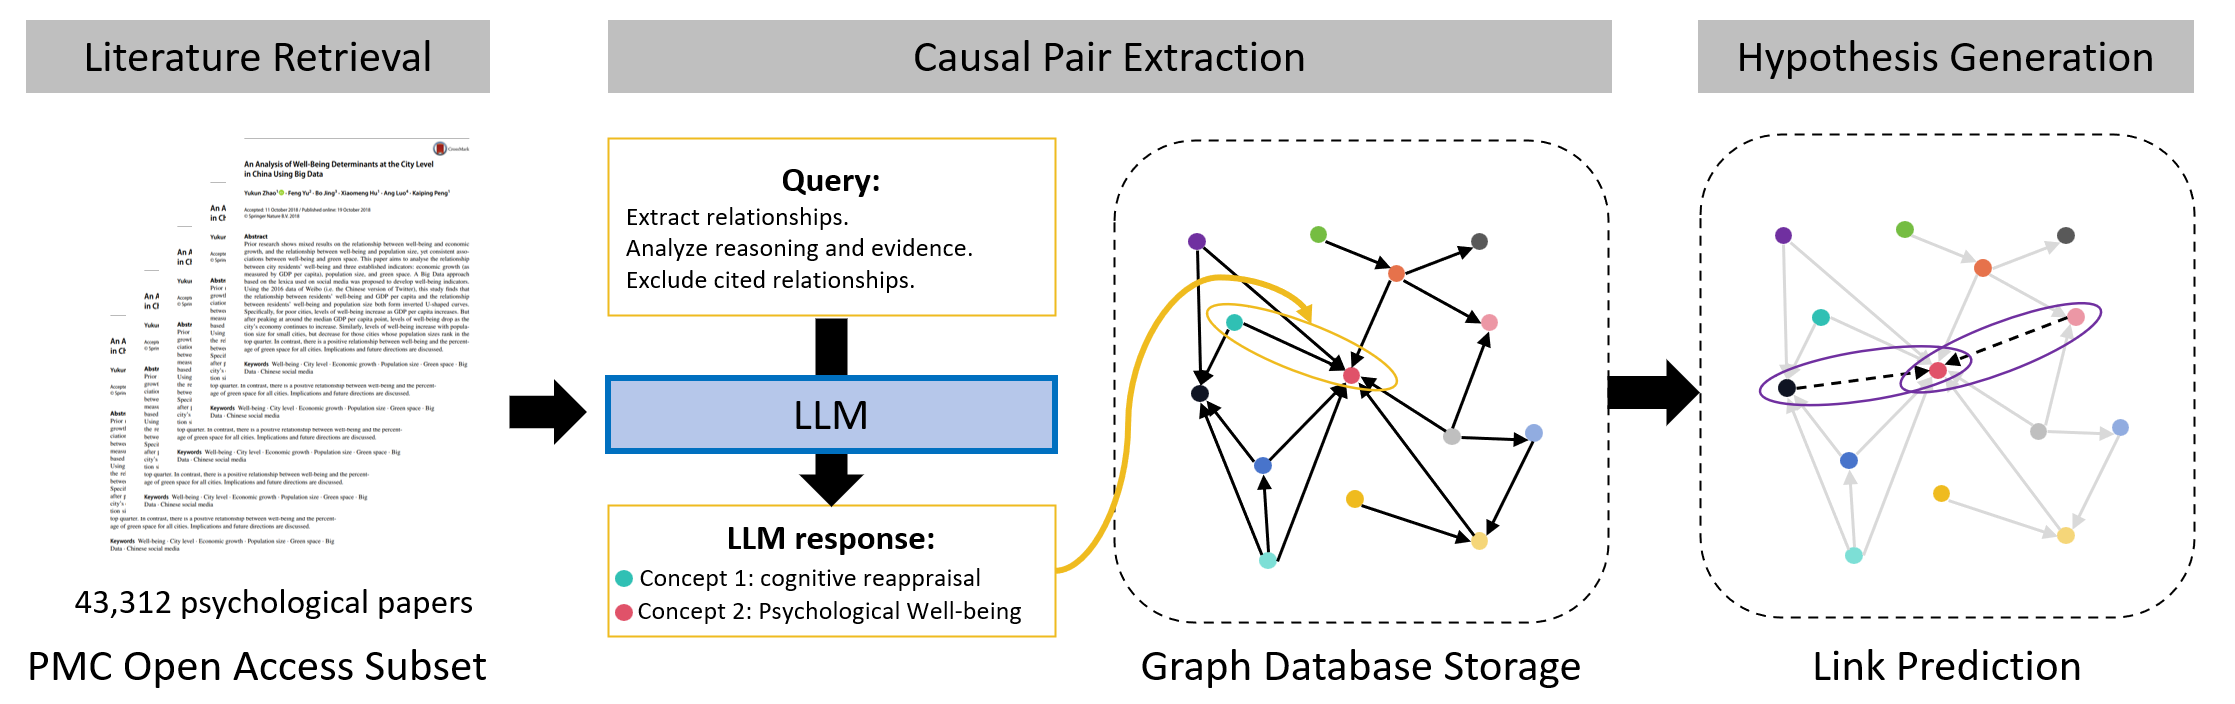
The proposed LLM-based causal graph (LLMCG) framework encompasses three steps: literature retrieval, causal pair extraction, and hypothesis generation, as illustrated in Figure 1. In the literature gathering phase, approximately 140K psychology-related articles were downloaded from public databases. In step two, GPT-4 were used to distill causal relationships from these articles, culminating in the creation of a causal relationship network based on 43,312 selected articles. In the third step, an in-depth examination of these data was executed, adopting link prediction algorithms to forecast the dynamics within the causal relationship network for searching the highly potential causality concept pairs.
2.1 Step 1: Literature Retrieval
The primary data source for this study was a public repository of scientific articles, the PMC Open Access Subset. Our decision to utilize this repository was informed by several key attributes that it possesses. The PMC Open Access Subset boasts an expansive collection of over 2 million full-text XML science and medical articles, providing a substantial and diverse base from which to derive insights for our research. Furthermore, the open-access nature of the articles not only enhances the transparency and reproducibility of our methodology, but also ensures that the results and processes can be independently accessed and verified by other researchers. Notably, the content within this subset originates from recognized journals, all of which have undergone rigorous peer review, lending credence to the quality and reliability of the data we leveraged. Finally, an added advantage was the rich metadata accompanying each article. These metadata were instrumental in refining our article selection process, ensuring coherent thematic alignment with our research objectives in the domains of psychology.
To identify articles relevant to our study, we applied a series of filtering criteria. First, the presence of certain keywords within article titles or abstracts was mandatory. Some examples of these keywords include ‘psychol’, ‘clin psychol’, and ‘biol psychol’. Second, we exploited the metadata accompanying each article. The classification of articles based on these metadata ensured alignment with recognized thematic standards in the domains of psychology and neuroscience. Upon the application of these criteria, we managed to curate a subset of approximately 140K articles that most likely discuss causal concepts in both psychology and neuroscience.
2.2 Step 2: Causal Pair Extraction
The process of extracting causal knowledge from vast troves of scientific literature is intricate and multifaceted. Our methodology distills this complex process into four coherent steps, each serving a distinct purpose. (1) Article selection and cost analysis: Determines the feasibility of processing a specific volume of articles, ensuring optimal resource allocation. (2) Text extraction and analysis: Ensures the purity of the data that enter our causal extraction phase by filtering out nonrelevant content. (3) Causal knowledge extraction: Uses advanced language models to detect, classify, and standardize causal factors relationships present in texts. (4) Graph database storage: Facilitates structured storage, easy retrieval, and the possibility of advanced relational analyses for future research. This streamlined approach ensures accuracy, consistency, and scalability in our endeavor to understand the interplay of causal concepts in psychology and neuroscience.
2.2.1 Text extraction and cleaning.
After a meticulous cost analysis detailed in Appendix A.1, our selection process identified 43,312 articles. This selection was strategically based on the criterion that the journal titles must incorporate the term ‘Psychol’, signifying their direct relevance to the field of psychology. The distributions of publication sources and years can be found in Table 1. Extracting the full texts of the articles from their PDF sources was an essential initial step, and, for this purpose, the PyPDF2 Python library was used. This library allowed us to seamlessly extract and concatenate titles, abstracts, and main content from each PDF article. However, a challenge arose with the presence of extraneous sections such as references or tables, in the extracted texts. The implemented procedure, employing regular expressions in Python, was not only adept at identifying variations of the term ‘references’ but also ascertained whether this section appeared as an isolated segment. This check was critical to ensure that the identified that the ‘references’ section was indeed distinct, marking the start of a reference list without continuation into other text. Once identified as a standalone entity, the next step in the method was to efficiently remove the reference section and its subsequent content.
| Source of Publications | Quantity |
| Frontiers in Psychology | 35,797 |
| BMC Psychology | 1,154 |
| Journal of Psychological Medicine and Mental Pathology | 687 |
| Psychological Medicine | 659 |
| European Journal of Investigation in Health Psychology and Education | 384 |
| European Journal of Psychology | 369 |
| Psychological Research | 305 |
| Health Psychology and Behavioral Medicine | 277 |
| Current Psychology | 227 |
| Journal of Child Psychology and Psychiatry | 202 |
| Others | 3,251 |
| Total | 43,312 |
| Publication Year (1975-2023) | Quantity |
| 2023 | 2,391 |
| 2022 | 9,876 |
| 2021 | 7,286 |
| 2020 | 4,416 |
| 2019 | 3,465 |
| Others | 15,878 |
| Total | 43,312 |
2.2.2 Causal knowledge extraction method.
In our effort to extract causal knowledge, the choice of GPT-4 was not arbitrary. While several models were available for such tasks, GPT-4 emerged as a frontrunner due to its advanced capabilities [wu2023comparative], extensive training on diverse data, with its proven proficiency in understanding context, especially in complex scientific texts [cheng2023exploring, sanderson2023gpt]. Other models were indeed considered; however, the capacity of GPT-4 to generate coherent, contextually relevant responses gave our project an edge in its specific requirements.
The extraction process commenced with the segmentation of the articles. Due to the token constraints inherent to GPT-4, it was imperative to break down the articles into manageable chunks, specifically those of 4,000 tokens or fewer. This approach ensured a comprehensive interpretation of the content without omitting any potential causal relationships. The next phase was prompt engineering. To effectively guide the extraction capabilities of GPT-4, we crafted explicit prompts. A testament to this meticulous engineering is demonstrated in a directive in which we asked the model to elucidate causal pairs in a predetermined JSON format. For a clearer understanding, readers are referred to Table 2, which elucidates the example prompt and the subsequent model response. After extraction, the outputs were not immediately cataloged. A filtering process was initiated to ascertain the standardization of the concept pairs. This process weeded out suboptimal outputs. Aiding in this quality control, GPT-4 played a pivotal role in the verification of causal pairs, determining their relevance, causality, and ensuring correct directionality. Finally, while extracting knowledge, we were aware of the constraints imposed by the GPT-4 API. There was a conscious effort to ensure that we operated within the bounds of 60 requests and 150k tokens per minute. This interplay of prompt engineering and stringent filtering was productive.
In addition, we conducted an exploratory study to assess GPT-4’s discernment between ‘causality’ and ‘correlation’ involved four graduate students (mean age 31 10.23), each evaluating relationship pairs extracted from their familiar psychology articles. The experimental details and results can be found in Appendix A.1 and Table 8. The results showed that out of 289 relationships identified by GPT-4, 87.54% were validated. Notably, when GPT-4 classified relationships as causal, only 13.02 % (31/238) were recognized as non-relationship, while 65.55% (156/238) agreed upon as causality. This shows that GPT-4 can accurately extract relationships (causality or correlation) in psychological texts, underscoring the potential as a tool for the construction of causal graphs.
To enhance the robustness of the extracted causal relationships and minimize biases, we adopted a multifaceted approach. Recognizing the indispensable role of human judgment, we periodically subjected random samples of extracted causal relationships to the scrutiny of domain experts. Their valuable feedback was instrumental in the real-time fine-tuning the extraction process. Instead of heavily relying on referenced hypotheses, our focus was on extracting causal pairs, primarily from the findings mentioned in the main texts. This systematic methodology ultimately resulted in a refined text corpus distilled from 43,312 articles, which contained many conceptual insights and were primed for rigorous causal extraction.
| Prompt: |
| From the "text" below, extract the key causal and correlational relationships described directly in the given text by analysing reasoning and evidence within the text. Exclude any relationships that are attributed to or cited from other research studies. |
| Format the relationships in JSON format with the following fields: |
| ‘concept_pair’: A list representation of the cause and effect concepts in the relationship, in [cause, effect] order. |
| ‘relationship’: ‘causality’ or ‘correlation’ indicating the type of relationship. |
| ‘positive/negative’: If the extracted relationship is causality, indicate whether it’s a positive or negative causality relationship. If it’s a correlation relationship, reply as None. |
| { |
| "PMC8451848", |
| ‘concept_pair’: [openness to change values, well-being], |
| ‘relationship’:"causality", |
| ‘positive/negative’:"positive" |
| }, |
| { |
| "PMC6085571", |
| ‘concept_pair’: [cognitive reappraisal, Psychological well-being], |
| ‘relationship’:"causality", |
| ‘positive/negative’:"positive" |
| } |
| Number | Concepts | Degree(in) |
|---|---|---|
| 1 | Depression | 2,002 |
| 2 | Anxiety | 1,606 |
| 3 | Life satisfaction | 890 |
| 4 | Well-being | 874 |
| 5 | Performance | 834 |
| 6 | Depressive symptoms | 812 |
| 7 | Mental health | 764 |
| 8 | Microglial activation | 734 |
| 9 | Accuracy | 720 |
| 10 | Psychological distress | 631 |
| 11 | Job satisfaction | 623 |
| 12 | Cognitive impairment | 603 |
| 13 | Neurodegeneration | 597 |
| 14 | Stress | 557 |
| 15 | Self-efficacy | 549 |
| 16 | Neuroinflammation | 541 |
| 17 | Oxidative stress | 536 |
| 18 | Age | 533 |
| 19 | Neuroprotection | 505 |
| 20 | Resilience | 492 |
2.2.3 Graph database storage.
Our decision to employ Neo4j as the database system was strategic. Neo4j, as a graph database [thomer2020relational], is inherently designed to capture and represent complex relationships between data points, an attribute that is essential for understanding intricate causal relationships. Beyond its technical prowess, Neo4j provides advantages such as scalability, resilience, and efficient querying capabilities [webber2012programmatic]. It is particularly adept at traversing interconnected data points, making it an excellent fit for our causal relationship analysis. The mined causal knowledge finds its abode in the Neo4j graph database. Each pair of causal concepts is represented as a node, with its directionality and interpretations stored as attributes. Relationships provide related concepts together. Storing the knowledge graph in Neo4j allows for the execution of the graph algorithms to analyze concept interconnectivity and reveal potential relationships.
The graph database contains 197K concepts and 235K connections. Table 3 encapsulates the core concepts and provides a vivid snapshot of the most recurring themes; helping us to understand the central topics that dominate the current psychological discourse. A comprehensive examination of the core concepts extracted from 43,312 psychological papers, several distinct patterns and focal areas emerged. In particular, there is a clear balance between health and illness in psychological research. The prominence of terms such as ‘depression’, ‘anxiety’, and ‘symptoms of depression magnifies the commitment in the discipline to understanding and addressing mental illnesses. However, juxtaposed against these are positive terms such as ‘life satisfaction’ and ‘sense of happiness’, suggesting that psychology not only fixates on challenges but also delves deeply into the nuances of positivity and well-being. Furthermore, the significance given to concepts such as ‘life satisfaction’, ‘sense of happiness’, and ‘job satisfaction’ underscores an increasing recognition of emotional well-being and job satisfaction as integral to overall mental health. Intertwining the realms of psychology and neuroscience, terms such as ‘microglial cell activation’, ‘cognitive impairment’, and ‘neurodegenerative changes’ signal a growing interest in understanding the neural underpinnings of cognitive and psychological phenomena. In addition, the emphasis on ‘self-efficacy’, ‘positive emotions’, and ‘self-esteem’ reflect the profound interest in understanding how self-perception and emotions influence human behavior and well-being. Concepts such as ‘age’, ‘resilience’, and ‘creativity’ further expand the canvas, showcasing the eclectic and comprehensive nature of inquiries in the field of psychology.
Overall, this analysis paints a vivid picture of modern psychological research, illuminating its multidimensional approach. It demonstrates a discipline that is deeply engaged with both the challenges and triumphs of human existence, offering holistic insight into the human mind and its myriad complexities.
| Concept 1 | Concept 2 | Hypothesis |
|---|---|---|
| Microbiome diversity | Well-being | Pandemic flourishing : Some individuals may experience a sense of ‘flourishing’ or thriving during pandemic events despite the widespread stress and adversity. |
| Divergent thinking exercises | Well-being | Divergent thinking exercises can expand one’s sense of self and purpose, which then synergistically improve well-being through an upward spiral. Engaging in creative thinking exercises can broaden one’s perspectives on identity and meaning in life. This expanded sense of self and purpose may then mutually reinforce each other and spiral upward to enhance well-being. |
| Online social connectivity | Well-being | Virtual resilience: Online social connectivity and access to well-being resources can build ‘virtual resilience’ and enhance well-being during stressful events like pandemics. |
| Sense of shared purpose and belonging | Well-being | A sense of shared purpose and belonging within your social groups is necessary for freedom, choice and self-determination to enhance well-being. |
2.3 Step 3: Hypothesis Generation using Link Prediction
In the quest to uncover novel causal relationships beyond direct extraction from texts, the technique of link prediction emerges as a pivotal methodology. It hinges on the premise of proposing potential causal ties between concepts that our knowledge graph does not explicitly connect. The process intricately weaves together vector embedding, similarity analysis, and probability-based ranking. Initially, concepts are transposed into a vector space using node2vec, which is valued for its ability to capture topological nuances. Here, every pair of unconnected concepts is assigned a similarity score, and pairs that do not meet a set benchmark are quickly discarded. As we dive deeper into the higher echelons of these scored pairs, the likelihood of their linkage is assessed using the Jaccard similarity of their neighboring concepts. Subsequently, these potential causal relationships are organized in descending order of their derived probabilities, and the elite pairs are selected.
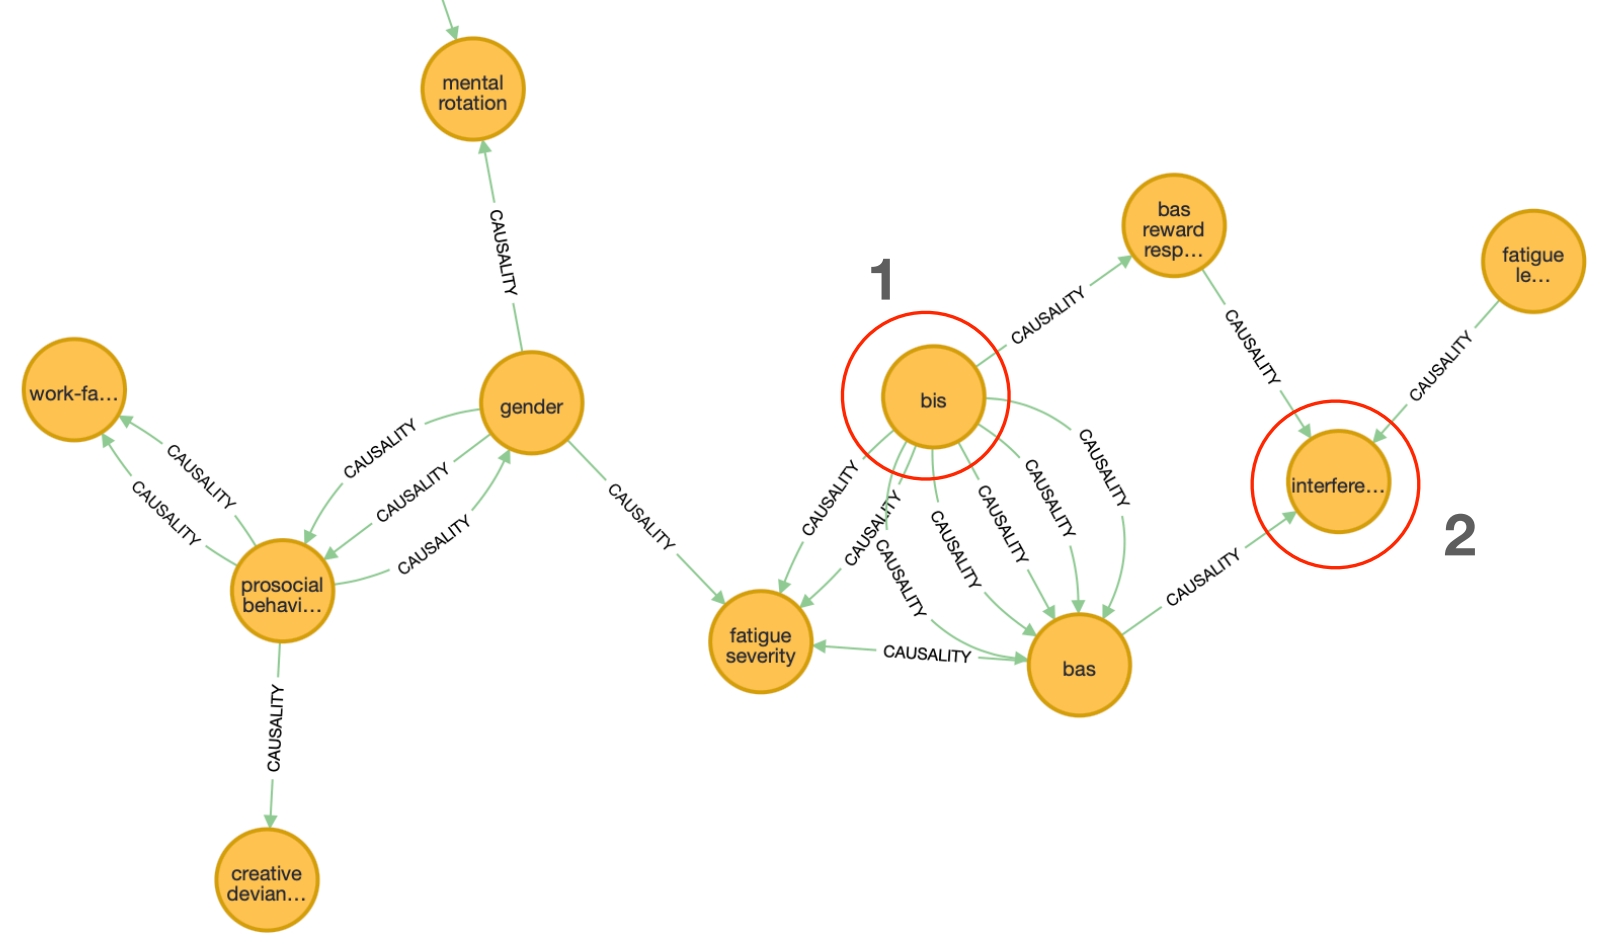
An illustration of this approach is provided in the case highlighted in Figure 5. For instance, the behavioral inhibition system (BIS) exhibits ties to both the behavioral activation system (BAS) and the subsequent behavioral response of the BAS when encountering reward stimuli, termed the BAS reward response. Simultaneously, another concept, interference, finds itself bound to both the BAS and the BAS Reward Response. This configuration hints at a plausible link between the BIS and interference. Such highly probable causal pairs are not mere intellectual curiosity. They act as springboards, catalyzing the genesis of new experimental designs or research hypotheses ripe for empirical probing. In essence, this capability equips researchers with a cutting-edge instrument, empowering them to navigate the unexplored waters of the psychological and neurological domains.
Using pairs of highly probable causal concepts, we pushed GPT-4 to conjure novel causal hypotheses that bridge concepts. To further elucidate the process of this method, Table 4 provides some examples of hypotheses generated from the process. Such hypotheses, as exemplified in the last row, underscore the potential and power of our method for generating innovative causal propositions.
3 Hypotheses Evaluation and Results
In this section, we present an analysis focusing on quality in terms of novelty and usefulness of the hypotheses generated. According to existing literature, these dimensions are instrumental in encapsulating the essence of inventive ideas [boden2009computer, mccarthy2018novelty, miron2015motivating]. These parameters have not only been quintessential for gauging creative concepts, but they have also been adopted to evaluate the caliber of research hypotheses [oleinik2019neural, dowling2023chatgpt, krenn2020predicting]. Specifically, we evaluate the quality of the hypotheses generated by the proposed LLMCG algorithm in relation to those generated by PhD students from an elite university who represent human junior experts, the LLM model, which represents advanced AI systems, and the research ideas refined by psychological researchers which represents cooperation between AI and humans.
The evaluation comprises three main stages. In the first stage, the hypotheses are generated by all contributors, including steps taken to ensure fairness and relevance for comparative analysis. In the second stage, the hypotheses from the first stage are independently and blindly reviewed by experts who represent the human academic community. These experts are asked to provide hypothesis ratings using a specially designed questionnaire to ensure statistical validity. The third stage delves deeper by transforming each research idea into the semantic space of a bidirectional encoder representations from transformers (BERT) [lee2023natural], allowing us to intricately analyze the intrinsic reasons behind the rating disparities among the groups. This semantic mapping not only pinpoints the nuanced differences, but also provides potential insights into the cognitive constructs of each hypothesis.
3.1 Evaluation Procedure
3.1.1 Selection of the focus area for hypothesis generation.
Selecting an appropriate focus area for hypothesis generation is crucial to ensure a balanced and insightful comparison of the hypothesis generation capacities between various contributors. In this study, our goal is to gauge the quality of hypotheses derived from four distinct contributors, with measures in place to mitigate potential confounding variables that might skew the results among groups [rubin2005causal]. Our choice of domain is informed by two pivotal criteria: the intricacy and subtlety of the subject matter and familiarity with the domain. It is essential that our chosen domain boasts sufficient complexity to prompt meaningful hypothesis generation and offer a robust assessment of both AI and human contributors’ depth of understanding and creativity. Furthermore, while human contributors should be well-acquainted with the domain, their expertise need not match the vast corpus knowledge of the AI.
In terms of overarching human pursuits such as the search for happiness, positive psychology distinguishes itself by avoiding narrowly defined, individual-centric challenges [seligman2000positive]. This alignment with our selection criteria is epitomized by well-being, a salient concept within positive psychology, as shown in Table 3. Well-being, with its multidimensional essence that encompass emotional, psychological, and social facets, and its central stature in both research and practical applications of positive psychology [seligman2000positive, fredrickson2001role, diener2010new], becomes the linchpin of our evaluation. The growing importance of well-being in the current global context offers myriad novel avenues for hypothesis generation and theoretical advancement [otu2020mental, madill2022mainstreaming, forgeard2011doing]. Adding to our rationale, the Positive Psychology Research Center at Tsinghua University is a globally renowned hub for cutting-edge research in this domain. Leveraging this stature, we secured participation from specialized PhD students, reinforcing positive psychology as the most fitting domain for our inquiry.
3.1.2 Hypotheses comparison.
In our study, the generated psychological hypotheses were categorized into four distinct groups, consisting of two experimental groups and two control groups. The experimental groups encapsulate hypotheses generated by our algorithm, either through random selection or handpicking by experts from a pool of generated hypotheses. On the other hand, control groups comprise research ideas that were meticulously crafted by doctoral students with substantial academic expertise in the domains and hypotheses generated by representative LLMs. In the following, we elucidate the methodology and underlying rationale for each group:
LLMCG algorithm output (Random-selected LLMCG): Following to the requirement of generating hypotheses centered on well-being, the LLMCG algorithm crafted 130 unique hypotheses. These hypotheses were derived by LLMCG’s evaluation of the most likely causal relationships related to well-being that had not been previously documented research literature dataset. From this refined pool, 30 research ideas were chosen at random for this experimental group. These hypotheses represent the algorithm’s ability to identify causal relationships and formulate pertinent hypotheses.
LLMCG expert-vetted hypotheses (Expert-selected LLMCG): For this group, two seasoned psychological researchers, one male aged 47 and one female aged 46, in-depth expertise in the realm of Positive Psychology, conscientiously handpicked 30 of the most promising hypotheses from the refined pool, excluding those from the Random-selected LLMCG category. The selection criteria centered on a holistic understanding of both the novelty and practical relevance of each hypothesis. With an illustrious postdoctoral journey and a robust portfolio of publications in positive psychology to their names, they rigorously sifted through the hypotheses, pinpointing those that showcased a perfect confluence of originality and actionable insight. These hypotheses were meticulously appraised for their relevance, structural coherence, and potential academic value, representing the nexus of machine intelligence and seasoned human discernment.
PhD students’ output (Control-Human): We enlisted the expertise of 16 doctoral students from the Positive Psychology Research Center at Tsinghua University. Under the guidance of their supervisor, each student was provided with a questionnaire geared toward research on well-being. The participants were given a period of four working days to complete and return the questionnaire, which was distributed during vacation to ensure minimal external disruptions and commitments. The specific instructions provided in the questionnaire is detailed in Table 9, and each participant was asked to complete 3-4 research hypotheses. By the stipulated deadline, we received responses from 13 doctoral students, with a mean age of 31.92 years (SD = 7.75 years), cumulatively presenting 41 hypotheses related to well-being. To maintain uniformity with the other groups, a random selection was made to shortlist 30 hypotheses for further analysis. These hypotheses reflect the integration of core theoretical concepts with the latest insights into the domain, presenting an academic interpretation rooted in their rigorous training and education. Including this group in our study not only provides a natural benchmark for human ingenuity and expertise but also underscores the invaluable contribution of human cognition in research ideation, serving as a pivotal contrast to AI-generated hypotheses. This juxtaposition illuminates the nuanced differences between human intellectual depth and AI’s analytical progress, enriching the comparative dimensions of our study.
Claude model output (Control-Claude): This group exemplifies the pinnacle of current LLM technology in generating research hypotheses. Since LLMCG is a nascent technology, its assessment requires a comparative study with well-established counterparts, creating a key paradigm in comparative research. Currently, Claude-2 and GPT-4 represent the apex of AI technology. For example, Claude-2, with an accuracy rate of 54. 4% excels in reasoning and answering questions, substantially outperforming other models such as Falcon, Koala and Vicuna, which have accuracy rates of 17.1%-25.5% [wu2023comparative]. To facilitate a more comprehensive evaluation of the new model by researchers and to increase the diversity and breadth of comparison, we chose Claude-2 as the control model. Using the detailed instructions provided in Table 10, Claude-2 was iteratively prompted to generate research hypotheses, generating ten hypotheses per prompt, culminating in a total of 50 hypotheses. Although the sheer number and range of these hypotheses accentuate the capabilities of Claude-2, to ensure compatibility in terms of complexity and depth between all groups, a subsequent refinement was considered essential. With minimal human intervention, GPT-4 was used to evaluate these 50 hypotheses and select the top 30 that exhibited the most innovative, relevant, and academically valuable insights. This process ensured the infusion of both the LLM’s analytical prowess and a layer of qualitative rigor, thus giving rise to a set of hypotheses that not only align with the overarching theme of well-being but also resonate with current academic discourse.
3.1.3 Hypotheses assessment.
The assessment of the hypotheses encompasses two key components: the evaluation conducted by eminent psychology professors emphasizing novelty and utility, and the deep semantic analysis involving BERT and -distributed stochastic neighbor embedding (-SNE) visualization to discern semantic structures and disparities among hypotheses.
Human academic community. The review task was entrusted to three eminent psychology professors (all male, mean age = 42.33), who have a decade-long legacy in guiding doctoral and master’s students in positive psychology and editorial stints in renowned journals; their task was to conduct a meticulous evaluation of the 120 hypotheses. Importantly, to ensure unbiased evaluation, the hypotheses were presented to them in a completely randomized order in the questionnaire.
Our emphasis was undeniably anchored to two primary tenets: novelty and utility [yu2016semantic, shardlow2018identification, thompson2023scope, cohen2017should], as shown in Table 11. Utility in hypothesis crafting demands that our propositions extend beyond mere factual accuracy; they must resonate deeply with academic investigations, ensuring substantial practical implications. Given the inherent challenges of research, marked by constraints in time, manpower, and funding, it is essential to design hypotheses that optimize the utilization of these resources. On the novelty front, we strive to introduce innovative perspectives that have the power to challenge and expand upon existing academic theories. This not only propels the discipline forward but also ensures that we do not inadvertently tread on ground already covered by our contemporaries.
Deep semantic analysis. While human evaluations provide invaluable insight into the novelty and utility of hypotheses, to objectively discern and visualize semantic structures and the disparities among them, we turn to the realm of deep learning. Specifically, we employ the power of BERT [devlin2018bert]. BERT, as highlighted by [lee2023natural], had a remarkable potential to assess the innovation of ideas. By translating each hypothesis into a high-dimensional vector in the BERT domain, we obtain the profound semantic core of each statement. However, such granularity in dimensions presents challenges when aiming for visualization.
To alleviate this and to intuitively understand the clustering and dispersion of these hypotheses in semantic space, we deploy the -SNE (-distributed Stochastic Neighbor Embedding) technique [van2008visualizing], which is adept at reducing the dimensionality of the data while preserving the relative pairwise distances between the items. Thus, when we map our BERT-encoded hypotheses onto a 2D -SNE plane, an immediate visual grasp on how closely or distantly related our hypotheses are in terms of their semantic content. Our intent is twofold: to understand the semantic terrains carved out by the different groups and to infer the potential reasons for some of the hypotheses garnered heightened novelty or utility ratings from experts. The convergence of human evaluations and semantic layouts, as delineated by Algorithm 1, reveal the interplay between human intuition and the inherent semantic structure of the hypotheses.
3.2 Results
3.2.1 Qualitative analysis by topic analysis
To better understand the underlying thought processes and the topical emphasis of both PhD students and the LLMCG model, qualitative analyses were performed using visual tools such as word clouds and connection graphs, as detailed in Appendix B.1. The word cloud, as a graphical representation, effectively captures the frequency and importance of terms, providing direct visualization of the dominant themes. Connection graphs, on the other hand, elucidate the relationships and interplay between various themes and concepts. Using these visual tools, we aimed to achieve a more intuitive and clear representation of the data, allowing for easy comparison and interpretation.
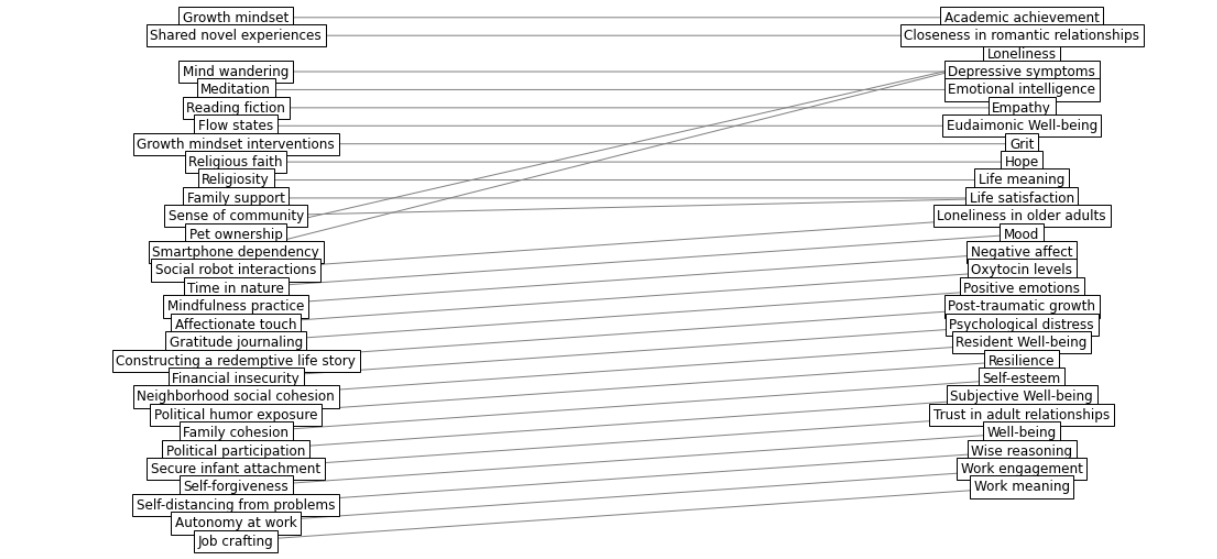
Observations drawn from both the word clouds and the connection graphs in Figures 6 and 7 provide us with a rich tapestry of insights into the thought processes and priorities of PhD students and the LLMCG model. For instance, the emphasis in the Control-Human word cloud on terms such as ‘robot’ and ‘AI’ indicates a strong interest among PhD students in the nexus between technology and psychology. It is particularly fascinating to see a group of academically trained individuals focusing on the real world implications and intersections of their studies, as shown by their apparent draw toward trending topics. This not only underscores their adaptability but also emphasizes the importance of contextual relevance. Conversely, the LLMCG groups, particularly the Expert-selected LLMCG group, emphasize the community, collective experiences, and the nuances of social interconnectedness. This denotes a deep-rooted understanding and application of higher-order social psychological concepts, reflecting the model’s ability to dive deep into the intricate layers of human social behavior.
Furthermore, the connection graphs support these observations. The Control-Human graph, with its exploration of themes such as ‘Robot Companionship’ and its relation to factors such as ‘heart rate variability (HRV)’, demonstrates a confluence of technology and human well-being. The other groups, especially the Random-selected LLMCG group, yield themes that are more societal and structural, hinting at broader determinants of individual well-being.
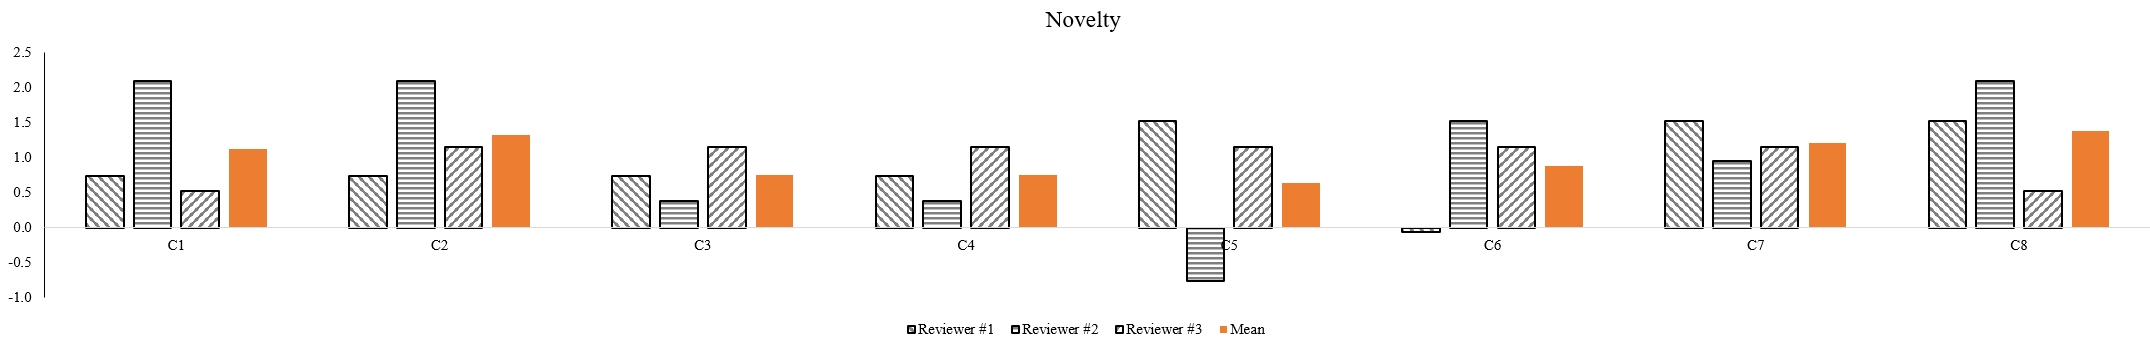
3.2.2 Analysis of human evaluations
To quantify the agreement among the raters, we employed Spearman correlation coefficients. The results, as shown in Table 13, reveal a spectrum of agreement levels between the reviewer pairs, showcasing the subjective dimension intrinsic to the evaluation of novelty and usefulness. In particular, the correlation between reviewer 1 and reviewer 2 in novelty (Spearman = 0.387, 0.0001 ) and between reviewer 2 and reviewer 3 in usefulness (Spearman = 0.376, 0.0001) suggests a meaningful level of consensus, particularly highlighting their capacity to identify valuable insights when evaluating hypotheses.
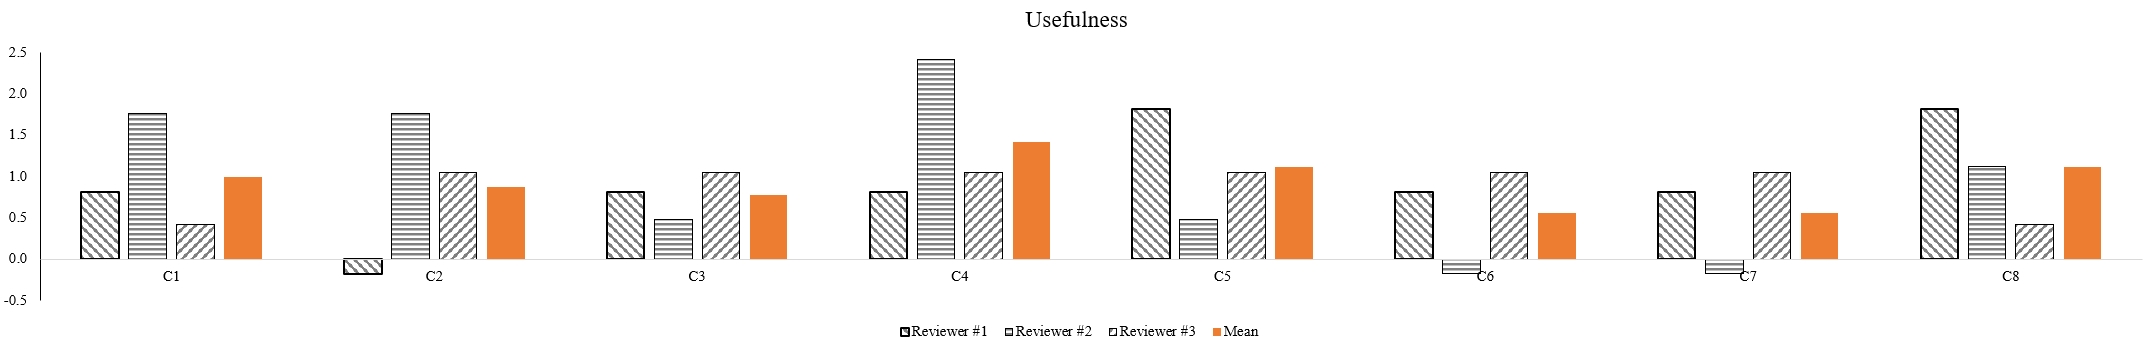
The variations in correlation values, such as between reviewer 2 and reviewer 3 ( = 0.069, = 0.453), can be attributed to the diverse research orientations and backgrounds of each reviewer. Reviewer 1 focuses on social ecology, reviewer 3 specializes in neuroscientific methodologies, and reviewer 2 integrates various views using technologies like virtual reality, and computational methods. In our evaluation, we present specific hypotheses cases to illustrate the differing perspectives between reviewers, as detailed in Table 12 and Figure 8. For example, C5 introduces the novel concept of ‘Virtual Resilience’. Reviewers 1 and 3 highlighted its originality and utility, while reviewer 2 rated it lower in both categories. Meanwhile, C6, which focuses on social neuroscience, resonated with reviewer 3, while reviewers 1 and 2 only partially affirmed it. These differences underscore the complexity of evaluating scientific contributions and highlight the importance of considering a range of expert opinions for a comprehensive evaluation.
This assessment is divided into two main sections: Novelty analysis and usefulness analysis.
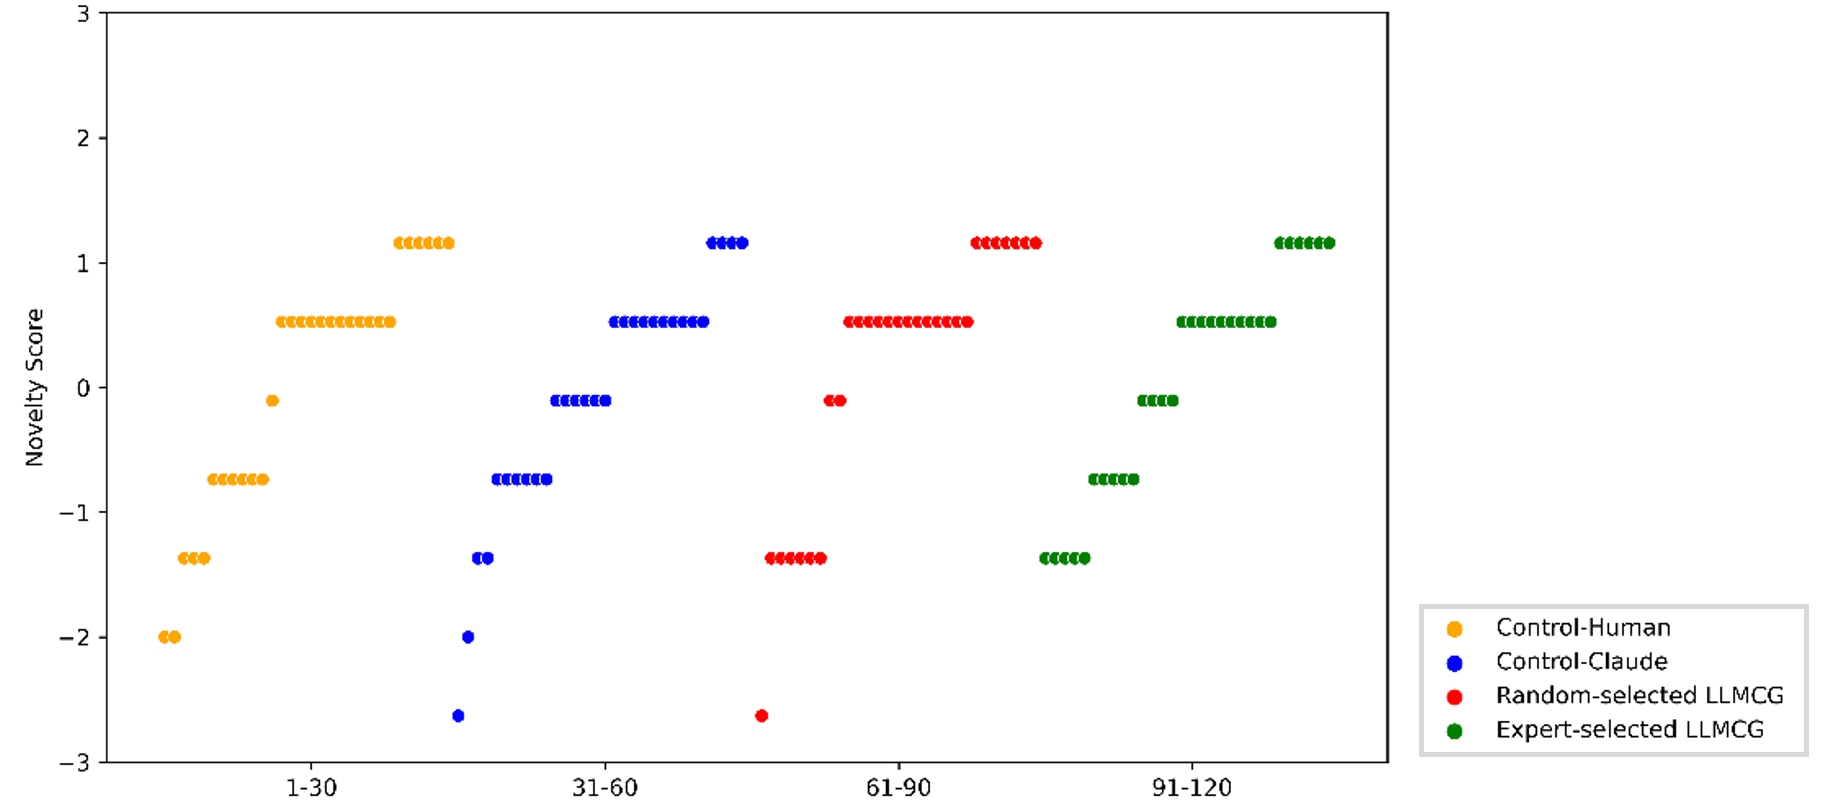
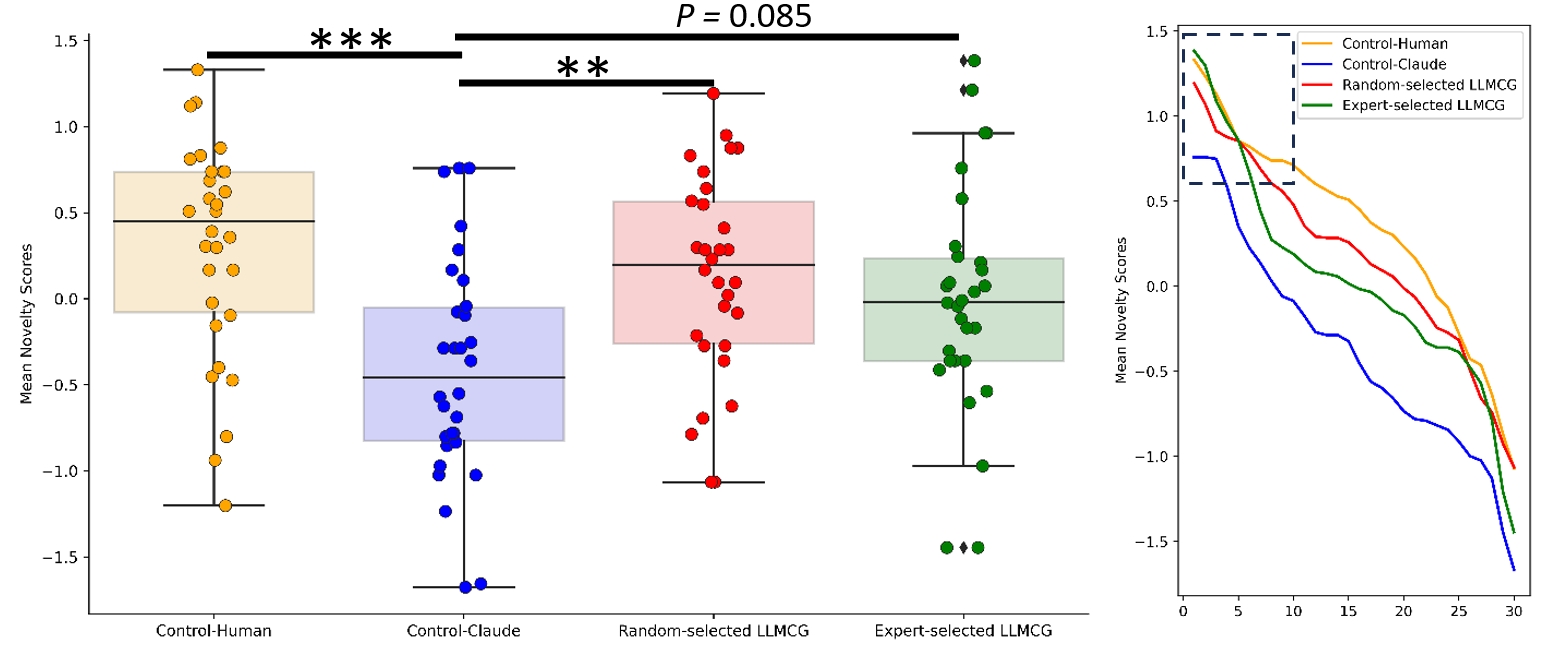
Novelty analysis: In the dynamic realm of scientific research, measuring and analyzing novelty is gaining paramount importance [shin2022scientific]. ANOVA was used to analyze the novelty scores represented in Figure 2a, and we identified a significant influence of the group factor on the mean novelty score between different reviewers. The clear distinctions between the groups, as visualized in the boxplots, are statistically underpinned by the results in Table 5. The ANOVA results revealed a pronounced effect of the grouping factor (F(3,116)=6.92, p = 0.0002), with variance explained by the grouping factor (R-squared) of 15.19%.
| Comparison | Contrast | Cohen’s | -value | -value |
|---|---|---|---|---|
| Mean Value | ||||
| Control-Claude vs. Control-Human | 0.7148 | 1.1192 | 4.36 | |
| Control-Claude vs. Random-selected LLMCG | 0.5478 | 0.8809 | 3.34 | 0.007 |
| Control-Claude vs. Expert-selected LLMCG | 0.4088 | 0.6226 | 2.49 | 0.085 |
| Median Value | ||||
| Control-Claude vs. Control-Human | 0.7688 | 1.1031 | 4.01 | |
| Control-Claude vs. Random-selected LLMCG | 0.6515 | 0.8875 | 3.40 | 0.006 |
| Control-Claude vs. Expert-selected LLMCG | 0.3264 | 0.4057 | 1.70 | 0.550 |
| Max Value | ||||
| Control-Claude vs. Control-Human | 0.7815 | 1.1637 | 4.36 | |
| Control-Claude vs. Random-selected LLMCG | 0.6231 | 1.0463 | 3.47 | 0.004 |
| Control-Claude vs. Expert-selected LLMCG | 0.5596 | 0.6987 | 3.12 | 0.014 |
Further pairwise comparisons using the Bonferroni method, as delineated in Table 5 and visually corroborated by Figure 2a; significant disparities were discerned between Random-selected LLMCG and Control-Claude (t(59) = 3.34, p=0.007) and between Control-Human and Control-Claude (t(59) = 4.32, p<0.001). Importantly, when considering the cumulative distribution plots to the right of Figure 2a, we observe the distributional characteristics of the novel scores. For example, it can be observed that the Expert-selected LLMCG curve portrays a greater concentration in the middle score range when compared to the Control-Claude, curve but dominates in the high novelty scores (highlighted in dashed rectangle). Moreover, comparisons involving Control-Human with both Random-selected LLMCG and Expert-selected LLMCG did not manifest statistically significant variances, indicating aligned novelty perceptions among these groups. Finally, the comparisons between Expert-selected LLMCG and Control-Claude (t(59) = 2.49, p=0.085) suggest a trend toward significance, underscoring the nuanced differences between these groups in the novelty dimension.
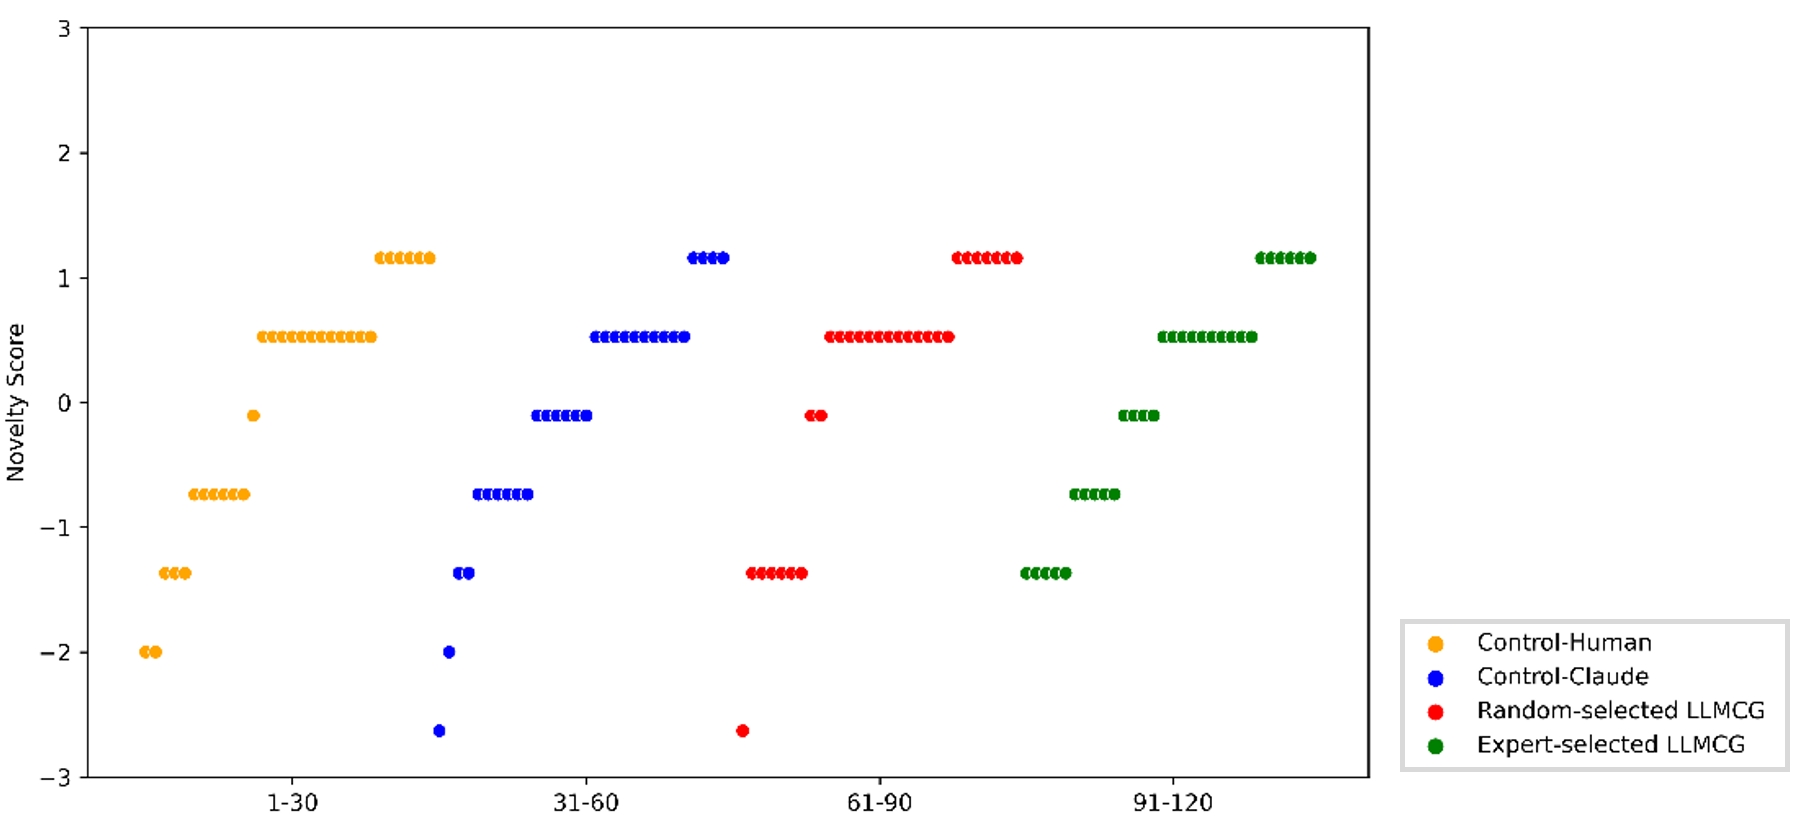
To mitigate potential biases due to individual reviewer inclinations, we expanded our evaluation to encompass both median and maximum values. These multifaceted analyses enhance the robustness of our results by minimizing the influence of extreme values and potential outliers. First, when analyzing the median novelty scores, the ANOVA test demonstrated a notable association with the grouping factor (F(3,116)=6.54, p=0.0004), which explained 14.41% of the variance. As illustrated in Table 5, pairwise evaluations revealed significant disparities between Control-Human and Control-Claude (t(59) = 4.01, p=0.001) as well as between Random-selected LLMCG and Control-Claude (t(59) = 3.40, p=0.006). Interestingly, the comparison of Expert-selected LLMCG with Control-Claude (t(59) = 1.70, p=0.550) and other group pairings were not included statistically significant differences.
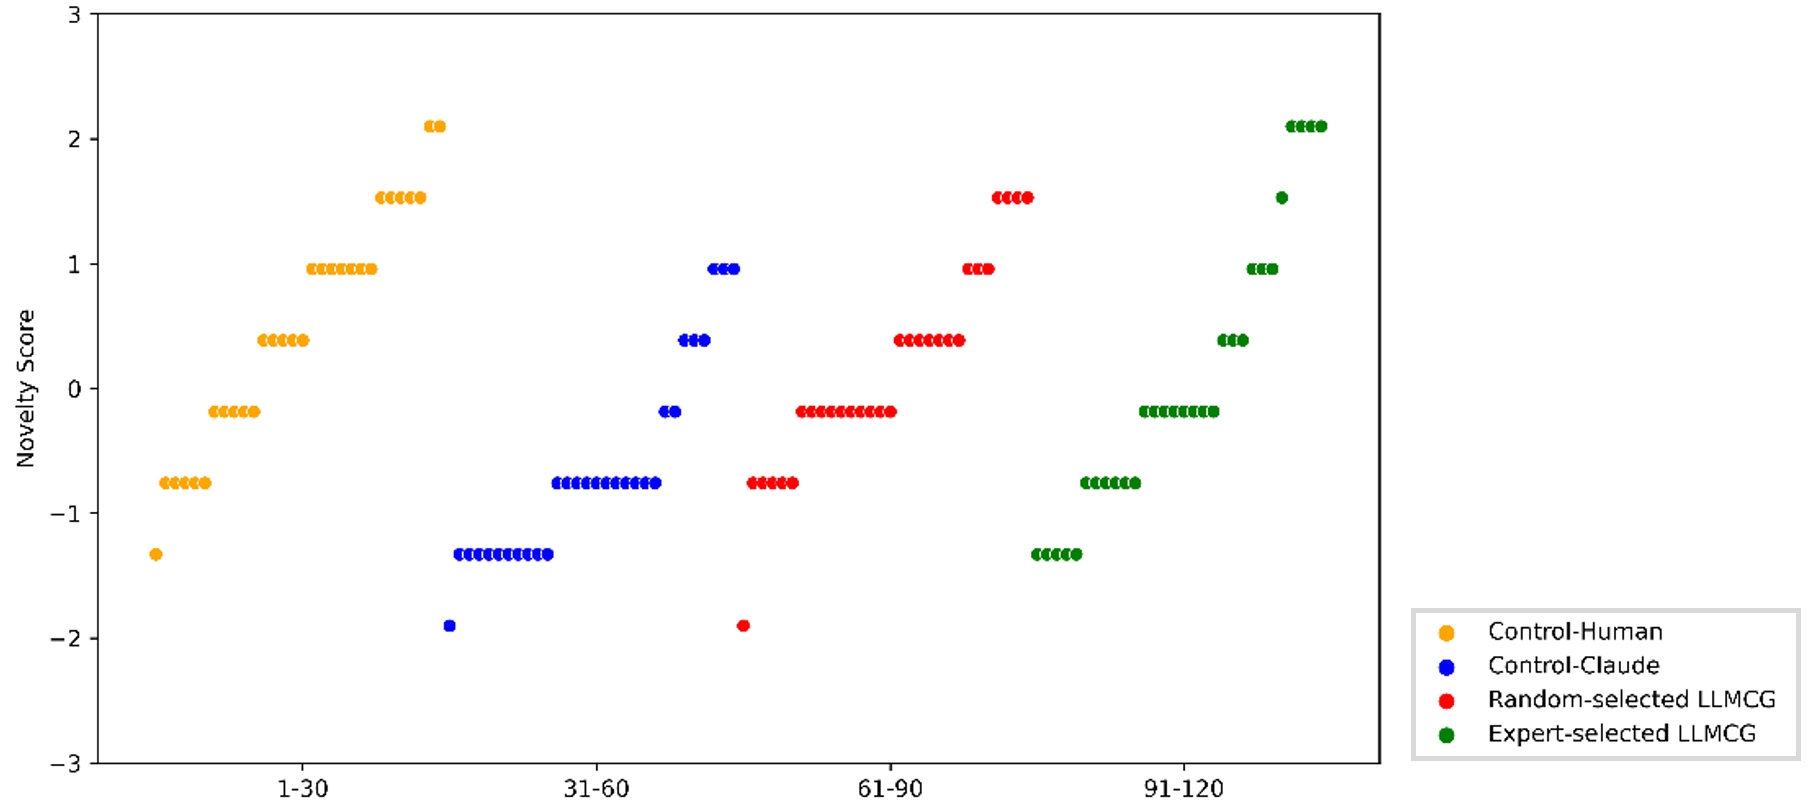
Subsequently, turning our attention to maximum novelty scores provided crucial insights, especially where outlier scores may carry significant weight. The influence of the grouping factor was evident (F(3,116)=7.20, p=0.0002), indicating an explained variance of 15.70%. In particular, clear differences emerged between Control-Human and Control-Claude (t(59) = 4.36, p<0.001), and between Random-selected LLMCG and Control-Claude (t(59) = 3.47, p=0.004). A particularly intriguing observation was the significant difference between Expert-selected LLMCG and Control-Claude (t(59) = 3.12, p=0.014). Together, these analyses offer a multifaceted perspective on novelty evaluations. Specifically, the results of the median analysis echo and support those of the mean, reinforcing the reliability of our assessments. The discerned significance between Control-Claude and Expert-selected LLMCG in the median data emphasizes the intricate differences, while also pointing to broader congruence in novelty perceptions.
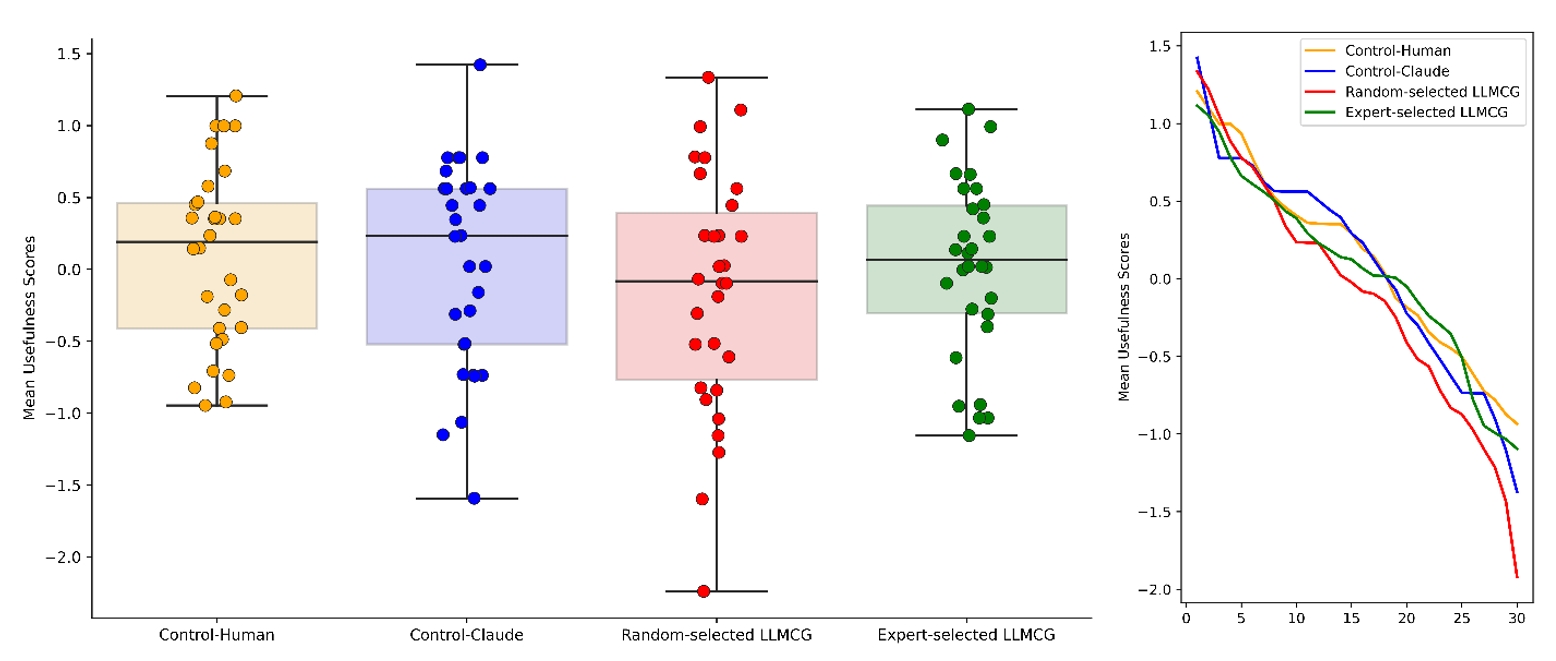
Usefulness analysis. Evaluating the practical impact of hypotheses is crucial in scientific research assessments. In the mean useful spectrum, the grouping factor did not exert a significant influence (F(3,116)=5.25, p = 0.553). Figure 2b presents the utility score distributions between groups. The narrow interquartile range of Control-Human suggests a relatively consistent assessment among reviewers. On the other hand, the spread and outliers in the Control-Claude distribution hint at varied utility perceptions. Both LLMCG groups cover a broad score range, demonstrating a mixture of high and low utility scores, while the Expert-selected LLMCG gravitates more toward higher usefulness scores. The smoothed line plots accompanying Figure 2b further detail the score densities. For instance, Random-selected LLMCG boasts several high utility scores, counterbalanced by a smattering of low scores. Interestingly, the distributions for Control-Human and Expert-selected LLMCG appear to be closely aligned. While mean utility scores provide an overarching view, the nuances within the boxplots and smoothed plots offer deeper insights. This comprehensive understanding can guide future endeavors in content generation and evaluation, spotlighting key areas of focus and potential improvements.
3.2.3 Deep semantic analysis
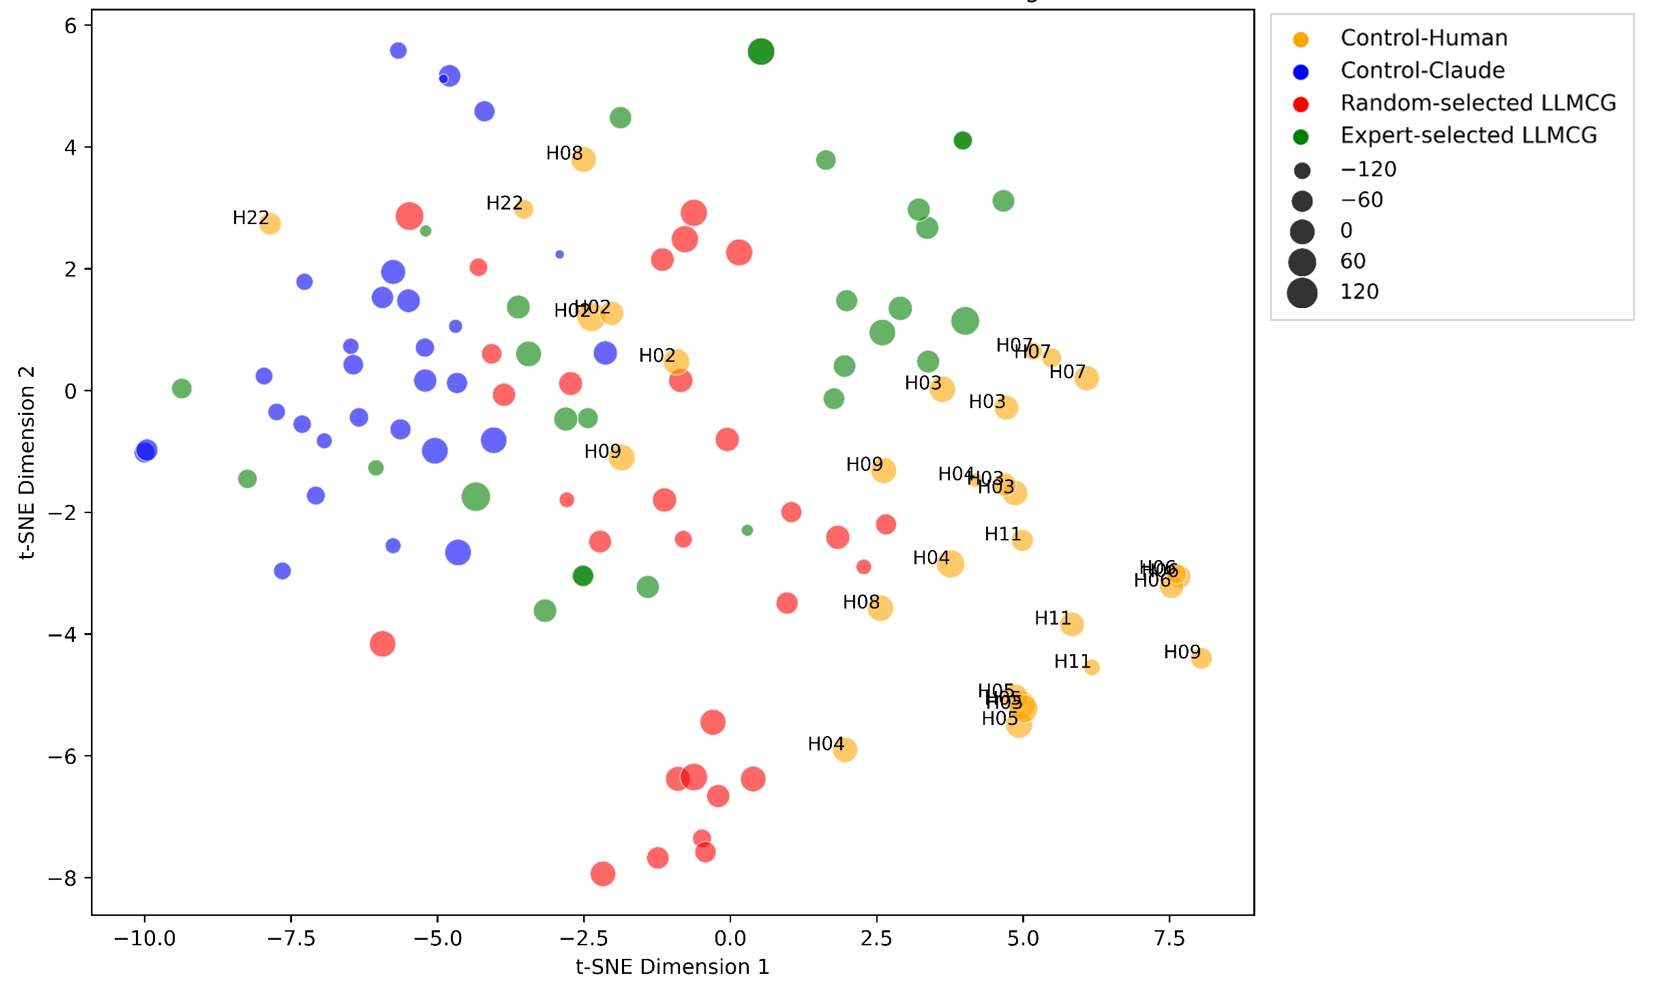
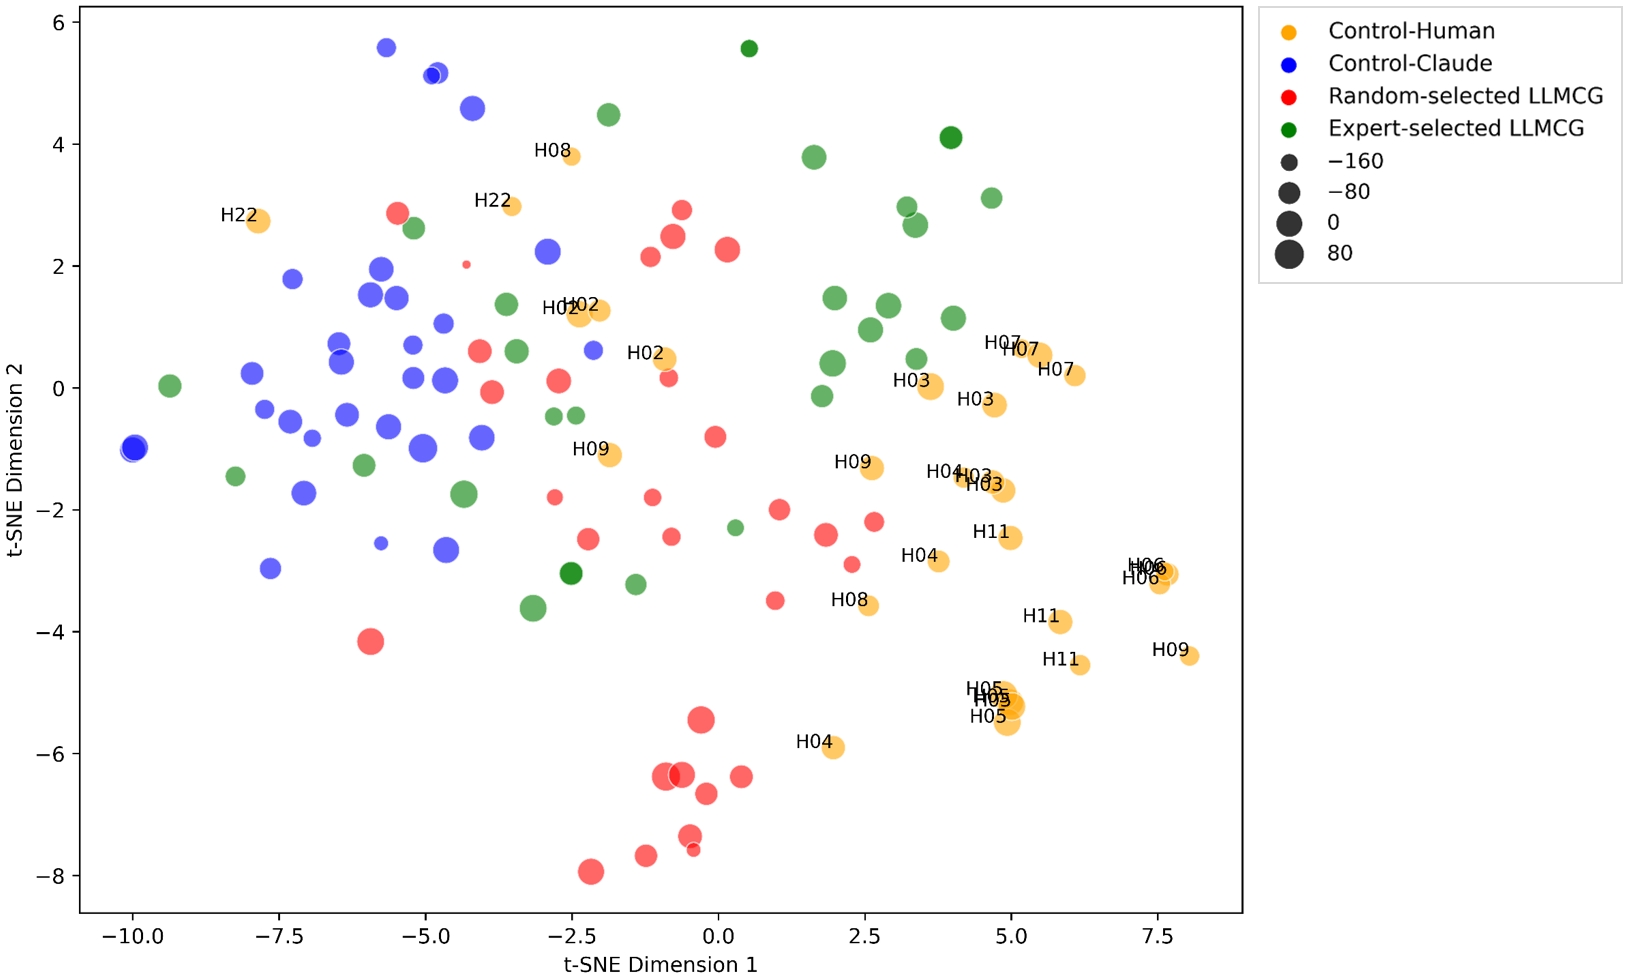
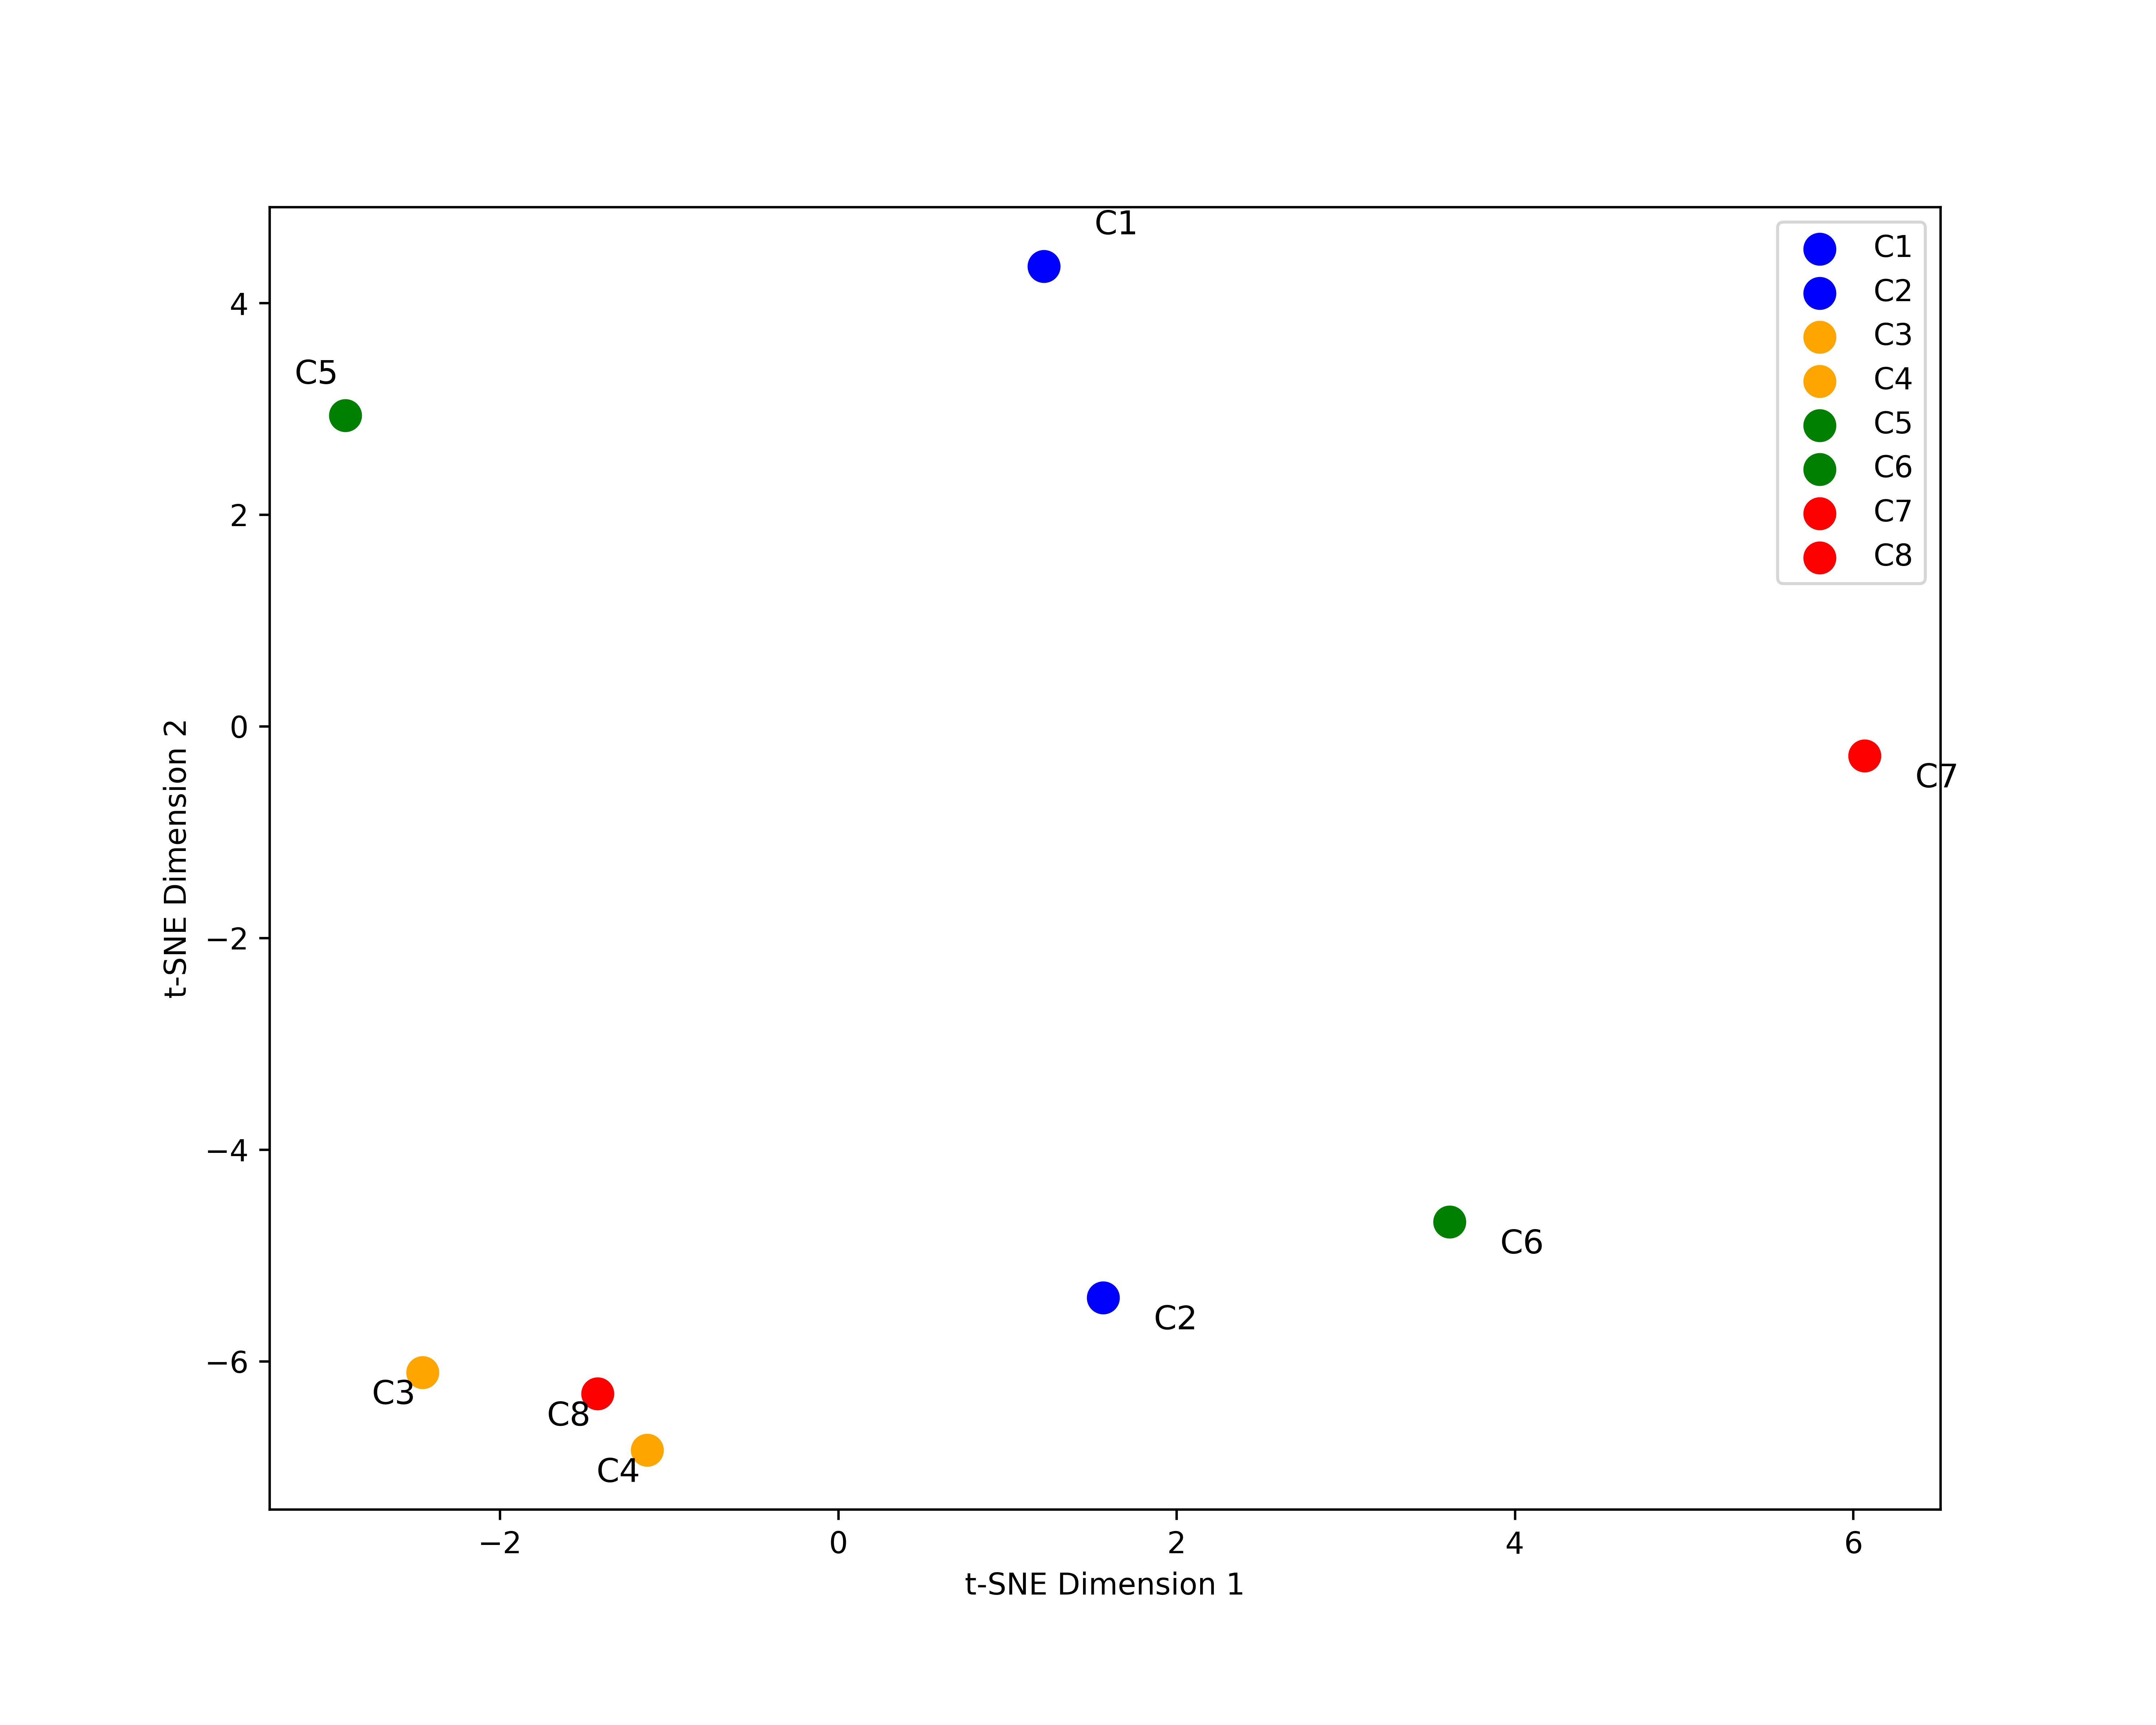
The -SNE visualizations (Figure 3) illustrate the semantic relationships between different groups, capturing the patterns of novelty and usefulness. Notably, a distinct clustering among PhD students suggests shared academic influences, while the LLMCG groups display broader topic dispersion, hinting at a wider semantic understanding. The size of the bubbles reflects the novelty and usefulness scores, emphasizing the diverse perceptions of what is considered innovative versus beneficial. Additionally, the numbers near the yellow dots represent the participant IDs, which demonstrated that the semantics of the same participant, such as H05 or H06, are closely aligned. In Figure 9, a distinct clustering of examples is observed, particularly highlighting the close proximity of hypotheses C3, C4 and C8 within the semantic space. This observation is further elucidated in the Appendix A.2, enhancing the comprehension of BERT’s semantic representation. Instead of solely depending on superficial textual descriptions, this analysis penetrates into the underlying understanding of concepts within the semantic space, a topic also explored in recent research [johnson2023divergent].
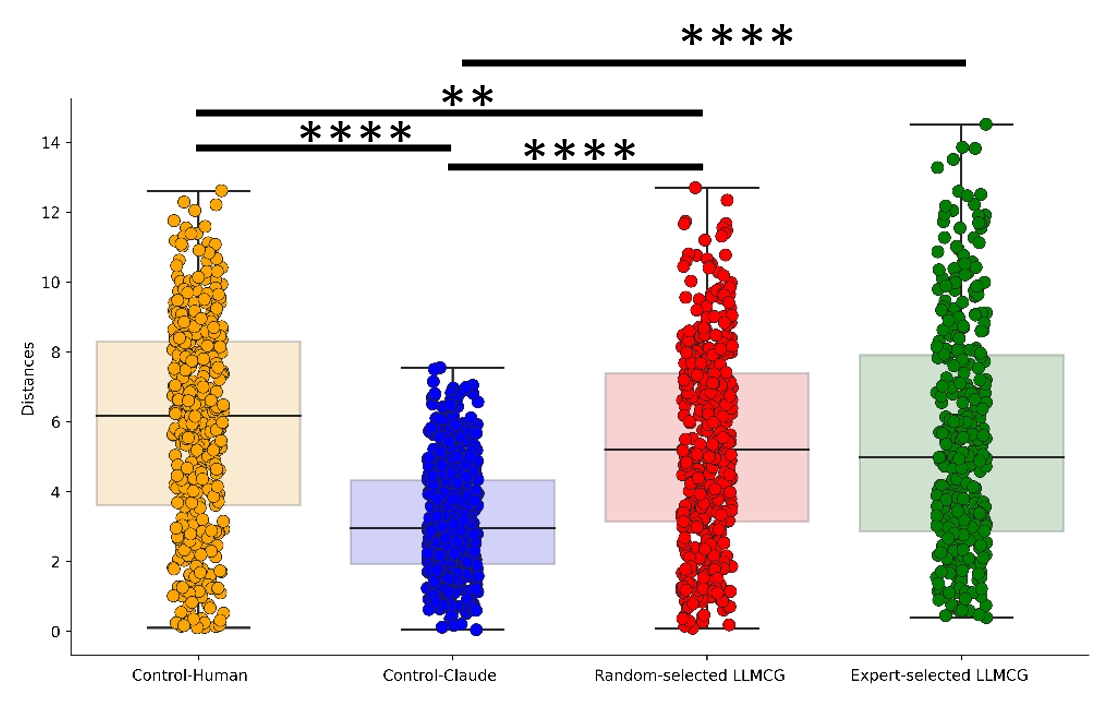
In the distribution of semantic distances (Figure 4), we observed that the Control-Human group exhibits a distinctively greater semantic distance in comparison to the other groups, emphasizing their unique semantic orientations. The statistical support for this observation is derived from the ANOVA results, with a significant F-statistic (F(3,1652)=84.1611, < 0.00001), underscoring the impact of the grouping factor. This factor explains a remarkable 86.96% of the variance, as indicated by the -squared value. Multiple comparisons, as shown in Table 6, further elucidate the subtleties of these group differences. Control-Human and Control-Claude exhibit a significant contrast in their semantic distances, as highlighted by the -value of 16.41 and the adjusted -value (). This difference indicates distinct thought patterns or emphasis in the two groups. a comparison of Control-Human with the LLMCG models shows divergent semantic orientations. The group has statistically significant differences with Random-selected LLMCG (=0.0036) and a trend toward difference with Expert-selected LLMCG (=0.0687). A comparison of the Control-Claude and LLMCG models reveals pronounced differences, more so with the Expert-selected LLMCG (<). Intriguingly, the two LLMCG groups —— Random-selected and Expert-selected —— exhibit similar semantic distances, as evidenced by a nonsignificant -value of 0.4362. Furthermore, the significant distinctions we observed, particularly between the control-human and other groups, align with human evaluations of novelty. This coherence indicates that the BERT space representation coupled with statistical analyses could effectively mimic human judgment. Such results underscore the potential of this approach for automated hypothesis testing, paving the way for more efficient and streamlined semantic evaluations in the future.
In general, visual and statistical analyses reveal the nuanced semantic landscapes of each group. While the PhD students’ shared background influences their clustering, the machine models exhibit a comprehensive grasp of topics, emphasizing the intricate interplay of individual experiences, academic influences, and algorithmic understanding in shaping semantic representations.
This investigation carried out a detailed evaluation of the various hypothesis contributors, blending both quantitative and qualitative analyses. In terms of topic analysis, distinct variations were observed between Control-Human and LLMCG, the latter presenting more expansive thematic coverage. For human evaluation, hypotheses from PhD students paralleled the LLMCG in novelty, reinforcing AI’s growing competence in mirroring human innovative thinking. Furthermore, when juxtaposed with AI models such as Control-Claude, the LLMCG exhibited increased novelty. Deep semantic analysis via -SNE and BERT representations allowed us to intuitively grasp semantic essence of hypotheses, signaling the possibility of future automated hypothesis assessments. Interestingly, LLMCG appeared to encompass broader complementary domains compared to human input. Taken together, these findings highlight the emerging role of AI in hypothesis generation and provides key insights into hypothesis evaluation across diverse origins.
| Comparison | Contrast | Cohen’s | -value | -value |
|---|---|---|---|---|
| Control-Human vs. Control-Claude | 2.6949 | 1.1630 | 16.41 | |
| Control-Human vs. Random-selected LLMCG | 0.5773 | 0.1396 | 2.91 | 0.0036 |
| Control-Human vs. Expert-selected LLMCG | 0.4078 | 0.1094 | 1.82 | 0.0687 |
| Control-Claude vs. Random-selected LLMCG | 2.1175 | 1.0701 | 13.45 | |
| Control-Claude vs. Expert-selected LLMCG | 2.2870 | 0.9150 | 12.72 | |
| Random-selected LLMCG vs. Expert-selected LLMCG | 0.1695 | 0.0152 | 0.78 | 0.4362 |
3.2.4 Comparison Between the LLMCG and GPT-4
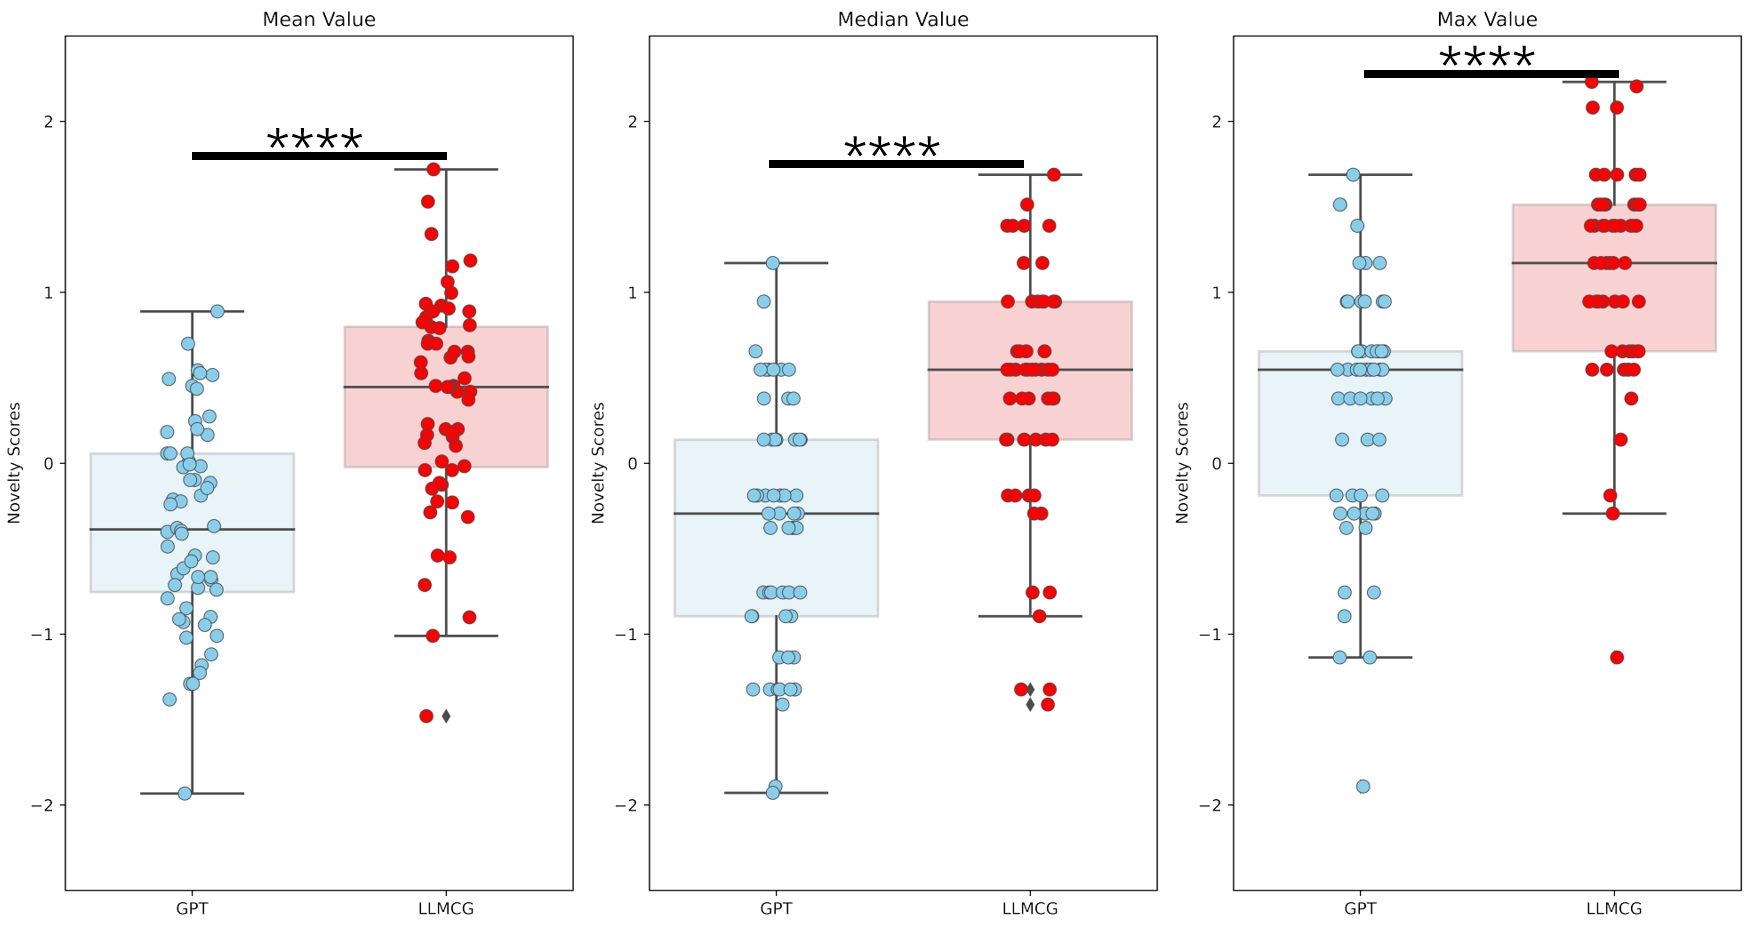
To evaluate the impact of integrating a causal graph with GPT-4, we performed an ablation study comparing the hypotheses generated by GPT-4 alone and those of the proposed LLMCG framework. For this experiment, 60 hypotheses were created using GPT-4, following the detailed instructions in Table 10. Furthermore, 60 hypotheses for the LLMCG group were randomly selected from the remaining pool of 70 hypotheses. Subsequently, both set of hypotheses were assessed by three independent reviewers for novelty and usefulness, as previously described.
Table 7 shows a comparison between the GPT-4 and LLMCG groups, highlighting a significant difference in novelty scores (mean value: t(119) = 6.60, ) but not in usefulness scores (mean value: t(119) = 1.31, ). This indicates that the LLMCG framework significantly enhances hypothesis novelty without affecting usefulness compared to the GPT-4 group. Figure 11 visually contrasts these findings, underlining the causal graph’s unique role in fostering novel hypothesis generation when integrated with GPT-4.
| Variable | Contrast | Cohen’s | -value | -Value |
|---|---|---|---|---|
| Novelty | ||||
| Mean Value | 0.7311 | 1.2055 | 6.60 | <0.0001 |
| Median Value | 0.7954 | 1.1434 | 6.26 | <0.0001 |
| Max Value | 0.7501 | 1.1395 | 6.24 | <0.0001 |
| Usefulness | ||||
| Mean Value | 0.1490 | 0.2387 | 1.31 | 0.1937 |
| Median Value | 0.1619 | 0.2045 | 1.12 | 0.2649 |
| Max Value | 0.0443 | 0.0793 | 0.43 | 0.6648 |
4 General Discussion
This research delves into the synergistic relationship between LLM and causal graphs in the hypothesis generation process. Our findings underscore the ability of LLM, when integrated with causal graph techniques, to produce meaningful hypotheses with increased efficiency and quality. By centering our investigation on ‘well-being’ we emphasize its pivotal role in psychological studies and highlight the potential convergence of technology and society. A multifaceted assessment approach to evaluate quality by topic analysis, human evaluation and deep semantic analysis demonstrates that AI-augmented methods not only outshine LLM-only techniques in generating hypotheses with superior novelty and show a quality on par with human expertise but also boast the capability for more profound conceptual incorporations and a broader semantic spectrum. Such a multifaceted lens of assessment introduces a novel perspective for the scholarly realm, equipping researchers with an enriched understanding and an innovative toolset for hypothesis generation. At its core, the melding of LLM and causal graphs signals a promising frontier, especially in regard to dissecting cornerstone psychological constructs such as ‘well-being’. This marriage of methodologies, enriched by the comprehensive assessment angle, deepens our comprehension of both the immediate and broader ramifications of our research endeavors.
The prominence of causal graphs in psychology is profound, they offer researchers a unified platform for synthesizing and hypothesizing diverse psychological realms [uleman2021mapping, borsboom2021network]. Our study echoes this, producing groundbreaking hypotheses comparable in depth to early expert propositions. Deep semantic analysis bolstered these findings, emphasizing that our hypotheses have distinct cross-disciplinary merits, particularly when compared to those of individual doctoral scholars. However, the traditional use of causal graphs in psychology presents challenges due to its demanding nature, often requiring insights from multiple experts [crielaard2022refining]. Our research, however, harnesses LLM’s causal extraction, automating causal pair derivation and, in turn, minimizing the need for extensive expert input. The union of the causal graphs’ systematic approach with AI-driven creativity, as seen with LLMs, paves the way for the future in psychological inquiry. Thanks to advancements in AI, barriers once created by causal graphs’ intricate procedures are being dismantled. Furthermore, as the era of big data dawns, the integration of AI and causal graphs in psychology augments research capabilities, but also brings into focus the broader implications for society. This fusion provides a nuanced understanding of the intricate sociopsychological dynamics, emphasizing the importance of adapting research methodologies in tandem with technological progress.
In the realm of research, LLMs serve a unique purpose, often by acting as the foundation or baseline against which newer methods and approaches are assessed. The demonstrated productivity enhancements by generative AI tools, as evidenced by [noy2023experimental], indicate the potential of such LLMs. In our investigation, we pit the hypotheses generated by such substantial models against our integrated LLMCG approach. Intriguingly, while these LLMs showcased admirable practicality in their hypotheses, they substantially lagged behind in terms of innovation when juxtaposed with the doctoral student and LLMCG group. This divergence in results can be attributed to the causal network curated from 43k research papers, funneling the vast knowledge reservoir of the LLM squarely into the realm of scientific psychology. The increased precision in hypothesis generation by these models fits well within the framework of generative networks. [tong2021putative] highlighted that, by integrating structured constraints, conventional neural networks can accurately generate semantically relevant content. One of the salient merits of the causal graph, in this context, is its ability to alleviate inherent ambiguity or interpretability challenges posed by LLMs. By providing a systematic and structured framework, the causal graph aids in unearthing the underlying logic and rationale of the outputs generated by LLMs. Notably, this finding echoes the perspective of [pan2023unifying], where the integration of structured knowledge from knowledge graphs was shown to provide an invaluable layer of clarity and interpretability to LLMs, especially in complex reasoning tasks. Such structured approaches not only boost the confidence of researchers in the hypotheses derived, but also augment the transparency and understandability of LLM outputs. In essence, leveraging causal graphs may very well herald a new era in model interpretability, serving as a conduit to unlock the black box that large models often represent in contemporary research.
In the ever-evolving tapestry of research, every advancement invariably comes with its unique set of constraints, and our study was no exception. On the technical front, a pivotal challenge stemmed from the opaque inner workings of the GPT. Determining the exact machinations within the GPT that lead to the formation of specific causal pairs remains elusive, thereby reintroducing the age-old issue of AI’s inherent lack of transparency [cao2023extrapolation, buruk2023academic]. This opacity is magnified in our sparse causal graph, which, while expansive, is occasionally riddled with concepts that, while semantically distinct, converge in meaning. In tangible applications, a careful and meticulous algorithmic evaluation would be imperative to construct an accurate psychological conceptual landscape. Delving into psychology, which bridges humanities and natural sciences, it continuously aims to unravel human cognition and behavior [hergenhahn2013introduction]. Despite the dominance of traditional methodologies [henrich2010most, shah2015big], the present data-centric era amplifies the synergy of technology and humanities, resonating with Hasok Chang’s vision of enriched science [chang2007scientific]. This symbiosis is evident when assessing structural holes in social networks [burt2004structural] and viewing novelty as a bridge across these divides [foster2021surprise]. Such perspectives emphasize the importance of thorough algorithmic assessments, highlighting potential avenues in humanities research, especially when incorporating large language models for innovative hypothesis crafting and verification.
However, there are some limitations for this research. Firstly, we acknowledge that constructing causal relationship graphs has potential inaccuracies, with approximately 13% relationship pairs not aligning with human expert estimations. Enhancing the estimation of relationship extraction could be a pathway to improve the accuracy of the causal graph, potentially leading to more robust hypotheses. Secondly, our validation process was limited to 130 hypotheses, however, the vastness of our conceptual landscape suggests the countless possibilities. As an exemplar, the twenty pivotal psychological concepts highlighted in Table 3 alone could spawn an extensive array of hypotheses. However, the validation of these surrounding hypotheses would unquestionably lead to a multitude of speculations. A striking observation during our validation was the inconsistency in the evaluations of the senior expert panels (as shown in Table 13). This shift underscores a pivotal insight: our integration of AI has transitioned the dependency on scarce expert resources from hypothesis generation to evaluation. In the future, rigorous evaluations ensuring both novelty and utility could become a focal point of exploration. The promising path forward necessitates a thoughtful integration of technological innovation and human expertise to fully realize the potential suggested by our study.
In conclusion, our research provides pioneering insight into the symbiotic fusion of LLMs, which are epitomized by GPT, and causal graphs from the realm of psychological hypothesis generation, especially emphasizing ‘well-being’. Importantly, as highlighted by [cao2023extrapolation], ensuring a synergistic alignment between domain knowledge and AI extrapolation is crucial. This synergy serves as the foundation for maintaining AI models within their conceptual limits, thus bolstering the validity and reliability of the hypotheses generated. Our approach intricately interweaves the advanced capabilities of LLMs with the methodological prowess of causal graphs, thereby optimizing while also refining the depth and precision of hypothesis generation. The causal graph, of paramount importance in psychology due to its cross-disciplinary potential, often demands vast amounts of expert involvement. Our innovative approach addresses this by utilizing LLM’s exceptional causal extraction abilities, effectively facilitating the transition of intense expert engagement from hypothesis creation to evaluation. Therefore, our methodology combined LLM with causal graphs, propelling psychological research forward by improving hypothesis generation and offering tools to blend theoretical and data-centric approaches. This synergy particularly enriches our understanding of social psychology’s complex dynamics, such as happiness research, demonstrating the profound impact of integrating AI with traditional research frameworks.
5 Authorship Contribution Statement
Song Tong: Data analysis, Experiments, Writing - original draft & review. Kai Mao: Designed the causality graph methodology, Generated AI hypotheses, Developed hypothesis generation techniques, Writing - review & editing. Zhen Huang: Statistical Analysis, Experiments, Writing - review & editing. Yukun Zhao: Conceptualization, Project administration, Supervision, Writing - review & editing. Kaiping Peng: Conceptualization, Writing - review & editing.
6 Declaration of Competing Interest
The author(s) declared no potential conflicts of interest with respect to the research, authorship, and/or publication of this article.
7 Acknowledgments
The authors thank Dr. Honghong Bai (Radboud University), Dr. ChienTe Wu (The University of Tokyo), Dr. Peng Cheng (Tsinghua University), and Yusong Guo (Tsinghua University) for their great comments on the earlier version of this manuscript. This research has been generously funded by personal contributions, with special acknowledgment to Kai Mao. Additionally, he conceived and developed the causality graph and AI hypothesis generation technology presented in this paper from scratch, and generated all AI hypotheses and paid for its costs.
8 Funding
The authors sincerely thank Kai Mao for fully funding the development of hypothesis generation techniques and providing the generated AI hypotheses that enabled this research. His generous support and pioneering work in these areas made this collaborative project possible.
Appendix A Method
A.1 Article Selection & Cost Analysis.
Before delving into the specifics of the extraction process, it’s crucial to emphasize the importance of cost analysis, especially when dealing with large-scale data processing. In the realm of data-intensive research, the sheer volume of articles and the intricate nature of text extraction entail significant computational and financial resources. Understanding the associated costs is paramount not only for optimal resource allocation but also for ensuring the scalability and feasibility of the project. With these considerations in mind, extracting causal knowledge from texts requires the utilization of language models, such as GPT-4, to process each paper. Given the costs associated with API usage, we projected the total expenses for different corpus sizes. Key determinants of the costs include: Token Count and API Constraints. Total number of tokens (word segments) across all texts. GPT-4 charges per thousand tokens for both inputs and outputs. In addition, GPT-4 capped at 60 requests per minute and 150k tokens per minute at the time of this research. Extraction procedures must comply with these thresholds. For our curated subset of 140k articles, with each abstract at 500 words and main content at 5,000 words, the estimates are 40 million tokens for 40k articles. The GPT-4 pricing is approximate to 40,000 USD. Based on this analysis, our choice was to extract 43,312 articles, representing around 40 million tokens. This strikes a balance between comprehensive coverage and cost-efficiency.
A.2 Differentiating Causality and Correlation by GPT-4
A experiment is conducted to investigate the capability of GPT-4 for differentiating ‘causality’ and ‘correlation’. The experiment involved four graduate students (1 male, mean age 31 10.23), each well acquainted with a collection of six psychological articles. This familiarity was intended to mitigate the inherent difficulty in assessing the presence of causality or correlation within academic texts. From an initial set of 21 articles, after excluding amenable to effective processing by PyPDF and excluding review articles, GPT-4 extracted 238 causal and 51 correlational concept pairs. Detailed methodologies and GPT prompt are provided in Section ‘Causal knowledge extraction method’ and Table 2. This resulted in an average of 11.33 pairs of causal concepts per article (SD = 7.20).
The students as evaluators were then surveyed to assess these pairs of identified concepts within the articles they provided, assigned with categorizing each as ‘existent or not’ and as ‘causal or correlational’, based on the descriptions of the articles. This unique perspective aimed to leverage their detailed understanding of the content to validate extracted concept pairs. The evaluation results are in Table 8. The preliminary statistical analysis of the 289 relationships highlighted that 87.54% (253/289) were recognized as existing, with 74.31% (188/289) classified as causality by evaluators. Notably, when GPT-4 identified a concept pair as causality, 86.98% (207/238) of the relationships were acknowledged, with 65.55% (156/238) agreed upon as causality, and only 13.02% (31/238) potentially not mentioned in the papers.
| Causality # | Correlation # | Total | |
| GPT-4 | |||
| Relationship Extracted | 238 | 51 | 289 |
| Expert Evaluated | |||
| Relationship Exist | 207 | 46 | 253 |
| Causality | (156) | (32) | (188) |
| Correlation | (51) | (14) | (65) |
| Nonrelationship | 31 | 5 | 36 |
Appendix B Results
B.1 Details for Topic Analysis
B.1.1 Word cloud comparison.
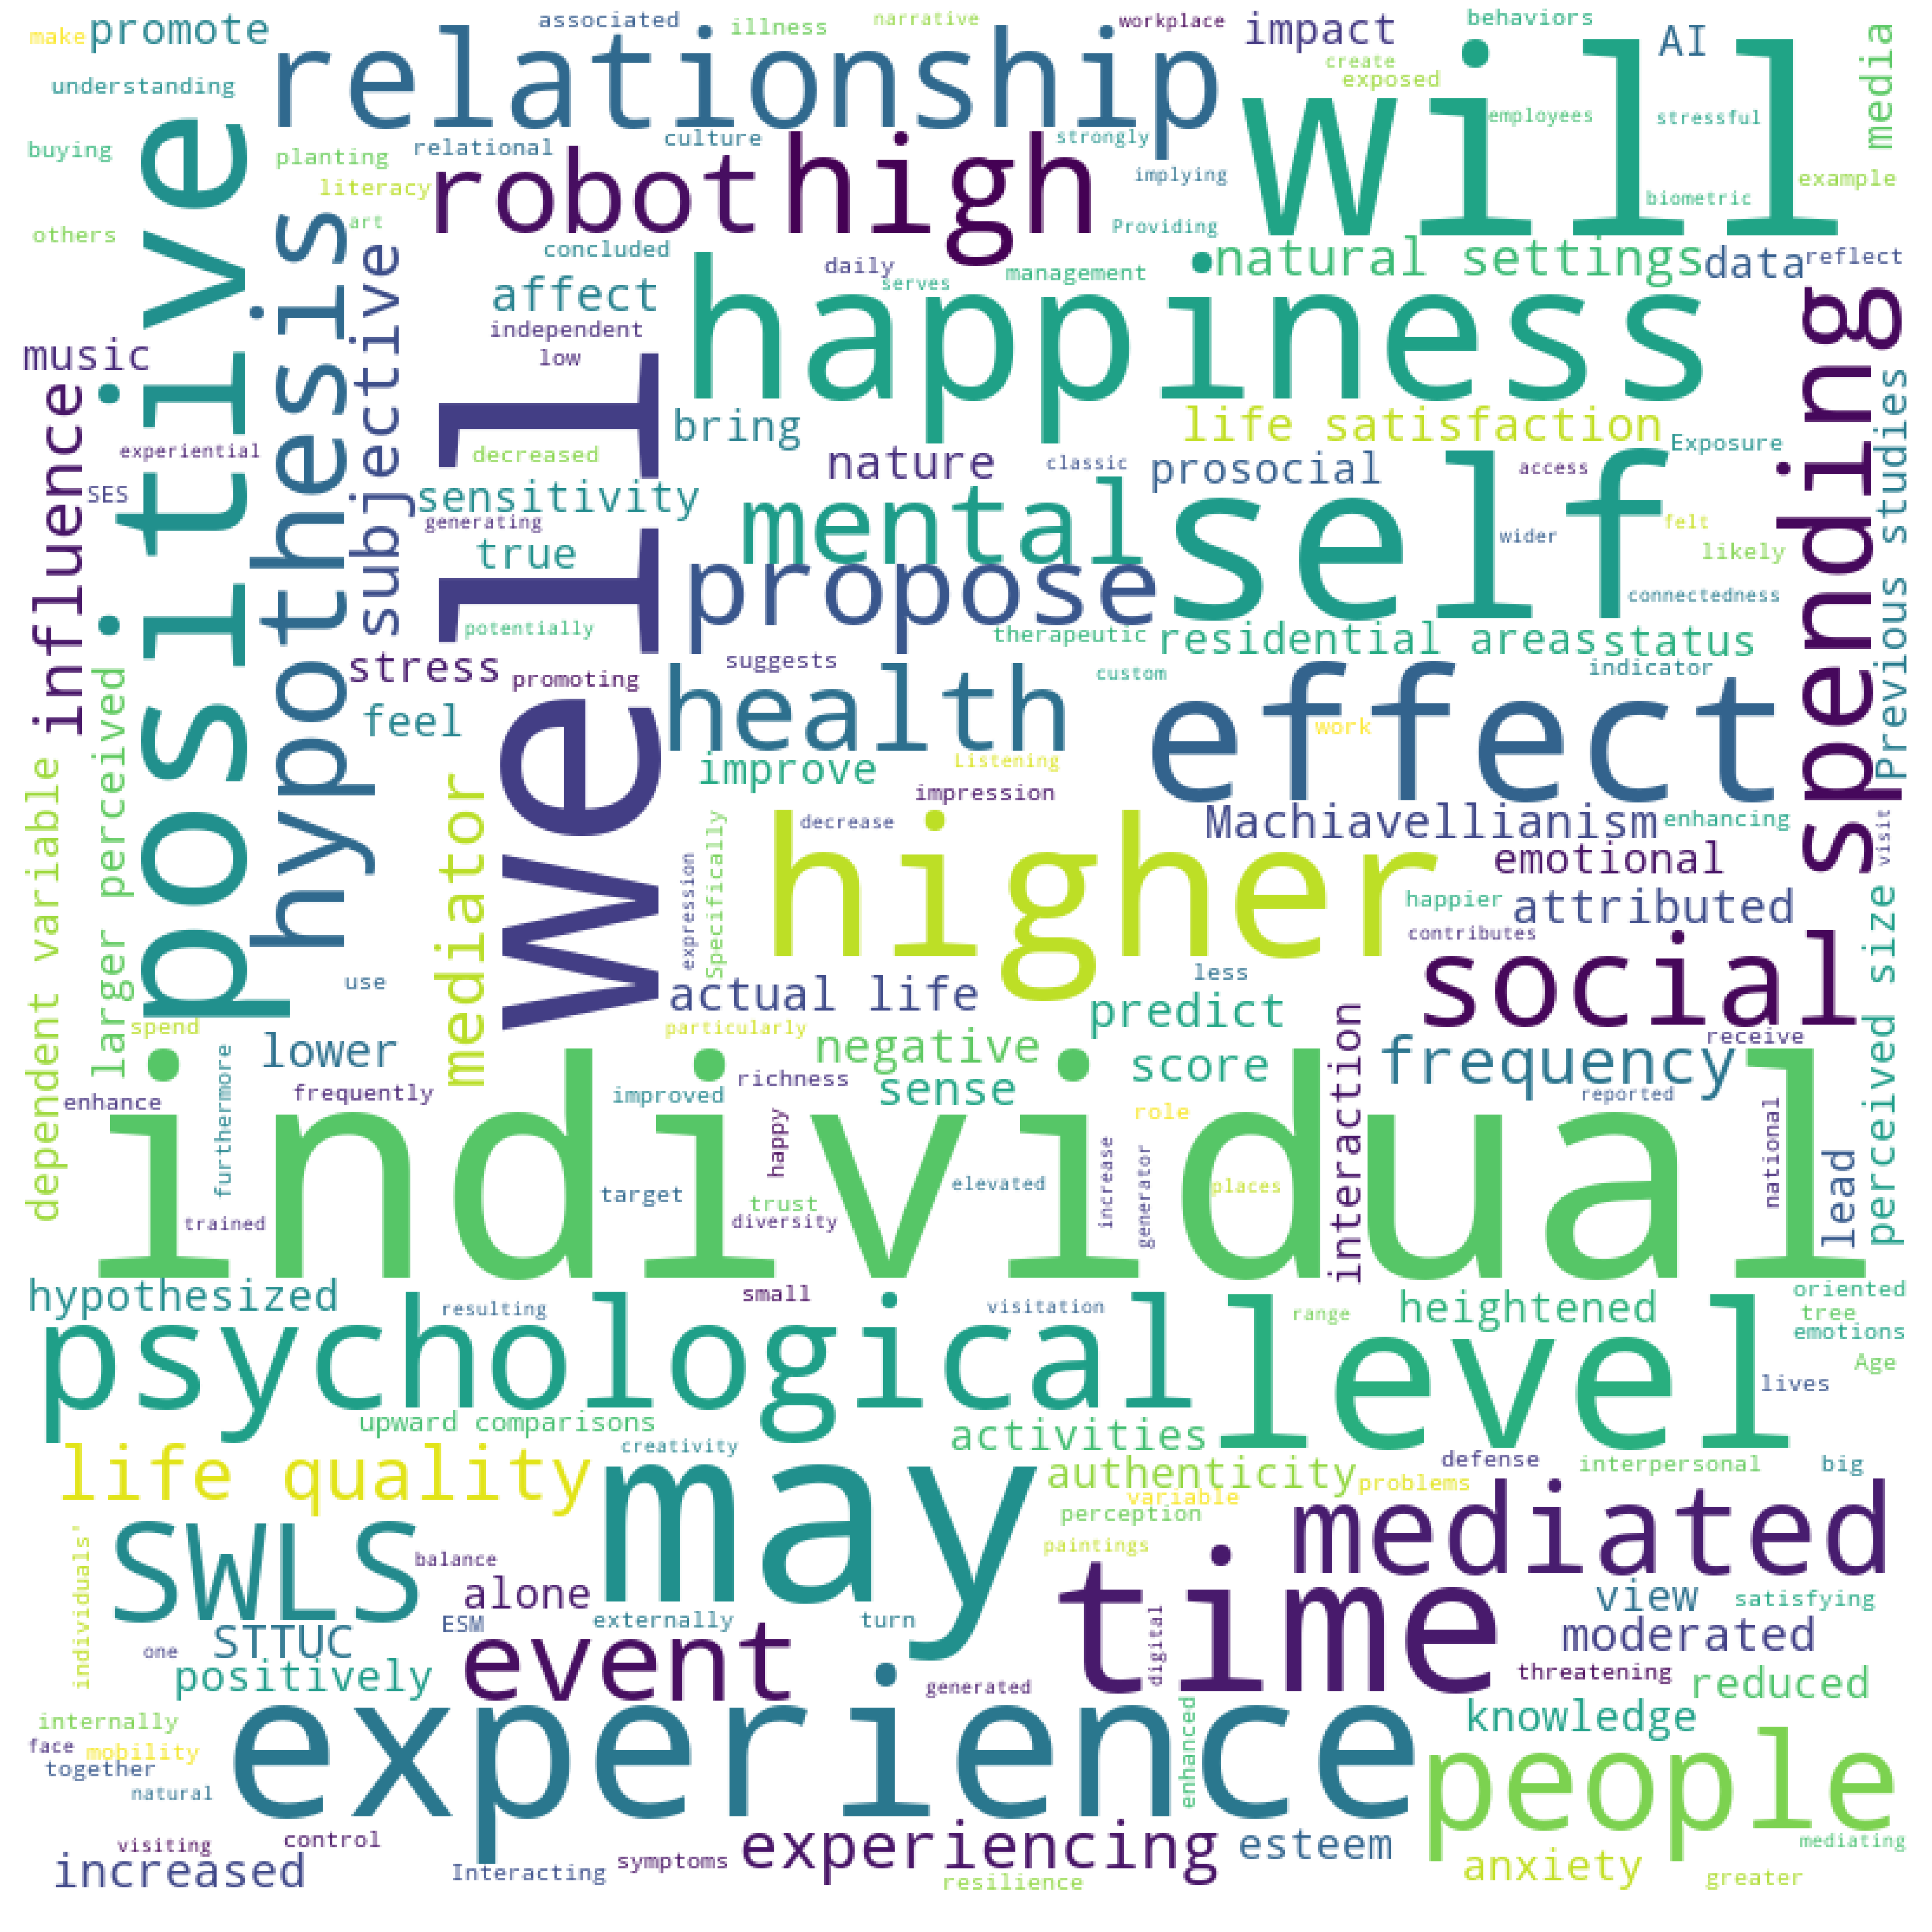
Figure 6 showcases visual representations of term and theme frequencies for different models and groups. A preliminary analysis suggests:
Control-Human (a): This word cloud seems to emphasize terms related to individual well-being and psychological health. Notable terms include ‘relationship’, ‘happiness’, ‘self’, and ‘experience’. The presence of ‘robot’ and ‘AI’ suggests topics about technology’s relationship with human psychology was atrracted by Ph.D students.
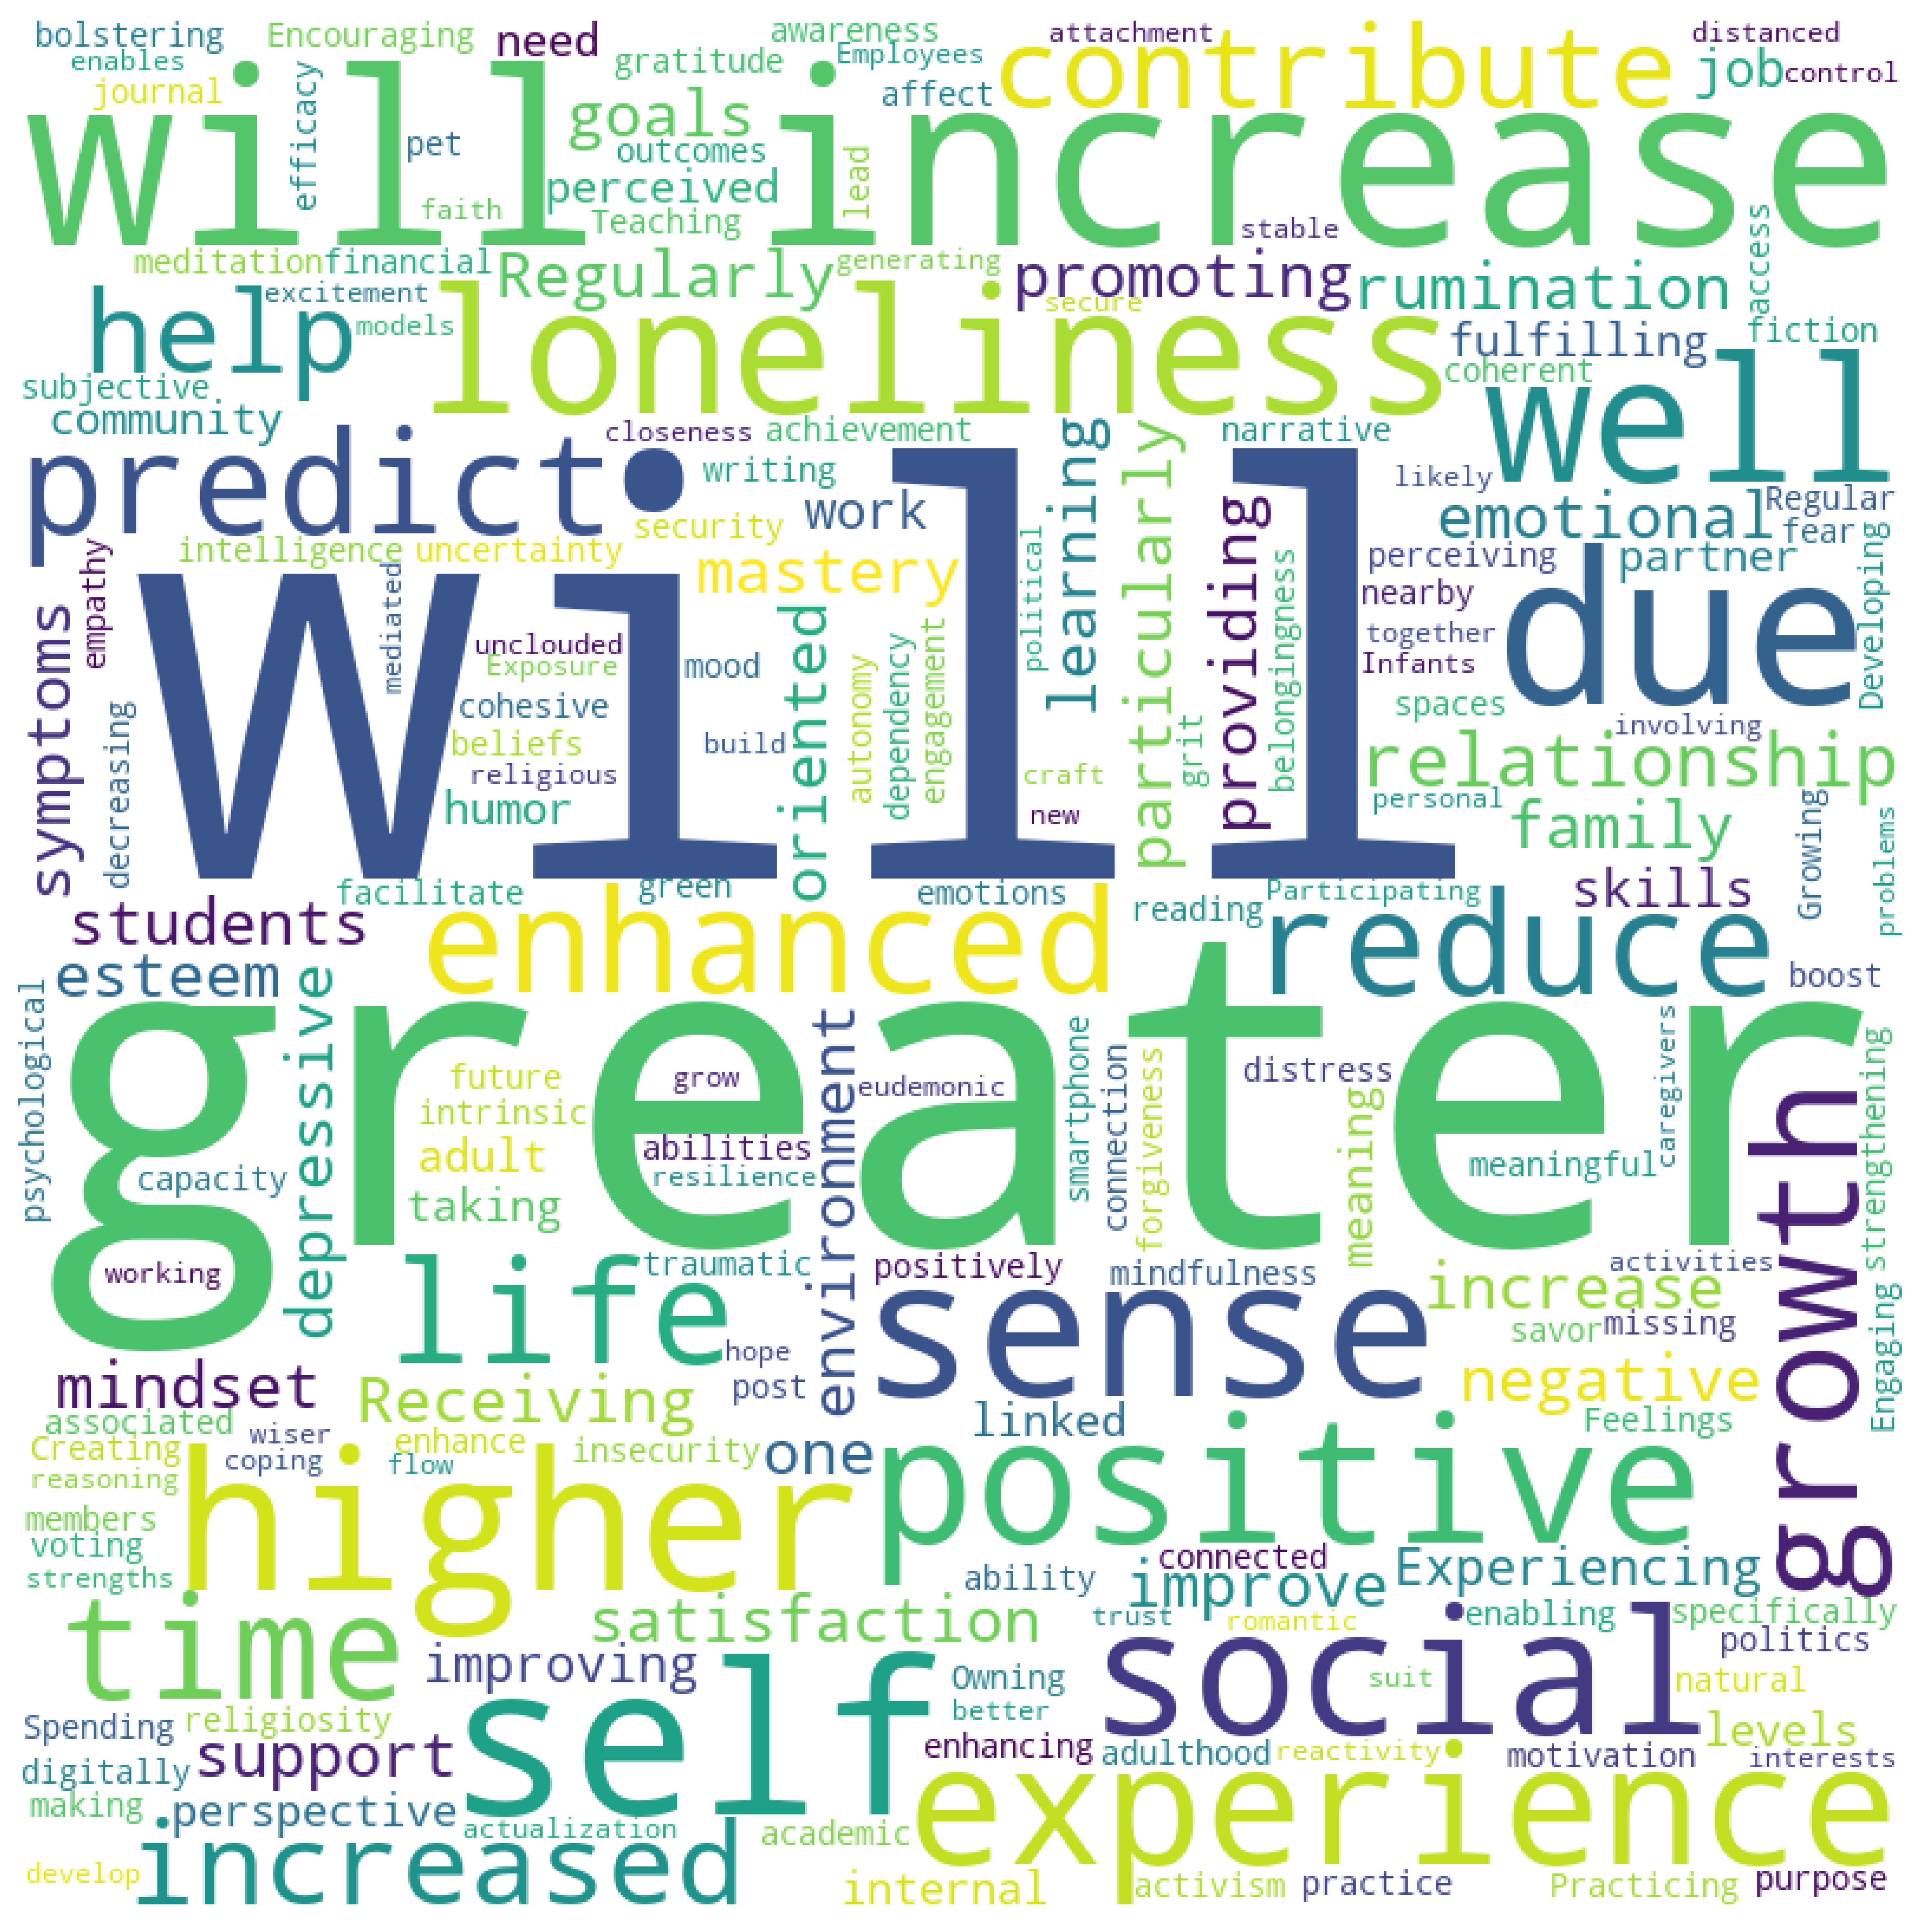
Control-Claude (b): The themes here seem to be oriented around positivity and growth. Key terms such as ‘will’, ‘increase’, ‘greater’, and ‘positive’ stand out.
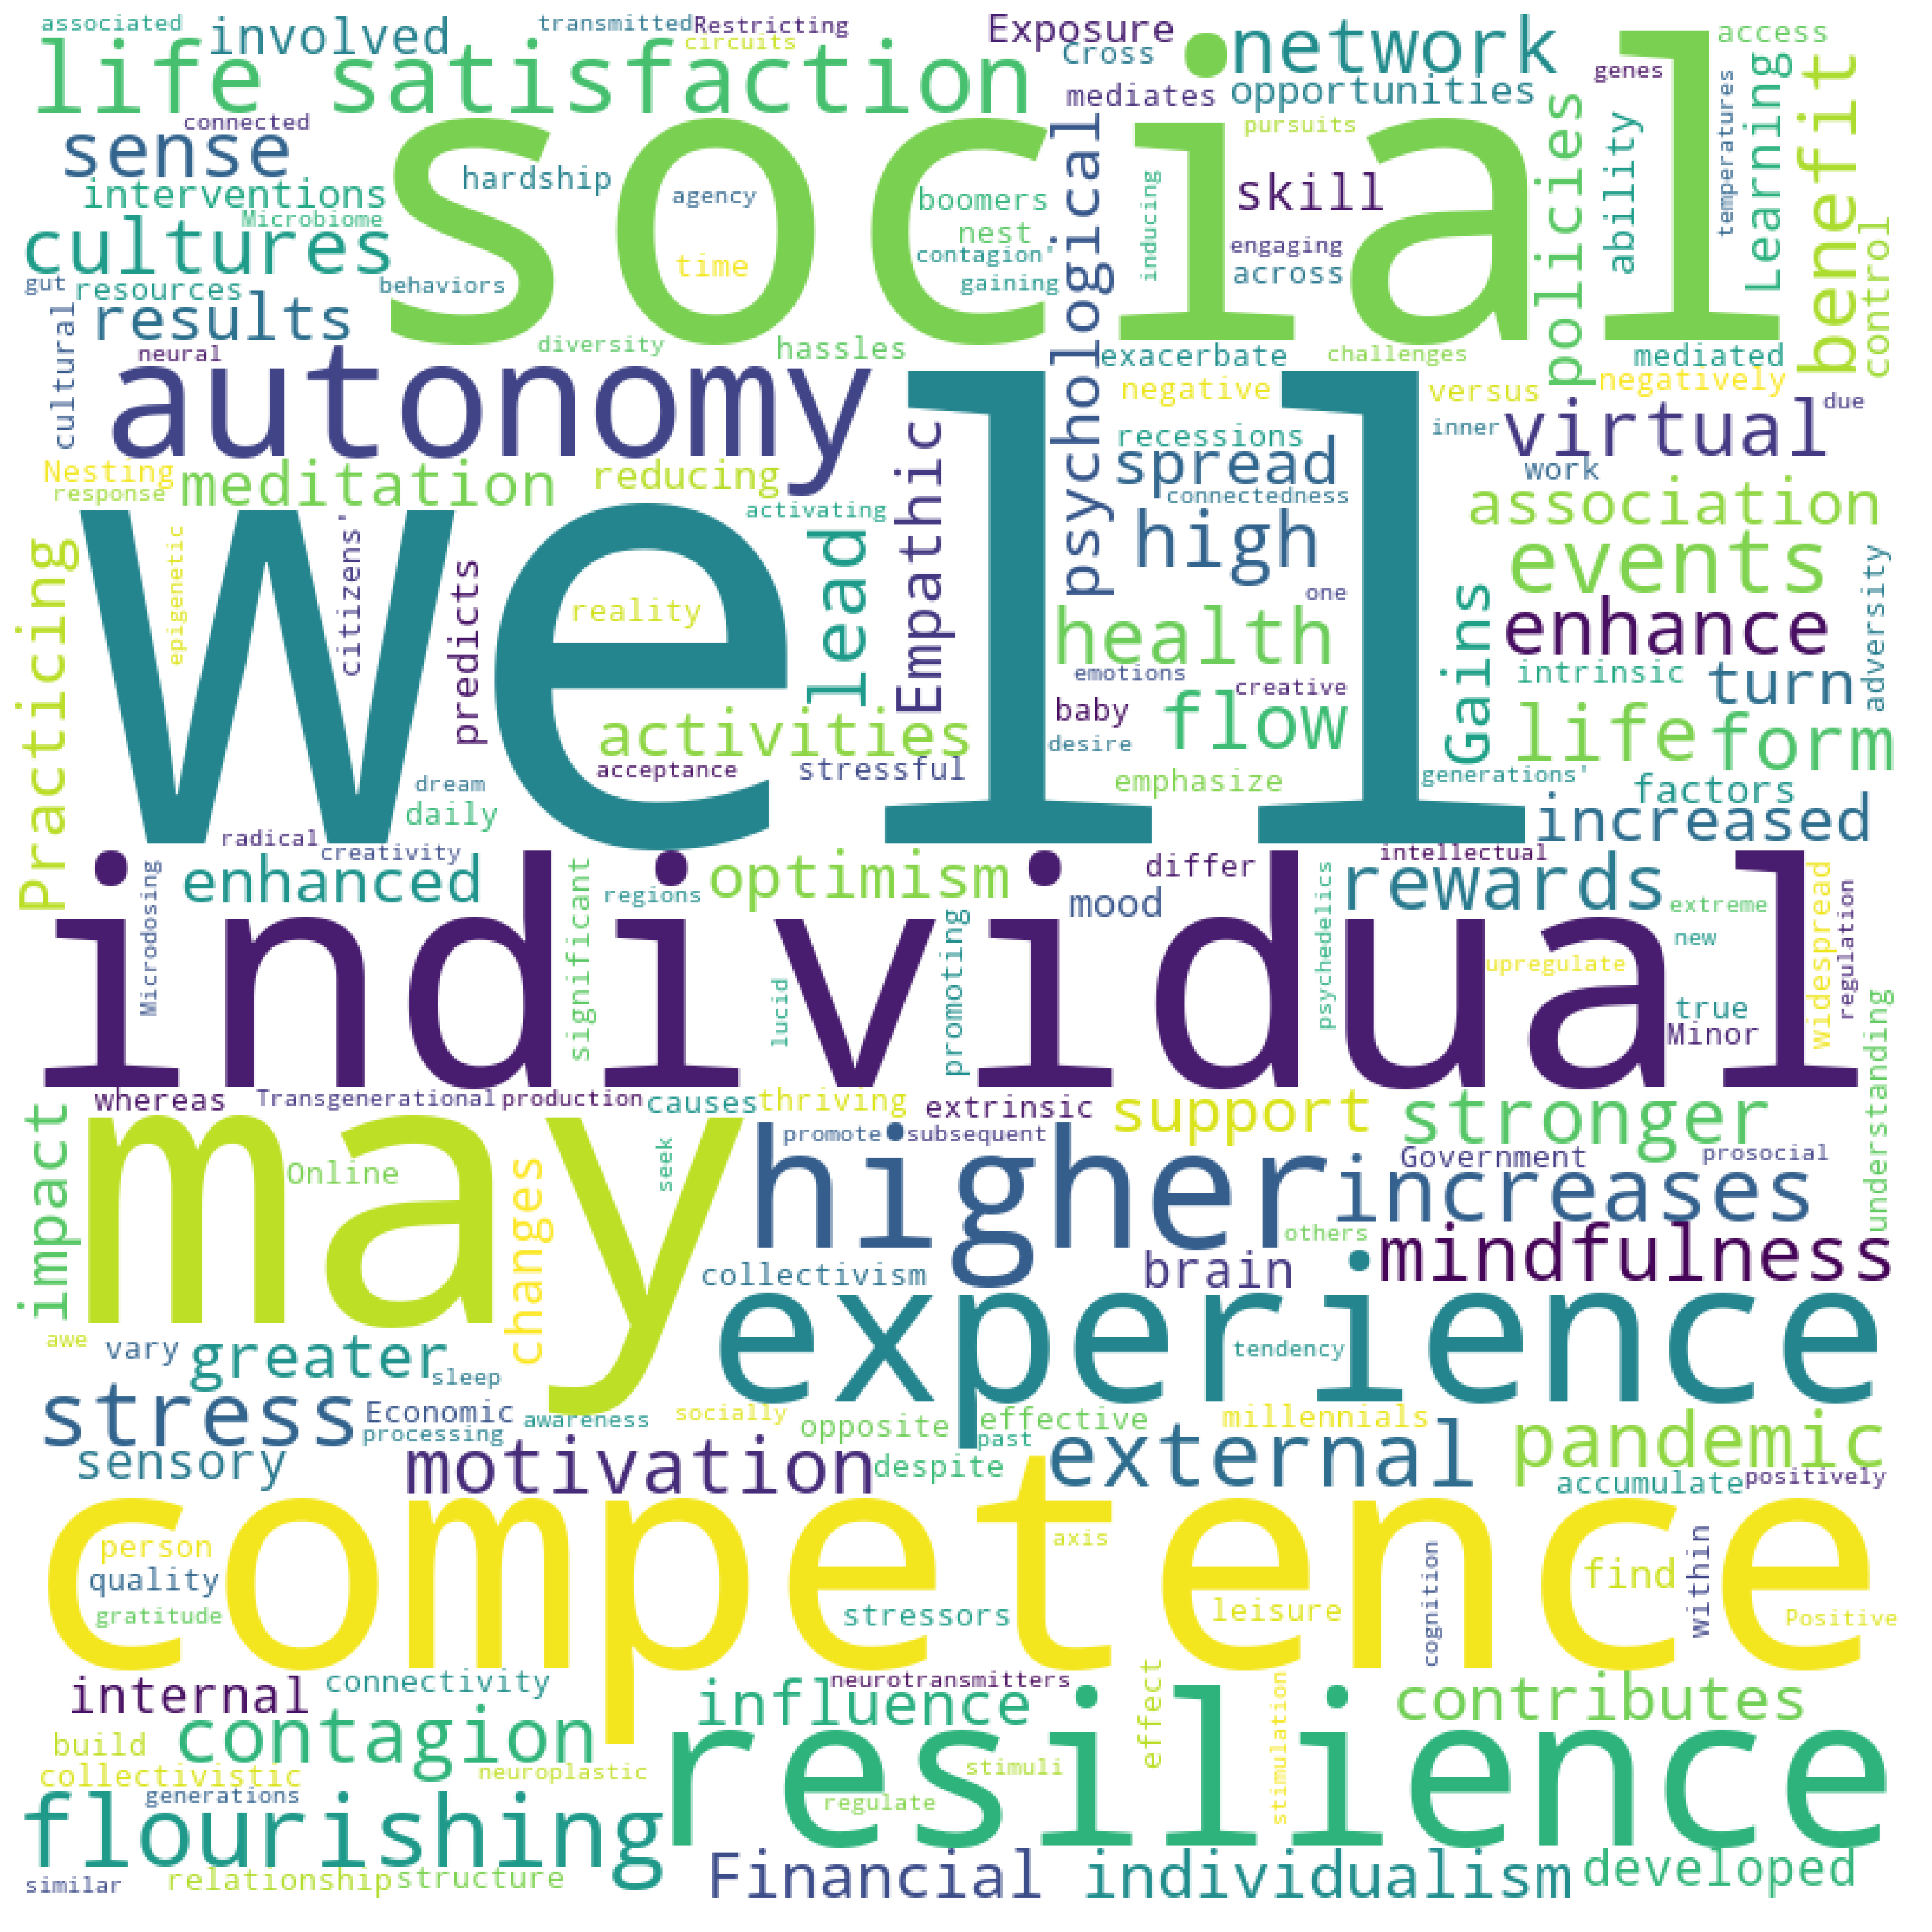
Random-selected LLMCG (c): The terms in this word cloud underscore social connections, individual autonomy, and competence. Words such as ‘social’, ‘individual’, ‘autonomy’, and ‘competence’ are dominant. Themes of satisfaction, resilience, and cultural aspects can also be deciphered.
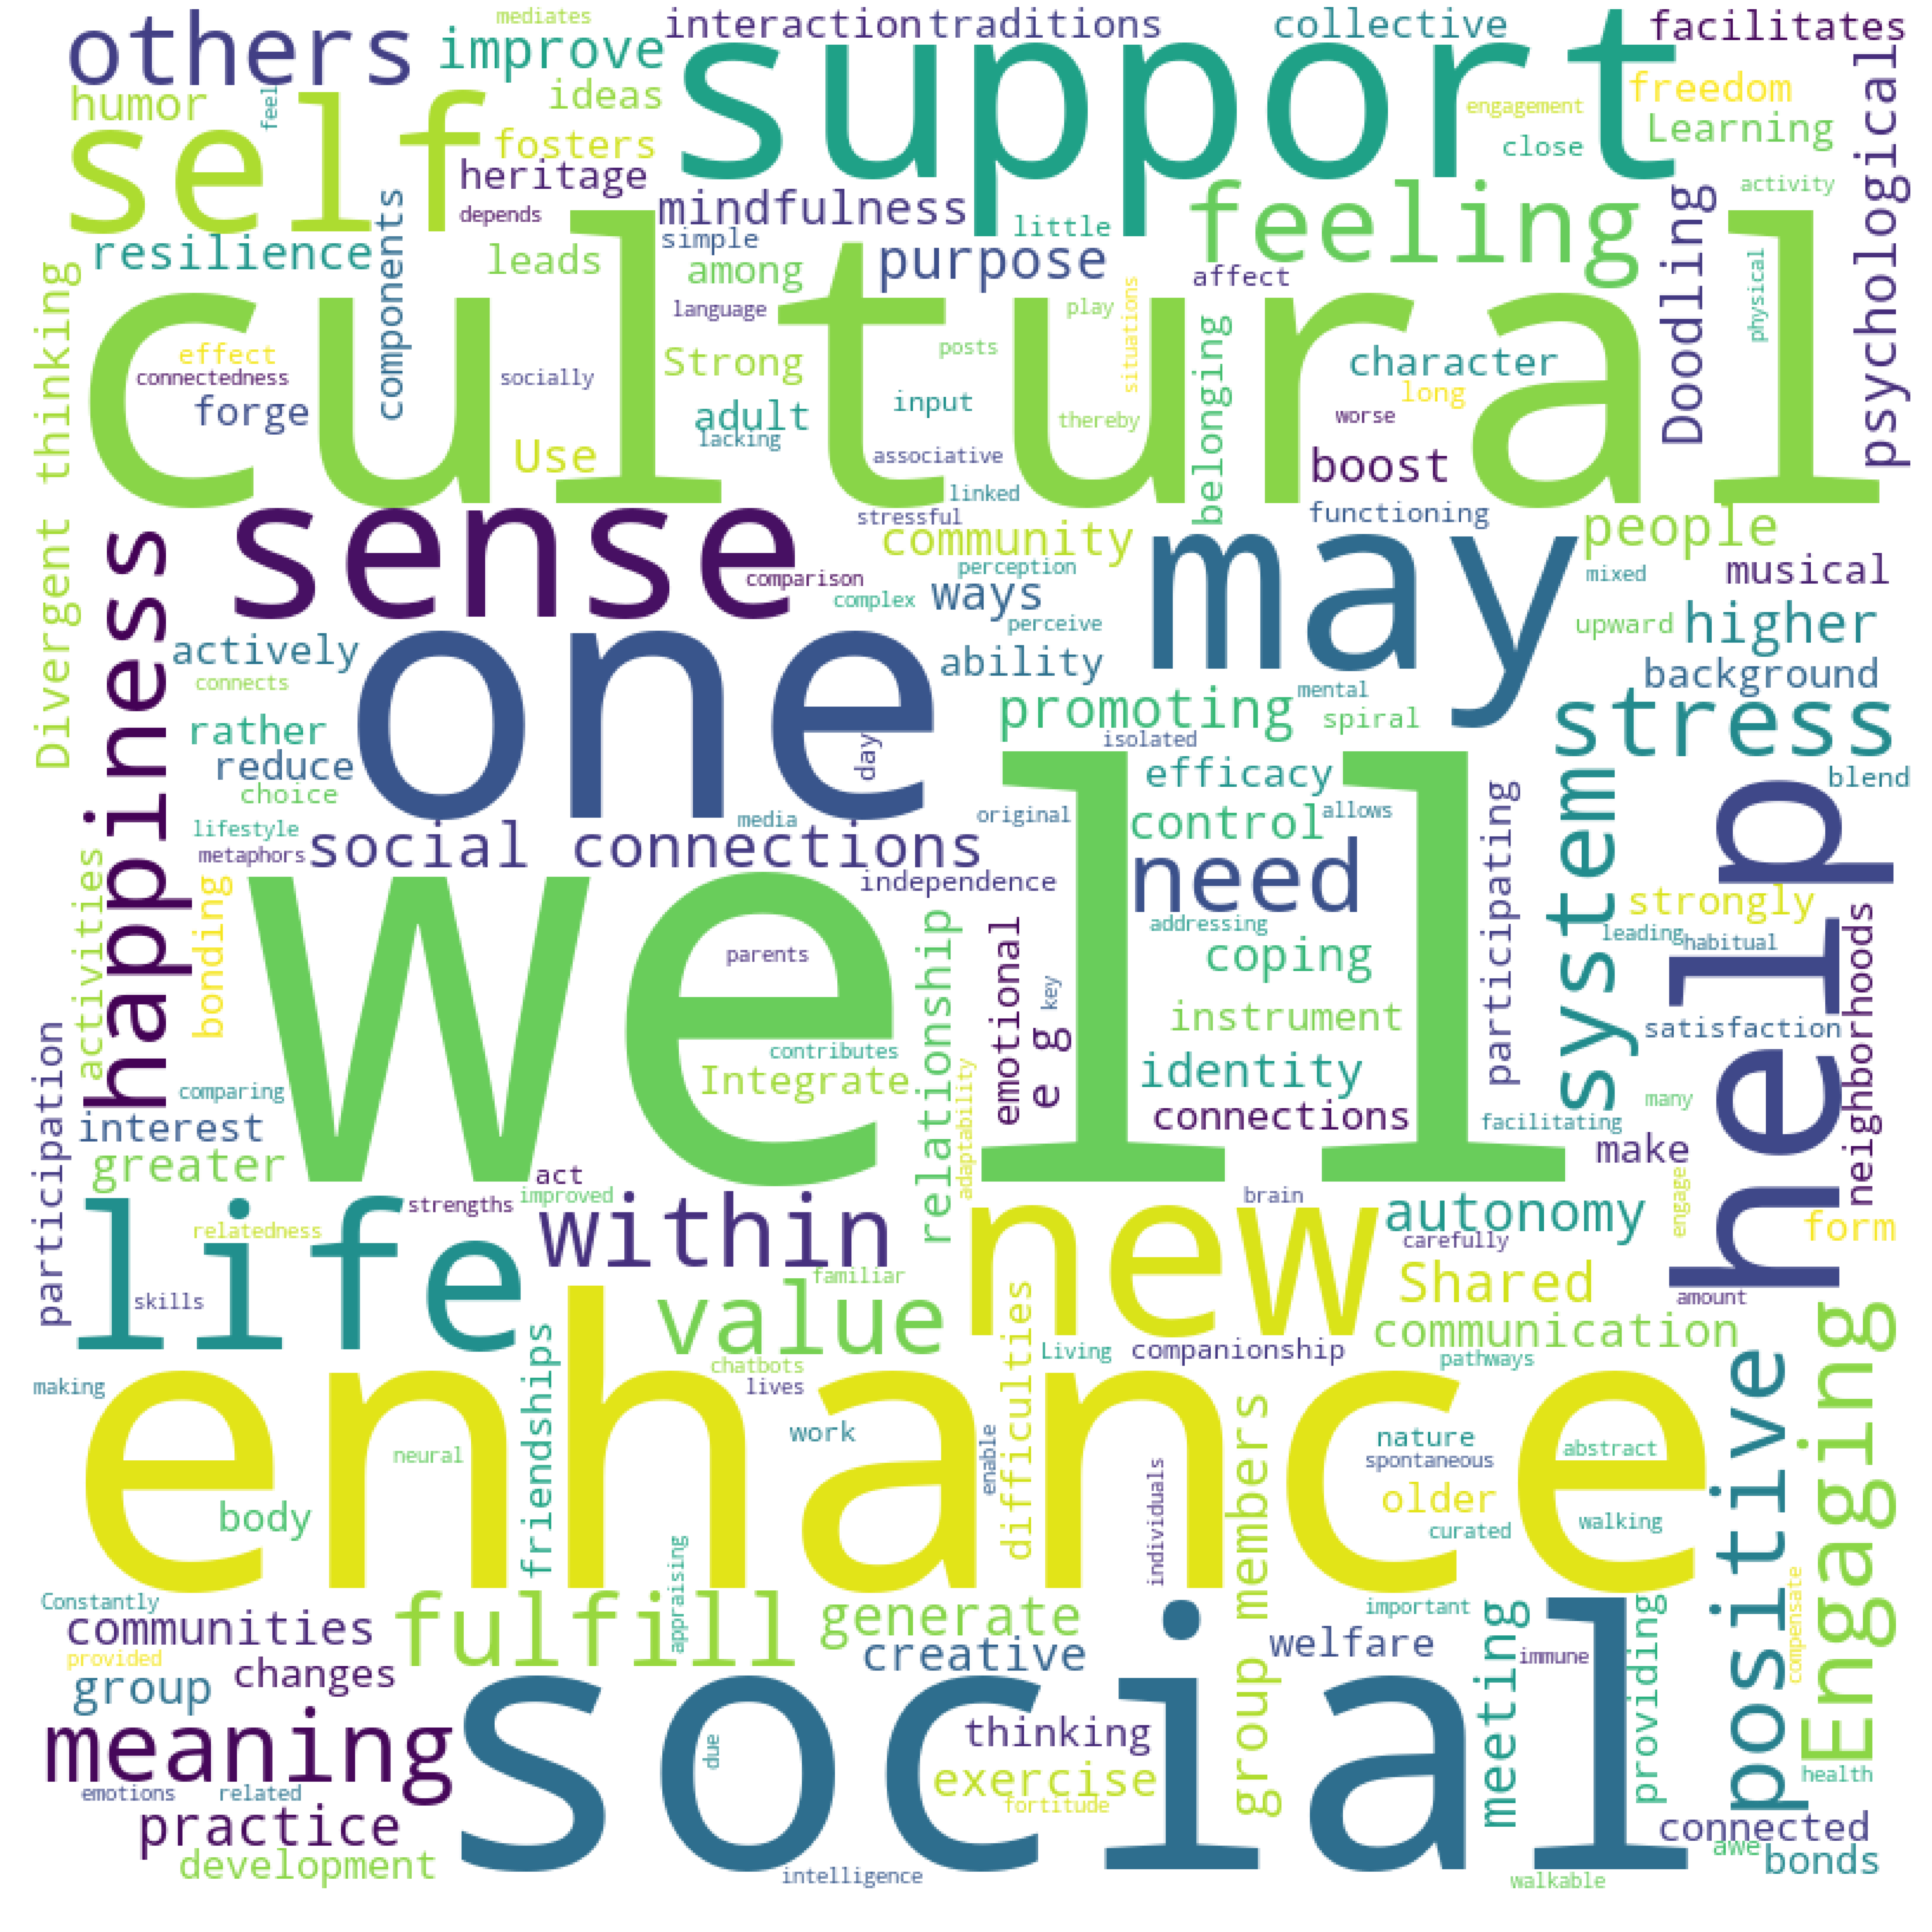
Expert-selected LLMCG (d): Here, the emphasis seems to be on community, personal feelings, and shared experiences. ‘Support’, ‘sense’, ‘one’, ‘we’, and ‘social’ are recurrent terms, highlighting collective experiences and social interconnectedness.
B.1.2 Connection graph analysis.
The connection graphs in Figure 7 depict relationships between various themes and concepts for different groups.
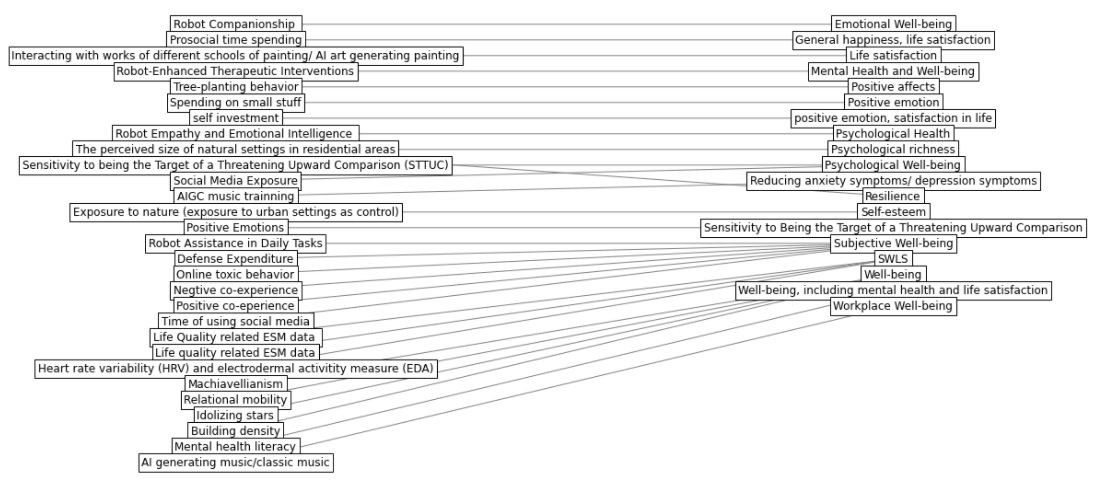
Control-Human (a): The graph for this model suggests a notable interplay between artificial intelligence themes, such as ‘Robot Companionship’ and ‘AI generating music/classic music’, and human well-being factors like ‘Heart rate variability (HRV) and electrodermal activity measures’ and ‘Life quality based ESM data’. This suggests research or perspectives focusing on how AI, robotics or algorithms can impact and measure human well-being.
Control-Claude (b): This graph emphasizes different facets of well-being, from ‘Emotional Well-being’ to ‘Workplace Well-being’. It also considers both positive elements, such as ‘Growth mindset’ and ‘Shared novel experiences’, and potential challenges, like ‘Reducing anxiety symptoms’. This indicates a holistic view of well-being.
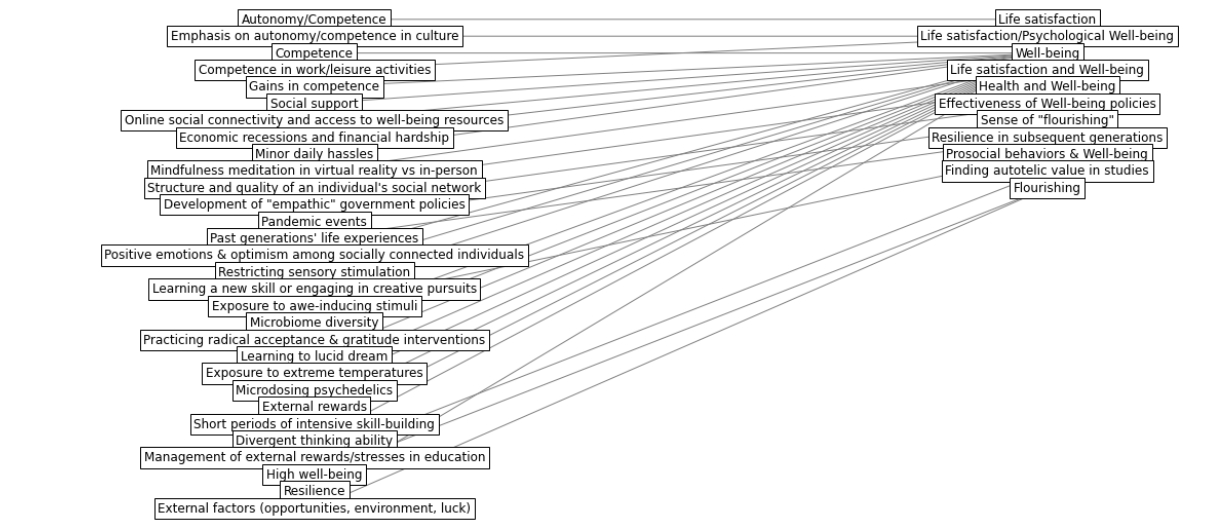
Random-selected LLMCG (c): There’s a strong focus on societal and structural determinants of well-being, such as ‘Economic condition and financial hardship’, ‘Autonomy/Competence’, and ‘Management of health-related issues’. It seems to highlight the broader environmental and cultural factors affecting individual well-being.
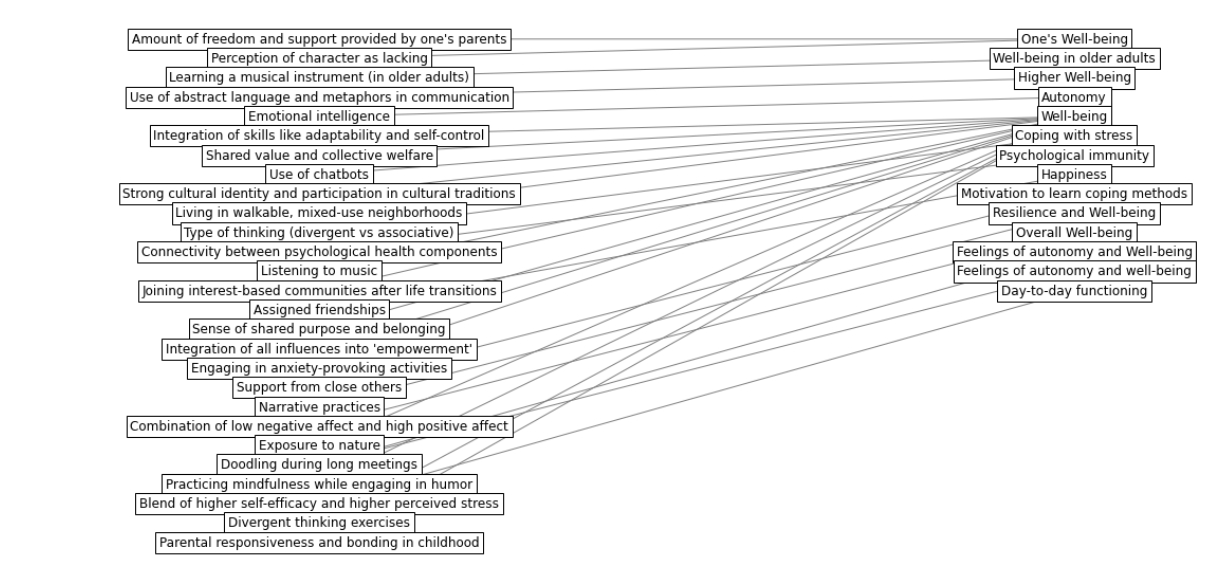
Expert-selected LLMCG (d): This graph reflects more nuanced interconnections between personal experiences and environmental factors. Notable themes include the ‘Living in walkable, mixed-use neighborhoods’, ‘Exposure to nature’, and the ‘Integration of all influences into empowerment’. It suggests a focus on how diverse life experiences, settings, and exposures can interplay to shape an individual’s well-being.
B.2 Deep Semantic Analysis on Hypothesis Examples
Figure 9 illustrates the grouping of various cases shown in Table 12, highlighting the proximity of hypotheses C4 and C8 within the deep semantic space of BERT (conner, bottom left). Both C4 and C8 involve interactions with technological entities that provide social support, suggesting a thematic overlap and highlighting the impact of social support mechanisms on well-being. Expanding this group to include C3, which also revolves around the theme of narrative-based therapeutic recovery, suggesting a broader category of technologically mediated psychological support. In contrast, the distance between the C7 and C4 and C8 group could indicate that their thematic links are less direct, which introduces an entirely different element, humor, combined with mindfulness, representing another separate avenue to improve well-being.
| Dear PhD students, |
| I would greatly appreciate it if each of you could propose at least three original research hypotheses related to well-being. The specific requirements are as follows: |
| Each hypothesis should involve well-being. That is, well-being (e.g. life satisfaction, positive emotions, psychological health, etc.) should be either the independent variable, or the dependent variable, or the mediator in the research hypotheses you propose. |
| Please ensure the research hypotheses you submit are novel. Related personnel will check for duplication upon receiving the hypotheses. If the duplication check finds that identical research questions have already been investigated in prior publications, it will unfortunately have to be considered unsatisfactory. In such cases, I would need to kindly request you resubmit with different hypotheses. The subsidy for this task is 100 RMB per person. |
| Please generate original research hypotheses.The specific requirements are as follows: |
| 1. Each hypothesis should involve well-being. That is, the variables used to measure well-being (e.g. life satisfaction, positive emotions, psychological health, etc.) should be either the independent variable, or the dependent variable, or the mediator in the research hypotheses you propose. |
| 2. In your research hypothesis, it is essential to include the independent variable and the dependent variable, as well as the directional relationship between them. If possible, include mediating variables. Other variables, such as moderating variables, are not mandatory. |
| 3. Please ensure the research hypotheses you submit are novel. That means you should conduct this task in two steps. After generating hypothesis, please check for duplication before submitting them. If the duplication check finds that identical research questions have already been investigated in prior publications, replace them with different novel hypotheses. |
| 4. Please output in format for csv file, which is a table with columns for the independent variable (IV), dependent variable (DV), the relationships between IV and DV (either positive or negative), mediator, moderator, and description of the hypothesis in natural language. The columns for mediators and moderators can be left blank if your hypothesis doesn’t involve them. |
| Dear Reviewers: |
| Thank you for participating in this evaluation process. In the table provided, you will find various psychological research ideas. We kindly request you to evaluate each hypothesis based on two key criteria: Usefulness and Novelty. |
| Novelty: This criterion focuses on the originality and uniqueness of the hypothesis. How new or unprecedented is the concept? A hypothesis that introduces fresh perspectives or challenges existing views would score high for novelty. |
| Usefulness: Please rate the practical relevance and applicability of each hypothesis. Would it be beneficial for researchers, practitioners, or the general public? A hypothesis that provides actionable insights or has potential to drive meaningful change would be rated high on this criterion. |
| Please provide a score (1-10) for each criterion for every hypothesis. Your expert opinions will significantly aid in understanding and prioritizing these hypotheses. |
-
•
: The 2D -SNE feature representation of the idea in group , derived from the respective high-dimensional embedding.
-
•
: The set of all groups, with representing an individual group.
-
•
: A dictionary containing lists of pairwise distances for each group .
| Case # | Research hypotheses | Novelty | Usefulness |
| Control-Human | |||
| C1 | Individuals interacting with robots that exhibit empathy and emotional intelligence will experience improved psychological health, and this relationship will be mediated by their enhanced emotional regulation capabilities. | 1.119 | 0.997 |
| C2 | Listening to music generated by an AI trained on one’s biometric data/narrative of self will lead to greater felt understanding and social connectedness, resulting in reduced anxiety symptoms. | 1.330 | 0.875 |
| Control-Claude | |||
| C3 | Creating a coherent narrative where negative experiences lead to positive outcomes will facilitate post-traumatic growth by enabling meaning-making. | 0.758 | 0.777 |
| C4 | Interacting with social robots will help reduce loneliness in older adults by providing perceived social support. | 0.758 | 1.422 |
| Random-selected LLMCG | |||
| C5 | Virtual resilience: Online social connectivity and access to well-being resources can build ‘virtual resilience’ and enhance well-being during stressful events like pandemics. | 0.641 | 1.109 |
| C6 | Exposure to awe-inducing stimuli increases prosocial behaviors and well-being through activating similar neural circuits. | 0.876 | 0.561 |
| Expert-selected LLMCG | |||
| C7 | Practicing mindfulness while engaging in humor (e.g., laughing yoga) will have an additive effect on well-being. Combining mindfulness techniques with humor and laughter may enhance the benefits of each practice on well-being. The positive effects of mindfulness and humor could build on each other. | 1.212 | 0.561 |
| C8 | Use of chatbots can fulfill the need for communication and enhance connectedness, thereby promoting well-being in socially isolated individuals. | 1.383 | 1.114 |
| Comparison | Spearman | -value |
| Novelty | ||
| Reviewer #1 vs. Reviewer #2 | 0.387 | |
| Reviewer #1 vs. Reviewer #3 | 0.172 | 0.059 |
| Reviewer #2 vs. Reviewer #3 | 0.069 | 0.453 |
| Usefulness | ||
| Reviewer #1 vs. Reviewer #2 | 0.177 | 0.053 |
| Reviewer #1 vs. Reviewer #3 | 0.221 | 0.015 |
| Reviewer #2 vs. Reviewer #3 | 0.376 | |