Can Early Dark Energy be Probed by the High-Redshift Galaxy Abundance?
Abstract
The Hubble tension and tension are two of the major issues of the standard Cold Dark Matter (CDM) model. The analysis of the Cosmic Microwave Background (CMB) data acquired by the Atacama Cosmology Telescope (ACT) and the large-scale () Planck Telescope manifest their preference for the Early Dark Energy (EDE) theory, which was set to alleviate the Hubble tension by decreasing the sound horizon , and gives km s-1 Mpc-1. However, the EDE model is commonly questioned for exacerbating the tension on top of the CDM model, and its lack of preference from the late-time matter power spectrum observations, e.g., Baryon Oscillation Spectroscopic Survey (BOSS). In light of the current obscurities, we inspect if the high redshift galaxy abundance, i.e., Stellar Mass Function/Density (SMF/SMD) and Luminosity Function (LF), can independently probe the EDE model and ameliorate the challenges it encounters. Our result shows that the EDE model produces more observable galaxies than CDM at . The LF and SMD, in particular, are consistent with the recent unexpectedly high results observed by the James Webb Space Telescope (JWST), which may posit another observational hint of EDE. This result also implies an efficient suppression mechanism of the galaxy formation rate that leads to the conversion between EDE- and CDM-like Universe around , and that tension could be more of a tension of galaxy evolution than cosmology, hence diminishing its impact on EDE or CDM theory.
keywords:
cosmology – dark energy – galaxies: high-redshift – galaxies: abundances1 Introduction
The discovery of the accelerating expansion of the Universe and the resulting cosmological constant dark energy (Riess et al. (1998); Perlmutter et al. (1999) ) led to the transition of the cosmological model from Einstein de Sitter () to CDM Universe. This was later recognised as the standard model of cosmology for it was endorsed by numerous follow-up observations. However, despite the success, the last decade witnessed growing doubts regarding this model, due to the appearance of the (third) Hubble tension that implies the values of the Hubble constant measured from the early and late Universe are inherently inconsistent. For instance, when assuming CDM, Planck Collaboration et al. (2020a) derived km s-1 Mpc-1 from CMB, while the direct local observational result from Riess et al. (2022) showed that km s-1 Mpc-1. Although many efforts have been made to check whether the inconsistency between the local direct and early indirect measurement of is caused by some statistical flukes or overlooked observational errors, the consensus still has not been reached as yet. Instead, the rising concern is that the modification of the cosmological model itself is required to alleviate the tension.
On top of the Hubble tension, the CDM model is also challenged by the anomaly on the matter clustering, dubbed as the tension. The factor measures the amplitude of the matter clustering and is closely related to the growth rate of the large-scale structure via , where . The observed result of this factor from the Weak Lensing (WL), e.g., Kilo-Degree Survey (KiDS), is (Asgari et al. (2021)), about lower than the expected value from CMB that gives (Planck Collaboration et al. (2020b)). Likewise, there are two possible approaches towards the alleviation of the tension, the observational/statistical errors, and the alteration of the cosmological model. The consensus, however, has not yet been reached either. More information about the aforementioned tensions can be found in Abdalla et al. (2022).
Schöneberg et al. (2022) summarised and compared the most common 17 theories proposed to resolve the Hubble tension and among them, the EDE theory is one of the few that carries both theoretical capability and observational evidence. The basic idea of EDE is to introduce a scalar field that behaves like dark energy before the recombination and dilutes faster than the radiation such that the post-recombination evolution remains to be CDM. This extra component decreases the physical sound horizon by slightly increasing the cooling rate of the Universe. As a result, the corresponding inferred from CMB is increased accordingly.
The most direct observational evidence of EDE by far comes from Poulin et al. (2021); Hill et al. (2022), in which they analysed the CMB temperature power spectrum data from the Wilkinson Microwave Anisotropy Probe (WMAP), ACT and Planck Telescope. The results show that although EDE is not favoured by the full-scale Planck data, the preference of the model is shown in WMAP+ACT. The main difference between Planck and ACT is their small scale, e.g. and . Smith et al. (2022b) further indicated that the truncated Planck data limited to also shows a preference for EDE. On the other hand, the observational result of the late-time matter power spectrum made by BOSS, e.g., Hill et al. (2020), does not reveal clear signs of EDE. However, other studies such as Simon et al. (2023); Herold et al. (2022) argued that the conclusion drawn from BOSS power spectrum could be affected by the other non-cosmological factors, e.g., volume effects or the normalisation of the window function. More research attempting to search for the trace of EDE can be found in Jiang & Piao (2022); Lin et al. (2020); Goldstein et al. (2023); Gómez-Valent et al. (2022); Reeves et al. (2023); Smith et al. (2022a); Murgia et al. (2021), in which various probes (e.g., weak lensing and Lyman- forest) and alterations of the model (e.g., massive neutrinos) were applied. Generally speaking, at this stage, it is still far from concluding the debate over the observational evidence of EDE. In light of the ambiguity of the current observational results, it is indispensable to verify the model with another probe and break the stalemate on the small-scale and post-recombination epoch.
In this paper, we aim to study if the abundance of the galaxies at high redshift is capable of probing the EDE. This idea was first proposed by Klypin et al. (2021), in which they calculated the Halo Mass Function (HMF) in the EDE scenario and found that there are more halos formed than in the CDM case. Interestingly, this phenomenon is more prominent at higher redshift. Hence, the galaxy abundance, such as HMF, satisfies what is required to study the EDE model in both ways: 1. The observation of the galaxy abundance can be conducted on small-scale surveys, which makes it possible to extract information from the galaxy distribution at ultra-high redshift. Note that the typical redshift of the BOSS matter power spectrum is below (see e.g., Simon et al. (2023); Hill et al. (2020)); 2. The expectation of a predominant outnumbered halo number density at ultra-high redshift in the EDE model could make it distinguishable from CDM. Thanks to the deep field observation archives from e.g., Hubble Space Telescope (HST) and Spitzer Infrared Array Camera (Spitzer/IRAC), as well as the advent of the James Webb Space Telescope data, the detection of the EDE on the high redshift galaxy abundance is now ready.
An unexpected feature observed by JWST is that it appears to suggest that the number density of the massive galaxies at redshift is considerably higher than the extrapolation from the previous studies (Labbé et al. (2023)). Specifically, Boylan-Kolchin (2023) argued that these massive galaxies lie on the upper limit of what is allowed by physics, which requires all baryons to be converted into the stellar mass of these objects. Although there are also other speculations regarding the adjustment of the Initial Mass Function (IMF), e.g., Steinhardt et al. (2023), or the uncertainty on the photometric redshift (Arrabal Haro et al. (2023)), this surprising discovery may imply that the current galaxy formation theory or the CDM itself require further contemplation. As we shall see, the predicted galaxy abundance under the EDE model is consistent with the unexpectedly high number density of the massive galaxies found by JWST.
On top of all of the concerns above, we also notice that the change in cosmology itself can simultaneously affect the estimation of the stellar mass through the change of the galaxy formation history. Alternatively, one might stick with the luminosity of the galaxies to avoid the uncertainty of the stellar mass estimation, which involves the composite of cosmology and various baryonic interaction processes. However, the observational result of the luminosity depends on the knowledge of the distance modulus and the dust attenuation (e.g., Meurer et al. (1999)) that may behave differently at the ultra-high redshifts. Bearing all in mind, we will show that the luminosity is not noticeably affected by EDE and leave the full-scale estimation of the stellar mass under EDE for future work since it is beyond the topic of this paper.
The structure of this paper is as follows. In Section 2, we introduce the theory of EDE. Then we present the way to predict the high redshift galaxy abundance in Section 3. The comparison of our predictions with the observational data is described in Section 4. Finally, we conclude this paper in Section 5.
2 Early Dark Energy Model
The angular size of the sound horizon at the epoch of recombination is precisely measured by the CMB observations. Here and are the physical size of the sound horizon and the distance towards the surface of the last scattering, respectively. Starting from a fixed and a given cosmological model as the preconditions, we can derive the corresponding as follows (Kamionkowski & Riess (2023)),
| (1) |
where is the Hubble parameter at the last scattering, . and represent the total energy density and the density ratio of the baryons to photons at , respectively. By decreasing the integral of the denominator, i.e., increasing the energy density before recombination, the inferred can be elevated accordingly, and the corresponding physical size of the sound horizon
| (2) |
is decreased. Here is the sound speed of the baryon-photon fluid. The collection of the methods following this type of mechanism is normally dubbed as the Early-time solution, of which a representative example is the EDE model we apply in this paper.
The EDE model by far is the collective name of an ad hoc postulation with various alterations of dynamics. In this paper, we focus on the most studied Axion-like EDE model derived from the string theory (McDonough & Scalisi (2022)). As elaborated by Poulin et al. (2018, 2019); Karwal & Kamionkowski (2016); Kamionkowski & Riess (2023), the EDE model introduces an oscillating axion scalar field with a potential
| (3) |
to accelerate the cooling rate of the Universe before the recombination takes place. Here denotes the effective mass of the axion particle, represents the decay constant, and is a re-normalisation factor so that . The decay rate of the axion field is determined by the index via the equation of state . When , it behaves like the normal dark matter axion field. However, if the field decays faster than radiation so that the post-recombination epoch remains to be the CDM-like Universe. The EDE field is initially frozen at a fixed value until the critical redshift , after which it starts to oscillate and decay. The fractional energy density of EDE at this point is denoted by . The first observational evidence showed by Poulin et al. (2021) indicated that if , the best-fit EDE parameters reconstructed from the ACT data are and , which give km s-1 Mpc-1.
There has been a growing number of studies, following the first observational hint, attempting to search for more evidence of EDE from CMB. Smith et al. (2022b) took the South Pole Telescope (SPT) data into account and found that ACT+SPT+Planck polarisation gives a similar conclusion that favours the EDE model. They also found that the Planck temperature power spectrum also shows a preference for EDE if the small-scale data () are discarded. More works, e.g., Jiang & Piao (2022); Hill et al. (2022), also found pro-EDE evidence from the observations of CMB.
However, applying the EDE-like mechanism to resolve the Hubble tension comes with the cost of an exacerbated tension since it results in a denser Universe. Generally speaking, the locally observed values of from e.g., Weak Lensing, are lower than those inferred from CDM. For instance, Asgari et al. (2021) analysed the data from KiDS and obtained , while the result from Planck Collaboration et al. (2020b) is about higher and reaches . In comparison, the result from Poulin et al. (2021) showed that in the EDE model, which is slightly higher than the CDM case. As a consequence, most of the post-recombination observations do not show any preferences on EDE over CDM. For instance, Goldstein et al. (2023) attempted to use Lyman- forest to constrain the EDE parameters and found that with km s-1 Mpc-1, away from the Supernovae and for the Equation of State of dark energy (SH0ES) result (Riess et al. (2022)). On top of that, the signal of EDE does not emerge in the late-time large-scale structure (LSS) observations, either. Hill et al. (2020) reanalysed the EDE scenario with the LSS data, including CMB lensing, Baryon Acoustic Oscillation (BAO), Redshift Distortion (RSD), Dark Energy Survey Year 1 (DES-Y1), Hubble Source Catalog (HSC) and KiDS, and found no clear signal of EDE. This is further indicated in Herold et al. (2022) that gives , a value too small to resolve Hubble tension. Although Simon et al. (2023) reassessed the BOSS data by applying a new normalisation method of the window function and slightly ameliorated its disfavour over EDE, the challenge of tension remains intact for the increment of the matter density is an inevitable consequence of EDE.
Briefly speaking, despite the “spark of hope” to resolve the Hubble tension lit by the EDE theory, the mechanism behind it is still under challenges from the small-scale Planck temperature power spectrum and the low-redshift observations. The detailed reviews of the current dilemma of EDE in 2023 can be found in McDonough et al. (2023); Poulin et al. (2023). Be that as it may, one notices that the current analyses focus on the recombination and late-time Universe while omitting the observations of the post-recombination high redshifts, e.g., the Cosmic Dawn and the reionisation. We argue that the study of EDE in these epochs can complement what is needed for resolving the current stalemate: 1. It provides an alternative way to study the small-scale problem of EDE; 2. It is relatively less complicated by the late-time non-linear process of the cosmic structure/galaxy formation history which is one of the speculations of the reason for the tension. A new probe from the realm of the small-scale and post-recombination high redshift is yearned for the verification of EDE. As we shall see below, the galaxy abundance might indeed bear the probability to deliver the just cause for it.
3 Galaxy Abundance in the EDE Scenario
The basic idea of the galaxy formation theory in the modern perspective is that the dark matter halo distribution and merger history form the skeleton of the galaxy distribution. Then, the baryons gravitationally bound by these systems start to form stars, during which various kinds of feedback (such as stellar and AGN feedback) take place and suppress or quench the further star formation process. The basic empirical approach towards galaxy formation theory is the Abundance matching, which implies that the most massive galaxies reside in the most massive halos (Wechsler & Tinker (2018)). Consequently, the predicted abundance of the galaxies, normally expressed in terms of the stellar mass function or luminosity function, depends on the halo mass function and the scaling relation between the halo mass , stellar mass , and luminosity at the ultraviolet band (or the absolute magnitude ). In Section 3.1, we compare the halo mass functions in the EDE and CDM models. In particular, We adopt the EDE and CDM parameters inferred by Smith et al. (2022b) and Planck Collaboration et al. (2020a), respectively. The exact values of these parameters are listed in Table 1. Then, we apply the empirical scaling relations to derive the corresponding stellar mass functions in Section 3.2 and luminosity functions in Section 3.3.
| Parameter | EDE | CDM |
|---|---|---|
| 0.7420 | 0.6736 | |
| 0.1356 | 0.1200 | |
| 1.0010 | 0.9649 | |
| 0.8446 | 0.8111 | |
| 3 | ||
| 3.526 | ||
| 0.163 |
3.1 Halo Mass Function
Broadly speaking, the derivation of the halo mass function depends on two aspects: the cosmology that mainly affects the matter power spectrum and the properties of the dark matter that determine the formation and evolution of the halos. In EDE theory, the properties of the dark matter stay unchanged, such that we only need to consider the change of the matter power spectrum for the approximation of the halo mass function in the EDE/CDM model. In order to stay consistent with previous studies, we make use of the AxiCLASS (Smith et al. (2020); Poulin et al. (2018)), a modified version of the Einstein-Boltzmann code CLASS (Blas et al. (2011)), to compute the matter power spectra in the scenarios of EDE and CDM.
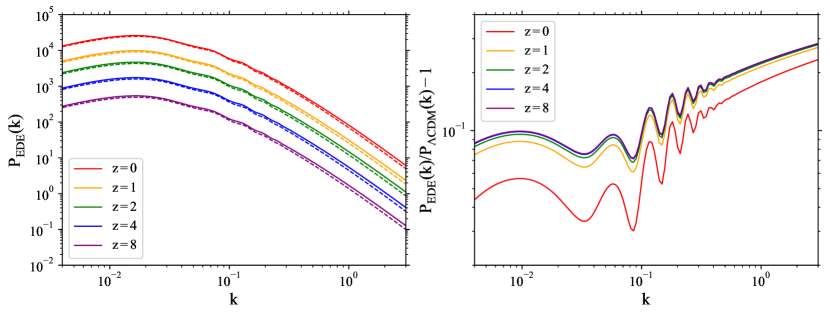
The left side of Figure 1 shows the matter power spectra of EDE (solid lines) and CDM model (dashed lines) in 5 different redshifts. It is clear that the EDE generates larger power than CDM at all scales and most prominently, at the small scale. This is caused by the slightly increased value of the primordial power spectrum index from the best-fit EDE parameters shown in Table 1. Consequently, the EDE Universe is expected to be denser than the CDM case (Klypin et al. (2021)). On top of that, if we compare the ratio of the two scenarios which is shown on the right side of Figure 1, we see that the difference between them decreases with redshift, i.e., the Universe becomes more CDM-like in an EDE Universe. This phenomenon is significantly more prominent in the halo mass function as we shall see below. Finally, with the matter power spectra prepared, we can calculate the corresponding theoretical halo mass function.
We use the halo mass function approximation from Sheth & Tormen (1999) to estimate the number of halos in the EDE model (also see Klypin et al., 2021; Despali et al., 2016, for more information). The halo mass function describes the number density of the halo with mass at redshift . It is formulated by the smoothed matter power spectrum as follows,
| (4) |
Here
| (5) |
denotes the extent of the overdensity within the region confined by the window function , where is the mass enclosed inside the radius , . The is the matter power spectrum extrapolated to redshift as is shown in Figure 1. Note that the window functions are normally top-hat or Gaussian. Next, it is commonly accepted to assume that the threshold of the overdensity is at which the density of the overdense region is high enough to form a halo. Define the relative height of the density peak by
| (6) |
so that the halo mass function can be rewritten as
| (7) |
where and the simulated coefficients, , determine the normalisation, high mass cut-off, and low mass shape of the function, respectively.
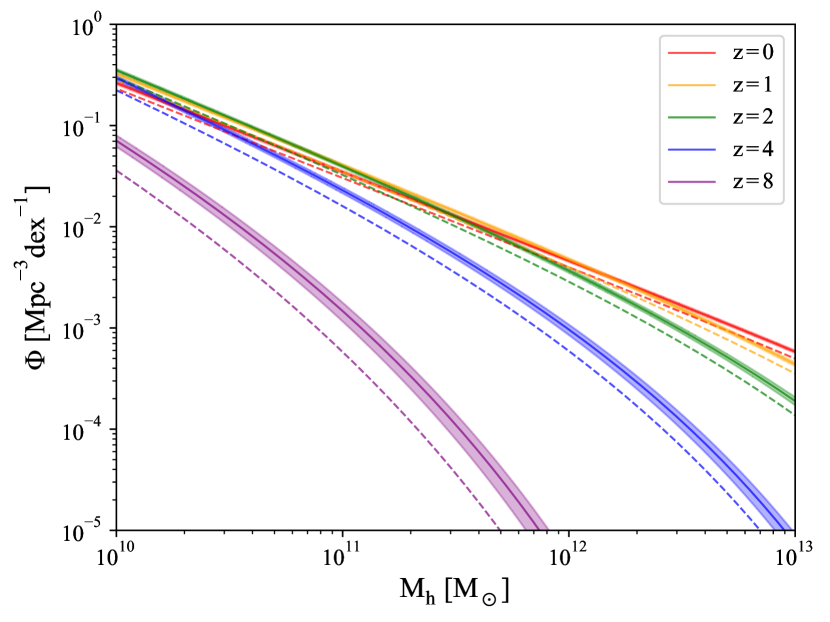
In practice, we use hmf (Murray et al. (2021, 2013)) and adopt the coefficients from Despali et al. (2016), i.e., to calculate the halo mass functions for the EDE model. In their work, they found that the halo mass function remains universal for Planck 2013 CDM Universe and when , which is higher than the values of both EDE and Planck 2018 CDM listed in Table 1. We therefore argue that their result is a legitimate choice for our purpose, as the elevated value of is the main consequence of EDE in the post-recombination epoch. Figure 2 shows the redshift and mass evolution of the halo mass function. Interestingly, the uncertainty gets larger at the massive end as the redshift goes higher. This phenomenon is consistent with the result in Despali et al. (2016) since the halo mass function is more sensitive to the normalisation factor and the high mass cut-off parameter , as gets larger with a higher redshift.
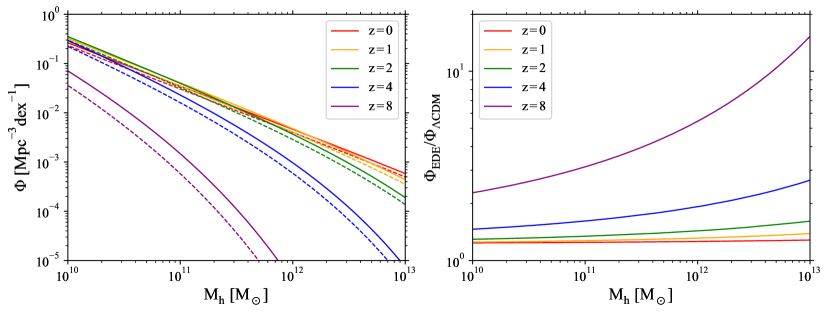
To see the difference between the EDE and CDM predictions more clearly, we neglect the uncertainty of the coefficients and re-plot the halo mass functions of both models and their ratio in Figure 3, where the EDE is denoted by the solid lines and the dashed lines are the CDM cases. As is expected, the EDE model produces more halos in all redshifts. When , both cases are almost identical, while the difference of them gets larger at higher redshift. This phenomenon is caused by the fact that the exponential part of Equation 7 dominates the halo mass function when is large, which is equivalent to the function becomes more sensitive to as redshift goes higher (Klypin et al. (2021)). Hence, through Equation 5, the effect of EDE on the power spectrum is revealed via a denser distribution of the dark matter halo. In this case, the feature of the EDE halo mass function is therefore manifested in two aspects: 1. It is consistent with CDM in the local Universe; 2. It shows an observable deviation from CDM in the early Universe.
Therefore, bearing the tight bond between the halos and galaxies in mind, according to the abundance matching, we expect that the feature of the outnumbered massive halo density in the EDE model when should also be propagated to the high redshift galaxy abundance, albeit the number density difference of the galaxies is not expected to be as high as the halos due to the baryonic feedback processes of the galaxy formation history and, as was demonstrated in both semi-analytical studies and simulations (Efstathiou (1992); Bullock et al. (2000); Simpson et al. (2018)), that most of the low mass halos are unable to form galaxies, both of which suppress or quench the further merging and enrichment of the galaxies.
3.2 Stellar Mass Function
The mass of the dark matter halo determines the maximum scale that a galactic system can reach. Empirically speaking, the principle of their relationship follows the abundance matching as we mentioned above. However, their relationship is not linear but depends on a composite of various dynamic processes, such as the feedback from star formation or AGN. In particular, the Stellar-to-Halo Mass Ratio (SHMR, or ) at high redshift may differ from the low redshift case, for the stars and AGN need time to form. Notwithstanding the previous simulations being implemented to study the galaxies with high precision, it remains an open question to simulate the formation history of them accurately. Therefore, we apply the empirical SHMR based on known data to establish our prediction of the galaxy abundance, for it contains the authentic information required to reconstruct the relation between halos and galaxies, despite the ambiguity of the specific mechanisms concealed within the black box of the galaxy formation process.
Stefanon et al. (2021) analysed the stellar mass of the galaxy candidates observed by HST and Spitzer at and found that the SHMR relation does not strongly depend on redshift. Namely,
| (8) |
Here is the normalisation factor, M⊙ is the characteristic halo mass at which the star formation efficiency reaches its maximum. The slope (Tacchella et al. (2018)) and denote the shape of the relation at the high-mass and low-mass regimes, respectively.
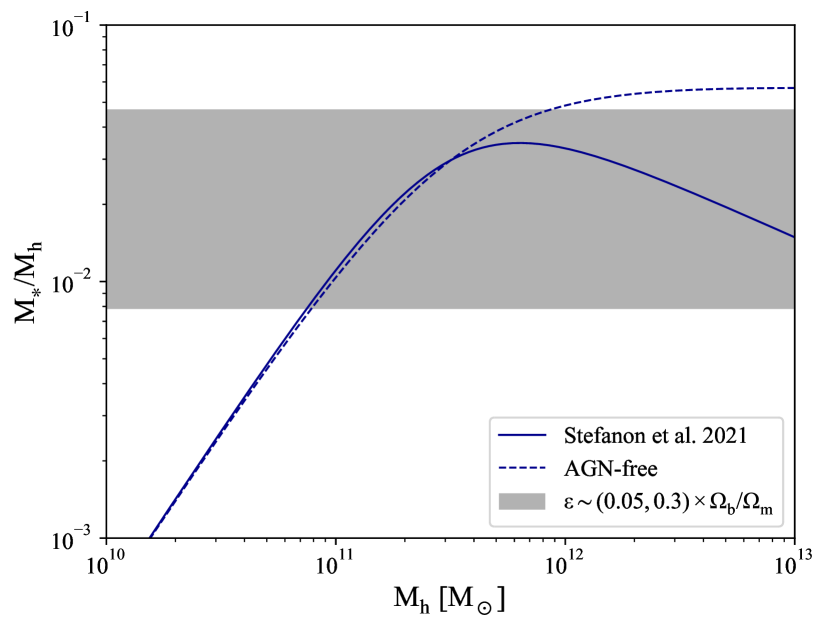
The SHMR expression of Equation 8 also indicates that the galaxy formation efficiency is not a constant or a monotonically increasing function, but peaks at around M⊙, as is shown in Figure 4 (the blue solid line). In comparison, we also draw the common assumption that per cent of the baryonic mass is converted into stars (the grey area), i.e., . It is clear that the low-mass halos cannot efficiently form galaxies due to their limited capacity to bind the masses contained in them. On the other hand, the turnover of the massive end indicates the potential strong feedback at the high redshift that quenches further enrichment of the stellar mass in these halos. In the low redshift regime, the suppression of the massive end is normally considered the result of the AGN feedback (Wechsler & Tinker (2018)). However, considering only very few numbers of AGN are detected in the galaxies at (e.g., the rare and most distant AGN up-to-date, CEERS_1019 at , Larson et al. (2023) and GN-z11 at , Scholtz et al. (2023)), the mechanism behind the turnover above might be different from their local counterparts, for AGN also needs time to form. Alternatively, since the SHMR at is poorly constrained by the pre-JWST data, we can also speculate that the turnover does not exist at the early stage of the Universe. Therefore, we also extrapolate an AGN-free SHMR by letting and remove the turnover (blue dashed line). Instead, if future observations indeed find the turning point, the mechanism behind the suppression at the massive end might be the collective result of the insufficient merging process between the galaxy progenitors within the given time and the early-formed AGN. Nevertheless, considering the redshift-free relation of Equation 8 stands as early as , we assume that the potential AGN feedback is not a major concern for applying the SHMR at a higher redshift.
Meanwhile, the redshift-free empirical scaling relation suggests that the early formation process of the galaxies is dominated by the dark matter halos rather than the baryonic compositions which will lead to the evolving feedback mechanisms that alter the formation process over time. According to Tacchella et al. (2018), the redshift-free SHMR does not stand below . Considering the purpose of our work is to investigate the galaxies at high redshift, we therefore cautiously suggest not to extend the usage of this scaling relation for redshift , for the late-time galaxies are formed in a much more dusty and complicated environment than their early-time progenitors.
Finally, by applying the Jacobian derived from Equation 8 to the halo mass function, Equation 4, we obtain the corresponding stellar mass function as is shown in Figure 5,
| (9) |
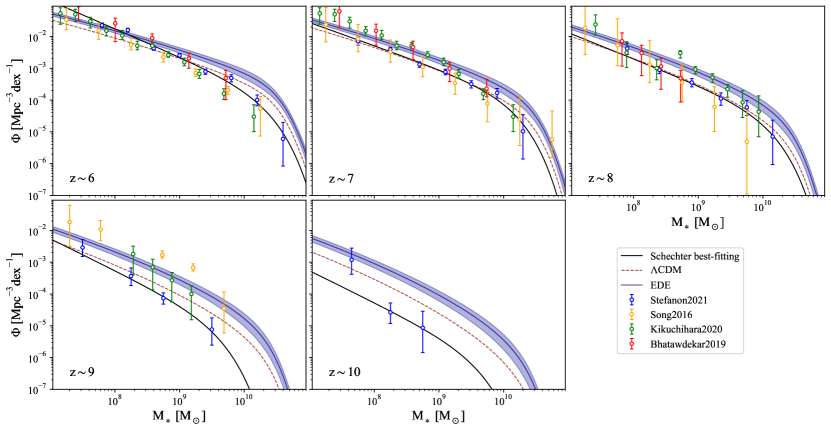
The black solid lines on the figure are the Schechter best-fitting which is the same as Figure 7 in Stefanon et al. (2021), and the blue solid and red dashed lines are the EDE and CDM predictions, respectively. The error shade of the EDE lines is propagated from the uncertainties of the halo mass function (Figure 2) and the SHMR scaling relation parameters . We also plot the HST/Spitzer IRAC data from Stefanon et al. (2021); Song et al. (2016); Kikuchihara et al. (2020); Bhatawdekar et al. (2019) for comparison. The result shows that the predictions from CDM appear to fit better with the existing data. However, it is yet too soon to conclude that EDE is excluded by the high redshift galaxy abundance already. As we shall see in the next two sections, the advent of the JWST data may have been a “game-changer” in our investigation.
The application of the EDE model may also affect the estimation of due to e.g., the change of the distance measurement, the potentially earlier starting time of the galaxy formation process and a denser cool gas distribution. The distance change may slightly decrease the measured value of the luminosity, as we shall see in Section 3.3, and thus the estimation of . In contrast, the potential changes in the galaxy formation process itself are expected to lead to an increment in the measurement. In this paper, we apply the vanilla results of the stellar mass data and neglect the possible shift of it under the EDE model, for the scale at which the galaxy formation takes place is way smaller than the context of cosmology, and the properties of dark matter remain unchanged. Nevertheless, a detailed evaluation of the impact that the EDE model may inflict on the stellar mass estimation is required for a more solid argumentation.
3.3 Luminosity Function
In observation, the luminosity function directly counts the number density of the galaxies in terms of the surface brightness with limited hypotheses of cosmology and galaxy formation. The stellar mass function, on the other hand, requires the mass estimation of the galaxies that depends on the theories of both cosmology and the baryonic interactions in the galaxy formation history. Therefore, the detected luminosity function is considered a more direct tool to test the mechanisms of galaxy formation.
The prediction of the luminosity function, however, is unable to be inferred in a model-free way. One of the greatest challenges of predicting the luminosity function from the halo mass function is the difficulty of finding the straightforward scaling relation between the halo mass and the luminosity of a galaxy . The is a direct representative of the properties and distribution of the stars, while the does not directly reflect the stellar distribution of the system, i.e., a massive halo may form a galaxy with different compositions of stars according to the age, metallicity and other factors, which correspond to different values of luminosity at a given band. There are attempts to find the luminosity from the halo mass, e.g., Mason et al. (2023); Sabti et al. (2022), while some essential assumptions of the galaxies, such as the Star-Formation Rate (SFR), are required to obtain the corresponding , which is equivalent to using the stellar mass as a proxy to mediate the relation in between. Following the same logic, we first fix the scaling relation between the stellar mass and luminosity and then derive the corresponding luminosity function as is done in Equation 9, i.e.,
| (10) |
Note that we replace the luminosity by the absolute magnitude at the UV band, , to align with the observations.
There have been a few number of works discussing the form of the scaling relation between and , e.g., Stefanon et al. (2021); Kikuchihara et al. (2020); Bhatawdekar et al. (2019); Duncan et al. (2014). In their works, the scaling relation is approximated by a linear relation,
| (11) |
where are the slope and intercept of the relation fitted from the pre-JWST data. Here we keep up with the relation provided by Stefanon et al. (2021) both to keep the consistency and to cover a higher redshift limit which was not reached by the other works. We notice that in their work, is not directly given but calculated by where is the stellar mass corresponds to in each redshift bin (see Table 3 in their work for more information).
The converted by Equation 11 is the intrinsic absolute magnitude of a galaxy. In real observations, however, the UV light emitted from the galaxy is absorbed by dust and re-emitted in the Infrared (IR) band. Meurer et al. (1999) proposed a simple dust attenuation rule to calibrate the absolute magnitude by using the UV spectral slope , which is equivalent to the colour of the galaxy,
| (12) |
where is the dust attenuation factor at 1600 . Note that the relation is built upon the assumption that the high redshift galaxies are scaled-up starburst galaxies in the local Universe (Meurer et al. (1999); Sun et al. (2023)). Given this, one can obtain the calibration of the dust attenuation in different redshifts with the measurement of .
With the intrinsic luminosity function and the dust attenuation law prepared, we can finally derive a realistic luminosity function prediction in the EDE Universe to compare with the observational results.
4 Results
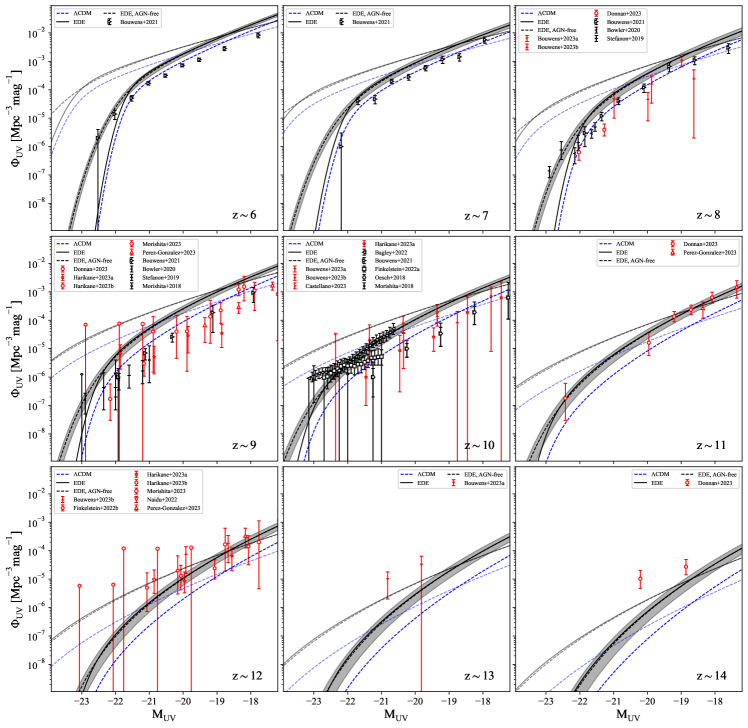
The predicted luminosity functions under the EDE and CDM models as well as the observed results of the pre-JWST and JWST data from Castellano et al. (2023); Finkelstein et al. (2022b); Harikane et al. (2023a, b); Morishita & Stiavelli (2023); Naidu et al. (2022); Pérez-González et al. (2023); Donnan et al. (2023); Bouwens et al. (2023a, b); Bagley et al. (2022); Bouwens et al. (2021); Finkelstein et al. (2022a); Morishita et al. (2018); Oesch et al. (2018); Bowler et al. (2020); Stefanon et al. (2019), are plotted in Figure 6. The black data points are from pre-JWST (e.g., HST and Spitzer/IRAC) observations and the red data points are from JWST. We also plot both dust attenuation uncalibrated and calibrated cases of the two models in light and bold lines, respectively. Here we apply the dust attenuation calibration adopted from the JWST relation obtained by Cullen et al. (2023), i.e., . This relation is roughly consistent with the result obtained from the lower redshift while mildly pointing towards the bluer end, implying that the galaxies at high redshift are slightly more active than their local counterpart starbursts. The deviations of the two cases show that the influence of the dust attenuation calibration is less significant at higher redshifts, as the dust also needs time to form. Also, if we assume the SHMR is free from AGN suppression (Figure 4), the EDE luminosity function will be slightly lifted at the luminous end (black dashed lines). Its effect, however, is limited as the luminosity of the most observed galaxy candidates is below the turning point extrapolated from the SHMR under the given relation. We also draw the uncertainty of this case that collects the errors from both stellar mass function (Figure 5) and the scaling relation given by Stefanon et al. (2021).
In addition, since the observational results of are affected by the background cosmology via the change of the luminosity distance , we also adjust the data points accordingly. Assuming are the apparent and absolute magnitudes of the observed galaxy, they are correlated by
| (13) |
where the distance modulus and is the K-correction factor determined by the observed flux and the properties of the detector (Hogg et al. (2002)). Therefore, the only factor affected by the background cosmology is . Apply the EDE model to the calibration of the data and we find that the change of cosmology will slightly shift the corresponding to the right (dimmer) side by mag. This is not surprising since decreases with a larger . Note that in observation it is common to take km s-1 Mpc-1.
In the case of in Figure 6, we see that the number density of the galaxies obtained by pre-JWST observations is roughly consistent with the JWST data. As the redshift goes up to , the pre-JWST results begin to be lower than the JWST cases. The results from Bagley et al. (2022); Finkelstein et al. (2022a), however, are exceptionally higher than other pre-JWST data. Generally speaking, the data from JWST does not show strong evolution among the redshift range and the constancy may extend to up to . Note that the future JWST spectroscopic redshift result may considerably affect the current data at due to their limited number of objects and the uncertainties brought by the highly redshifted UV light signals. If we constrain ourselves to the redshift , the comparison between the data and our prediction clearly shows that the CDM fits better with the cases, while the EDE case demonstrates more consistency with the data at , and particularly at . We speculate that there are three possible explanations for the outnumbered galaxy abundance at as follows,
-
1.
The pollution of the data that leads to errors in the luminosity measurements;
-
2.
The dust attenuation calibration method at that redshift range should be different from the lower redshifts;
-
3.
The efficient feedback mechanisms that intrinsically suppress the galaxy formation over redshift, so that the luminosity function does not grow as fast as the EDE model expected.
The calibration of the pollution is one of the major challenges of the high redshift galaxy observations. According to Equation (13), there are in principle three possible causes that lead to the inaccuracy of the luminosity: the disturbance on the flux that pollutes the apparent magnitude , the instrumental error of the telescope itself, and the uncertainty of the redshift , Among them, the most commonly discussed error source is the uncertainty of the redshift from JWST. By the time our analysis was finished, the spectroscopic redshift of the JWST galaxies were not yet available, while there were some reservations over the accuracy of their photometric redshift , e.g., Arrabal Haro et al. (2023). However, considering the luminosity function contains the information of multiple galaxies, rather than the single. The chance is low that all of their are systematically overestimated. The pollution from e.g., the selection effect or observational bias, on the other hand, is possible, as JWST brings unprecedented resolution of the low surface brightness objects. The detailed discussion on this matter 1 and an elaborate study on the high redshift dust attenuation calibration method 2, however, are beyond the scope of this paper.
In this paper, we are most interested in the possibility 3. Should the data sets themselves be accurate, and the dust attenuation not significantly change at higher redshifts, we argue that the dark matter-dominated early Universe is better described by the EDE model until the baryonic feedback mechanism begins to considerably affect the galaxy formation process and suppress the growth of the galaxy abundance, as was indicated by Bowler et al. (2020). Consequently, the pure dark matter-dominated EDE Universe at is transformed into the baryonic/dark matter-dominated CDM Universe at lower redshifts.
The comparison of the predicted and observed luminosity function, however, is not as direct as it looks. As mentioned above, the prediction of the luminosity function strongly depends on the stellar mass function, for there is no one-to-one bond between the halo mass and the luminosity of the corresponding galaxy. Consequently, although the scaling relation of can correctly convert the stellar mass and the luminosity data upon which the scaling relation is built, it may not reliably reflect the properties of the data from other observations, for the estimation of the stellar mass by itself varies with the hypotheses of the Initial Mass Function (IMF), SFR and other critical conditions each work applies. As is shown in Figure 16 in Stefanon et al. (2021), the scaling relations built upon various works can still be noticeably diverse. Be that as it may, now that we see tantalising evidence for EDE from the JWST observation, it becomes necessary to investigate further and directly compare our prediction with the recent results of the JWST galaxy abundance in terms of , which fermented a “turmoil” on our previous understanding of the galaxy number density based on the pre-JWST observations.
Labbé et al. (2023) estimated the stellar mass of six massive galaxies at redshift from the early release of the JWST data and found that the stellar mass density, the integral of the stellar mass function above a given mass , is about an order of magnitude larger than the extrapolation of the previous best-fitting from HST+Spitzer. As is mentioned in Meurer et al. (1999), the high redshift galaxies are treated as the scaled-up starburst galaxies. Hence it is common to estimate the mass of the high redshift galaxies by the locally confirmed IMF and other assumptions. Boylan-Kolchin (2023) found that according to the current understanding of the galaxy formation theory, the unexpectedly high abundance of these massive galaxies would require all of the baryons to form stars, which lies on the very edge of what is allowed by CDM and way beyond the empirical limit of the star formation efficiency shown in Figure 4, thus put the current theory of the galaxy formation at the early time under the CDM model into challenge.
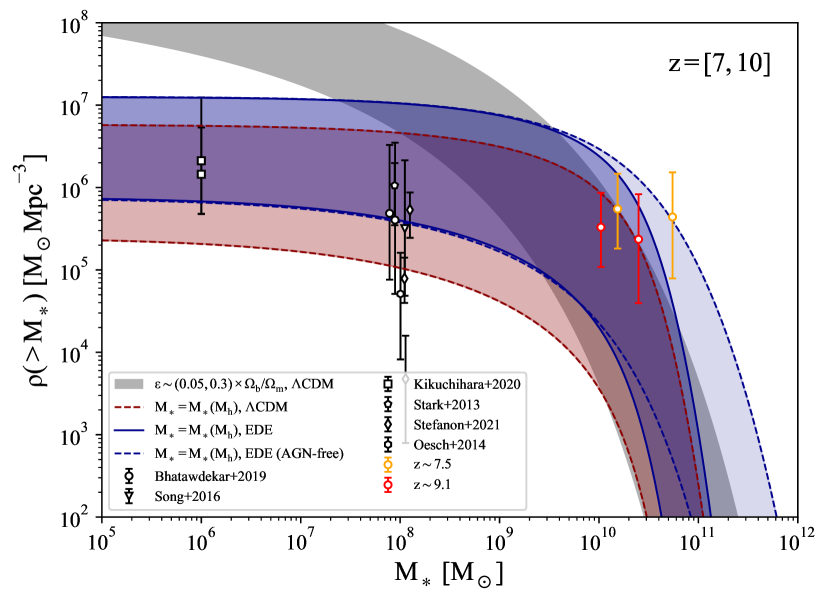
Should the pipeline to approach the stellar mass of the JWST galaxy candidates be appropriate and the cosmology be allowed to vary, we find that this phenomenon can be reproduced by the EDE model. In Figure.7, we demonstrate the stellar mass density that spans the range of in both EDE (blue) and CDM (red) models. On top of that, considering the possible AGN-free scaling relation shown in Figure 4, we also plot the stellar mass density without the suppression at the massive end (blue dashed). The JWST data are marked by orange () and red () points, and the black data points are the pre-JWST data observed by Stark et al. (2013); Stefanon et al. (2021); Kikuchihara et al. (2020); Oesch et al. (2014); Song et al. (2016); Bhatawdekar et al. (2019). It is clearly shown that the pre-JWST data are covered by the CDM region, while the EDE region, particularly the AGN-free case, covers the JWST data better. In comparison, we also plot the CDM case with in the grey shade area, assuming . In this scenario, however, neither pre-JWST nor JWST data points can be nicely explained. The reason is that the star formation efficiency of the massive galaxy-forming regions is normally higher, while the low-mass halos normally share a lower value. As a consequence, the empirical in Figure 4 determines the flattened and sharpened shape of the low mass and high mass region, respectively, in the stellar mass density shown in Figure 7.
Furthermore, the JWST stellar mass density we refer to may also imply that the JWST luminosity observations with are incomplete. In Figure 6, the from JWST in these redshifts almost show no inconsistency against the pre-JWST results, and the consistency is likely to remain in their corresponding stellar mass estimation as well, which would contradict the results from Labbé et al. (2023). Therefore, we expect more observations of the luminosity function at these redshifts in the coming years may tell us if the data in the redshift range also follows the prediction of the EDE model.
Through the comparison between the theoretical prediction of the stellar mass function (Figure 5), luminosity function (Figure 6) and stellar mass density (Figure 7), we argue that the galaxy abundance at high redshift () indeed shows a promising prospect to verify the EDE model (or other models, as long as they can put a similar effect on the matter power spectrum), for it demonstrates considerable deviation under the EDE and CDM model. From the luminosity function comparison, we find that the JWST data at shows the best consistency with EDE, which suggests a possible suppression mechanism that slows down the growth of the galaxy number density as the Universe evolves to the lower redshift. However, the observation of the stellar mass density from JWST appears to shed light on a different path, that is even the JWST data shows a preference for EDE over CDM. The intrinsic discrepancy between them may lie in the technical differences between the observation projects. The answer to this issue, however, relies on more JWST data to come in the future.
The intrinsic concern over the stellar mass density measured by JWST is that the scaling relation between luminosity and stellar mass at high redshift may not follow the empirical rule constructed from the previous observations. I.e., if there are two galaxies sharing the same luminosity. One is a local starburst and the other is an early galaxy with . Should the stellar mass of the high redshift candidate be smaller than its local counterpart, due to the possible IMF variation or high redshift low mass AGN? If otherwise, one will find that the extrapolation of the pre-JWST best-fit stellar mass density and the CDM prediction are unable to explain the JWST data. The result of our calculation, however, provides an alternative interpretation that the abundance of the massive galaxies could indeed be higher than previously expected because of the EDE model. Consequently, both the luminosity function and stellar mass density under this model are elevated and fit better with the JWST data. The scaling relation, on the other hand, remains unchanged for the scale of the galaxy formation is too small to be strongly affected by the presence of EDE. Bearing all the discussions above in mind, albeit it is yet too soon to claim that another observational evidence of EDE has been found, we argue that it is safe to regard the high redshift abundance of the galaxies as another probe of the EDE model. We also suggest that further investigations should focus on two aspects: 1. The detailed re-evaluation of the stellar mass under the EDE model; 2. More luminosity function data with . Should it come to pass that the studies of days to come accord with our results, we might find it needful to contemplate the possibility that EDE be a fairer model to portray the early Universe, in the stead of CDM.
5 Conclusions
The early dark energy model is one of the few theories to resolve the Hubble tension that carries both theoretical capability and observational evidence. At present, the signal of EDE has been detected in some of the CMB observations. However, the verification of EDE suffers severe challenges on the small-scale (e.g., full-scale Planck CMB) and low-redshift (e.g., BOSS matter power spectrum) observations. Also, applying the EDE-like mechanism to resolve the Hubble tension will inevitably exacerbate the tension, for it incubates a denser Universe than the CDM case, which already showed discordance with the weak lensing observational results. Considering the complications brought by the baryonic matter in the observations of the low redshift galaxies, we instead attempted to inspect if the EDE model can be probed by the high redshift galaxy abundance, for it provides an alternative scope to detect the small-scale density evolution of the Universe when it was less affected by the baryons.
Our investigation found that despite the complications of the galaxy formation processes, the current number density of the observed high redshift galaxies expressed in terms of the luminosity function, stellar mass function, and stellar mass density, can indeed detect the difference of the corresponding predictions under the EDE and CDM model. This is particularly true for the JWST data, as it discovered a surprisingly high number density of luminous/massive galaxies which is concordant with the EDE prediction. Although the current data is not enough to put an unarguable Aye or Nay to the EDE model as yet, the upcoming JWST luminosity function data within redshift as well as the corresponding stellar mass estimation can be expected to verify EDE independent of CMB and low redshift galaxy survey.
The way we applied in this paper to predict the galaxy abundance depends on the theoretical prediction of the halo mass function and the empirical scaling relations between . Assuming the properties of the dark matter are unaffected by EDE, we found that the EDE and CDM halo mass functions are almost identical at lower redshifts while significantly distinguishable when , which is consistent with Klypin et al. (2021) (see Figure 2 and 3). This result is ideal for our study because the abundance matching method indicates that the corresponding observable stellar mass or luminosity function should share a similar detectability.
Next, we estimated the corresponding stellar mass function under the two models. As shown in Figure 5, the existing pre-JWST data show a clear preference towards CDM rather than the EDE model up to . The redshift-free scaling relation between and (Equation 8) indicates that the low mass halos are extremely inefficient in forming stars, while the turnover at may need to be treated with extra care. At lower redshift, the turning point of the massive galaxy number density is normally caused by the AGN feedback, while the situation at higher redshift could be different due to the rareness of AGN in these extremely young galaxies. Considering the data to form the scaling relation in Stefanon et al. (2021) does not constrain the turning point at redshift , it is reasonable to assume that is too early for most AGN to form. Therefore, we also extrapolated the scaling relation by making rather than the original fit in Equation 8 to flatten the turnover, such that more massive galaxies can form due to the lack of AGN feedback (Figure 4). The accurate fitting of the scaling relation, however, depends on whether the future high redshift observations that cover the stellar mass detect a pervasive presence of AGN in the young galaxies and the turning point in the scaling relation.
The first possible evidence of EDE in this paper was found in the luminosity function. The prediction of it depends on the stellar mass function, the scaling relation between and , and the dust attenuation calibration rule. We applied the scaling relation obtained by Stefanon et al. (2021) for the consistency with the stellar mass function and the upper limit of the redshift. The dust attenuation calibration was adapted from the recent JWST observation. In addition, the change in cosmology also affects the distance modulus and consequently, the observational result of . Our calculation showed that EDE will cause a slightly fainter result by mag. Finally, Our result in Figure 6 suggests that the CDM model is favoured by the observational results at , while the shows a preference for EDE. The appears to be a transition era of the two models. We also found that the AGN-free SHMR in Figure 4 does not have a strong effect on the luminosity function because most of the data are below the turning point extrapolated from the stellar mass function, according to the given relation. Given that is indeed the boundary between the preference of the EDE and CDM model, we speculate that it may imply an efficient baryonic suppression mechanism of the galaxy formation around this epoch, such that the early galaxy formation rate that follows the EDE model is slowed down and converted into the CDM Universe.
The other plausible evidence of EDE appears in the stellar mass density shown in Figure 7. We found that the denser Universe produced by EDE can fit the JWST result observed by Labbé et al. (2023) better than the CDM case. In particular, the AGN-free SHMR relation can further promote the consistency between the EDE prediction and the JWST data. Also, considering that the luminosity function data from JWST at does not prefer EDE while the stellar mass density shows otherwise. It may also imply that the current luminosity function observation from JWST is incomplete. However, the estimation of the stellar mass itself may also be affected by EDE via, e.g., the lower luminosity or a more efficient gas cooling process. In our calculation, we apply the vanilla results of the stellar mass since the impact that the EDE model may inflict on the stellar mass estimation will (partly) cancel out each other. Nevertheless, a detailed evaluation of it is recommended for a more solid argumentation.
To conclude, should the luminosity function and stellar mass density obtained by JWST be reliable, what it discovered may imply a revolutionary change in our understanding of the galaxy formation history and/or cosmology at high redshift. Specifically, we found that the CDM model is preferred by the stellar mass function and luminosity function when , regardless of the data source. In contrast, the data (mainly JWST and 2 reported by pre-JWST observations) show a preference for EDE. The JWST stellar mass density data provides extra plausible evidence of EDE at , which may indicate the incompleteness of the luminosity function observation at this redshift range. The net consequence of our comparison suggests that the galaxy formation rate around might be suppressed by an efficient suppression mechanism which leads to the transition of the best-fit cosmological model from EDE to CDM. On top of that, considering the consistency between the galaxy abundance and our prediction for EDE that essentially points out a denser early stage of the Universe, it may imply that the tension is more of the tension for the galaxy formation history than it is for cosmology, thus the impact it may inflict on the EDE-like models could be diminished, and a larger alone is insufficient to veto the modifications of the cosmological theory. The hope to alleviate the tension, therefore, lies on the observations of the Universe at redshift .
Acknowledgements
LW would like to thank Mauro Stefanon and Jiang, Junqian for their constructive and timely suggestions, and Roland Timmerman for organising the talk in Leiden where this work was first presented. LW, ZH and GY are supported by the National Key R&D Program of China grant No. 2022YFF0503400, 2022YFF0503404 and China Manned Space Project grant No. CMS-CSST-2021-B01. GY is also supported by the National Key R&D Program of China grant No. 2020SKA0110402, CAS Project for Young Scientists in Basic Research grant No. YSBR-092 and China Manned Space Project grant No. CMS-CSST-2021-A01. WX is supported by the Fundamental Research Funds for the Central Universities and the CAS Project for Young Scientists in Basic Research grant No. YSBR-062.
References
- Abdalla et al. (2022) Abdalla E., et al., 2022, Journal of High Energy Astrophysics, 34, 49
- Arrabal Haro et al. (2023) Arrabal Haro P., et al., 2023, arXiv e-prints, p. arXiv:2303.15431
- Asgari et al. (2021) Asgari M., et al., 2021, A&A, 645, A104
- Bagley et al. (2022) Bagley M. B., et al., 2022, arXiv e-prints, p. arXiv:2205.12980
- Bhatawdekar et al. (2019) Bhatawdekar R., Conselice C. J., Margalef-Bentabol B., Duncan K., 2019, MNRAS, 486, 3805
- Blas et al. (2011) Blas D., Lesgourgues J., Tram T., 2011, J. Cosmology Astropart. Phys., 2011, 034
- Bouwens et al. (2021) Bouwens R. J., et al., 2021, AJ, 162, 47
- Bouwens et al. (2023a) Bouwens R., Illingworth G., Oesch P., Stefanon M., Naidu R., van Leeuwen I., Magee D., 2023a, MNRAS, 523, 1009
- Bouwens et al. (2023b) Bouwens R. J., et al., 2023b, MNRAS, 523, 1036
- Bowler et al. (2020) Bowler R. A. A., Jarvis M. J., Dunlop J. S., McLure R. J., McLeod D. J., Adams N. J., Milvang-Jensen B., McCracken H. J., 2020, MNRAS, 493, 2059
- Boylan-Kolchin (2023) Boylan-Kolchin M., 2023, Nature Astronomy, 7, 731
- Bullock et al. (2000) Bullock J. S., Kravtsov A. V., Weinberg D. H., 2000, ApJ, 539, 517
- Castellano et al. (2023) Castellano M., et al., 2023, ApJ, 948, L14
- Cullen et al. (2023) Cullen F., et al., 2023, MNRAS, 520, 14
- Despali et al. (2016) Despali G., Giocoli C., Angulo R. E., Tormen G., Sheth R. K., Baso G., Moscardini L., 2016, MNRAS, 456, 2486
- Donnan et al. (2023) Donnan C. T., et al., 2023, MNRAS, 518, 6011
- Duncan et al. (2014) Duncan K., et al., 2014, MNRAS, 444, 2960
- Efstathiou (1992) Efstathiou G., 1992, MNRAS, 256, 43P
- Finkelstein et al. (2022a) Finkelstein S. L., et al., 2022a, ApJ, 928, 52
- Finkelstein et al. (2022b) Finkelstein S. L., et al., 2022b, ApJ, 940, L55
- Goldstein et al. (2023) Goldstein S., Hill J. C., Iršič V., Sherwin B. D., 2023, arXiv e-prints, p. arXiv:2303.00746
- Gómez-Valent et al. (2022) Gómez-Valent A., Zheng Z., Amendola L., Wetterich C., Pettorino V., 2022, Phys. Rev. D, 106, 103522
- Harikane et al. (2023a) Harikane Y., Nakajima K., Ouchi M., Umeda H., Isobe Y., Ono Y., Xu Y., Zhang Y., 2023a, arXiv e-prints, p. arXiv:2304.06658
- Harikane et al. (2023b) Harikane Y., et al., 2023b, ApJS, 265, 5
- Herold et al. (2022) Herold L., Ferreira E. G. M., Komatsu E., 2022, ApJ, 929, L16
- Hill et al. (2020) Hill J. C., McDonough E., Toomey M. W., Alexander S., 2020, Phys. Rev. D, 102, 043507
- Hill et al. (2022) Hill J. C., et al., 2022, Phys. Rev. D, 105, 123536
- Hogg et al. (2002) Hogg D. W., Baldry I. K., Blanton M. R., Eisenstein D. J., 2002, arXiv e-prints, pp astro–ph/0210394
- Jiang & Piao (2022) Jiang J.-Q., Piao Y.-S., 2022, Phys. Rev. D, 105, 103514
- Kamionkowski & Riess (2023) Kamionkowski M., Riess A. G., 2023, Annual Review of Nuclear and Particle Science, 73, 153
- Karwal & Kamionkowski (2016) Karwal T., Kamionkowski M., 2016, Phys. Rev. D, 94, 103523
- Kikuchihara et al. (2020) Kikuchihara S., et al., 2020, ApJ, 893, 60
- Klypin et al. (2021) Klypin A., et al., 2021, MNRAS, 504, 769
- Labbé et al. (2023) Labbé I., et al., 2023, Nature, 616, 266
- Larson et al. (2023) Larson R. L., et al., 2023, ApJ, 953, L29
- Lin et al. (2020) Lin M.-X., Hu W., Raveri M., 2020, Phys. Rev. D, 102, 123523
- Mason et al. (2023) Mason C. A., Trenti M., Treu T., 2023, MNRAS, 521, 497
- McDonough & Scalisi (2022) McDonough E., Scalisi M., 2022, arXiv e-prints, p. arXiv:2209.00011
- McDonough et al. (2023) McDonough E., Hill J. C., Ivanov M. M., La Posta A., Toomey M. W., 2023, arXiv e-prints, p. arXiv:2310.19899
- Meurer et al. (1999) Meurer G. R., Heckman T. M., Calzetti D., 1999, ApJ, 521, 64
- Morishita & Stiavelli (2023) Morishita T., Stiavelli M., 2023, ApJ, 946, L35
- Morishita et al. (2018) Morishita T., et al., 2018, ApJ, 867, 150
- Murgia et al. (2021) Murgia R., Abellán G. F., Poulin V., 2021, Phys. Rev. D, 103, 063502
- Murray et al. (2013) Murray S. G., Power C., Robotham A. S. G., 2013, Astronomy and Computing, 3, 23
- Murray et al. (2021) Murray S. G., Diemer B., Chen Z., Neuhold A. G., Schnapp M. A., Peruzzi T., Blevins D., Engelman T., 2021, Astronomy and Computing, 36, 100487
- Naidu et al. (2022) Naidu R. P., et al., 2022, ApJ, 940, L14
- Oesch et al. (2014) Oesch P. A., et al., 2014, ApJ, 786, 108
- Oesch et al. (2018) Oesch P. A., Bouwens R. J., Illingworth G. D., Labbé I., Stefanon M., 2018, ApJ, 855, 105
- Pérez-González et al. (2023) Pérez-González P. G., et al., 2023, ApJ, 951, L1
- Perlmutter et al. (1999) Perlmutter S., et al., 1999, ApJ, 517, 565
- Planck Collaboration et al. (2020a) Planck Collaboration et al., 2020a, A&A, 641, A6
- Planck Collaboration et al. (2020b) Planck Collaboration et al., 2020b, A&A, 641, A8
- Poulin et al. (2018) Poulin V., Smith T. L., Grin D., Karwal T., Kamionkowski M., 2018, Phys. Rev. D, 98, 083525
- Poulin et al. (2019) Poulin V., Smith T. L., Karwal T., Kamionkowski M., 2019, Phys. Rev. Lett., 122, 221301
- Poulin et al. (2021) Poulin V., Smith T. L., Bartlett A., 2021, Phys. Rev. D, 104, 123550
- Poulin et al. (2023) Poulin V., Smith T. L., Karwal T., 2023, arXiv e-prints, p. arXiv:2302.09032
- Reeves et al. (2023) Reeves A., Herold L., Vagnozzi S., Sherwin B. D., Ferreira E. G. M., 2023, MNRAS, 520, 3688
- Riess et al. (1998) Riess A. G., et al., 1998, AJ, 116, 1009
- Riess et al. (2022) Riess A. G., et al., 2022, ApJ, 934, L7
- Sabti et al. (2022) Sabti N., Muñoz J. B., Blas D., 2022, Phys. Rev. D, 105, 043518
- Scholtz et al. (2023) Scholtz J., et al., 2023, arXiv e-prints, p. arXiv:2306.09142
- Schöneberg et al. (2022) Schöneberg N., Abellán G. F., Sánchez A. P., Witte S. J., Poulin V., Lesgourgues J., 2022, Phys. Rep., 984, 1
- Sheth & Tormen (1999) Sheth R. K., Tormen G., 1999, MNRAS, 308, 119
- Simon et al. (2023) Simon T., Zhang P., Poulin V., Smith T. L., 2023, Phys. Rev. D, 107, 063505
- Simpson et al. (2018) Simpson C. M., Grand R. J. J., Gómez F. A., Marinacci F., Pakmor R., Springel V., Campbell D. J. R., Frenk C. S., 2018, MNRAS, 478, 548
- Smith et al. (2020) Smith T. L., Poulin V., Amin M. A., 2020, Phys. Rev. D, 101, 063523
- Smith et al. (2022a) Smith T. L., Poulin V., Simon T., 2022a, arXiv e-prints, p. arXiv:2208.12992
- Smith et al. (2022b) Smith T. L., Lucca M., Poulin V., Abellan G. F., Balkenhol L., Benabed K., Galli S., Murgia R., 2022b, Phys. Rev. D, 106, 043526
- Song et al. (2016) Song M., et al., 2016, ApJ, 825, 5
- Stark et al. (2013) Stark D. P., Schenker M. A., Ellis R., Robertson B., McLure R., Dunlop J., 2013, ApJ, 763, 129
- Stefanon et al. (2019) Stefanon M., et al., 2019, ApJ, 883, 99
- Stefanon et al. (2021) Stefanon M., Bouwens R. J., Labbé I., Illingworth G. D., Gonzalez V., Oesch P. A., 2021, ApJ, 922, 29
- Steinhardt et al. (2023) Steinhardt C. L., Kokorev V., Rusakov V., Garcia E., Sneppen A., 2023, ApJ, 951, L40
- Sun et al. (2023) Sun L., et al., 2023, arXiv e-prints, p. arXiv:2311.15664
- Tacchella et al. (2018) Tacchella S., Bose S., Conroy C., Eisenstein D. J., Johnson B. D., 2018, ApJ, 868, 92
- Wechsler & Tinker (2018) Wechsler R. H., Tinker J. L., 2018, ARA&A, 56, 435