Measuring Social Biases in Masked Language Models by Proxy of Prediction Quality
Abstract
Social and political scientists often aim to discover and measure distinct biases from text data representations (embeddings). Innovative transformer-based language models produce contextually-aware token embeddings and have achieved state-of-the-art performance for a variety of natural language tasks, but have been shown to encode unwanted biases for downstream applications. In this paper, we evaluate the social biases encoded by transformers trained with the masked language modeling objective using proposed proxy functions within an iterative masking experiment to measure the quality of transformer models’ predictions, and assess the preference of MLMs towards disadvantaged and advantaged groups. We compare bias estimations with those produced by other evaluation methods using two benchmark datasets, finding relatively high religious and disability biases across considered MLMs and low gender bias in one dataset relative to the other. Our measures outperform others in their agreement with human annotators. We extend on previous work by evaluating social biases introduced after re-training an MLM under the masked language modeling objective (w.r.t. the model’s pre-trained base), and find that proposed measures produce more accurate estimations of relative preference for biased sentences between transformers than others based on our methods.
Warning: This paper contains explicit statements of biased stereotypes and may be upsetting.
1 Introduction
Word embeddings have proven useful in a variety of Natural Language Processing (NLP) tasks due to their ability to efficiently model complex semantic and syntactic word relationships. Token-level embeddings, such as those produced by Word2Vec Mikolov et al. (2013) and GloVe Pennington et al. (2014) algorithms, learn a non-contextualized (one vector per token) text representation. Both aim to produce embeddings that can uncover linear semantic or syntactic relationships between tokens.
Masked language models (MLM(s); Brown et al., 2020; Devlin et al., 2019; Liu et al., 2019a; Radford et al., 2019) such as transformers BERT and RoBERTa incorporate bidrectionality and self-attention, producing contextually-aware embeddings (more than one vector per token). Unlike Devlin et al. (2018), RoBERTa (Robustly Optimized BERT) was pre-trained solely on the masked language modeling objective on a larger corpus of text. RoBERTa uses a dynamic masking strategy for a diverse set of representations during training and has achieved state-of-the-art results on GLUE, RACE and SQuAD Liu et al. (2019b). Distillation is an important consideration when using these models as distilled variants have been shown to train significantly faster for very minor decreases in performance Sanh et al. (2019). MLMs have produced state-of-the-art results for masked language modeling, named entity recognition and intent or topic classification, but also encode concerning social biases against disadvantaged groups that are undesirable in production settings. As MLMs become increasingly prevalent, researchers have been working on methods to measure biases embedded in these models Nangia et al. (2020); Kaneko and Bollegala (2022); Salutari et al. (2023).
In this work, we leverage pre-trained base transformer models available through the Transformers library Wolf et al. (2019) to evaluate social biases of MLMs using proposed proxy measures for MLM prediction quality derived from Salutari et al., 2023 and Kaneko and Bollegala, 2022 to assess the relative preferences of MLMs towards sentences biased against disadvantaged and advantaged groups.
In particular, we quantify mlm preference by proxy of relative masked token prediction quality given unmasked token context between encoded sentences within pairs, where one sentence contains bias against disadvantaged groups (stereotypical) and the other contains bias against advantaged groups (anti-stereotypical). Proposed measures (Equation 5), crr (Equation 6), crra (Equation 12) and (Equation 13) are computed under the iterative masking experiment detailed in Section 3.2.
Additionally, we compute bias scores for benchmark datasets using function(s) 15 and 16 to measure transformer preference for biased sentences, along with relative preference for biased sentences between transformers.
Our proposed methodology (Section 4) could help others evaluate social biases encoded in an MLM after it is re-trained on the masked language modeling objective (e.g. for a downstream fill-mask task), and possibly by extension the biases deeply embedded in corpora of interest. We find that proposed measures outperform others in accuracy measured by ground truth human annotations, and for estimating biases introduced by re-training MLMs on sentence sets in a benchmark dataset.
2 Related Work
2.1 Biases in Non-contextual Word Embeddings
Non-contextual word (token) embeddings Pennington et al. (2014); Mikolov et al. (2013), can be shifted in a direction to decompose bias embedded in learned text data representations. These could be analogies or biases along an axis, such as gender (e.g. queen - woman + man = king or doctor - man + woman = nurse) as used in Bolukbasi et al., 2016 or race as used in Manzini et al., 2019. The Word Embedding Association Test (WEAT; Islam et al., 2016) measures association between targets and attributes using cosine similarity between static word embeddings, but has been shown to overestimate biases by Ethayarajh et al., 2019 which proposed the more robust relational inner product association (RIPA) method, derived from the subspace projection method to debias vectors in Bolukbasi et al., 2016.
While WEAT has shown that token-level embeddings produced by GloVe and Word2Vec encode biases based on gender and race Islam et al. (2016), the Sentence Encoder Association Test (SEAT; May et al., 2019) extends on WEAT to measure social biases in sentence-level encoders such as ELMo and BERT using template sentences with masked target tokens (e.g. "This is <mask>”), averaging token embeddings to form sentence-level embeddings on which cosine similarity is applied as a proxy for semantic association. As an alternative evaluation method under a different objective, Liang et al., 2020 assessed differences in log-likelihood between gender pronouns in a template sentence (e.g. "<mask> is a/an [occupation]") where occupations can uncover the directionality of the bias encoded by an MLM.
2.2 Evaluating Biases in MLMs
To measure the bias in masked language models, Salutari et al., 2023 tests MLMs in an iterative fill mask setting, where a model encodes (tokenizes) input text to predict a masked token for combinations of token-masked text. In this setting, the model provides a set of tokens to fill the masked one, starting with the token of highest likelihood (and first rank) in the set of token predictions of the MLM, which is limited according to the MLM’s embedding space. Salutari et al., 2023 proposes the Complementary Reciprocal Rank (crr; Equation 4) for a masked token given its context, and uses the measure for a sentence (averaged over all single masked token CRRs with token ordering preserved) as a proxy for an MLM’s prediction quality (preference).
Kaneko and Bollegala, 2022 reference the use of sentence-level embeddings produced by MLMs for downstream tasks such as sentiment classification to argue that biases associated with masked tokens should not influence the intrinsic bias evaluation of an MLM, as opposed to the evaluation of biases introduced after an MLM is fine-tuned. They propose evaluation metrics All Unmasked Likelihood (aul) and aul with Attention weights (aula), where aul and aula are generated by requiring the MLM to predict all tokens (unmasked input) to eliminate biases associated with masked tokens under previously proposed pseudo-likelihood-based scoring methods (Nadeem et al., 2020, Nangia et al., 2020), which assumed that masked tokens are statistically independent.
In contrast with Kaneko and Bollegala, 2022, we focus on an MLM’s key pre-training objective, masked language modeling, to measure social biases of the MLM.111Masked language modeling was a pre-training objective for all transformers considered in this work. Next sentence prediction was not used for RoBERTa and similar variants because of relatively lower performance with its inclusion. Liu et al., 2019b Furthermore, we measure relative changes in biases, w.r.t the intrinsic biases of the same base MLM after re-training under the masked language modeling objective (as opposed to fine-tuning) in Section 4.3. Thus, we argue that biases associated with masked tokens are not undesirable in our case.
3 Experiments
3.1 Data
3.1.1 Benchmark Datasets for Social Bias
The Crowdsourced Stereotype Pairs Benchmark (CSP; Nangia et al., 2020) contains biased sentences towards historically advantaged and disadvantaged groups along nine forms of social biases, providing a more reliable and diverse alternative to biases expressed by sentence pairs in StereoSet (SS; Nadeem et al., 2020). SS contains intrasentence and intersentence (with context) pairs for four forms of social biases, using the likelihood of modified tokens given unmodified token contexts as proxy for an MLM’s preference. Similarly, CPS contains characteristic words that distinguish sentences within pairs and define the nature of a particular bias as against advantaged or disadvantaged groups, but instead uses the relative likelihood of unmodified tokens being chosen by the MLM given a modified context (characteristic word) across a sentence pair.
The CPS and SS datasets contain biased sentences towards advantaged and disadvantaged groups, where CPS sentence pairs are categorized by bias types: race, age, socioeconomic, disability, religion, physical appearance, gender, sexual orientation and nationality, and SS sentence pairs are categorized by bias types: race, religion, gender and profession. To probe for biases of interest that are encoded in MLMs under consideration, the scope of our experiments include all bias categories and sentences pairs in CPS and intrasentence pairs in SS, since intersentence pairs are not masked for bias evaluation.222Our reported results on the SS dataset include only intrasentence pairs as in experiment code used by Kaneko and Bollegala, 2022. We attempt to estimate the preference of an MLM towards a stereotypical sentence over a less stereotypical one for each bias category in CPS and SS and report corresponding results.
| Bias (CPS) | N ( and ) |
|---|---|
| Race | 516 |
| Religion | 105 |
| Nationality | 159 |
| Socioecnomic | 172 |
| Gender | 262 |
| Sexual orientation | 84 |
| Age | 87 |
| Disability | 60 |
| Physical appearance | 63 |
| Bias (SS) | N ( and ) |
| Race | 962 |
| Religion | 79 |
| Gender | 255 |
| Profession | 810 |
Re-training Dataset
For this work, we focus on recovering encoded social biases from MLMs re-trained on or ( or , where is a sentence) in CPS, to demonstrate the sensitivity of our proposed measures compared to others for characterizing biases introduced by re-training MLMs, but emphasize the substantive use cases of applying our proposed framework beyond a particular corpus type. Biases widely acknowledged in the United States are well represented in CPS333CPS categories are a ”narrowed” version of the US Equal Employment Opportunities Commission’s list of protected categories. compared to SS, and there is greater diversity of sentence structures in CPS Nangia et al. (2020).
The validation rate of CPS is 18% higher than SS, and paired with concerns regarding standard masked language modeling metric viability on SS, we proceed to use sentence sets in CPS as opposed to SS to re-train MLMs (and validate methods for estimating biases introduced by that re-training), given that CPS is a more reliable benchmark for pre-trained MLM bias measurement Nangia et al. (2020).
| for CPS | Uncased | Cased |
|---|---|---|
| Unique Tokens | 4631 | 4800 |
| Lexical Diversity | 0.235 | 0.244 |
| for CPS | Uncased | Cased |
| Unique Tokens | 4607 | 4768 |
| Lexical Diversity | 0.233 | 0.241 |
3.2 MLM Preference by Prediction Quality
When considering a sentence containing tokens , where is the number of tokens in , (modified) token(s) of can characterize its bias towards either disadvantaged or advantaged groups. For example, in the sentence pair and from the CPS dataset, where is "The poor are really ignorant about how to handle the money they do have" and is "The rich are really ignorant about how to handle the money they do have", the bias is characterized by modified tokens "poor" and "rich" respectively. All other tokens between and in this example are unmodified.
For a given sentence with tokens we denote all tokens besides as (where ). For a given sentence , we denote modified tokens as and unmodified tokens as (. For a given MLM with parameters , we denote a masked token as and a predicted token as .
| (1) |
Salazar et al., 2020 used pseudo log-likelihood scoring to approximate , or the probability of unmodified tokens conditioned on modified ones. Similarly, Nangia et al., 2020 reports CrowS-Pairs Scores (csps), a pseudo-log-likelihood score for an MLM selecting unmodified tokens given modified ones. csps is defined in Equation 1.
| (2) |
Nadeem et al., 2020 reports a StereoSet Score (sss), a pseudo-log-likelihood score for an MLM selecting modified tokens given unmodified ones. sss is defined in Equation 2, where is the number of tokens in sentence .
To measure the bias in MLMs, Salutari et al., 2023 tests them in an iterative fill mask setting where the model outputs a set of tokens (or the (log)softmax of model logits mapped to tokens) to fill the masked one, starting with the token of highest probability and, as such, first rank in the set of token predictions provided by the model. These bias evaluation metrics were applied to measure the relative preference of MLMs for transcripts of spoken African American English (AAE) and Standard American English (SAE).
| (3) |
(Equation 3) is a metric for measuring the fairness (or bias) of an MLM and represents the difference between the probability of a predicted token and a masked token in a sentence , and serves as a proxy of the MLM’s prediction quality for a token given its context within an iterative masking experiment, or all tokens in besides (Salutari et al., 2023).

| (4) |
Analogously, crr (Equation 4) is another metric for measuring bias of an MLM for a sentence , where is the reciprocal rank of the predicted token (and always equal to 1) and is the reciprocal rank of the masked token. Thus, provides a likelihood measure for being chosen by the model as a candidate token to replace the ground truth (masked) one.
| (5) |
| (6) |
Salutari et al., 2023 defines , or the probability difference for a sentence (or utterance) , as shown in Equation 5, where is the length of the sentence in terms of tokens. Analogously, as shown in Equation 6 is the complementary reciprocal rank for a sentence .
Salutari et al., 2023 claims that metrics based on crr for a sentence are necessary to fully capture the biases embedded in MLMs. This is contrast to evaluation metrics aul and aula proposed by Kaneko and Bollegala, 2022 and defined in Equations 7 and 8 respectively, where is the average of all multi-head attentions associated with and is the number of tokens in the sentence. aul and aula are generated by predicting all of the tokens in a given unmasked input sentence as referenced in Section 2.
| (7) |
| (8) |
By requiring the MLM to simultaneously predict all of the unmasked tokens in a sentence, Kaneko and Bollegala, 2022 attempts to avoid any selectional biases from masking a subset of input tokens, such as high frequency words (which are masked more often during training). They illustrate sensitivity of aul and aula to contextually meaningful inputs by randomly shuffling tokens in input sentences and comparing accuracies with and without shuffle. The crr measure is also conditional to the unmasked token context by definition. We believe that this measure sensitivity to unmasked token contexts is desirable when evaluating a given MLM’s preference under a fill-mask task (estimating biases using contextualized token-level embeddings produced by an MLM as opposed to sentence-level embeddings). In contrast with previous methods such as SSS and CSPS, we refrain from using strictly modified or unmodified subsets of input tokens as context, and instead provide all tokens but the ground truth one as context for MLM prediction under each iteration of our masking experiment.
Existing benchmark datasets such as CPS are limited to one ground truth per masked token. Thus, an important consideration is an MLM’s ability to predict multiple plausible tokens for a context that could qualify for concerning social bias but goes unrecognized during evaluation using previously proposed measures. However, the crr measure could perform better than pseudo-(log)likelihood-based measures for this sensitivity that yields larger relative differences in as opposed to Salutari et al. (2023). Since the lowest rank of any possible ground truth token within a model’s vocabulary is equal to the size of the vocabulary, we have and for an MLM with embedding vocabulary of size . crr is deemed critical for evaluation due to the possible uniformity of probabilities generated by a particular MLM with respect to others Salutari et al. (2023).
4 Methodology
In this paper, we report and compare results from the following transformers available through the HuggingFace library Wolf et al. (2019): (bert-base-uncased; Devlin et al., 2019), RoBERTa (roberta-base; Liu et al., 2019b), (distilbert-base-uncased; Sanh et al., 2019) and distilRoBERTa (distilroberta-base; Liu et al., 2019a). We propose and validate proxy functions (including attention-weighted Equations 12 and 13) and argue they measure the likelihood an MLM will select a ground truth token to replace a masked one, and use functions 15 and 16 to estimate the encoded social biases in pre-trained MLMs and the relative change in biases after re-training an MLM respectively. For all results and transformers , denotes re-trained while denotes pre-trained (out of box).
4.1 Recovering Social Biases in Pre-trained MLMs
We derive and apply bias evaluation measures to sentence pairs from CPS and SS, and probe for MLM preferences using an iterative masking training procedure, or by masking one token at a time until all tokens have been masked once (so we have logits or predictions for a sentence with tokens).
| 1. with masked |
| The businessman s body was found dead in an alley discarded and uncared for |
| 2. with masked |
| The businessman s body was found dead in an alley discarded and uncared for |
| 3. with masked |
| The businessman s body was found dead in an alley discarded and uncared for |
| 4. with masked |
| The businessman s body was found dead in an alley discarded and uncared for |
| 5. with masked |
| The businessman s body was found dead in an alley discarded and uncared for |
| … |
Table 3 shows an example of the iterative fill mask experiment for one model and text example, where the language model encodes (tokenizes) text and predicts for a masked token where is the original token index. Tokens can be words or subwords.
| Ground truth masked ( = ignorant) | ||
|---|---|---|
| Model | Prediction | Rank |
| clueless | 6 | |
| confused | 7 | |
| Ground truth masked ( = money) | ||
| Model | Prediction | Rank |
| money | 1 | |
| problems | 5 | |
| Ground truth masked ( = ignorant) | ||
|---|---|---|
| Model | Prediction | Rank |
| clueless | 6 | |
| clueless | 10 | |
| Ground truth masked ( = money) | ||
| Model | Prediction | Rank |
| problems | 2 | |
| wealth | 4 | |
Tables 4 and 5 show masked token predictions (those with first rank and highest probability) produced by MLM(s) for given input context(s). In this case, the inputs are processed sentences contained in or from the CPS dataset with socioeconomic bias. The last column contains the ground truth masked token rank, or , to illustrate the quality of the models’ predictions relative to a sentence biased against an advantaged or disadvantaged group.
| Model | Set | Example | ||||
|---|---|---|---|---|---|---|
| ethiopian men are skinny | 0.862 | 0.448 | 4.842 | 0.408 | ||
| ethiopian men are fat | 0.973 | 0.536 | 5.736 | 0.482 | ||
| african-americans are needlessly confrontational | 0.167 | 0.053 | 0.131 | 0.006 | ||
| white americans are needlessly confrontational | 0.389 | 0.112 | 1.237 | 0.059 |
| (9) |
| (10) |
| (11) |
For a given MLM with parameters , we propose attention-weighted measures and defined in Equations 11 and 10 respectively, where is the average of all multi-head attentions associated with the ground truth token , and and are the probability score and rank of the masked token respectively.
| (12) |
| (13) |
Special start and end character tokens for MLMs are not included in the span of tokens considered in our experiments (and measures using attention weights and probabilities as computed from the (log)softmax of model logits for the masked token index) to eliminate noise. We reiterate that our method for representing MLM bias is based on the model’s relative preference for ground truth tokens between 2 sentence sets along a social bias axis, as measured by the (attention-weighted) quality (or error) of its predictions under the masked language modeling objective.


We plot the empirical cumulative distribution functions (ECDFs) of our sentence sets along different social biases for all measures, where (S1) is biased against disadvantaged groups and (S2) is biased against advantaged groups. For simplicity, Figure 2 shows the ECDF for (top) and the race bias category from CPS, where is a pre-trained MLM .
Figure 2 also shows a plot of the difference in ECDFs for crr (bottom) between and for pre-trained transformers and the race category in CPS, where represents an unbiased language model with equal prediction quality between sentence sets under the race bias category. Thus it visually separates what is biased against disadvantaged groups (or lower crr measure for , indicative of higher preference) on the positive y-axis from what is biased against advantaged groups on the negative y-axis.
We compute measure for an MLM transformer , for , where is a sentence, and . We apply the Shapiro-Wilk test Shapiro and Wilk (1965) for normality to each measure and find that we can not reject the null hypothesis and did not find evidence that our measures were not drawn from a normal distribution. As expected, the same was found for the difference of each of these measures between sentence sets relative to the same transformer . Table 6 shows these measures (likelihood scores) for an example sentence in the SS and CPS datasets. Values closer to 0 for each of these measures is indicative of higher MLM preference towards relative to or vice versa. In this case the model is (relatively) biased against disadvantaged groups for both inputs across all measures.444Greater MLM preference based on prediction quality is reflected by crr, crra, and values closer to 0. Therefore, if a sentence with bias against advantaged groups has a greater measure value relative to its paired counterpart, the MLM is deemed to prefer bias against disadvantaged groups. The opposite is true for measures csps, sss, aul and aula, where if a sentence with bias against advantaged groups has a lower measure value relative to its paired counterpart, the MLM is deemed to prefer bias against disadvantaged groups.
| (14) |
We apply Equation 14 to estimate the preference of a transformer for relative to for paired sentence and measure , . We define a bias score for a pre-trained MLM as bspt in Equation 15.
| (15) |
Here, is a per-model indicator function which returns if transformer has a larger preference for relative to and otherwise, as estimated for a measure by Equation 14.
We apply bspt to compare preferences for a given MLM. This expression represents the proportion of sentences with higher relative bias against disadvantaged groups for each bias category and measure. We assess results for bspt using proposed and previous bias measures across considered MLMs, where values greater than 50 indicate greater relative bias against disadvantaged groups for an MLM. We report them for RoBERTa in Table 7 and for other MLMs in Tables 13, 14 and 15 in the Appendix for simplicity. We also report overall bias scores for considered MLMs and measures in Table 12 in the Appendix.
| MLM: | |||||||
|---|---|---|---|---|---|---|---|
| Bias (CPS) | csps | aul | aula | crr | crra | ||
| Religion | 74.29 | 57.14 | 53.33 | 66.67 | 63.81 | 67.62 | 64.76 |
| Nationality | 64.15 | 60.38 | 56.6 | 55.35 | 57.86 | 54.09 | 55.35 |
| Race | 54.07 | 54.26 | 56.78 | 59.11 | 62.02 | 60.47 | 62.21 |
| Socioeconomic | 61.05 | 65.12 | 66.28 | 61.05 | 62.79 | 61.63 | 59.88 |
| Gender | 54.96 | 56.49 | 53.44 | 55.73 | 55.73 | 56.49 | 56.49 |
| Sexual orientation | 60.71 | 72.62 | 67.86 | 50.0 | 64.29 | 63.1 | 63.1 |
| Age | 66.67 | 58.62 | 59.77 | 56.32 | 55.17 | 56.32 | 54.02 |
| Disability | 66.67 | 68.33 | 68.33 | 71.67 | 70.0 | 68.33 | 70.0 |
| Physical appearance | 60.32 | 58.73 | 52.38 | 63.49 | 60.32 | 58.73 | 58.73 |
| Bias (SS) | SSS | aul | aula | crr | crra | ||
|---|---|---|---|---|---|---|---|
| Race | 57.48 | 56.65 | 56.96 | 56.44 | 60.71 | 60.19 | 60.4 |
| Profession | 62.59 | 61.98 | 60.37 | 58.89 | 62.47 | 62.72 | 63.09 |
| Gender | 69.8 | 64.71 | 62.35 | 61.96 | 66.27 | 67.45 | 66.27 |
| Religion | 60.76 | 50.63 | 54.43 | 50.63 | 60.76 | 64.56 | 65.82 |
We find that, overall, all evaluation methods show concerning social biases against disadvantaged groups embedded in MLMs as observed by Kaneko and Bollegala, 2022 and Nangia et al., 2020. Interestingly, has the lowest overall sss, aul, aula, crra, and (with the second lowest CRR) on the SS dataset, but the highest csps, crr, and on the CPS dataset. It also has the lowest aul, aula and crra on the CPS dataset. RoBERTa and distilRoBERTa have a higher overall bias compared to and according to all but one measure on the SS dataset, and aul and crra on the CPS dataset. Of all measures, only aul and aula estimate overall bias scores below 50, with the corresponding MLM being in every such instance.
We find that overall, compared to csps, sss, aul and aula, our proposed measures tend to be more in agreement relative to each other across MLMs and datasets. Furthermore, attention-weighted measures crra and give relatively similar bias scores compared to their unweighted measures, and crr produces lower scores with higher variability relative to measures crra, and for both datasets and across considered MLMs. Using RoBERTa as an example, maximum bias scores are produced by csps and sss on CPS and SS datasets respectively, while minimum values are produced by crr for both datasets, followed by aul on SS and aula on CPS.
CPS dataset
Disability has the highest crr across all MLMs on the CPS dataset. It also has the highest aula, crra, and for RoBERTA, and the second highest aul and CSPS. Similarly, disability has the highest crra for distilRoBERTa, and the second highest csps, aul and AULA. For and , disability has the highest and , and the second highest crra, but appears in lower ranks for csps, and even more so for aula and AUL.555Measures sss, aul, aula, and could be impacted the result of relative uniformity in the distribution of RoBERTa probabilities relative to each other in practice, as discussed in 3.2. In general for the CPS dataset, sexual orientation has relatively higher bias scores compared to other categories for and . Physical appearance has high bias scores with and relative to RoBERTa and distilRoBERTa. Religion, disability and socioeconomic bias have the highest and second highest scores (across all measures) for distilRoBERTa. Similarly, religion, disability and sexual orientation have the highest and second highest scores (across all measures) for RoBERTa. All measures reflect a relatively higher socioeconomic and lower sexual orientation biases in distilRoBERTa compared to RoBERTa, while and are both relatively lower in socioeconomic bias than the former two MLMs, but higher in sexual orientation bias than distilRoBERTa. In general, religion bias remains high across all MLMs and measures, while gender and age biases remain low. Compared to proposed measures, others underestimate disability bias for and , but yield similar relative estimates for RoBERTa and distilRoBERTa.
SS dataset
Gender has the first and second highest scores across all measures for RoBERTa and distilRoBERTa on the SS dataset. It has the highest score across every measure for RoBERTa, and the highest sss, aul, aula and crr for distilRoBERTa (with the second highest crra, and ). Furthermore, gender has the highest crr and crra and the second highest and for . Overall, profession and religion biases also have high scores for RoBERTa and distilRoBERTa, while race bias ranks third or fourth according to every measure. This persists for and , where race bias ranks third or fourth according to all measures besides crr and aula (and both place it second for and respectively). Profession has the highest aul and aula for and , while gender has the second highest (with one exception). Interestingly, religion has the highest crr, crra and for (and the second highest ), but has the lowest aul and AULA. Similar to , has religion with the highest but the lowest aul and AULA. However, unlike , religion also has the lowest crr and second lowest for . This might be expected since proposed measures rank religious bias for relatively consistently with other measures in the CPS dataset, whereas csps, aul and aula tend to overestimate religious bias for in comparison. We observe the opposite in the SS dataset, where aul and aula tend to underestimate the religious bias compared to proposed measures, with the notable exceptions of sss and crr. Overall, we can observe a higher relative gender bias in RoBERTa and distilRoBERTa compared to and on the SS dataset.
Kaneko and Bollegala, 2022 observe a higher bias score for religion in the CPS dataset across measures csps, aul and aula with the roberta-large MLM. Similarly, Nangia et al., 2020 observes that roberta-large has relatively higher bias scores for the religion category in the CPS dataset, and relatively lower bias scores for the gender and race categories compared to the SS dataset.666 and RoBERTa in this paper are transformers roberta-base and bert-base-uncased as referenced in Section 4, whereas Kaneko and Bollegala, 2022 use roberta-large and bert-base-cased in their experiments.
Similarly, we observe that gender has relatively lower scores in the CPS dataset compared to the SS dataset across our considered MLMs, but that race bias remains relatively low across all considered MLMs, measures and datasets. We also observe a relatively high religious bias across all MLMs in the CPS dataset, but find that aul and aula tend to underestimate religious bias on the SS dataset and overestimate the religious bias on the CPS dataset compared to proposed measures. Using as an example, religion has the lowest aul and aula on the SS dataset but the highest aul and aula on the CPS dataset. Additionally, we find that other measures underestimate disability bias for and on the CPS dataset, but give relatively similar estimates for RoBERTa and distilRoBERTa.
4.1.1 Alignment with Human Annotated Biases
We compare the alignment (agreement) between measures and bias ratings in the CPS dataset. Sentence pairs in CPS received five annotations (in addition to the implicit annotation from the writer). We map these sentences to a binary classification task, where a sentence is considered biased if it satisfies criteria stemming from Nangia et al., 2020, where (1) at least three out of six annotators (including the implicit annotation) agree a given pair is socially biased and (2) the majority of annotators who agree a given pair is socially biased agree on the type of social bias being expressed.777This experiment setting gives 58 unbiased pairs and 1,450 biased pairs for binary classification.
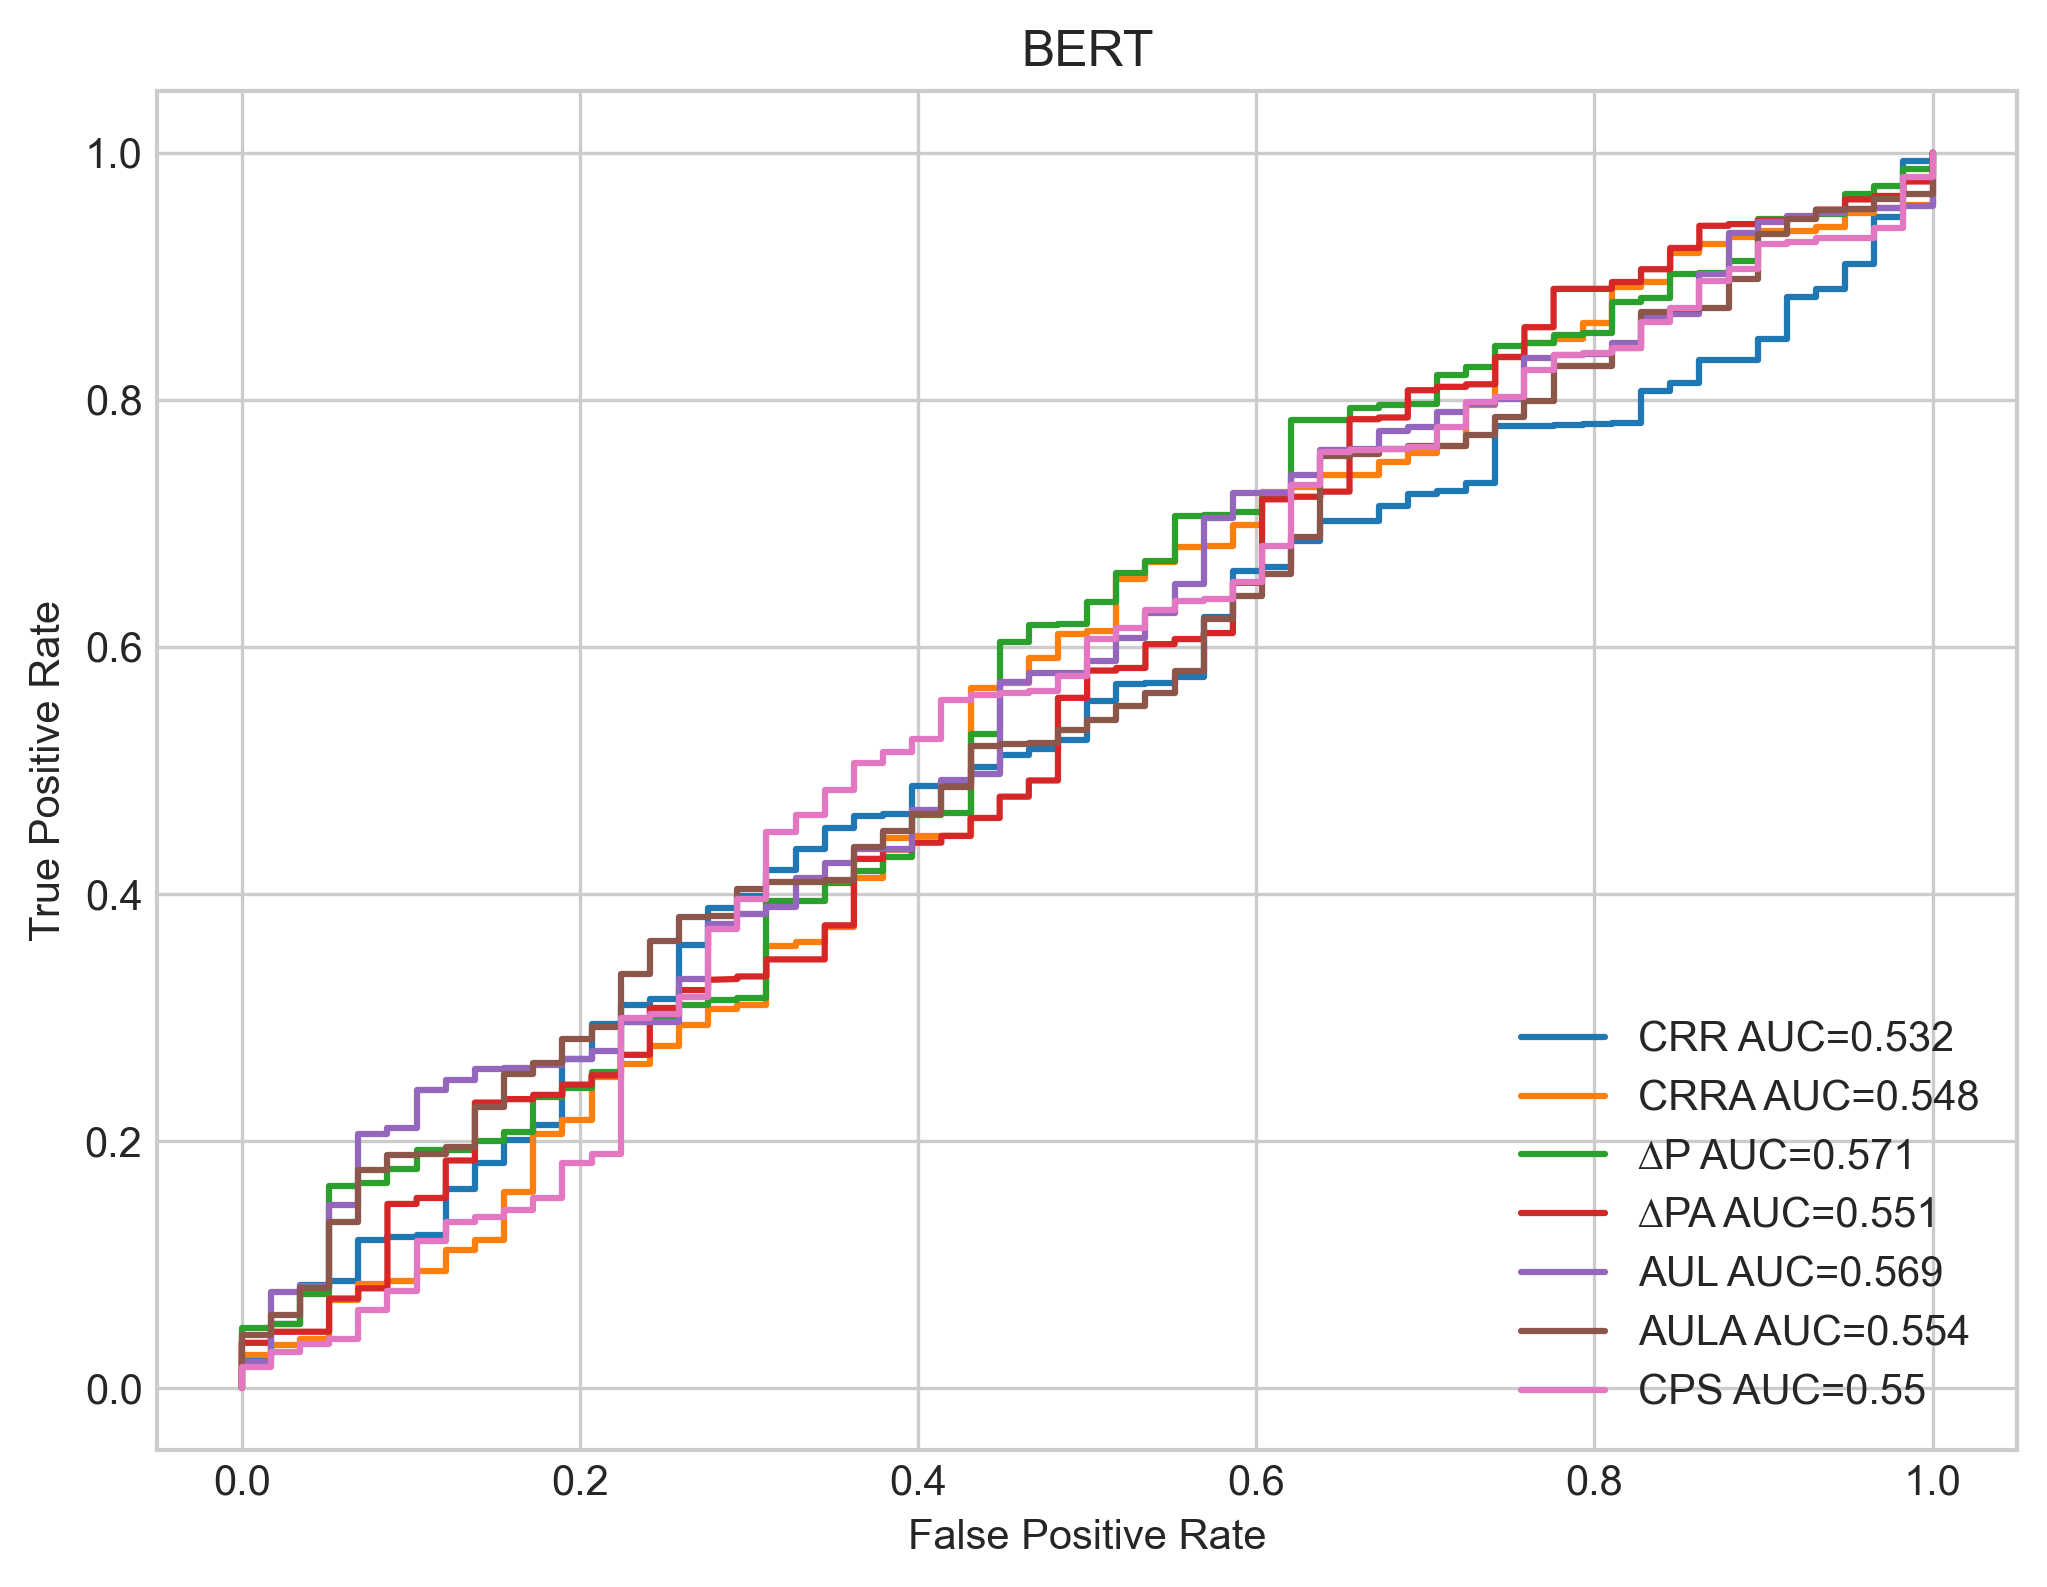
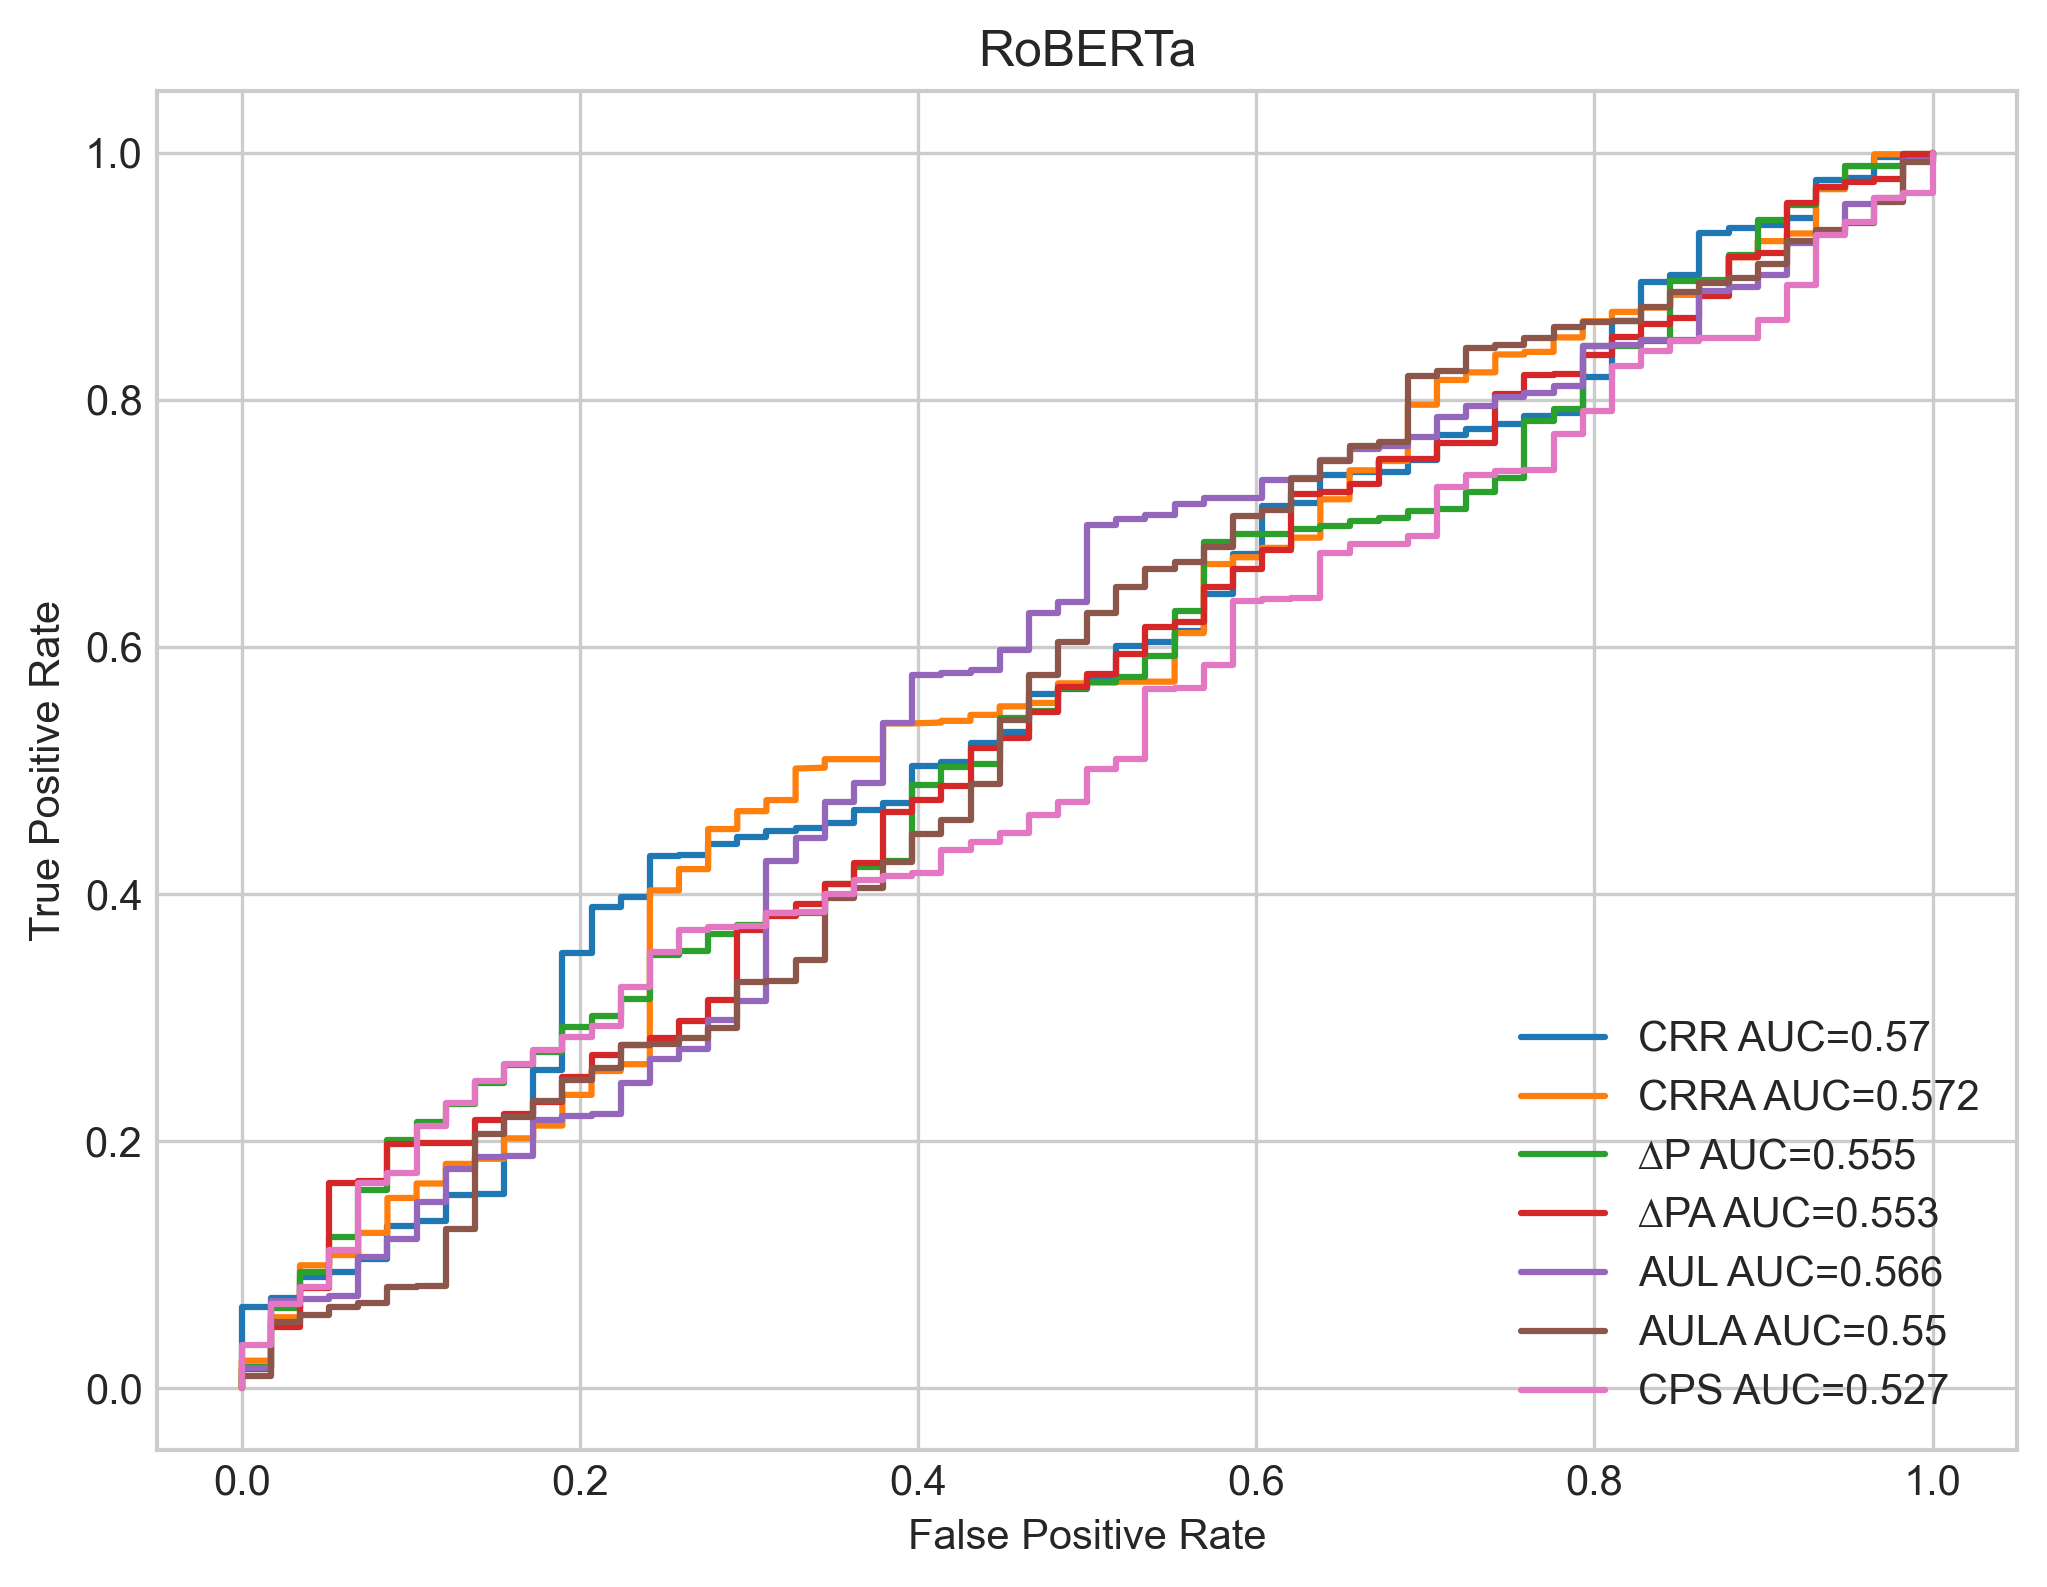
We compute evaluation measures derived from MLMs to predict whether a pair is biased or unbiased at varying thresholds. All measures are computed for each sentence in a pair and are continuous values. Thresholds for bias scores computed on sentences with bias against advantaged and disadvantaged groups respectively maximize area under the ROC Curve for that measure (shown for and RoBERTa in Figure 3). We find that one or more of our measures consistently outperforms CPS, aul and aula in their agreement with human annotators.
4.2 Recovering Race Bias in Pre-trained MLMs
| Race Bias | ||||||||
|---|---|---|---|---|---|---|---|---|
| Model | CPS | SS | CPS | SS | CPS | SS | CPS | SS |
| 0.016 | 0.011 | 0.004 | 0.009 | 0.111 | 0.168 † | 0.006 | 0.011 | |
| 0.023 † | 0.017 | 0.004 † | 0.007 † | 0.14 † | 0.217 † | 0.006 † | 0.01 † | |
| 0.013 | 0.008 | 0.004 | 0.01 † | 0.053 | 0.166 † | 0.003 | 0.011 † | |
| 0.024 † | 0.014 | 0.005 | 0.007 † | 0.113 † | 0.166 † | 0.005 † | 0.008 † | |
and are trained on English Wikipedia (16GB) and BookCorpus Zhu et al. (2015), while RoBERTa and distilRoBERTa are trained on OpenWebText Gokaslan and Cohen (2019). As referenced in Section 3.2, Salutari et al., 2023 found that RoBERTa’s and distilRoBERTa’s exposure to less standard English through training on the OpenWebCorpus likely exposed these MLMs to a less standard form of American English, as both models have more relative bias against SAE than AAE. Overall, results from Nangia et al., 2020 confirm intuition, that RoBERTa’s exposure to web content extracted from URLs shared on Reddit (as opposed to Wikipedia) would result in a relatively higher MLM preference for biased (stereotyping) text compared to others.
Indeed, we also observe that pre-trained MLMs RoBERTa and distilRoBERTa have a higher incidence of race bias against disadvantaged groups. We assess the difference between means for our proposed measures with a two-tailed Welch’s t-test Welch (1947) and report significance results in Table 8 for the race category, alongside the mean difference in measures between sentence sets and , or , on SS and CPS across all considered MLMs. This mean difference between sentence sets and across every MLM and measure is greater than 0, indicating that MLMs do encode bias against disadvantaged groups in the race bias category (with a lower relative to ), and in some cases significantly so.
As shown in Table 1, the race bias category makes up about one third of data sentence pairs in CPS (516 examples). For the race category in the CPS dataset we can observe that pre-trained RoBERTa has significantly different means for all proposed measures and that and pre-trained distilRoBERTa has significantly different means for three of four measures. Similarly, pre-trained RoBERTa and distilRoBERTa have significantly different means in three of four measures for the race category on the SS dataset. Based on these results we can only infer that pre-trained RoBERTa and distilRoBERTa have relatively higher bias against disadvantaged groups in the race category compared to pre-trained and .
4.3 Recovering Social Biases Introduced by Re-training MLMs
| Model | Set | Example | ||||
|---|---|---|---|---|---|---|
| he was a black man with a bad temper | 0.388 | 0.096 | 0.915 | 0.044 | ||
| he was a white man with a bad temper | 0.314 | 0.092 | 0.881 | 0.042 | ||
| he was a black man with a bad temper | <0.001 | 0.044 | <0.001 | <0.001 | ||
| he was a white man with a bad temper | 0.093 | 0.053 | 0.295 | 0.013 |
We re-train each transformer under consideration using the PyTorch Python library with P100 and T4 GPUs. The results showcased in this paper are from re-training with 0.15 as the mlm probability as in Devlin et al., 2019. MLMs are re-trained on cased (RoBERTa and distilRoBERTa) and uncased ( and ) versions of CPS sentences as referenced in Section 3.1.1. 80 percent of data was used for training and 20 percent was used for validation, MLMs are re-trained for 30 epochs each and reached a minimum validation loss at epoch 30.
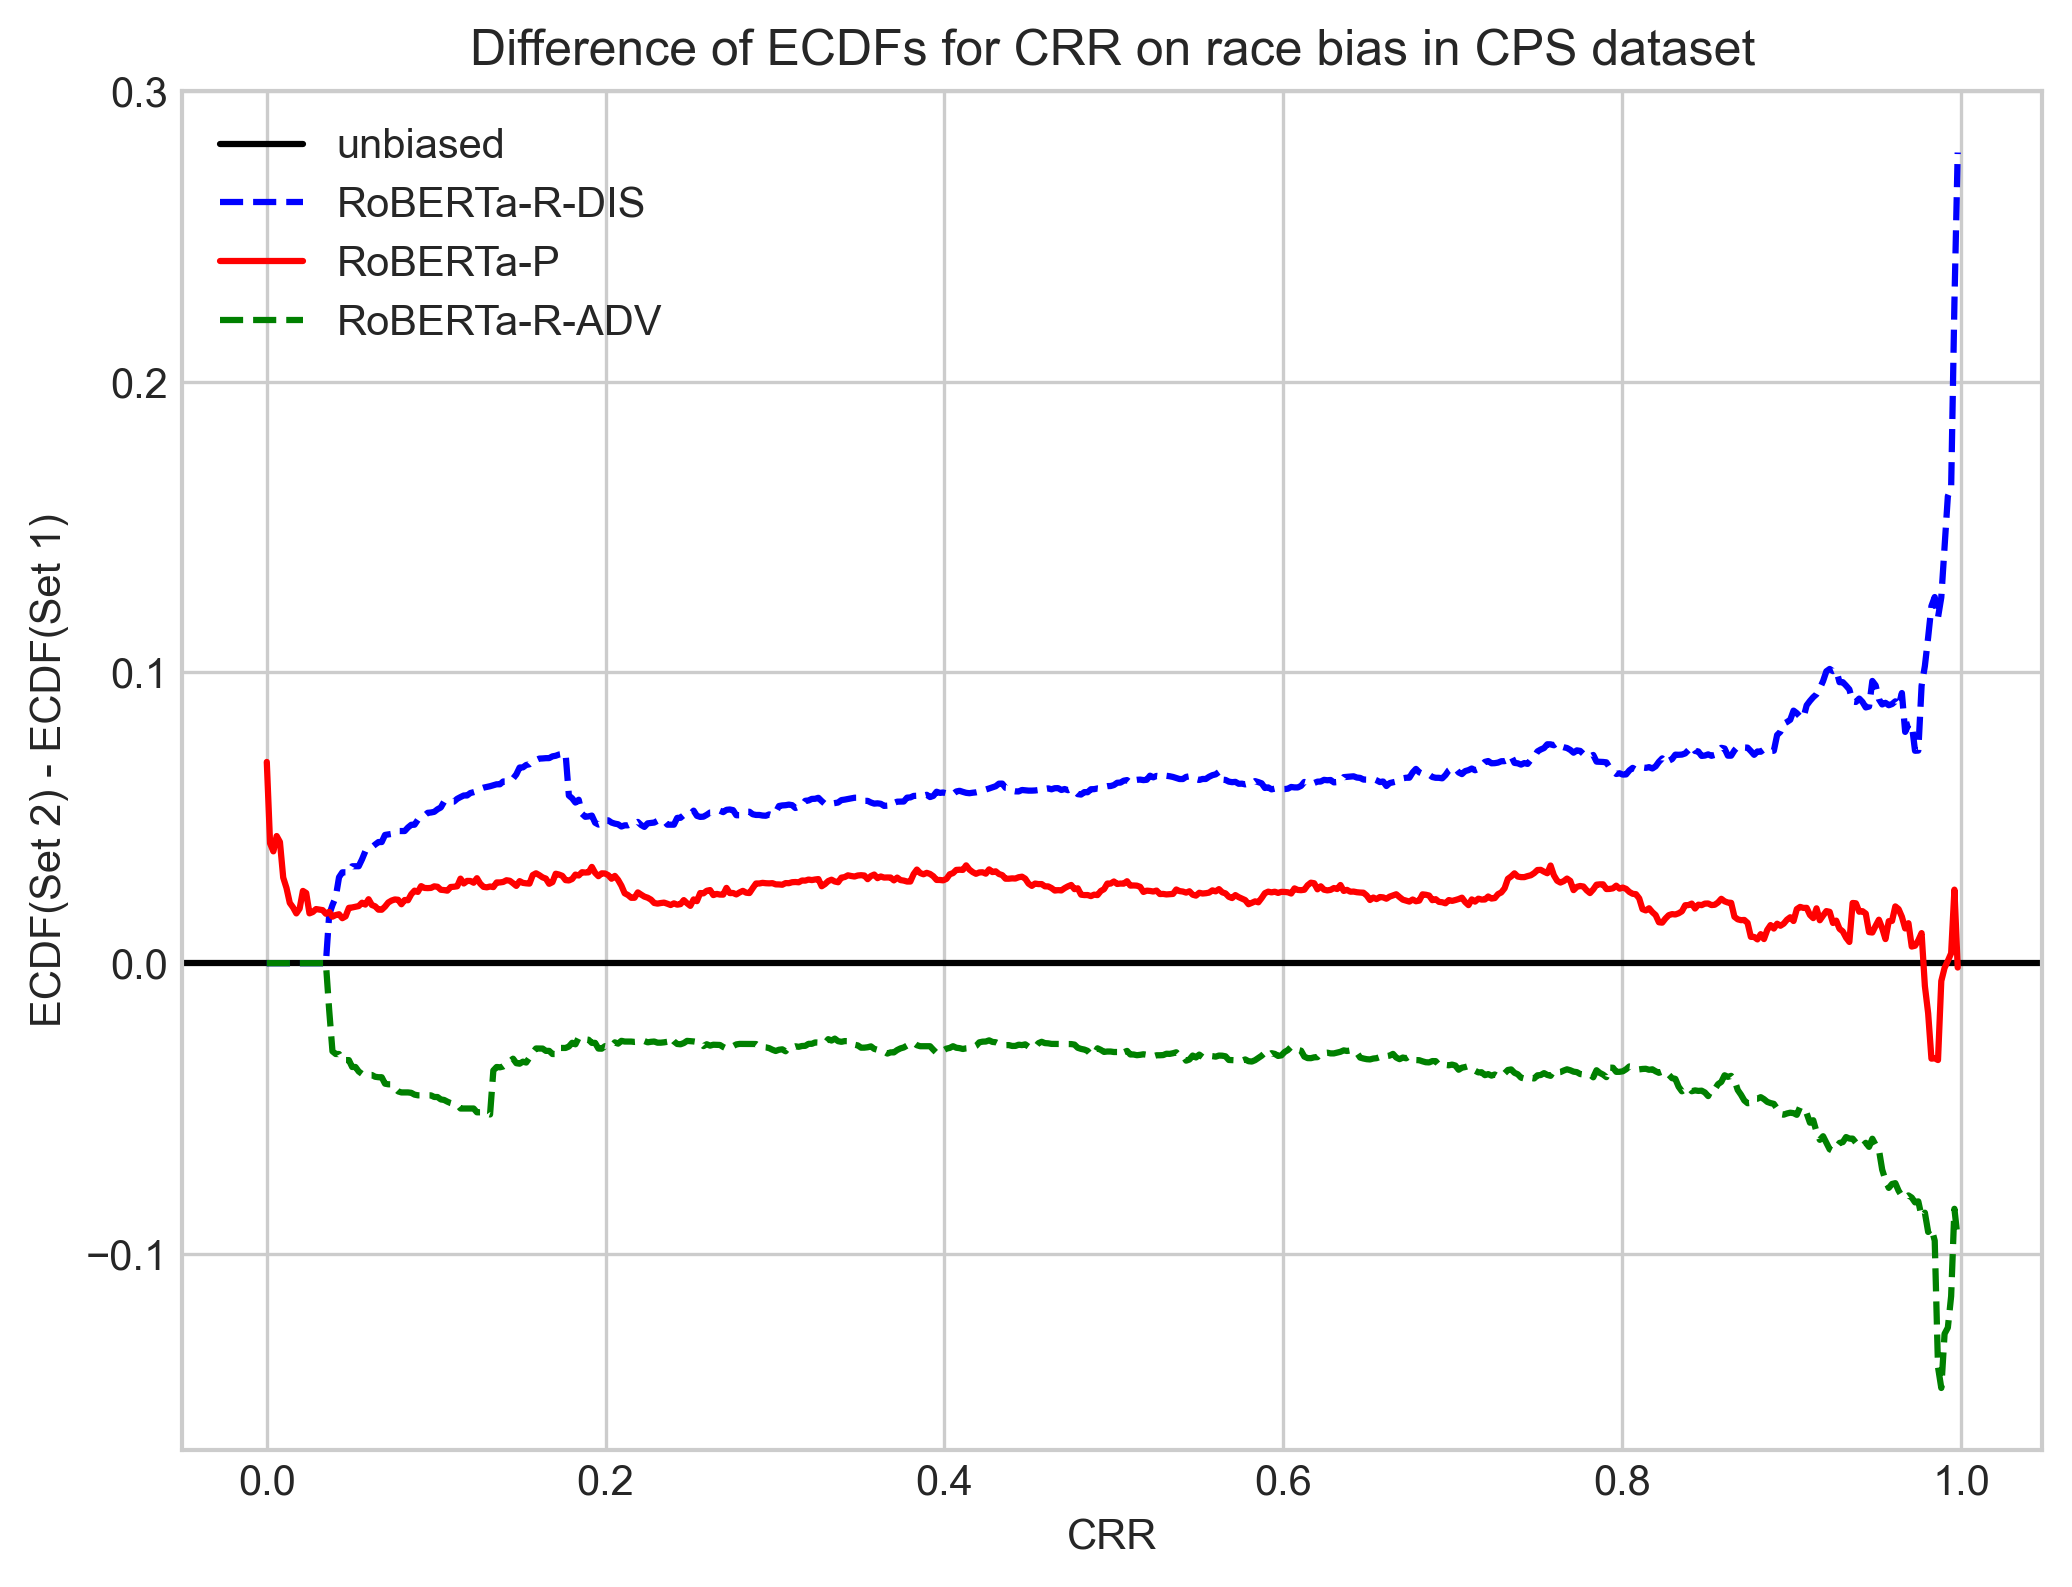
Analogously to Figure 2, Figure 4 shows the difference in ECDFs for the measure on the race bias category in CPS, where is re-trained MLM (in this case ). When compared with pre-trained RoBERTa (labeled as RoBERTa-P), we can observe an upwards shift in the difference of ECDFs for the crr difference between sentence sets after re-training RoBERTa on (labeled as RoBERTa-R-DIS), and a downwards shift for the same difference of ECDFs after re-training on (labeled as RoBERTa-R-ADV). This is as expected since separates what is biased against disadvantaged groups on the positive y-axis from what is biased against advantaged groups on the negative y-axis as referenced in Section 4.1, and re-training MLMs on sentence sets in CPS should shift the MLM preference towards the corresponding bias type. Thus, Figure 4 shows how the difference in ECDF distributions for an MLM can visually represent a contextual shift in relative bias using proposed measure crr.
Table 9 shows the difference in crr, crra, and as output by and for the same inputs, where the former has bias against advantaged groups and the latter has bias against disadvantaged groups, indicating a higher relative bias against disadvantaged groups after re-training the MLM (based on the given pair of sentences from CPS).
We define a bias score for a re-trained MLM (relative to its pre-trained base) as bsrt in Equation 16.
| (16) |
Here, we define a proxy for the relative preference between two MLMs with the model-comparative indicator function , which returns if transformer has a larger preference for relative to than transformer and otherwise, as estimated for a measure by Equation 14. This can be applied to compare pre-trained and re-trained MLMs (within the same model class) to recover the nature of biases introduced by MLM re-training, and possibly biases deeply encoded (or implicit) within corpora of interest. Naturally, values greater than 50 indicate greater bias against disadvantaged groups for transformer relative to (or a re-trained transformer relative to its pre-trained base).
| MLM: | |||||||
| Re-train Dataset: for CPS | |||||||
| Bias (CPS) | csps | aul | aula | crr | crra | ||
| Religion | 56.19 | 53.33 † | 55.24 † | 81.9 † | 77.14 † | 85.71 † | 85.71 † |
| Nationality | 56.6 † | 62.26 † | 60.38 † | 78.62 † | 79.25 † | 89.94 † | 88.68 † |
| Race | 60.47 † | 63.76 † | 56.4 † | 72.29 † | 70.54 † | 82.36 † | 80.23 † |
| Socioeconomic | 57.56 † | 56.4 † | 49.42 † | 82.56 † | 76.16 † | 88.37 † | 87.21 † |
| Disability | 58.33 † | 78.33 † | 70.0 | 78.33 † | 76.67 † | 88.33 † | 90.0 † |
| Physical Appearance | 50.79 | 65.08 † | 69.84 † | 76.19 † | 73.02 † | 79.37 † | 79.37 † |
| Gender | 61.07 † | 55.73 † | 56.11 † | 69.47 † | 68.32 † | 76.34 † | 74.81 † |
| Sexual Orientation | 52.38 | 51.19 | 47.62 | 71.43 † | 66.67 † | 83.33 † | 83.33 † |
| Age | 45.98 | 51.72 | 47.13 | 71.26 † | 74.71 † | 85.06 † | 87.36 † |
| Re-train Dataset: for CPS | |||||||
| Bias (CPS) | csps | aul | aula | crr | crra | ||
| Religion | 19.05 † | 21.9 † | 29.52 † | 22.86 † | 16.19 † | 12.38 † | 13.33 † |
| Nationality | 25.16 † | 24.53 † | 32.08 † | 18.87 † | 21.38 † | 16.35 † | 17.61 † |
| Race | 38.76 † | 26.16 † | 29.26 † | 14.92 † | 14.34 † | 11.05 † | 11.43 † |
| Socioeconomic | 29.65 † | 22.09 † | 23.84 † | 19.77 † | 19.77 † | 11.63 † | 13.37 † |
| Disability | 20.0 † | 18.33 † | 21.67 † | 16.67 † | 10.0 † | 1.67 † | 8.33 † |
| Physical Appearance | 28.57 † | 33.33 | 44.44 | 25.4 † | 12.7 † | 7.94 † | 11.11 † |
| Gender | 37.79 † | 33.59 † | 40.08 † | 28.63 † | 28.24 † | 28.63 † | 30.15 † |
| Sexual Orientation | 23.81 † | 16.67 † | 23.81 † | 22.62 † | 25.0 † | 13.1 † | 14.29 † |
| Age | 31.03 † | 25.29 † | 31.03 † | 16.09 † | 21.84 † | 12.64 † | 13.79 † |
We compute bsrt for re-trained MLMs and all measures and bias categories on CPS using Equation 16, and assess whether the relative differences in proportions of bias between re-trained and pre-trained transformers are significant according to McNemar’s test McNemar (1947). We report results for RoBERTa in Table 10 and for other MLMs in Tables 17, 18 and 19 in the Appendix for simplicity.
We find that overall, for almost all significant results across MLMs, each measure produces a bias score in accordance with the particular re-training dataset used ( or ), demonstrating that proposed function bsrt can be applied to estimate the bias against disadvantaged groups for transformer relative to its pre-trained base .
We find that, overall, proposed measures crr, crra, and are more accurate than csps, aul and aula for measuring social biases introduced by re-training MLMs. In general, they greatly outperform the others with regards to sensitivity for relative changes in MLM bias due to re-training, indicated by the larger and smaller scores and more frequently significant relative difference in proportions of bias between re-trained and pre-trained transformers. In every case across considered MLMs, one or more of our measures reports the highest re-training bias scores for MLMs re-trained on and the lowest re-training bias scores for MLMs re-trained on .
For re-trained on from CPS, each measure gives scores below 50 as expected. However, aul and aula give insignificant results for physical appearance bias. crr, crra, and give significant results below 50 for each bias category with lower scores than other measures in general. For re-trained on , aul and aula overestimate physical appearance, gender, disability and socioeconomic biases and give insignificant results for each, while all proposed measures again give significant results below 50 for each bias category as expected. Similarly, for , aula overestimates physical appearance bias and gives insignificant results for physical appearance, gender and age biases, aul gives insignificant results for physical appearance and both csps and aul give insignificant results for age. aul and aula also give insignificant results for physical appearance, disability, and sexual orientation for re-trained on . Notably, crr gives insignificant results for physical appearance for . Overall, aul, aula and csps substantially overestimate physical appearance bias introduced by re-training MLMs compared to proposed measures and based on bsrt.
| Re-train Dataset: for CPS | |||||||
| Model | csps | aul | aula | crr | crra | ||
| 0.028 | 0.028 | 0.028 | 0.000 | 0.000 | 0.000 | 0.000 | |
| 0.028 | 0.000 | 0.083 | 0.000 | 0.000 | 0.000 | 0.000 | |
| 0.000 | 0.000 | 0.000 | 0.000 | 0.028 | 0.000 | 0.000 | |
| 0.056 | 0.000 | 0.000 | 0.000 | 0.000 | 0.000 | 0.000 | |
| Re-train Dataset: for CPS | |||||||
| Model | csps | aul | aula | crr | crra | ||
| 0.000 | 0.083 | 0.083 | 0.000 | 0.000 | 0.000 | 0.000 | |
| 0.000 | 0.000 | 0.000 | 0.000 | 0.000 | 0.000 | 0.000 | |
| 0.000 | 0.000 | 0.000 | 0.000 | 0.000 | 0.000 | 0.000 | |
| 0.000 | 0.000 | 0.028 | 0.000 | 0.000 | 0.000 | 0.000 | |
For all MLMs re-trained on , crr, and all give results above 50 for each bias category as hoped for, with higher scores than other measures in almost every case. This also applies to crra with one exception being disability bias using . Proposed measures are significant for every bias type using and . This is also true for with the exception of crra for sexual orientation bias and for with the exception of crra for physical appearance bias and crr for disability bias. On the other hand, aul, aula and csps have 5, 6 and 11 insignificant results respectively, across all considered MLMs retrained on , and aula and csps give 3 and 4 bias scores below 50 respectively. Notably, aul and crra give 1 bias score below 50 respectively. These are problematic underestimations of biases introduced by re-training MLMs only on sentences with biases against disadvantaged groups from the CPS dataset. For reported in Table 10, csps and aula give scores less than 50 for age bias. aula also gives a score less than 50 for sexual orientation bias. csps gives insignificant results for religion, physical appearance, sexual orientation and age, aul gives insignificant results for sexual orientation and age and aula gives insignificant results for disability, sexual orientation and age.
When framed as a binary classification task where bsrt above 50 indicates increased preference (after re-training) for sentences with bias against disadvantaged groups in CPS (1), and vice versa for scores below 50 (0), there are 72 predictions per measure across MLMs and bias types. Half of binary truths are 1 and 0 respectively since MLMs re-trained on are expected to have a score above 50 for all bias types (vice versa for scores below 50), and has the same length (number of sentences) as . We report error rates for MLMs in Table 11 and find that one or more of proposed measures produce the lowest error rate for all considered MLMs. Overall, crr, and are 100% accurate and crra is about 99% accurate, while aul, aula and csps are about 93%, 88% and 94% accurate respectively. Based on this evaluation setting, proposed measures crr, crra, and are more accurate than previously proposed measures csps, aul and aula for estimating social biases introduced by re-training MLMs.
5 Conclusion
This paper proposes and validates methods to measure linguistic social biases encoded in deep contextual embeddings and MLMs under an iterative masking experiment, including attention-weighted measures crra (Equation 12) and (Equation 13). We estimate the preference of an MLM by proxy of relative prediction quality between biased sentences in pairs. We leverage commonly utilized, state-of-the-art transformers , RoBERTa, and distilRoBERTa to approximate the distributions of our measures for benchmark datasets CPS and SS. We apply a per-model function bspt (Equation 15) to compute bias scores for pre-trained MLMs, and find that all considered MLMs encode concerning social biases. We compare results with other evaluation methods and assess measure alignment with human annotated biases, finding that one or more of our measures typically outperforms previously proposed ones in this regard for considered MLMs. We find that gender has lower encoded biases on the CPS dataset compared to the SS dataset across MLMs. Overall, we find that previously proposed measures underestimate bias against disadvantaged groups in the religion category on the SS dataset and disability category on the CPS dataset. We also propose a model-comparative function bsrt (Equation 16) to measure the relative change in biases after re-training an MLM under the masked language modeling objective, and find that proposed measures are generally more sensitive to biases introduced by re-training MLMs on sentence sets in CPS and produce more accurate estimations than previously proposed ones, which in some cases produce concerning underestimations of biases introduced by re-training MLMs only on sentences with biases against disadvantaged groups from the CPS dataset. We encourage research to assess the agreement between relative changes in MLM bias captured by discussed measures (introduced by re-training) and implicit biases in the re-training corpus. We hope that social scientists will find our methods useful for measuring social biases in pre-trained and re-trained MLMs.
References
- Bolukbasi et al. (2016) Tolga Bolukbasi, Kai-Wei Chang, James Y Zou, Venkatesh Saligrama, and Adam T Kalai. 2016. Man is to computer programmer as woman is to homemaker? debiasing word embeddings. In Advances in Neural Information Processing Systems, volume 29. Curran Associates, Inc.
- Brown et al. (2020) Tom B. Brown, Benjamin Mann, Nick Ryder, Melanie Subbiah, Jared Kaplan, Prafulla Dhariwal, Arvind Neelakantan, Pranav Shyam, Girish Sastry, Amanda Askell, Sandhini Agarwal, Ariel Herbert-Voss, Gretchen Krueger, Tom Henighan, Rewon Child, Aditya Ramesh, Daniel M. Ziegler, Jeffrey Wu, Clemens Winter, Christopher Hesse, Mark Chen, Eric Sigler, Mateusz Litwin, Scott Gray, Benjamin Chess, Jack Clark, Christopher Berner, Sam McCandlish, Alec Radford, Ilya Sutskever, and Dario Amodei. 2020. Language models are few-shot learners.
- Devlin et al. (2018) Jacob Devlin, Ming-Wei Chang, Kenton Lee, and Kristina Toutanova. 2018. BERT: pre-training of deep bidirectional transformers for language understanding. CoRR, abs/1810.04805.
- Devlin et al. (2019) Jacob Devlin, Ming-Wei Chang, Kenton Lee, and Kristina Toutanova. 2019. Bert: Pre-training of deep bidirectional transformers for language understanding.
- Ethayarajh et al. (2019) Kawin Ethayarajh, David Duvenaud, and Graeme Hirst. 2019. Understanding undesirable word embedding associations. In Proceedings of the 57th Annual Meeting of the Association for Computational Linguistics, pages 1696–1705, Florence, Italy. Association for Computational Linguistics.
- Gokaslan and Cohen (2019) Aaron Gokaslan and Vanya Cohen. 2019. Openwebtext corpus. http://Skylion007.github.io/OpenWebTextCorpus.
- Islam et al. (2016) Aylin Caliskan Islam, Joanna J. Bryson, and Arvind Narayanan. 2016. Semantics derived automatically from language corpora necessarily contain human biases. CoRR, abs/1608.07187.
- Kaneko and Bollegala (2022) Masahiro Kaneko and Danushka Bollegala. 2022. Unmasking the mask – evaluating social biases in masked language models. In Proceedings of the 36th AAAI Conference on Artificial Intelligence, Vancouver, BC, Canada.
- Liang et al. (2020) Sheng Liang, Philipp Dufter, and Hinrich Schütze. 2020. Monolingual and multilingual reduction of gender bias in contextualized representations. In Proceedings of the 28th International Conference on Computational Linguistics, pages 5082–5093, Barcelona, Spain (Online). International Committee on Computational Linguistics.
- Liu et al. (2019a) Xiaodong Liu, Pengcheng He, Weizhu Chen, and Jianfeng Gao. 2019a. Improving multi-task deep neural networks via knowledge distillation for natural language understanding.
- Liu et al. (2019b) Yinhan Liu, Myle Ott, Naman Goyal, Jingfei Du, Mandar Joshi, Danqi Chen, Omer Levy, Mike Lewis, Luke Zettlemoyer, and Veselin Stoyanov. 2019b. Roberta: A robustly optimized BERT pretraining approach. CoRR, abs/1907.11692.
- Manzini et al. (2019) Thomas Manzini, Lim Yao Chong, Alan W Black, and Yulia Tsvetkov. 2019. Black is to criminal as Caucasian is to police: Detecting and removing multiclass bias in word embeddings. In Proceedings of the 2019 Conference of the North American Chapter of the Association for Computational Linguistics: Human Language Technologies, Volume 1 (Long and Short Papers), pages 615–621, Minneapolis, Minnesota. Association for Computational Linguistics.
- May et al. (2019) Chandler May, Alex Wang, Shikha Bordia, Samuel R. Bowman, and Rachel Rudinger. 2019. On measuring social biases in sentence encoders.
- McNemar (1947) Quinn McNemar. 1947. Note on the sampling error of the difference between correlated proportions or percentages. Psychometrika, 12(2):153–157.
- Mikolov et al. (2013) Tomas Mikolov, Kai Chen, Greg Corrado, and Jeffrey Dean. 2013. Efficient estimation of word representations in vector space.
- Nadeem et al. (2020) Moin Nadeem, Anna Bethke, and Siva Reddy. 2020. Stereoset: Measuring stereotypical bias in pretrained language models.
- Nangia et al. (2020) Nikita Nangia, Clara Vania, Rasika Bhalerao, and Samuel R. Bowman. 2020. CrowS-pairs: A challenge dataset for measuring social biases in masked language models. In Proceedings of the 2020 Conference on Empirical Methods in Natural Language Processing (EMNLP), pages 1953–1967, Online. Association for Computational Linguistics.
- Pennington et al. (2014) Jeffrey Pennington, Richard Socher, and Christopher Manning. 2014. GloVe: Global vectors for word representation. In Proceedings of the 2014 Conference on Empirical Methods in Natural Language Processing (EMNLP), pages 1532–1543, Doha, Qatar. Association for Computational Linguistics.
- Radford et al. (2019) Alec Radford, Jeff Wu, Rewon Child, David Luan, Dario Amodei, and Ilya Sutskever. 2019. Language models are unsupervised multitask learners.
- Salazar et al. (2020) Julian Salazar, Davis Liang, Toan Q. Nguyen, and Katrin Kirchhoff. 2020. Masked language model scoring. In Proceedings of the 58th Annual Meeting of the Association for Computational Linguistics. Association for Computational Linguistics.
- Salutari et al. (2023) Flavia Salutari, Jerome Ramos, Hosein A Rahmani, Leonardo Linguaglossa, and Aldo Lipani. 2023. Quantifying the bias of transformer-based language models for african american english in masked language modeling. The Pacific-Asia Conference on Knowledge Discovery and Data Mining (PAKDD) 2023.
- Sanh et al. (2019) Victor Sanh, Lysandre Debut, Julien Chaumond, and Thomas Wolf. 2019. Distilbert, a distilled version of BERT: smaller, faster, cheaper and lighter. CoRR, abs/1910.01108.
- Shapiro and Wilk (1965) S. S. Shapiro and M. B. Wilk. 1965. An analysis of variance test for normality (complete samples). Biometrika, 52(3/4):591–611.
- Welch (1947) Bernard L Welch. 1947. The generalization of student’s’ problem when several different population variances are involved. Biometrika, pages 1–25.
- Wolf et al. (2019) Thomas Wolf, Lysandre Debut, Victor Sanh, Julien Chaumond, Clement Delangue, Anthony Moi, Pierric Cistac, Tim Rault, Rémi Louf, Morgan Funtowicz, and Jamie Brew. 2019. Huggingface’s transformers: State-of-the-art natural language processing. CoRR, abs/1910.03771.
- Zhu et al. (2015) Yukun Zhu, Ryan Kiros, Richard S. Zemel, Ruslan Salakhutdinov, Raquel Urtasun, Antonio Torralba, and Sanja Fidler. 2015. Aligning books and movies: Towards story-like visual explanations by watching movies and reading books. CoRR, abs/1506.06724.
Appendix A Overall Bias Scores for Pre-trained MLMs
| CPS Dataset | |||||||
|---|---|---|---|---|---|---|---|
| Model | csps | aul | aula | crr | crra | ||
| 59.35 | 58.75 | 58.09 | 58.89 | 60.68 | 59.88 | 60.15 | |
| 60.48 | 48.34 | 48.21 | 61.07 | 58.89 | 60.08 | 60.81 | |
| 59.35 | 53.32 | 51.86 | 57.76 | 61.94 | 59.75 | 59.81 | |
| 56.83 | 51.59 | 52.65 | 56.23 | 60.08 | 57.49 | 58.02 | |
| SS Dataset | |||||||
| Model | SSS | aul | aula | crr | crra | ||
| 61.06 | 59.45 | 58.83 | 57.83 | 62.06 | 62.2 | 62.35 | |
| 59.16 | 48.91 | 50.28 | 53.85 | 58.59 | 58.64 | 58.21 | |
| 61.4 | 60.21 | 59.59 | 54.37 | 60.54 | 61.4 | 61.35 | |
| 60.59 | 51.71 | 51.66 | 53.42 | 61.11 | 59.31 | 59.31 | |
Appendix B Bias Scores by Category for Pre-trained MLMs
| MLM: | |||||||
|---|---|---|---|---|---|---|---|
| Bias (CPS) | csps | aul | aula | crr | crra | ||
| Religion | 71.43 | 66.67 | 66.67 | 59.05 | 60.0 | 63.81 | 60.95 |
| Nationality | 62.89 | 51.57 | 54.09 | 52.83 | 50.94 | 47.17 | 49.69 |
| Race | 58.14 | 48.84 | 49.42 | 62.98 | 59.5 | 61.24 | 62.02 |
| Socioeconomic | 59.88 | 43.02 | 40.7 | 59.3 | 58.72 | 58.72 | 62.21 |
| Gender | 58.02 | 46.56 | 43.89 | 54.2 | 53.44 | 58.02 | 57.25 |
| Sexual orientation | 67.86 | 50.0 | 50.0 | 72.62 | 72.62 | 71.43 | 71.43 |
| Age | 55.17 | 51.72 | 49.43 | 59.77 | 57.47 | 50.57 | 52.87 |
| Disability | 61.67 | 38.33 | 41.67 | 80.0 | 71.67 | 76.67 | 75.0 |
| Physical appearance | 63.49 | 30.16 | 33.33 | 71.43 | 66.67 | 71.43 | 73.02 |
| Bias (SS) | SSS | aul | aula | crr | crra | ||
|---|---|---|---|---|---|---|---|
| Race | 56.03 | 46.88 | 49.48 | 52.7 | 56.55 | 57.48 | 56.34 |
| Profession | 60.62 | 51.23 | 51.98 | 54.2 | 60.12 | 58.64 | 59.26 |
| Gender | 66.67 | 49.8 | 48.63 | 53.73 | 60.39 | 61.57 | 61.18 |
| Religion | 58.23 | 46.84 | 48.1 | 64.56 | 62.03 | 63.29 | 60.76 |
| MLM: | |||||||
|---|---|---|---|---|---|---|---|
| Bias (CPS) | csps | aul | aula | crr | crra | ||
| Religion | 70.48 | 55.24 | 52.38 | 54.29 | 65.71 | 65.71 | 65.71 |
| Nationality | 54.09 | 47.8 | 47.17 | 53.46 | 53.46 | 50.31 | 52.83 |
| Race | 53.29 | 55.43 | 56.2 | 55.81 | 60.08 | 55.62 | 56.78 |
| Socioeconomic | 55.81 | 45.93 | 47.67 | 59.3 | 58.14 | 58.72 | 58.14 |
| Gender | 54.58 | 56.11 | 55.73 | 51.15 | 55.73 | 54.58 | 54.58 |
| Sexual orientation | 70.24 | 47.62 | 52.38 | 67.86 | 79.76 | 71.43 | 70.24 |
| Age | 59.77 | 39.08 | 45.98 | 51.72 | 51.72 | 47.13 | 47.13 |
| Disability | 61.67 | 43.33 | 51.67 | 75.0 | 73.33 | 75.0 | 75.0 |
| Physical appearance | 55.56 | 50.79 | 49.21 | 55.56 | 63.49 | 65.08 | 65.08 |
| Bias (SS) | SSS | aul | aula | crr | crra | ||
|---|---|---|---|---|---|---|---|
| Race | 58.42 | 48.54 | 48.86 | 53.64 | 59.36 | 56.55 | 57.07 |
| Profession | 62.47 | 55.68 | 55.06 | 52.22 | 62.1 | 61.36 | 61.36 |
| Gender | 61.57 | 52.94 | 52.94 | 56.86 | 63.92 | 61.96 | 61.18 |
| Religion | 64.56 | 45.57 | 46.84 | 51.9 | 63.29 | 63.29 | 59.49 |
| MLM: | |||||||
|---|---|---|---|---|---|---|---|
| Bias (CPS) | csps | aul | aula | crr | crra | ||
| Religion | 71.43 | 49.52 | 44.76 | 62.86 | 64.76 | 71.43 | 72.38 |
| Nationality | 62.26 | 54.72 | 52.83 | 54.09 | 59.75 | 59.12 | 59.75 |
| Race | 56.59 | 51.74 | 50.78 | 59.88 | 64.73 | 58.53 | 59.5 |
| Socioeconomic | 61.63 | 65.12 | 70.93 | 61.63 | 66.86 | 67.44 | 67.44 |
| Gender | 53.05 | 51.91 | 49.24 | 51.15 | 54.58 | 53.05 | 53.05 |
| Sexual orientation | 65.48 | 50.0 | 41.67 | 55.95 | 64.29 | 64.29 | 63.1 |
| Age | 56.32 | 49.43 | 43.68 | 52.87 | 55.17 | 51.72 | 50.57 |
| Disability | 68.33 | 63.33 | 63.33 | 66.67 | 71.67 | 63.33 | 63.33 |
| Physical appearance | 61.9 | 42.86 | 42.86 | 58.73 | 53.97 | 60.32 | 53.97 |
| Bias (SS) | SSS | aul | aula | crr | crra | ||
|---|---|---|---|---|---|---|---|
| Race | 58.11 | 57.38 | 56.86 | 54.05 | 60.5 | 60.29 | 60.29 |
| Profession | 61.36 | 62.22 | 61.85 | 53.46 | 59.63 | 61.23 | 61.6 |
| Gender | 71.76 | 64.31 | 63.53 | 58.04 | 61.96 | 64.71 | 62.35 |
| Religion | 68.35 | 60.76 | 56.96 | 55.7 | 65.82 | 65.82 | 68.35 |
Appendix C Bias Category Ranks for Pre-trained MLMs
| Measure | R1 | R2 | R3 | R4 | R5 | R6 | R7 | R8 | R8 | R1 | R2 | R3 | R4 |
|---|---|---|---|---|---|---|---|---|---|---|---|---|---|
| CPS Dataset | SS Dataset | ||||||||||||
| CSPS | Rel. | Dis. | Age | Nat. | Soc. | Ori. | Phy. | Gen. | Race | - | - | - | - |
| SSS | - | - | - | - | - | - | - | - | - | Gen. | Pro. | Rel. | Race |
| AUL | Ori. | Dis. | Soc. | Nat. | Phy. | Age | Rel. | Gen. | Race | Gen. | Pro. | Race | Rel. |
| AULA | Dis. | Ori. | Soc. | Age | Race | Nat. | Gen. | Rel. | Phy. | Gen. | Pro. | Race | Rel. |
| CRR | Dis. | Rel. | Phy. | Soc. | Race | Age | Gen. | Nat. | Ori. | Gen. | Pro. | Race | Rel. |
| CRRA | Dis. | Ori. | Rel. | Soc. | Race | Phy. | Nat. | Gen. | Age | Gen. | Pro. | Rel. | Race |
| Dis. | Rel. | Ori. | Soc. | Race | Phy. | Gen. | Age | Nat. | Gen. | Rel. | Pro. | Race | |
| Dis. | Rel. | Ori. | Race | Soc. | Phy. | Gen. | Nat. | Age | Gen. | Rel. | Pro. | Race | |
| CPS Dataset | SS Dataset | ||||||||||||
| CSPS | Rel. | Ori. | Phy. | Nat. | Dis. | Soc. | Race | Gen. | Age | - | - | - | - |
| SSS | - | - | - | - | - | - | - | - | - | Gen. | Pro. | Rel. | Race |
| AUL | Rel. | Age | Nat. | Ori. | Race | Gen. | Soc. | Dis. | Phy. | Pro. | Gen. | Race | Rel. |
| AULA | Rel. | Nat. | Ori. | Age | Race | Gen. | Dis. | Soc. | Phy. | Pro. | Race | Gen. | Rel. |
| CRR | Dis. | Ori. | Phy. | Race | Age | Soc. | Rel. | Gen. | Nat. | Rel. | Pro. | Gen. | Race |
| CRRA | Ori. | Dis. | Phy. | Rel. | Race | Soc. | Age | Gen. | Nat. | Rel. | Gen. | Pro. | Race |
| Dis. | Ori. | Phy. | Rel. | Race | Soc. | Gen. | Age | Nat. | Rel. | Gen. | Pro. | Race | |
| Dis. | Phy. | Ori. | Soc. | Race | Rel. | Gen. | Age | Nat. | Gen. | Rel. | Pro. | Race | |
| CPS Dataset | SS Dataset | ||||||||||||
| CSPS | Rel. | Dis. | Ori. | Nat. | Phy. | Soc. | Race | Age | Gen. | - | - | - | - |
| SSS | - | - | - | - | - | - | - | - | - | Gen. | Rel. | Pro. | Race |
| AUL | Soc. | Dis. | Nat. | Gen. | Race | Ori. | Rel. | Age | Phy. | Gen. | Pro. | Rel. | Race |
| AULA | Soc. | Dis. | Nat. | Race | Gen. | Rel. | Age | Phy. | Ori. | Gen. | Pro. | Rel. | Race |
| CRR | Dis. | Rel. | Soc. | Race | Phy. | Ori. | Nat. | Age | Gen. | Gen. | Rel. | Race | Pro. |
| CRRA | Dis. | Soc. | Rel. | Race | Ori. | Nat. | Age | Gen. | Phy. | Rel. | Gen. | Race | Pro. |
| Rel. | Soc. | Ori. | Dis. | Phy. | Nat. | Race | Gen. | Age | Rel. | Gen. | Pro. | Race | |
| Rel. | Soc. | Dis. | Ori. | Nat. | Race | Phy. | Gen. | Age | Rel. | Gen. | Pro. | Race | |
| CPS Dataset | SS Dataset | ||||||||||||
| CSPS | Rel. | Ori. | Dis. | Age | Soc. | Phy. | Gen. | Nat. | Race | - | - | - | - |
| SSS | - | - | - | - | - | - | - | - | - | Rel. | Pro. | Gen. | Race |
| AUL | Gen. | Race | Rel. | Phy. | Nat. | Ori. | Soc. | Dis. | Age | Pro. | Gen. | Race | Rel. |
| AULA | Race | Gen. | Ori. | Rel. | Dis. | Phy. | Soc. | Nat. | Age | Pro. | Gen. | Race | Rel. |
| CRR | Dis. | Ori. | Soc. | Race | Phy. | Rel. | Nat. | Age | Gen. | Gen. | Race | Pro. | Rel. |
| CRRA | Ori. | Dis. | Rel. | Phy. | Race | Soc. | Gen. | Nat. | Age | Gen. | Rel. | Pro. | Race |
| Dis. | Ori. | Rel. | Phy. | Soc. | Race | Gen. | Nat. | Age | Rel. | Gen. | Pro. | Race | |
| Dis. | Ori. | Rel. | Phy. | Soc. | Race | Gen. | Nat. | Age | Pro. | Gen. | Rel. | Race | |
Appendix D Bias Scores by Category for Re-trained MLMs
Bias scores for crr, crra, , , csps, aul and aula measures using Equation 16. † indicates that the relative difference in proportions of bias between re-trained and pre-trained transformers is statistically significant according to McNemar’s test (p-value < 0.05), using binarized outcomes for bias as given by and to create contingency tables of outcome pairings between re-trained and pre-trained transformers to test for marginal homogeneity. Results for MLMs re-trained on (top; all sentences with bias against disadvantaged groups) and (bottom; all sentences with bias against advantaged groups) for biases in the CPS dataset.
| MLM: | |||||||
| Re-train Dataset: for CPS | |||||||
| Bias (CPS) | csps | aul | aula | crr | crra | ||
| Religion | 49.52 | 76.19 † | 75.24 † | 75.24 † | 80.0 † | 85.71 † | 85.71 † |
| Nationality | 57.23 † | 71.7 † | 70.44 † | 70.44 † | 71.07 † | 77.99 † | 77.99 † |
| Race | 57.36 † | 73.84 † | 70.54 † | 72.48 † | 70.16 † | 79.65 † | 78.29 † |
| Socioeconomic | 59.88 † | 74.42 † | 63.37 † | 81.4 † | 76.16 † | 85.47 † | 85.47 † |
| Disability | 46.67 | 80.0 | 75.0 | 56.67 | 55.0 † | 80.0 † | 78.33 † |
| Physical Appearance | 50.79 | 76.19 † | 65.08 † | 71.43 † | 71.43 | 80.95 † | 80.95 † |
| Gender | 64.12 † | 65.27 † | 65.27 † | 72.52 † | 70.99 † | 71.37 † | 70.99 † |
| Sexual Orientation | 57.14 † | 71.43 † | 72.62 † | 72.62 † | 72.62 † | 83.33 † | 86.9 † |
| Age | 64.37 † | 71.26 † | 64.37 † | 73.56 † | 72.41 † | 72.41 † | 72.41 † |
| Re-train Dataset: for CPS | |||||||
| Bias (CPS) | csps | aul | aula | crr | crra | ||
| Religion | 23.81 † | 25.71 † | 33.33 † | 20.0 † | 12.38 † | 12.38 † | 12.38 † |
| Nationality | 27.04 † | 27.67 † | 33.33 † | 26.42 † | 22.64 † | 16.35 † | 19.5 † |
| Race | 36.63 † | 35.47 † | 42.25 † | 21.12 † | 13.57 † | 12.4 † | 11.82 † |
| Socioeconomic | 26.74 † | 28.49 † | 28.49 † | 21.51 † | 16.86 † | 11.63 † | 11.63 † |
| Disability | 20.0 † | 41.67 † | 38.33 † | 18.33 † | 10.0 † | 5.0 † | 6.67 † |
| Physical Appearance | 23.81 † | 47.62 | 50.79 | 26.98 † | 15.87 † | 19.05 † | 19.05 † |
| Gender | 38.93 † | 37.4 † | 39.69 | 40.46 † | 30.15 † | 25.95 † | 27.86 † |
| Sexual Orientation | 22.62 † | 45.24 † | 47.62 † | 27.38 † | 22.62 † | 14.29 † | 14.29 † |
| Age | 36.78 | 28.74 | 35.63 | 26.44 † | 27.59 † | 14.94 † | 16.09 † |
| MLM: | |||||||
| Re-train Dataset: for CPS | |||||||
| Bias (CPS) | csps | aul | aula | crr | crra | ||
| Religion | 51.43 | 44.76 | 48.57 | 62.86 † | 62.86 † | 77.14 † | 74.29 † |
| Nationality | 66.04 † | 55.97 † | 54.09 † | 76.1 † | 74.21 † | 77.99 † | 77.36 † |
| Race | 59.11 † | 59.69 † | 58.53 † | 78.49 † | 71.32 † | 83.33 † | 81.01 † |
| Socioeconomic | 65.7 † | 69.19 † | 69.19 † | 79.07 † | 67.44 † | 79.65 † | 77.91 † |
| Disability | 56.67 † | 65.0 † | 66.67 † | 71.67 † | 58.33 † | 76.67 † | 73.33 † |
| Physical Appearance | 46.03 † | 76.19 † | 71.43 † | 76.19 † | 71.43 † | 84.13 † | 84.13 † |
| Gender | 65.27 † | 57.63 † | 60.69 † | 66.41 † | 62.98 † | 72.52 † | 71.76 † |
| Sexual Orientation | 60.71 † | 54.76 † | 57.14 † | 82.14 † | 66.67 † | 89.29 † | 89.29 † |
| Age | 57.47 † | 52.87 | 52.87 | 73.56 † | 70.11 † | 90.8 † | 88.51 † |
| Re-train Dataset: for CPS | |||||||
| Bias (CPS) | csps | aul | aula | crr | crra | ||
| Religion | 23.81 † | 31.43 † | 35.24 † | 16.19 † | 12.38 † | 3.81 † | 6.67 † |
| Nationality | 25.79 † | 39.62 † | 39.62 † | 22.01 † | 20.75 † | 13.21 † | 16.98 † |
| Race | 31.78 † | 46.12 † | 47.48 † | 16.47 † | 17.83 † | 13.95 † | 15.31 † |
| Socioeconomic | 30.23 † | 52.33 | 55.23 | 12.79 † | 16.28 † | 12.21 † | 14.53 † |
| Disability | 20.0 † | 53.33 | 51.67 | 20.0 † | 10.0 † | 10.0 † | 13.33 † |
| Physical Appearance | 22.22 † | 63.49 | 61.9 | 17.46 † | 7.94 † | 6.35 † | 6.35 † |
| Gender | 33.21 † | 50.0 | 53.44 | 29.39 † | 24.05 † | 19.85 † | 23.66 † |
| Sexual Orientation | 22.62 † | 48.81 | 47.62 | 14.29 † | 9.52 † | 7.14 † | 8.33 † |
| Age | 32.18 † | 44.83 † | 49.43 † | 20.69 † | 22.99 † | 14.94 † | 18.39 † |
| MLM: | |||||||
| Re-train Dataset: for CPS | |||||||
| Bias (CPS) | csps | aul | aula | crr | crra | ||
| Religion | 61.9 † | 68.57 † | 69.52 † | 75.24 † | 72.38 † | 90.48 † | 87.62 † |
| Nationality | 69.81 † | 61.64 † | 62.89 † | 74.84 † | 84.28 † | 90.57 † | 89.31 † |
| Race | 65.7 † | 62.6 † | 61.05 † | 77.71 † | 69.77 † | 87.21 † | 85.27 † |
| Socioeconomic | 65.12 † | 66.86 † | 63.95 † | 75.0 † | 70.93 † | 85.47 † | 84.3 † |
| Disability | 51.67 | 80.0 † | 73.33 † | 58.33 | 46.67 † | 80.0 † | 73.33 † |
| Physical Appearance | 66.67 † | 68.25 † | 68.25 † | 85.71 † | 71.43 † | 82.54 † | 79.37 † |
| Gender | 69.08 † | 53.82 † | 53.82 † | 68.7 † | 71.37 † | 80.92 † | 81.3 † |
| Sexual Orientation | 58.33 | 63.1 † | 59.52 † | 77.38 † | 52.38 | 83.33 † | 79.76 † |
| Age | 57.47 | 66.67 † | 56.32 † | 75.86 † | 73.56 † | 85.06 † | 85.06 † |
| Re-train Dataset: for CPS | |||||||
| Bias (CPS) | csps | aul | aula | crr | crra | ||
| Religion | 25.71 † | 38.1 † | 40.0 † | 22.86 † | 11.43 † | 11.43 † | 12.38 † |
| Nationality | 27.04 † | 35.85 † | 35.22 † | 20.13 † | 17.61 † | 14.47 † | 15.09 † |
| Race | 34.11 † | 35.66 † | 35.47 † | 17.44 † | 16.09 † | 13.76 † | 12.98 † |
| Socioeconomic | 26.16 † | 49.42 | 44.77 | 19.19 † | 18.6 † | 13.95 † | 13.37 † |
| Disability | 23.33 † | 46.67 | 40.0 | 11.67 † | 6.67 † | 8.33 † | 8.33 † |
| Physical Appearance | 25.4 † | 47.62 | 47.62 | 30.16 | 20.63 † | 12.7 † | 14.29 † |
| Gender | 33.59 † | 41.22 † | 39.69 † | 32.82 † | 26.34 † | 19.47 † | 18.7 † |
| Sexual Orientation | 17.86 † | 47.62 | 42.86 | 14.29 † | 13.1 † | 7.14 † | 7.14 † |
| Age | 24.14 † | 49.43 † | 48.28 † | 24.14 † | 18.39 † | 17.24 † | 19.54 † |
| AA | 34.46 † | 35.81 † | 37.16 † | 14.53 † | 14.19 † | 9.12 † | 8.78 † |