Higher-order and fractional discrete time crystals in Floquet-driven Rydberg atoms
Higher-order and fractional discrete time crystals (DTCs) are exotic phases of matter where the discrete time translation symmetry is broken into higher-order and non-integer category. Generation of these unique DTCs has been widely studied theoretically in different systems. However, no current experimental methods can probe these higher-order and fractional DTCs in any quantum many-body systems. We demonstrate an experimental approach to observe higher-order and fractional DTCs in Floquet-driven Rydberg atomic gases. We have discovered multiple -DTCs with integer values of = 2, 3, and 4, and others ranging up to 14, along with fractional -DTCs with values beyond the integers. The system response can transition between adjacent integer DTCs, during which the fractional DTCs are investigated. Study of higher-order and fractional DTCs expands fundamental knowledge of non-equilibrium dynamics and is promising for discovery of more complex temporal symmetries beyond the single discrete time translation symmetry.
Discovery and exploration of the phenomenon of spontaneous breaking of the discrete time translation symmetry, which results in realization of a counterintuitive phase of matter that was initially proposed by Wilczek [1], have sparked enormous interest in the condensed matter physics field. These elusive structures exhibit recurring patterns over time, thus providing a platform to study the distinctive temporal symmetry breaking in different systems both experimentally and theoretically [2, 3, 4, 5, 6, 7, 8, 9, 10, 11, 12, 13, 14, 15, 16]. In general, time crystals can be divided into discrete and continuous time crystals [17, 18, 19, 20, 21] that exhibit discrete and continuous time-translation symmetry breaking, respectively. In addition, stabilized dissipative time crystals [22] and prethermal discrete time crystals (DTCs) [23, 24] in driven and dissipative systems have been reported. However, the emergent symmetry is not restricted to a single time translation symmetry [20], and the different subharmonics are thus nontrivial and correspond to higher-order integer DTCs and fractional DTCs, which have been widely studied theoretically [25, 26, 27, 28, 29, 30, 31, 32]. Similar to the integer DTC, a fractional DTC is an exotic phase of matter that exhibits time-translation symmetry breaking in the form of fractionalization. In a fractional time crystal, the system’s behavior is repeated periodically, and not only in discrete time steps but also with a fractional multiple of the driving period proposed in the literature [33, 30, 32].
The large dipole moment of the Rydberg atom allows researchers to build a quantum many-body system that can be used to study many-body dynamics and quantum scars [34, 35, 36, 37], non-equilibrium phase transition, and self-organized criticality [38, 39, 40, 41, 42, 43]. In addition, a DTC can be realized based on the emergence of a metastable regime in an open Rydberg atom system [44]. In the open Rydberg atom system, the response of the Rydberg atom population is repeated periodically and breaks ergodicity without periodic driving, thus obeying a limit cycle regime [45, 46] and resulting in a continuous time crystal [47]. These differ from a DTC phase by the use of Floquet driving. Periodic Floquet driving and the long-range interactions between Rydberg atoms will break the system’s equilibrium; the time translation symmetry breaking will thus emerge as a complex process, providing a platform to observe the higher-order and fractional DTCs.
In this work, we experimentally observe higher-order and fractional DTCs in strongly interacting Rydberg atoms under external radio-frequency (RF) field periodic driving conditions. The periodic pulses effectively drive the system out of equilibrium, thus leading to complex subharmonic responses. The response periodicity is an integral multiple of the driving period with [even beyond period doubling]. The higher-order DTCs observed remain rigid with respect to subtle detuning changes. We also observed the phase transition between the second-order DTC (2-DTC) and the third-order DTC (3-DTC). In addition, between adjacent integer higher-order DTCs, the probe transmission can oscillate within a fractional driving period, which means that the system’s response is repeated periodically but is not limited to integer driving periods. The experimental results show good agreement with theoretical predictions. The findings for the higher-order and fractional DTCs realized here could highlight the rich dynamics that can emerge from driven and dissipative systems and open up new avenues for exploration of non-equilibrium physics.
Physical model and experimental diagram
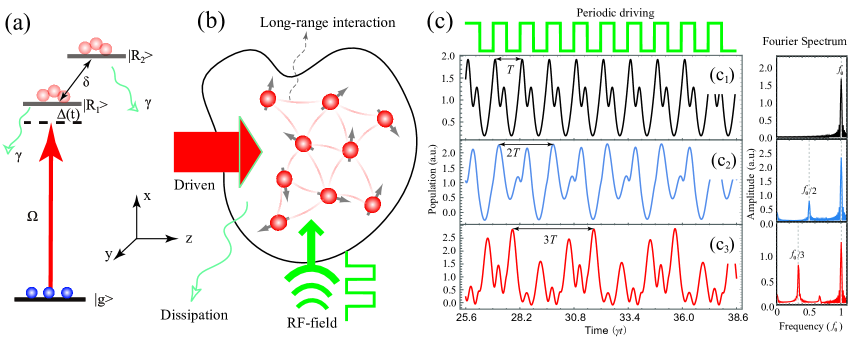
To observe breaking of the time translation symmetry, we constructed an experimental platform that combined a quantum many-body system with periodic Floquet driving. This many-body system includes interacting two-level cesium atoms with a ground state and Rydberg states and (with decay rate ). In the model, we apply square wave modulation to the detuning when , and when . This can be realized by applying the pulsed RF field in further experiments, where represents the detuning of the laser beam and is the RF field-induced shift; further details are provided in Methods section. The lasers drive the atoms along the coordinate direction and the pulsed RF field illuminates the atoms along the direction, as shown in Fig. 1(b).
The Hamiltonian of system is based on periodical double Rydberg state model [47]:
| (1) | ||||
where () represents the -th atom transition between the ground state and the Rydberg state , are the population operators for the two Rydberg energy levels , and , and are the interactions between the Rydberg atoms. The Lindblad jump terms are given by , which represents the decay process from the Rydberg state () to the ground state . Because of the periodic feature of , the Hamiltonian of the system is symmetrical in the discrete time translation, in which = (). Using the mean-field treatment, we calculate the master equation and obtain the matrix elements for and . The subharmonic response of the Rydberg atoms occurs because of the presence of external RF field periodic driving, which is applied to the many-body system. Under specific conditions, the system will enter into distinct stationary states that evolve periodically over a long period of time, and it also exhibits symmetry () that is protected by Floquet driving [20].
Here, we show the simulated results for under the periodic modulation to simplify the explanation of the subharmonic responses, as shown in Fig. 1(c). Figure 1(c1) represents the population without interactions, where the population behaves with a harmonic response to the driving signal. Figure 1(c2) and (c3) show the results obtained when the interaction strength , where the population displays subharmonic responses, showing the response frequencies of and [where is the driving frequency], respectively, as illustrated by the Fourier spectra in the right column of Fig. 1(c). In this process, the periodic driving signal and the interactions between the Rydberg atoms produce the DTCs as a result of time translation symmetry breaking. Additional simulated results for the distinct higher-order and fractional DTCs can be found in the Methods section.
In the experiments, we used an external pulsed RF field to drive the cesium Rydberg atoms. The external RF field with electric field component and a frequency of was modulated to produce a square wave. The RF field perturbs the Rydberg states and induces additional RF sidebands [48], thus shifting the Rydberg energy levels. We applied a three-photon electromagnetically-induced transparency (EIT) scheme to prepare the Rydberg atoms [from the ground state to the Rydberg state using three lasers with wavelengths of 852 nm (probe), 1470 nm, and 780 nm], and measured the Rydberg atom population based on the transmission of the probe field [49, 50].
Higher-order DTCs
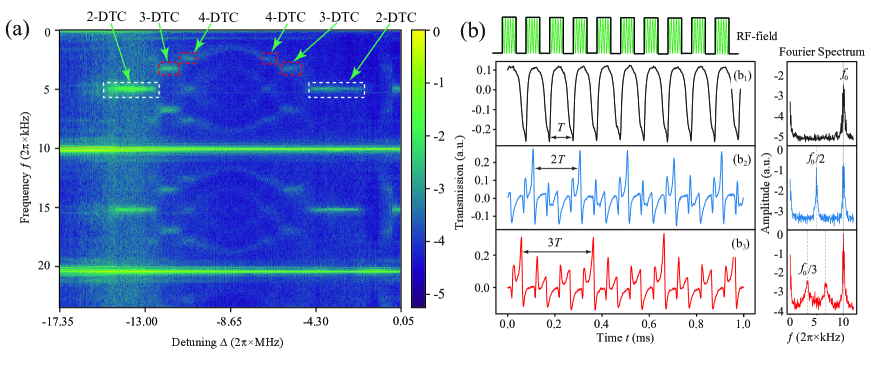
The observed subharmonic responses are unique features of DTCs that result from spontaneous breaking of the discrete time-translation symmetry. To map the full subharmonic responses of the system, we vary the laser detuning and measure the Fourier spectrum under periodic RF field driving with a repetition frequency of kHz (with a period of ), as depicted in Fig. 2(a). When we increased the laser detuning from -17.35 MHz to -0.05 MHz, the system response showed complex non-equilibrium dynamics. In Fig. 2(a), the system’s response shows oscillations with periods that are longer than that of the driving field. During this process, the system shows evolution with not only the doubled period ( symmetry), but also with and , which exhibit and symmetries, respectively [30]. In addition, the higher-order -DTCs with (indicated by the red dotted frame shown in Fig. 2(a)) are robust against the perturbations, as indicated by their stability when the detuning was varied within a small range.
We also recorded the time flows for probe transmission in the no-DTC, 2-DTC, and 3-DTC regimes when varying the laser detuning , as shown in Fig. 2(b). In Fig. 2(b1), the system’s response shows harmonics with the same frequency as the driving RF field, and there are no peaks within the 10 kHz section of the Fourier spectrum. In this case, the system is located far away from the resonance, the interactions between the Rydberg atoms are ignored, and thus the response is normal. However, when we change the system to the 2-DTC regime, in which the probe transmission oscillates with a periodicity of 2 with respect to the driving field [see the blue line in Fig. 2(b2)], the period doubles. This period doubling effect is consistent with theoretical predictions presented in Ref. [44].
We also observed the phases of the higher-order -DTCs with = 3 and 4, where these phases manifested as periodic oscillations with triple and quadruple values of ; the triple of can be found as indicated by the red line in Fig. 2(b3). The Fourier spectra of the oscillations in these scenarios demonstrate the appearance of the fractional peaks for with quantities of 1/2 and 1/3; see the right column in Fig. 2(b). The responses obtained with reveal that the system evolves within the smaller discrete time-translation symmetry subgroup. The higher-order DTCs are a consequence of the interactions between the driven-dissipative many-body system and the periodic driving process; these DTCs results from the non-ergodicity. When is increased further, the -DTC no longer becomes rigid to small changes in , and this results in a melting effect; see the Methods section for further explanation of these results.
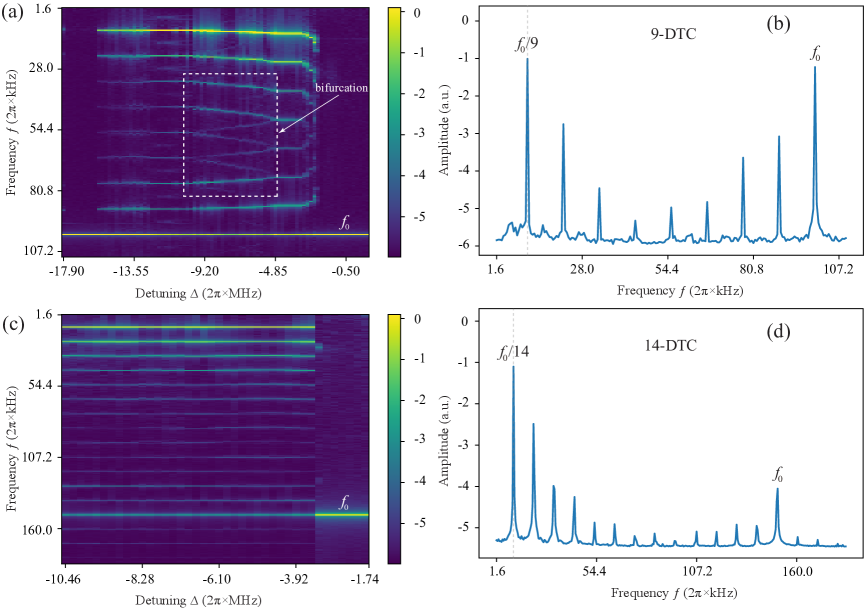
In the system, increasing the driving frequency allowed us to observe the higher- integer DTCs. We increased the frequency to 100 kHz and to 150 kHz, and measured the phase maps of the Fourier spectrum, as shown in Fig. 3(a) and Fig. 3(c), respectively. Here, we selected a special detuning range in which higher- DTCs exist. In Fig. 3(a) and (c), we see comb-type structures in the Fourier spectrum when the -pulsed driving field is applied. These comb lines correspond to the higher frequency orders of -DTCs with = 8 and 9 in Fig. 3(a) and = 14 in Fig. 3(c), and the , , and symmetries arise. Figure3(b) and (d) show the Fourier spectra at MHz and MHz, respectively. In these two figures, we can see that the first peaks occur at frequencies of and , respectively, thus revealing their higher-order subharmonic responses to the driving field. These experimentally observed higher-order -DTCs are consistent with the theoretical predictions presented in Ref. [32].
Transition between distinct DTCs
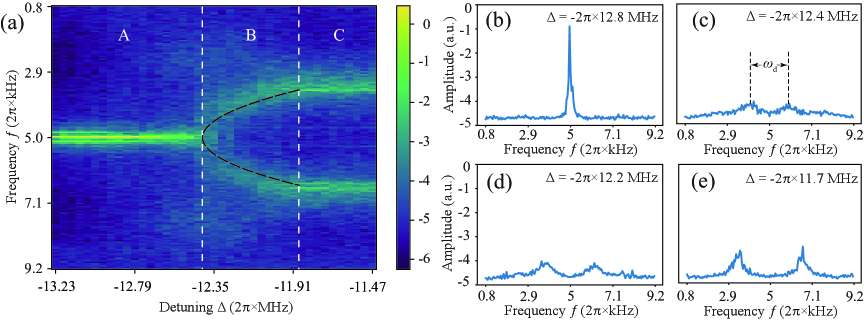
The observed higher-order -DTCs allow us to demonstrate the occurrence of phase transitions between adjacent integer DTCs. These phase transitions are the result of breaking from the time translation symmetry to the symmetry. Figure 4(a) shows the phase diagram of the Fourier spectrum acquired by scanning the laser detuning with high resolution. In Fig. 4(a), we see that there are three regimes [marked A, B, and C], including the 2-DTC regime, the 3-DTC regime, and their transition. We plotted the Fourier spectra for these regimes, as shown in Fig. 4(b)-(e). Figure 4(b) shows a Fourier spectrum at 12.8 MHz, in which there is a single peak that corresponds to the 2-DTC. In Fig. 4(e), the two peaks in the Fourier spectrum show the phase appearance of the 3-DTC.
The broken symmetry is characterized using a nonzero order parameter that is defined as the width between the two peaks , where and are the frequencies corresponding to the two peaks. For the case where MHz in regime A, the width is zero because the symmetry is not broken, and the system response remains stable in the 2-DTC phase. For the case where MHz, the symmetry of the 2-DTC is broken, and the width then becomes nonzero as the two peaks appear at around 5 kHz with a -dependent width; see area B in Fig. 4(a). During the phase transition process, the system response goes through a series of fractional responses with . Therefore, we can map the entire process of breaking from the time translation symmetry to the symmetry. In Fig. 4(c) and (d), we plotted two Fourier spectra at MHz and MHz, respectively, as examples. The measured widths = kHz and = kHz can be found in Fig. 4(c)-(d). These two spectra show that the system is broken into a state with some type of non-integer time translation symmetry. These states are not robust to perturbations and therefore are not rigorous fractional DTCs [32]. When the system is tuned into area C, the system response then shows stability in the 3-DTC phase.
We also characterized the phase transition in regime B using the order parameter
| (2) |
Here, MHz represents the critical point. The onset of the phase transition is characterized by symmetry breaking accompanied by a nonzero order parameter [as indicated by the black dashed line in Fig. 4(a)]. The continuity at indicates that the system undergoes a second-order continuous phase transition. Furthermore, the system transits from the 2-DTC phase to the 4-DTC phase, where this transition is accompanied by the symmetry being broken two times within the detuning range from MHz MHz, as shown in Fig. 2(a).
We also observed the phase transition process from the 8-DTC phase to the 9-DTC phase when tuning the laser detuning parameter . We discovered several bifurcated comb structures, as indicated by the dotted frame shown in Fig. 3(a). In the bifurcation regime, a visible transformation occurs from three comb lines to four comb lines. This bifurcation can also be described using Eq.2, which corresponds to a second-order continuous phase transition.
Fractional DTCs
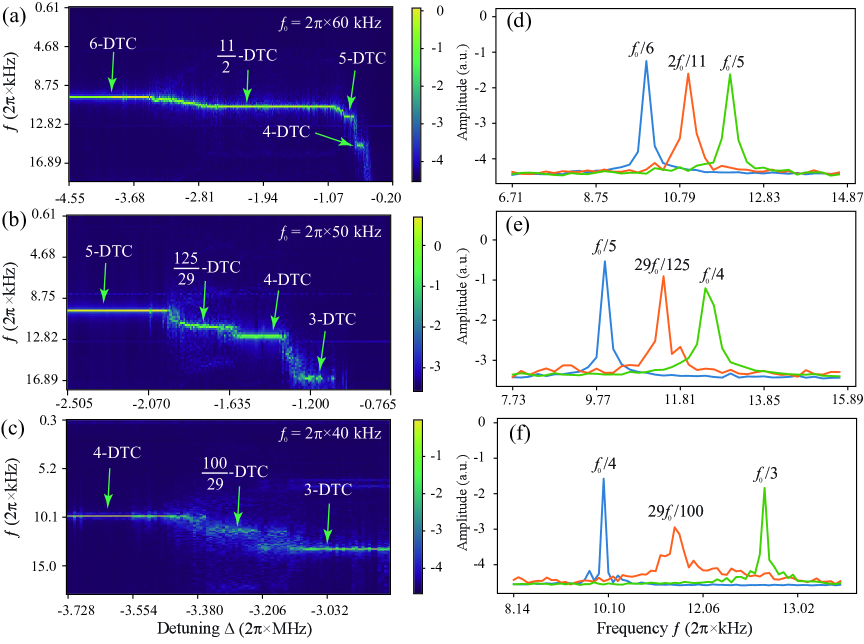
In this experiment, we also observed fractional -DTCs, as predicted in Ref. [32]. These observations of the distinct higher-order -DTCs allow us not only to investigate the phase transition, but also to study the characteristics of the intermediate states. We selected the values of = 240 kHz, = 250 kHz, and = 260 kHz to study the transition between the distinct integer higher-order -DTCs. Figure 5(a), (b), and (c) show the phase maps of the corresponding Fourier spectra, which were measured by scanning the laser detuning . From these results, we can see that frequency peaks occur between the adjacent integer -DTCs, and these peaks remain stable over a certain detuning range . For example, there is a peak between the 6-DTC and the 5-DTC, as shown in Fig. 5(a), and similar results can be seen in Fig. 5(b) and (c). These exotic peaks correspond to the fractional -DTCs, with = , where and are coprime integers. Figure 5(d)-(f) show the corresponding Fourier spectra of the fractional DTCs. In addition to the adjacent integer -DTCs, fractional -DTCs with = 11/2, 125/29, and 100/29 were observed; see the orange lines in Fig. 5(d)-(f).
The observed fractional -DTCs come from the process of symmetry breaking from high symmetry into fractional symmetry. In a fractional DTC, the oscillations of the system response occur at fractional time intervals. This means that the oscillation period is a fraction of the time interval of the driving field, thus causing the DTC to exhibit fractional time translation symmetry. The observed fractional DTCs are robust with respect to the subtle variations in . This robustness is due to the emergence of the protected fractional symmetry created by a combination of many-body interactions and Floquet driving. This makes the fractional DTCs resistant to perturbations and ensures that they preserve their time-keeping behavior, and thus confirms the results of investigations of stable fractional DTCs presented in Ref. [32].
In the experiments, it was not easy to observe the fractional DTCs between 2-DTC and 3-DTC because we can only see a smooth gradient in Fig. 4(a). Because the rigid range of the fractional DTCs between 2-DTC and 3-DTC is relatively small, it is difficult to see a stable fractional DTC within the limited stability range of the system. However, the fractional DTCs between the -DTCs with high integer values of are more stable than those with relatively lower values; as a result, we can observe a fractional DTC between = 5 and that is more stable than that observed between = 3 and [see Fig. 5(a) and Fig. 5(c)].
Discussion
In the system, for lower values of , the observed integer -DTC ( = 2 4) remained stable against the subtle perturbations caused by detuning [which induces fluctuations in the Rydberg atom population]. As shown in Fig. 2(a), the detuning interval for the appearance of the 2-DTC is larger than that for both the 3-DTC and 4-DTC. In our system, the emergence of the discrete time translation symmetry occurs over a limited frequency range, and it is fragile at both lower and higher oscillation frequencies with respective to the driving frequency. We cannot locate visible stability within any detuning range for higher-order -DTCs with at kHz. However, higher integer -DTCs with can be found more easily at higher values of . The observed higher-order integer -DTCs may have potential applications in quantum information science and technology because these DTCs provide a method to establish a versatile bridge for a frequency transducer from high frequency to low frequency.
Summary
In summary, we have presented an experimental observation of higher-order and fractional DTCs in a periodic Floquet-driven Rydberg atomic gas. The interplay between the driving field and the interactions between the Rydberg atoms leads to the emergence of rich time translation symmetry breaking. Phase transitions between the adjacent integer DTCs were observed, where the discrete time translation symmetry of the system acts as a further breakage, displaying a full dynamics of symmetry breaking. These experimental results confirm previous theoretical predictions [33, 25, 26, 27, 28, 31, 32]. Investigation of the higher-order and fractional DTCs in the Rydberg atom system promotes the theory of the DTCs, and opens new avenues for exploration of the rich landscape of time translation symmetry breaking in driven quantum systems.
References
- Wilczek [2012] F. Wilczek, Quantum time crystals, Physical review letters 109, 160401 (2012).
- Zhang et al. [2017] J. Zhang, P. W. Hess, A. Kyprianidis, P. Becker, A. Lee, J. Smith, G. Pagano, I.-D. Potirniche, A. C. Potter, A. Vishwanath, et al., Observation of a discrete time crystal, Nature 543, 217 (2017).
- Choi et al. [2017] S. Choi, J. Choi, R. Landig, G. Kucsko, H. Zhou, J. Isoya, F. Jelezko, S. Onoda, H. Sumiya, V. Khemani, et al., Observation of discrete time-crystalline order in a disordered dipolar many-body system, Nature 543, 221 (2017).
- Watanabe and Oshikawa [2015] H. Watanabe and M. Oshikawa, Absence of quantum time crystals, Physical review letters 114, 251603 (2015).
- Syrwid et al. [2017] A. Syrwid, J. Zakrzewski, and K. Sacha, Time crystal behavior of excited eigenstates, Physical Review Letters 119, 250602 (2017).
- Huang et al. [2018] B. Huang, Y.-H. Wu, and W. V. Liu, Clean floquet time crystals: models and realizations in cold atoms, Physical review letters 120, 110603 (2018).
- Gong et al. [2018] Z. Gong, R. Hamazaki, and M. Ueda, Discrete time-crystalline order in cavity and circuit qed systems, Physical review letters 120, 040404 (2018).
- Yao et al. [2020] N. Y. Yao, C. Nayak, L. Balents, and M. P. Zaletel, Classical discrete time crystals, Nature Physics 16, 438 (2020).
- Li et al. [2012] T. Li, Z.-X. Gong, Z.-Q. Yin, H. Quan, X. Yin, P. Zhang, L.-M. Duan, and X. Zhang, Space-time crystals of trapped ions, Physical review letters 109, 163001 (2012).
- Else et al. [2016] D. V. Else, B. Bauer, and C. Nayak, Floquet time crystals, Physical review letters 117, 090402 (2016).
- Sacha [2015] K. Sacha, Modeling spontaneous breaking of time-translation symmetry, Phys. Rev. A 91, 033617 (2015).
- Autti et al. [2018] S. Autti, V. Eltsov, and G. Volovik, Observation of a time quasicrystal and its transition to a superfluid time crystal, Physical review letters 120, 215301 (2018).
- Smits et al. [2018] J. Smits, L. Liao, H. Stoof, and P. van der Straten, Observation of a space-time crystal in a superfluid quantum gas, Physical review letters 121, 185301 (2018).
- Pizzi et al. [2021a] A. Pizzi, A. Nunnenkamp, and J. Knolle, Bistability and time crystals in long-ranged directed percolation, Nature communications 12, 1061 (2021a).
- Autti et al. [2021] S. Autti, P. J. Heikkinen, J. T. Mäkinen, G. E. Volovik, V. V. Zavjalov, and V. B. Eltsov, Ac josephson effect between two superfluid time crystals, Nature Materials 20, 171 (2021).
- Träger et al. [2021] N. Träger, P. Gruszecki, F. Lisiecki, F. Groß, J. Förster, M. Weigand, H. Głowiński, P. Kuświk, J. Dubowik, G. Schütz, et al., Real-space observation of magnon interaction with driven space-time crystals, Physical Review Letters 126, 057201 (2021).
- Sacha and Zakrzewski [2017] K. Sacha and J. Zakrzewski, Time crystals: a review, Reports on Progress in Physics 81, 016401 (2017).
- Else et al. [2020] D. V. Else, C. Monroe, C. Nayak, and N. Y. Yao, Discrete time crystals, Annual Review of Condensed Matter Physics 11, 467 (2020).
- Kongkhambut et al. [2022] P. Kongkhambut, J. Skulte, L. Mathey, J. G. Cosme, A. Hemmerich, and H. Keßler, Observation of a continuous time crystal, Science 377, 670 (2022).
- Zaletel et al. [2023] M. P. Zaletel, M. Lukin, C. Monroe, C. Nayak, F. Wilczek, and N. Y. Yao, Colloquium: Quantum and classical discrete time crystals, Reviews of Modern Physics 95, 031001 (2023).
- Sacha [2020] K. Sacha, Time Crystals, Springer Series on Atomic, Optical, and Plasma Physics (Springer International Publishing, 2020).
- Keßler et al. [2021] H. Keßler, P. Kongkhambut, C. Georges, L. Mathey, J. G. Cosme, and A. Hemmerich, Observation of a dissipative time crystal, Physical Review Letters 127, 043602 (2021).
- Vu and Sarma [2023] D. Vu and S. D. Sarma, Dissipative prethermal discrete time crystal, Physical Review Letters 130, 130401 (2023).
- Kyprianidis et al. [2021] A. Kyprianidis, F. Machado, W. Morong, P. Becker, K. S. Collins, D. V. Else, L. Feng, P. W. Hess, C. Nayak, G. Pagano, et al., Observation of a prethermal discrete time crystal, Science 372, 1192 (2021).
- Giergiel et al. [2018] K. Giergiel, A. Kosior, P. Hannaford, and K. Sacha, Time crystals: analysis of experimental conditions, Physical Review A 98, 013613 (2018).
- Giergiel et al. [2019] K. Giergiel, A. Kuroś, and K. Sacha, Discrete time quasicrystals, Physical Review B 99, 220303 (2019).
- Surace et al. [2019] F. M. Surace, A. Russomanno, M. Dalmonte, A. Silva, R. Fazio, and F. Iemini, Floquet time crystals in clock models, Physical Review B 99, 104303 (2019).
- Pizzi et al. [2019] A. Pizzi, J. Knolle, and A. Nunnenkamp, Period-n discrete time crystals and quasicrystals with ultracold bosons, Physical review letters 123, 150601 (2019).
- Ye et al. [2021] B. Ye, F. Machado, and N. Y. Yao, Floquet phases of matter via classical prethermalization, Phys. Rev. Lett. 127, 140603 (2021).
- Pizzi et al. [2021b] A. Pizzi, A. Nunnenkamp, and J. Knolle, Classical prethermal phases of matter, Physical Review Letters 127, 140602 (2021b).
- Kelly et al. [2021] S. P. Kelly, E. Timmermans, J. Marino, and S.-W. Tsai, Stroboscopic aliasing in long-range interacting quantum systems, SciPost Physics Core 4, 021 (2021).
- Pizzi et al. [2021c] A. Pizzi, J. Knolle, and A. Nunnenkamp, Higher-order and fractional discrete time crystals in clean long-range interacting systems, Nature communications 12, 2341 (2021c).
- Matus and Sacha [2019] P. Matus and K. Sacha, Fractional time crystals, Physical Review A 99, 033626 (2019).
- Bernien et al. [2017] H. Bernien, S. Schwartz, A. Keesling, H. Levine, A. Omran, H. Pichler, S. Choi, A. S. Zibrov, M. Endres, M. Greiner, et al., Probing many-body dynamics on a 51-atom quantum simulator, Nature 551, 579 (2017).
- Keesling et al. [2019] A. Keesling, A. Omran, H. Levine, H. Bernien, H. Pichler, S. Choi, R. Samajdar, S. Schwartz, P. Silvi, S. Sachdev, et al., Quantum kibble–zurek mechanism and critical dynamics on a programmable Rydberg simulator, Nature 568, 207 (2019).
- Serbyn et al. [2021] M. Serbyn, D. A. Abanin, and Z. Papić, Quantum many-body scars and weak breaking of ergodicity, Nat. Phys. 17, 675 (2021).
- Bluvstein et al. [2021] D. Bluvstein, A. Omran, H. Levine, A. Keesling, G. Semeghini, S. Ebadi, T. T. Wang, A. A. Michailidis, N. Maskara, W. W. Ho, S. Choi, M. Serbyn, M. Greiner, V. Vuletić, and M. D. Lukin, Controlling quantum many-body dynamics in driven Rydberg atom arrays, Science 371, 1355 (2021).
- Lee et al. [2012] T. E. Lee, H. Haeffner, and M. Cross, Collective quantum jumps of Rydberg atoms, Phys. Rev. Lett. 108, 023602 (2012).
- Carr et al. [2013] C. Carr, R. Ritter, C. Wade, C. S. Adams, and K. J. Weatherill, Nonequilibrium phase transition in a dilute Rydberg ensemble, Phys. Rev. Lett. 111, 113901 (2013).
- Ding et al. [2020] D.-S. Ding, H. Busche, B.-S. Shi, G.-C. Guo, and C. S. Adams, Phase diagram of non-equilibrium phase transition in a strongly-interacting Rydberg atom vapour, Phys. Rev. X 10, 021023 (2020).
- Helmrich et al. [2020] S. Helmrich, A. Arias, G. Lochead, T. Wintermantel, M. Buchhold, S. Diehl, and S. Whitlock, Signatures of self-organized criticality in an ultracold atomic gas, Nature 577, 481 (2020).
- Klocke et al. [2021] K. Klocke, T. Wintermantel, G. Lochead, S. Whitlock, and M. Buchhold, Hydrodynamic stabilization of self-organized criticality in a driven Rydberg gas, Physical Review Letters 126, 123401 (2021).
- Ding et al. [2022] D.-S. Ding, Z.-K. Liu, B.-S. Shi, G.-C. Guo, K. Mølmer, and C. S. Adams, Enhanced metrology at the critical point of a many-body Rydberg atomic system, Nature Physics 18, 1447 (2022).
- Gambetta et al. [2019] F. Gambetta, F. Carollo, M. Marcuzzi, J. Garrahan, and I. Lesanovsky, Discrete time crystals in the absence of manifest symmetries or disorder in open quantum systems, Physical review letters 122, 015701 (2019).
- Ding et al. [2023] D.-S. Ding, Z. Bai, Z.-K. Liu, B.-S. Shi, G.-C. Guo, W. Li, and C. S. Adams, Ergodicity breaking from Rydberg clusters in a driven-dissipative many-body system, arXiv preprint arXiv:2305.07032 (2023).
- Wadenpfuhl and Adams [2023] K. Wadenpfuhl and C. S. Adams, Emergence of synchronization in a driven-dissipative hot rydberg vapor, Phys. Rev. Lett. 131, 143002 (2023).
- Wu et al. [2023] X. Wu, Z. Wang, F. Yang, R. Gao, C. Liang, M. K. Tey, X. Li, T. Pohl, and L. You, Observation of a dissipative time crystal in a strongly interacting Rydberg gas, arXiv preprint arXiv:2305.20070 (2023).
- Miller et al. [2016] S. A. Miller, D. A. Anderson, and G. Raithel, Radio-frequency-modulated rydberg states in a vapor cell, New Journal of Physics 18, 053017 (2016).
- Zhang et al. [2022] L.-H. Zhang, Z.-K. Liu, B. Liu, Z.-Y. Zhang, G.-C. Guo, D.-S. Ding, and B.-S. Shi, Rydberg microwave-frequency-comb spectrometer, Phys. Rev. Applied 18, 014033 (2022).
- Liu et al. [2022] B. Liu, L.-H. Zhang, Z.-K. Liu, Z.-Y. Zhang, Z.-H. Zhu, W. Gao, G.-C. Guo, D.-S. Ding, and B.-S. Shi, Highly sensitive measurement of a megahertz rf electric field with a Rydberg-atom sensor, Phys. Rev. Applied 18, 014045 (2022).
METHODS
Quantum Master Equation
The dynamics of the atoms from the ground state to the Rydberg state can be simplified into an effective two-level model. We consider a many-body system that contains two-level atoms, where the atoms are driven by an effective Rabi frequency. Additionally, we introduce two Rydberg energy levels, and , where the state is coupled with the ground state with an effective Rabi frequency and a detuning of , and the state is coupled with an effective Rabi frequency and a detuning of . The two Rydberg states, and , can be sublevels of the Rydberg state. The atoms in these Rydberg states, which are located in and , can interact strongly through the van der Waals interaction . We consider application of Floquet driving to detuning through a pulsed RF field, and therefore the detuning process is time-dependent and satisfies the following form:
| (3) |
The Hamiltonian of the many-body system reads ():
| (4) | ||||
where () is the atomic transition operator, and () is the projection operator for the Rydberg states. When the decay of Rydberg states is included, the evolution of the system density matrix is governed by the Lindblad master equation:
where and () is the jump operator. This master equation, which includes the driven and dissipation system, many-body interactions, and Floquet driving, provides a way to determine the appearance of the non-equilibrium dynamics and the emergence of time translation symmetry breaking.
Mean field approximation
Because the number of Rydberg atoms in our experimental system is high and because of the thermal motion of the atoms, we can ignore the correlations between the atoms. Simultaneously, the interactions between the atoms can be treated using the mean-field approximation, and the many-body density matrix is decoupled into the tensor products of individual matrices. The mean field approximation is a valid option for dealing with the DTCs [26]. In the mean field method, the mean values of the elements of the system density matrix are governed by the following equations of motion:
| (5) | ||||
where is the mean field shift, and we set the effective Rabi frequency here. By solving the equations above, we can obtain the time response of the system and can also obtain the Fourier spectrum via discrete Fourier transformation. We look for the types of stationary state that evolve periodically over a long time period, and the evolution exhibits symmetry (), where can be both an integer and a fraction; the results are presented in the following.
Integer DTCs: 2-DTC, higher-order DTCs
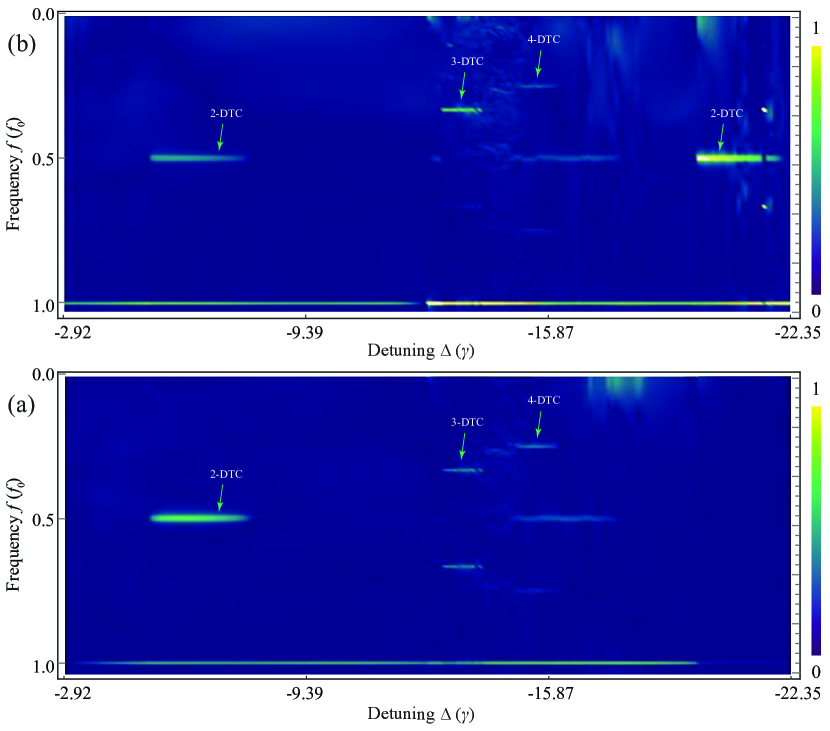
By varying the parameters, the system can be tuned into the DTC regime in which the response of the Rydberg atom population is subharmonic to the driving frequency. By scanning the detuning from -2.92 to -22.35, we plotted the phase map of the Fourier spectrum of the Rydberg atom populations and ; the results are shown in Fig. 6(a) and Fig. 6(b), respectively. There are subharmonic peaks in the Fourier spectrum, we find that both Rydberg atom populations, i.e., and , go through the stable phases from 2-DTC to 4-DTC [exhibiting to symmetry]. The -DTCs with (i.e., beyond period doubling) are called the higher-order DTCs. The results of these investigations of the higher-order DTCs are consistent with those of previous studies [30, 32].
Bifurcation of 2-DTC and fractional DTCs
Furthermore, we set the system into the bifurcation regime by changing the parameters , , and , and then recording the response of the Rydberg atom population . The calculated results are presented in Fig. 7(a), which shows the phase diagram of the Fourier spectrum of . When is increased from -7.04 to -9.36, the response is normally harmonic with respect to the driving frequency in the harmonic regime. By increasing further, the response becomes subharmonic to the driving frequency, as indicated by the series of bright lines within the range in the phase diagram. In the subharmonic regime, we can observe numerous stationary oscillation states, which are manifested as frequency peaks of -DTC, the higher-order 4-DTC, and a series of fractional DTCs.
When the system changes state between the distinct integer DTCs, this change is accompanied by discrete time translation symmetry breaking, and a fractional time translation symmetry then appears. This can be seen in Fig. 7(a), in which the response for goes through the phase of 2-DTC and its bifurcation into a series of stable fraction DTCs in the subharmonic regime. In this scenario, the discrete time translation symmetry of the phase of the 2-DTC is broken into numerous fractional symmetries [see the visible fractional -DTCs with = 2.25, 2.36, and 2.42 in Fig. 7(a)]. These theoretical results are consistent with previously reported theories [33, 32].
RF-field induced shift
When the frequency of the applied RF electric field is lower than 10 MHz, the interaction between the RF electric field and the Rydberg atoms is nonresonant, and this condition results in an energy shift. For an RF field of with frequency , the energy shift is , where is the polarizability of the Rydberg states. We consider the time-averaged value of the energy shift and if we ignore the rapid oscillations of the RF electric field, we can then obtain:
| (6) |
This energy shift causes an increase in the detuning between the Rydberg energy level and the ground state. Therefore, when an external RF electric field is applied, the detuning will turn into .
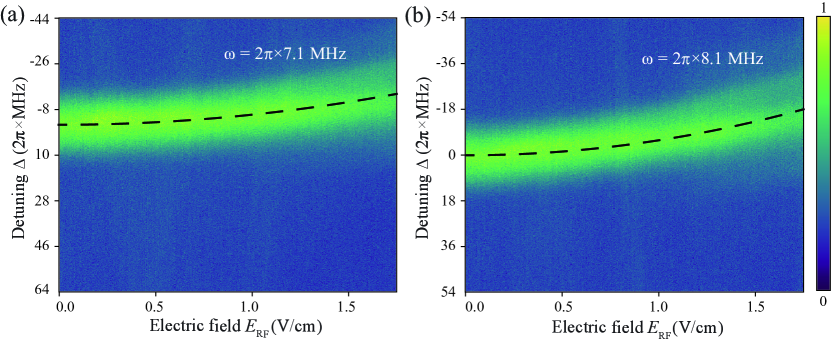
In the experiment, we scanned the electric field strength within the range from V/cm and obtained the three-photon electromagnetically-induced transparency (EIT) spectrum of the system, as shown in Fig. 8. The EIT spectral peak shifts gradually with increasing applied electric field strength. The dashed black line is the fitting function, which shows that the shift in the peak EIT satisfies a square relationship with the electric field strength, as calculated theoretically.
Melting effect of 4-DTC
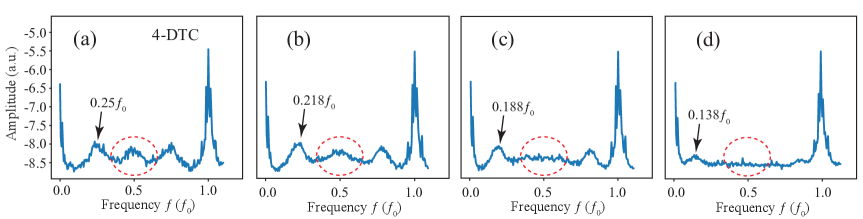
In the experiment, we observed a gradual disappearance of the higher-order DTCs at a small driving frequency , e.g., 10 kHz. For the results shown in Fig. 2(a) in the main text, when the detuning MHz, the system breaks the short-range temporal order into a long-range temporal order as the frequency of the first peak decreases. In Fig. 9(a)-(d), we can see that the first peak frequency decreases from 0.25 to 0.138 because the range of the temporal order becomes longer. The states in these longer-range temporal orders are not immune to the increase in [see also Fig. 2(a) in the main text], and thus this change does not result in robust DTCs.
In addition, the shorter-range temporal order is lost, as shown by the reduced magnitude of the second peak [indicated by the red dashed circles in Fig. 9(a-d)]. In Fig. 9(c), there are no peaks within the frequency range from 2.5 kHz 7.5 kHz, and this corresponds to the destruction of the temporal orderliness. These gradually disappearing parts of the subharmonic response to periodic driving are regarded as the signature of the melting of the DTC order [20]. In addition, the temporal orderliness is retrieved when the detuning is increased further [see Fig. 2(a) in main text]; in this scenario, the orderliness of the 4-DTC is reproduced. This process somehow shows the process of melting and solidification of the 4-DTC.
Acknowledgements
D.-S.D. thanks for the previous discussions with Prof. Igor Lesanovsky and Prof. C. Stuart Adams on time crystals. We acknowledge funding from the National Key R and D Program of China (Grant No. 2022YFA1404002), the National Natural Science Foundation of China (Grant Nos. U20A20218, 61525504, and 61435011), the Anhui Initiative in Quantum Information Technologies (Grant No. AHY020200), and the Major Science and Technology Projects in Anhui Province (Grant No. 202203a13010001).
Author contributions statement
D.-S.D. conceived the idea for the study. B.L. conducted the physical experiments and developed the theoretical model. The manuscript was written by D.-S.D and B.L. The research was supervised by D.-S.D. All authors contributed to discussions regarding the results and the analysis contained in the manuscript.
Competing interests
The authors declare no competing interests.