Universal equation describes the shape of air bubbles trapped in ice
Abstract
Water usually contains dissolved gases, and because freezing is a purifying process these gases must be expelled for ice to form. Bubbles appear at the freezing front and are trapped into ice, making pores. These pores come in a range of sizes from microns to millimeters and their shapes are peculiar; never spherical but elongated, and usually fore-aft asymmetric. We show that these remarkable shapes result of a delicate balance between freezing, capillarity and mass diffusion. A highly non-linear ordinary differential equation suffices to describe the bubbles, with only two non-dimensional parameters representing the supersaturation and the freezing rate. Our experiments provide us with a large variety of pictures of bubble shapes. We show that all of them have their rounded tip well described by an asymptotic regime of the differential equation, and that most of them can have their full shape quantitatively matched by a full solution. This enables the measurement of the freezing conditions of ice samples, and the design of freeze-cast porous materials. Furthermore, the equation exhibits a bifurcation that explains why some bubbles grow indefinitely and make long cylindrical “ice worms”.
Introduction
Ice frozen from water containing dissolved air is usually not clear but opaque, because it includes many bubbles [1]. This is commonly observable in ice cubes from a freezer. These bubbles have peculiar shapes, never spherical but elongated (Fig. 1). Some even reach lengths of several centimeters [2] – they are named “ice worms” [3] or “worm bubbles” [4]. Gases are highly soluble in liquid water but not in ice, so that when water freezes the dissolved gases are expelled and concentrate in the liquid [5]. Bubbles eventually nucleate near the freezing front and are captured by ice, while at the same time they keep growing by diffusion of the gas. Ice thus formed is porous. Generally one speaks of bubbles in water and pores in ice.
In the environment, porous ice is the rule rather than the exception. Hailstones [6] and lake ice [4, 7] contain pores made out of the dissolved air. Glacier ice is also porous but is made out of compacted snow not frozen gas-laden water [8]. In winter, sap freezes inside plants and after the thaw bubbles thereby formed may prevent the flow of sap (winter embolism) [9]. Generally, freeze-thaw cycles can dramatically affect the stability of complex media, like food [10], and the survival of living organism [11, 12].
Apart from water, gases are soluble in a large variety of liquids which freezing turns into porous materials; this includes metals [13], silica [14] and sapphire [15, 16]. Porosity is usually a defect of which to get rid [17, 18]. However, for certain applications porosity is desired and therefore the size and shape of the pores must be controlled [19]. More generally, the freezing of solutions of gases or other solutes makes various freeze-cast materials [20, 21, 22], some of which are biocompatible [23]. In the freezing of a suspension or of an emulsion, the dispersed particles may or may not be engulfed in ice, depending on the freezing rate [24]. Their engulfment deforms the freezing front [25], according to their thermal properties [26]. The particles themselves may deform when they are captured; for example oil droplets in an emulsion make pointy oil drops in ice [27, 28].
Several attempts at describing the growth and entrapment of gas bubbles have been made, either using scaling laws [29], or taking into account the numerous mechanisms at play (heat transfer, phase change, capillarity, mass diffusion, nucleation) [30, 5, 31]. Freezing and capillarity make a challenging combination. For example, a sessile drop freezing will grow a tip [32, 33, 34, 35]. Ice is actually not perfectly hydrophilic, so that water may retract on ice instead of spreading [36, 37, 38].
In this paper, we investigate the shape of the pores formed during the freezing of ice, and how it is set by the growth history of bubbles. We show that under certain conditions, this problem reduces to a single non-linear ordinary differential equation, which we study analytically. Two asymptotic regimes are found, one corresponding to fast freezing and the other to the closing of the bubble. Under a certain freezing velocity the system undergoes a bifurcation, after which bubbles may be stable instead of closing; this explains how worm bubbles appear and what their equilibrium radius is. Our equation can also be solved numerically, and its solutions matched to the shapes of pores obtained experimentally by freezing deionized water at various freezing rates. In most cases a quantitative agreement is found between the solution and the experiments.
Experiments
Much work having already been dedicated to describing the pores in ice [6, 30, 2, 5, 39, 31, 29], the main purpose of our experiments is to provide a basis of comparison with our model, as well as a qualitative description for the reader to better understand the problem and the assumptions of the model.
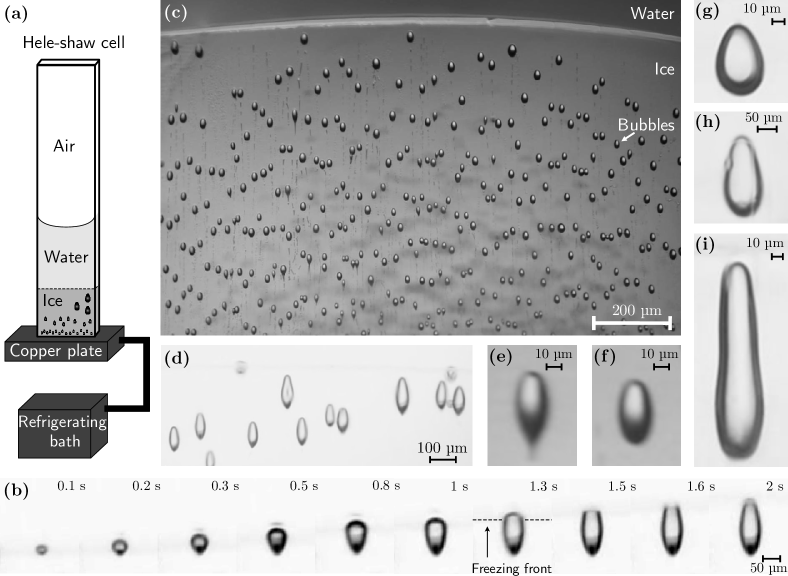
We study the freezing of water, in which air is naturally dissolved, in a Hele-Shaw cell for freezing rates varying between 12 and 263 (Fig. 1a, and Materials and Methods). Figure 1(b) reports the formation of a pore at a freezing rate of . First, a bubble nucleates at the freezing front. Then, it grows by diffusion of dissolved gas into it, while the freezing front keeps advancing. The bubble expands radially up to a maximum after which it shrinks. Eventually, the freezing front passes by and the pore closes; its final shape is set. For the case shown in Figure 1(b), the whole process takes about 2 s, and the final bubble is 154-long and 64-wide.
The pores in ice are never spherical, but elongated in the direction of freezing. Their number also varies with the freezing rate. At a high freezing rate (Fig. 1c, 133 on average), many small pores, slightly elongated, are formed. Conversely, at a slower freezing rate (Fig. 1d, 46), fewer pores are formed, and they are bigger and longer.
The place of nucleation of the bubble and the time elapsed before it is trapped may also influence greatly its final shape. For fast freezing (about 90) the bubble may (Fig. 1e) or may not (Fig. 1f) show a “tail”. This likely corresponds to whether or not the bubble was trapped by a single ice crystal or at the junction of two crystals. In the latter case, the initial growth of the bubble is restrained between two crystals, and this gives it the tail.
Although heterogeneous nucleation at the freezing front is possible, we observe some cases in which the nucleation is definitely homogeneous (Fig. 1g-h and the corresponding videos). For slow freezing, the distance between the nucleation point and the freezing front matters greatly because it sets the time span during which the bubble may grow before being trapped. For instance, the pores shown in Fig. 1(g) and (h) grew and froze under the same freezing rate of 20, however their shapes are different. The former is 53-long and 36-wide, whereas the latter is 200-long and 96-wide; its aspect ratio is larger. The difference is that the corresponding bubbles nucleated 35 away from the freezing front (Fig. 1g), and 100 away from it (Fig. 1h). The latter had about 3 s more to grow freely, and that eventually yielded a different shape, not only a different size. This observation reveals the strong dependence of the bubble shape on the initial bubble size.
Although our experimental setup is well adapted to studying fast freezing rates, akin to the rapid quenching of melts, it is less adapted to slow freezing rates. We could not maintain freezing rates slower than 12 with sufficient stability, and therefore could not observe centimeter-long ice worms [2]. Figure (1i) shows the pore most similar to an ice worm that we could observe with our setup.
The nucleation of gas bubbles in water is a quite complex matter because of the chemistry it involves [40]. In the following, we shall focus on the growth of the bubble at the freezing front, after the nucleation and the trapping. As we shall show, the growth can be well described by a single ordinary differential equation. Nucleation and entrapment will appear as initial conditions.
The Frozen Bubble Equation
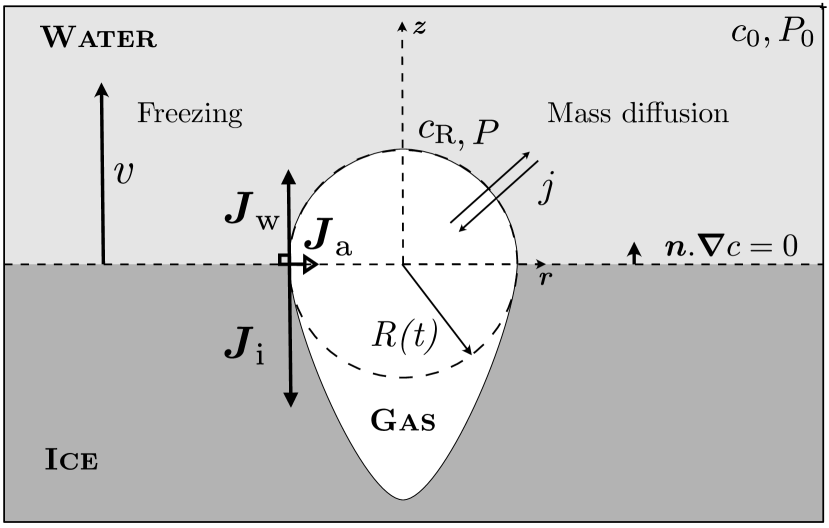
Our model is based on the conservation of the mass of gas. For simplicity, we treat air as a simple gas and average its properties over that of nitrogen and oxygen (Material and Methods). During its growth, the bubble can be separated into two parts: a lower part, the pore, that is trapped in the ice, and an upper part, the bubble per se, that is in contact with the liquid water (see Fig. 2). As water freezes, gas is virtually transferred from the bubble to the pore. In the meantime, gas may be exchanged between the bubble and the surrounding water. The direction and magnitude of this mass transfer depends on the Laplace pressure, hence on the curvature of the bubble.
The shape of the ice-water interface results of the balance between latent heat and the heat fluxes on either side. At the contact line between air, water and ice, this is written:
| (1) |
where is the heat flux coming from the interface into the ice (i), water (w) and air (a), respectively, is the density of ice, is the latent heat of freezing and is the freezing rate. The vector equation (1) is usually named the Stefan condition [41]. Since the heat capacity and the density of air are negligible compared to those of ice and water, we may neglect . Therefore, according to Eq. (1) must be tangent to the bubble, and the freezing front orthogonal to the bubble. The contact angle of the bubble on the ice is then close to 90∘. Since the bubble is much smaller than the capillary length (2.7 mm for water), the liquid-gas interface has a uniform curvature; it is a spherical cap. In summary, heat transfer and capillarity impose that the upper part of the bubble be a hemisphere. Let be its radius.
The bubble grows out of the gas-saturated water by mass transfer. The corresponding mass flux can be expressed in a closed form by solving the diffusion equation in the half-space bounded by a plane upon which sits a hemisphere. Although gas is released into the liquid at the freezing front, it is convenient to neglect this contribution. This amounts to considering that the accumulation of gas at the front is slow compared to the growth of the bubbles. Under this hypothesis the boundary condition on the plane is that of zero normal flux, which gives a problem identical to the diffusion around a spherical bubble in the full space. In spherical coordinates this is written
| (2) | |||
| (3) | |||
| (4) | |||
| (5) |
where and denote the boundary conditions at infinity and at the bubble interface, respectively, and where the diffusion coefficient of air in water [42]. This problem was solved by Epstein and Plesset [43], and they obtained a closed form for the surface density of mass flux through the air-water interface:
| (6) |
The origin of times corresponds to when diffusion starts, that is when the bubble nucleates.
Far from the bubble, water is at ambient pressure , and air is in excess by a quantity with respect to the solubility: . Hydrostatic pressure is negligible given the height of the water column (a few centimeters) above the bubble. The solubility of gases in water depends linearly on pressure through Henry’s law: . The constant for air is , as calculated from the solubility of nitrogen and oxygen [42]. At the air-water interface, the Laplace pressure leads to an increase of the solubility: . is the surface tension of water at . Therefore, the concentration gap between the interface and the surrounding water is
| (7) |
We can now write the conservation of the mass in the upper part of the bubble:
| (8) |
is the density of air. Substituting the expression of the flux density (Eq. 6 and 7) into the mass balance, and introducing we obtain
| (9) |
Let us define so that
| (10) |
then is a parametric curve that describes the shape of the pore.
A direct consequence of Eq. 9 is that the bubble can only grow if . This observation reveals the physical meaning of : it is the critical radius a bubble must have to be stable against dissolution under Laplace pressure. Therefore, even if the water around the bubble is supersaturated with gas, the bubble may still dissolve if it is too small. The condition is nevertheless not sufficient to maintain stability, because freezing contributes negatively to .
In the rest of the paper, we shall restrict ourselves to the case of constant freezing rate (). Not only does this simplify greatly the analysis, it also corresponds to our experimental situation. Therefore, Eq. (10) becomes trivial and its solution can be combined with Eq. (9) to reduce the problem to a single non-linear ordinary differential equation. We write this equation in non-dimensional form by taking as unit length and as unit time:
| (11) |
We refer to Eq. (11) as the Frozen Bubble Equation. It has two non-dimensional parameters: is the non-dimensional supersaturation, and is the ratio of the characteristic times of freezing and mass diffusion. In the following, we denote .
Analysis
The fast freezing regime ()
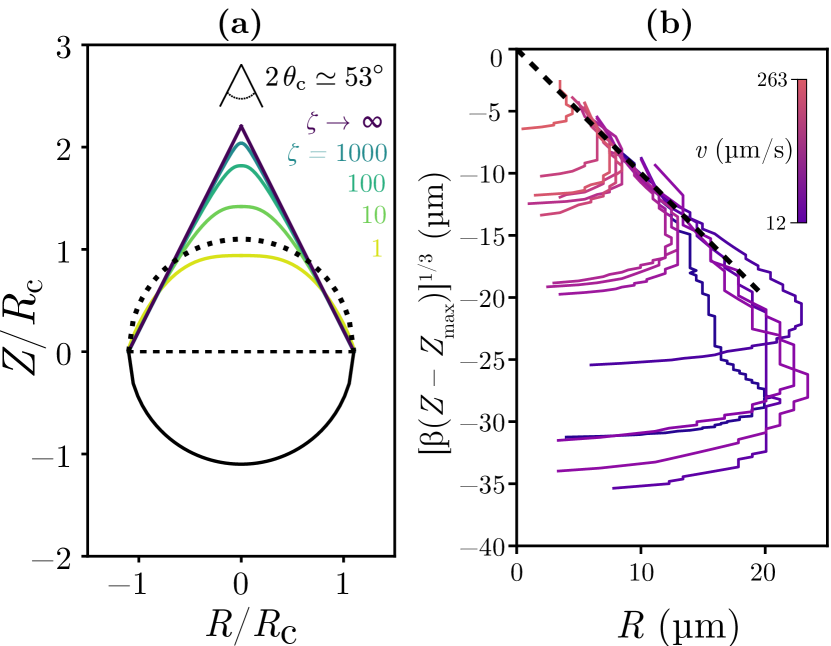
Before turning to the general analysis of the Frozen Bubble Equation, we describe the specific case in which mass diffusion is negligible compared to freezing. Taking , Eq. (11) reduces to . The upper part of the pore then has the shape of a cone of angle (Fig. 3a). For finite , we solve the Frozen Bubble Equation numerically to check that the shapes of the pores indeed converge towards a conical tip.
Taking the limit amounts to canceling the possibility of gas transfer between the bubble and the liquid, meaning the two substances are immiscible. It is interesting to note that in this limit case, the volume of the cone must be that of a hemisphere of radius so the mass of gas is conserved. Satisfying this condition requires that the height of the cone be equal to its maximal diameter, a condition strictly equivalent to . Therefore, in the absence of heat and mass transfer between the bubble and the liquid, the final pore has the shape of a cone on top of a hemisphere, and its aspect ratio is . This shape is quite similar to that of pointy oil drops in frozen emulsions [27, 28], although in that case there is no reason to assume a contact angle between oil and the freezing front.
The limit and the tip of the pore
Another interesting regime is the limit . It corresponds to the closing of the pore. Taking in the Frozen Bubble Equation (11), we obtain
| (12) |
which is readily integrated near the closing point of the bubble . Near its tip the pore shape should therefore follow :
| (13) |
This asymptotic regime is indeed observed in all our experiments, without exceptions. Figure (3b) shows a selection of pore profiles extracted from experiments, representative of the whole range of freezing rate. For all pores we obtain a good agreement with Eq. (13), which in dimensional form is written with . It is notable that does not depend on . The closing of the pore proceeds regardless of the supersaturation, only driven by the Laplace pressure.
Alternative form of the Frozen Bubble Equation
The set of values for parameters and supplemented with an initial condition makes a unique solution of Eq. (11). To compare solutions to actual pores, it is more practical to introduce the initial slope , and to express the ratio as a function of , , and . Eq. (11) can thus be recast in a elegantly symmetric form:
| (14) |
, and are geometrical quantities that can be measured experimentally.
The bifurcation at and bubbles that never close
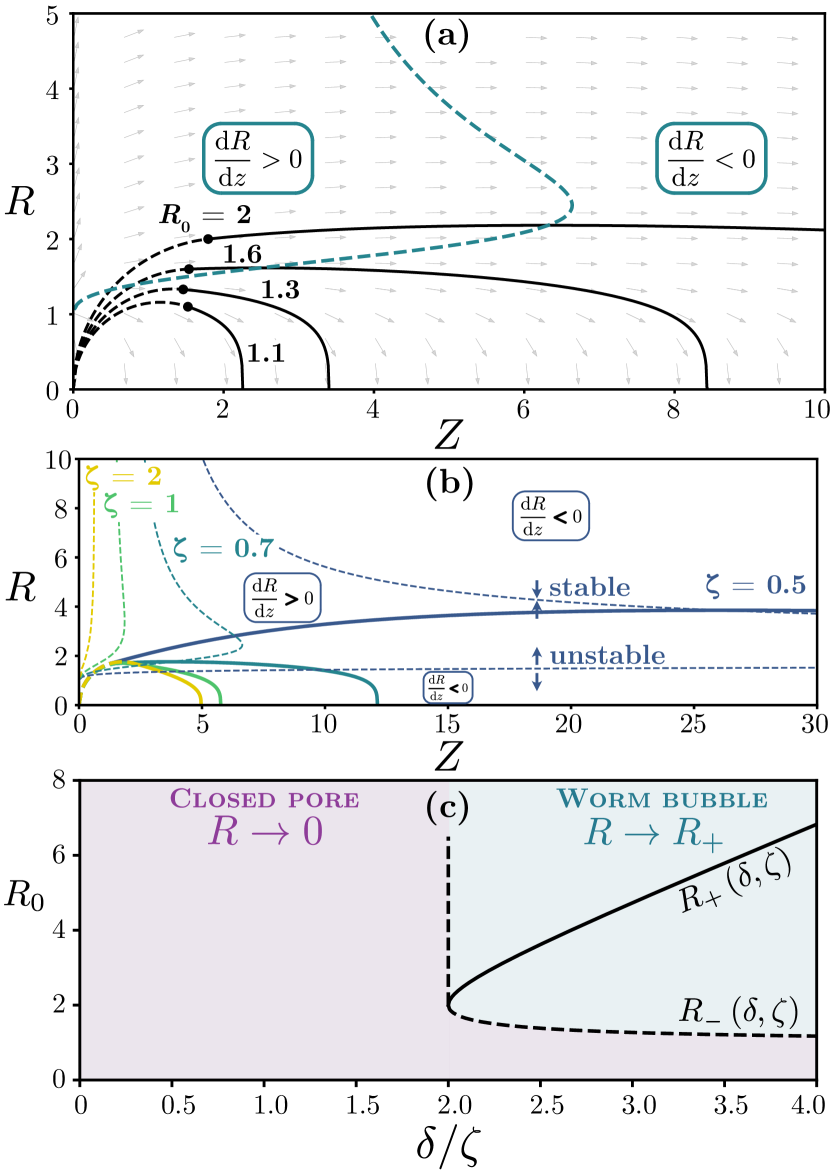
The general analysis of the solutions of the Frozen Bubble Equation, made greatly difficult by its strong non-linearity, can nevertheless be performed using geometrical techniques. In the -plane, Eq. (11) defines a vector field; at point the vector orientation is [44]. Starting with the initial condition , the solution is then the curve that passes through and is everywhere tangent to a vector of the field. An example is shown in Fig. (4a) for and . The dashed blue curve is the separatrix between two domains. On the left, so the bubble grows; on the right, so the bubble shrinks. Starting from different initial conditions, the bubble will grow for some time before it shrinks, or it will shrink right from the start without growing.
Solving in Eq. (11), we find the equation of the separatrix:
| (15) |
The relevant properties of the phase space associated to Eq. (11) are the number and the shape of the domains in which the slope keeps a constant sign. For , the separatrix is bounded on the Z-axis and the domain to its right corresponds to (Fig. 4b). Therefore, after some possible growth depending on the initial condition, the bubble must shrink and close. At there is a bifurcation: the extent of the separatrix on the Z-axis diverges. For , Eq. (15) has two real poles at
| (16) |
corresponding to two disjoint branches of the separatrix. Above the lower branch and below it , therefore it is unstable. However, the upper branch is stable. If the initial condition is above the lower branch (), the bubble will grow until it is captured by the upper branch, and it will never close, making a worm bubble of equilibrium radius (Fig. 4b-c).
In reality, worm bubbles have a finite length. Within the model this would be possible if or would fluctuate so much that the system would switch domains in the phase space (Fig. 4c). Inverting Eq. (16) gives the typical size of the fluctuation of required to close the worm bubble of a certain radius. It is notable that the ratio scales like . Minute variations of concentration may thus affect greatly the shape of the bubbles. Such a fluctuation could of course come from fluctuations of the freezing rate. It could also come from fluctuations of the gas concentration due to the nucleation and growth of other neighbor bubbles. Furthermore, pressure variations in the liquid during the growth are known to modulate the radius of worm bubbles [2]. Such pressure variations could be taken into account in our model by modifiying Eq. 7.
Shape matching
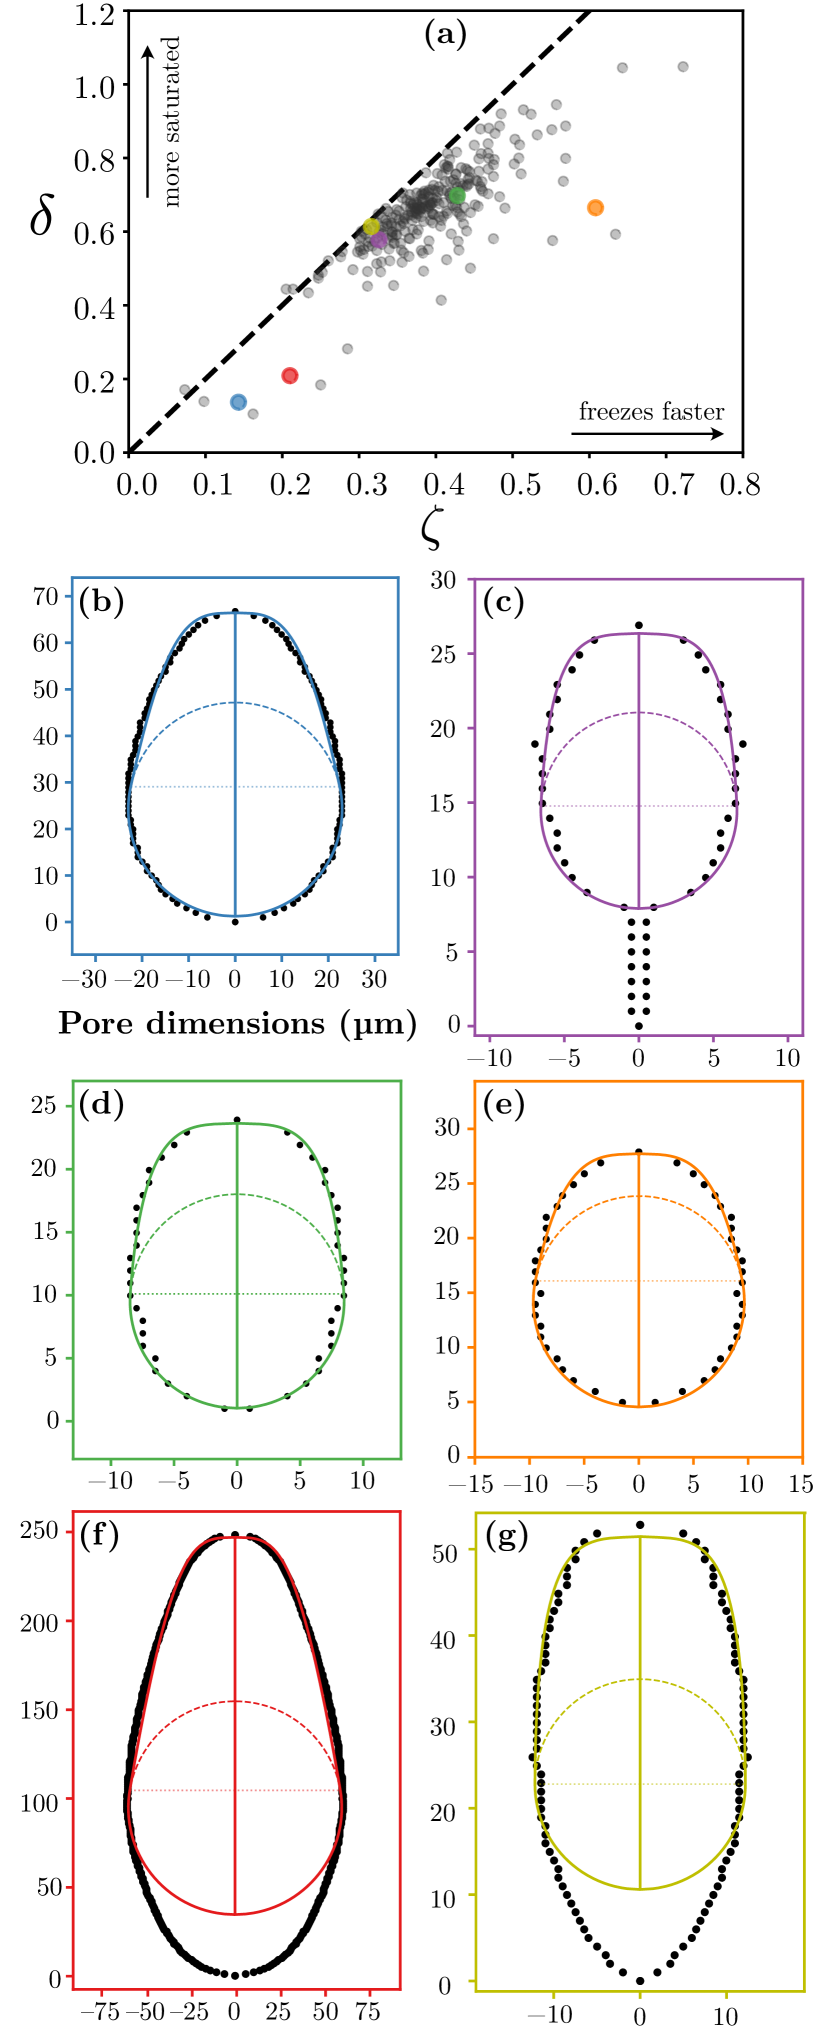
Our experiments give us access to pictures of frozen bubbles whose we know at which rate they froze. Unknown are the supersaturation around the bubble when it appears and the nucleation process. In the following we match numerical solutions of the Frozen Bubble Equations to the pores observed in our experiments. For simplicity, we shall assume that nucleation and entrapment leave the bottom of the bubbles spherical – that is, of uniform curvature – up to the point (, ). Therefore, in Eq. (14) the initial slope can be expressed as . We measure and on the profiles. We are left with only one fitting parameter, , whence we compute , and .
After its shape is matched with a solution, each pore may be placed in a phase diagram (Fig. 5a). This phase diagram confirms a posteriori the most important feature of the problem treated in this paper: both and are of order , therefore none of them may be neglected. Both supersaturation and freezing must be taken into account to properly describe the pores. This justifies the complexity of Eq. (11). It should be noted that removing the transient diffusion term in Eq. (11) prevents from matching the shapes. Therefore, transient diffusion is important in the growth of the pore, contrary to recent assumptions [29].
Most pores that we observe are well-matched from top to bottom. Pores with a tail, due to nucleation between ice grains, are well-matched starting above the tail (Fig. 5c). This suggests that transient gas diffusion following the nucleation is delayed until the bubble is free, and not stuck between ice grains.
Some large pores can only be matched partially from some height to their tip (Fig. 5f-g). In these cases, the bottom of the pore does not have a uniform curvature, so our assumption that the bubble is left spherical by the entrapment probably fails. It is also likely that for very slow freezing, wetting effects become noticeable and our assumption of a hemispherical bubble fails as well.
In the following, we consider pores frozen during the same experiment, corresponding to Figure (1c). These were frozen at a freezing rate ; in Figure (5a) they are situated in the main cloud of points. Matching a solution of the Frozen Bubble Equation to each pore, we can measure its nucleation radius; . From the definition of follows the supersaturation: , which is more than 40-fold the initial concentration (Materials and Methods). Such supersaturation is compatible with homogeneous nucleation.
Shape matching enables to measure and for each bubble; we find and . These values close to the nucleation radius show that entrapment occurs very shortly after nucleation. The initial condition and corresponds to some time after the bubble nucleation. is the delay between the nucleation (when ) and the point at which . We measure .
Another remarkable result concerns the ratio , which is the actual initial condition in the non-dimensional Eq. (11). Its value is , which is an extremely narrow range. Although we are not able to explain this value, it is likely linked to the entrapment mechanism.
Conclusion
The shape of air bubbles trapped in ice results of simultaneous freezing and growth by gas diffusion. Heat transfer and capillarity are so overwhelming that they set the shape of the bubble and of the freezing front. Depending on the bubble size relative to the nucleation radius , diffusion makes it grow or shrink.
We have demonstrated that the shapes of air bubbles trapped in ice, although extensively diverse, can be accurately described by a single non-linear ordinary differential equation, the Frozen Bubble Equation (Eq. 11). The non-dimensional parameters and , respectively representing the supersaturation and the freezing velocity, suffice to describe the growth of a bubble from a given initial condition. The asymptotic regimes explain why the tip of the pores is so characteristically rounded – it follows a power law (Eq. 13) – and why the quickly frozen bubbles tend to be slightly elongated – the limit shape absent diffusion is a cone. Matching a solution of the Frozen Bubble Equation to the shape of a real pore enables to measure the supersaturation and the nucleation radius at which the pore appeared. We have shown that this is at least possible for freezing rates in the range 12 to 263 .
The mathematical analysis reveals a bifurcation that explains how worm bubbles, these cylindrical pores of potentially several centimeters, are formed. To the best of our knowledge, this is the first analytical model to make such a prediction. Unfortunately, our experimental device does not enable us to maintain a sufficiently slow freezing rate to observe the worm bubbles by ourselves, so that further experiements are needed. More generally, it would be interesting to validate the model against measurements made using different gases, and in a wider range of freezing rates.
Our model is written in the most parsimonious fashion; it describes well the pores with as few parameters and mechanisms as possible. It could be extended to take into account the impact of neighbor bubbles on the concentration field [45]. Mathematical analysis could also be extended to the case in which the freezing rate is not constant but decrease like as the freezing front moves away from the thermostat, which is a more common situation [46]. This work is applicable to measuring the freezing history of porous ice. It could also be used to help the design of porous freeze-cast materials.
Materials and Methods
Solution
We use deionized water left in contact with air for a few days so that gases dissolve in it. Before the experiment, the concentration of oxygen in the water was measured at at . Using known correlations of the solubility and Henry constant with the temperature [42], we obtain the concentration of nitrogen , and the concentration of air as a mixture of both gases . We do not take into account further differences between oxygen and nitrogen.
Experiments
Our experiments consist in freezing water contained in a Hele-Shaw cell (Fig. 1a). For the latter we used glass capillary tubes of rectangular section (Vitrocom), with inner dimensions 6 mm by 300 for the bigger cell, 2 mm by 100 for the smaller cell. No significant effect on the bubble shape of using one or the other cell was found. The freezing of the water column is recorded with a DSLR camera (Nikon D5600) mounted with a macro lens (Nikon Micro-Nikkor AI-s 200mm f/4) and a microscope lens (Mitutoyo). The whole set-up is back lit by a light panel (Phlox).
The Hele-Shaw cell is first filled up with water and then carefully brought in contact with a thermostat, whose temperature is kept constant at throughout the experiment. The thermostat is a hollow copper plate through which cold oil is pumped from a refrigerating bath (Julabo Corio 1000F). The local rate of freezing is set by the rate at which the latent heat released at the ice-water interface diffuses through the ice to the thermostat [46]. Therefore, for a given heat flux absorbed by the thermostat, decreases with the distance to the thermostat and with the section of the Hele-Shaw cell. We measure the local rate of freezing on each video, next to each bubble. For all the experiments that we discuss in the present paper, remains constant (within a few ) during the formation of each bubble; it ranges from 12 to 263.
Numerical resolution
The Frozen Bubble Equation was integrated using a fourth-order Runge-Kutta scheme in a custom Python routine.
Compressibility effects
In the derivation we have assumed that air has constant density. Compressibility can be taken into account when we develop the time derivative of the mass in Eq. (8), by introducing the isothermal compressibility . The calculation yields a slightly different version of Eq. (11):
| (17) |
where is the length scale associated to compressibility. In the limit Eq. (11) is recovered. For air , so . In our experiments is at least ten times larger, therefore compressibility is negligible compared to dissolution.
Additional videos
Figure 1 is supplemented with videos showing the formation of each pore, labeled with the number of the subfigure.
Acknowledgements
This material is based upon work supported by the National Science Foundation under NSF Faculty Early Career Development (CAREER) Program Award CBET No. 1944844, and by a UCSB Senate Faculy Grant. We thank Sylvain Deville and Cécile Monteux for fruitful discussions at the early stages of the project, and Sylvain Deville especially for reviewing the first version of the manuscript. VT thank Laurent Duchemin for insightful discussions about the mathematical methods.
References
- [1] Stephen G Warren. Optical properties of ice and snow. Philosophical Transactions of the Royal Society A, 377(2146):20180161, 2019.
- [2] Kenji Murakami and Hideo Nakajima. Formation of pores during unidirectional solidification of water containing carbon dioxide. Materials transactions, 43(10):2582–2588, 2002.
- [3] Bruce Chalmers. How water freezes. Scientific American, 200(2):114–123, 1959.
- [4] George K Swinzow. Ice cover of an arctic proglacial lake, volume 155. US Army Materiel Command, Cold Regions Research & Engineering Laboratory, 1966.
- [5] PS Wei, CC Huang, and KW Lee. Nucleation of bubbles on a solidification front—experiment and analysis. Metallurgical and Materials Transactions B, 34(3):321–332, 2003.
- [6] SA Bari and J Hallett. Nucleation and growth of bubbles at an ice–water interface. Journal of Glaciology, 13(69):489–520, 1974.
- [7] Anthony Jack Gow and David Langston. Growth history of lake ice in relation to its stratigraphic, crystalline and mechanical structure. Number 77. Department of Defense, Army, Corps of Engineers, Cold Regions Research and …, 1977.
- [8] Meagan E Wengrove, Erin C Pettit, Jonathan D Nash, Rebecca H Jackson, and Eric D Skyllingstad. Melting of glacier ice enhanced by bursting air bubbles. Nature Geoscience, 16(10):871–876, 2023.
- [9] Katline Charra-Vaskou, Anna Lintunen, Thierry Ameglio, Eric Badel, Hervé Cochard, Stefan Mayr, Yann Salmon, Heikki Suhonen, Mahaut Van Rooij, and Guillaume Charrier. Xylem embolism and bubble formation during freezing suggest complex dynamics of pressure in betula pendula stems. Journal of Experimental Botany, 74(18):5840–5853, 2023.
- [10] Supratim Ghosh and John N Coupland. Factors affecting the freeze–thaw stability of emulsions. Food Hydrocolloids, 22(1):105–111, 2008.
- [11] Christoph Korber. Phenomena at the advancing ice–liquid interface: solutes, particles and biological cells. Quarterly reviews of biophysics, 21(2):229–298, 1988.
- [12] Gunther Kletetschka and Jolana Hruba. Dissolved gases and ice fracturing during the freezing of a multicellular organism: lessons from tardigrades. BioResearch open access, 4(1):209–217, 2015.
- [13] V Shapovalov and L Boyko. Gasar—a new class of porous materials. Advanced engineering materials, 6(6):407–410, 2004.
- [14] Toshio Yokokawa. Gas solubilities in molten salts and silicates. Pure and Applied Chemistry, 58(12):1547–1552, 1986.
- [15] OM Bunoiu, Th Duffar, and I Nicoara. Gas bubbles in shaped sapphire. Progress in crystal growth and characterization of materials, 56(3-4):123–145, 2010.
- [16] EA Ghezal, A Nehari, K Lebbou, and T Duffar. Observation of gas bubble incorporation during micropulling-down growth of sapphire. Crystal growth & design, 12(11):5715–5719, 2012.
- [17] AK Gupta, BK Saxena, SN Tiwari, and SL Malhotra. Pore formation in cast metals and alloys. Journal of materials science, 27(4):853–862, 1992.
- [18] Marcus VA Bianchi and Raymond Viskanta. Gas segregation during solidification processes. International journal of heat and mass transfer, 40(9):2035–2043, 1997.
- [19] H Nakajima, SK Hyun, K Ohashi, K Ota, and K Murakami. Fabrication of porous copper by unidirectional solidification under hydrogen and its properties. Colloids and Surfaces A: Physicochemical and engineering aspects, 179(2-3):209–214, 2001.
- [20] Sylvain Deville, Eduardo Saiz, Ravi K Nalla, and Antoni P Tomsia. Freezing as a path to build complex composites. Science, 311(5760):515–518, 2006.
- [21] Sylvain Deville, Eduardo Saiz, and Antoni P Tomsia. Ice-templated porous alumina structures. Acta materialia, 55(6):1965–1974, 2007.
- [22] Sylvain Deville. Freeze-casting of porous ceramics: a review of current achievements and issues. Advanced Engineering Materials, 10(3):155–169, 2008.
- [23] Sylvain Deville. Freeze-casting of porous biomaterials: structure, properties and opportunities. Materials, 3(3):1913–1927, 2010.
- [24] Donald Robert Uhlmann, B Chalmers, and KA Jackson. Interaction between particles and a solid-liquid interface. Journal of Applied Physics, 35(10):2986–2993, 1964.
- [25] R Asthana and SN Tewari. The engulfment of foreign particles by a freezing interface. Journal of materials science, 28(20):5414–5425, 1993.
- [26] Sidhanth Tyagi, Helene Huynh, Cécile Monteux, and Sylvain Deville. Objects interacting with solidification fronts: Thermal and solute effects. Materialia, 12:100802, 2020.
- [27] Sidhanth Tyagi, Cécile Monteux, and Sylvain Deville. Solute effects on the dynamics and deformation of emulsion droplets during freezing. Soft Matter, 18(21):4178–4188, 2022.
- [28] Jochem G Meijer, Pallav Kant, Duco Van Buuren, and Detlef Lohse. Thin-film-mediated deformation of droplet during cryopreservation. Physical review letters, 130(21):214002, 2023.
- [29] Keke Shao, Mengjie Song, Xuan Zhang, and Long Zhang. Growth and distribution characteristics of trapped air bubbles in ice slices. Physics of Fluids, 35(11), 2023.
- [30] PS Wei, YK Kuo, SH Chiu, and CY Ho. Shape of a pore trapped in solid during solidification. International journal of heat and mass transfer, 43(2):263–280, 2000.
- [31] PS Wei and SY Hsiao. Effects of solidification rate on pore shape in solid. International Journal of Thermal Sciences, 115:79–88, 2017.
- [32] DM Anderson, M Grae Worster, and SH Davis. The case for a dynamic contact angle in containerless solidification. Journal of crystal growth, 163(3):329–338, 1996.
- [33] Jacco H. Snoeijer and Philippe Brunet. Pointy ice-drops: How water freezes into a singular shape. American Journal of Physics, 80(9):764–771, Sep 2012.
- [34] A. G. Marin, O. R. Enriquez, P. Brunet, P. Colinet, and J. H. Snoeijer. Universality of tip singularity formation in freezing water drops. Physical Review Letters, 113(5), Jul 2014.
- [35] Lila Seguy, Suzie Protière, and Axel Huerre. Role of geometry and adhesion in droplet freezing dynamics. Physical Review Fluids, 8(3):033601, 2023.
- [36] Charles A Knight. The contact angle of water on ice. Journal of Colloid and Interface Science, 25(2):280–284, 1967.
- [37] Virgile Thiévenaz, Christophe Josserand, and Thomas Séon. Retraction and freezing of a water film on ice. Physical Review Fluids, 5:041601(R), 2020.
- [38] Axel Huerre, Antoine Monier, Thomas Séon, and Christophe Josserand. Solidification of a rivulet: shape and temperature fields. Journal of Fluid Mechanics, 914:A32, 2021.
- [39] PS Wei, CC Huang, ZP Wang, KY Chen, and CH Lin. Growths of bubble/pore sizes in solid during solidification—an in situ measurement and analysis. Journal of crystal growth, 270(3-4):662–673, 2004.
- [40] SD Lubetkin. The fundamentals of bubble evolution. Chemical Society Reviews, 24(4):243–250, 1995.
- [41] MG Worster, GK Batchelor, and HK Moffatt. Solidification of fluids. Perspectives in fluid dynamics, 742:393–446, 2000.
- [42] David R Lide et al. CRC handbook of chemistry and physics. CRC Boca Raton, 2012.
- [43] Paul S Epstein and Milton S Plesset. On the stability of gas bubbles in liquid-gas solutions. The Journal of Chemical Physics, 18(11):1505–1509, 1950.
- [44] Vladimir Arnold. Ordinary Differential Equations. Springer Science & Business Media, 1992.
- [45] Kenji Yoshimura, Takaaki Inada, and Shigeru Koyama. Growth of spherical and cylindrical oxygen bubbles at an ice- water interface. Crystal Growth and Design, 8(7):2108–2115, 2008.
- [46] Virgile Thiévenaz, Thomas Séon, and Christophe Josserand. Solidification dynamics of an impacted drop. Journal of Fluid Mechanics, 874:756–773, 2019.