Criticality in the Luria-Delbrück model with an arbitrary mutation rate
Abstract
The Luria-Delbrück model is a classic model of population dynamics with random mutations, that has been used historically to prove that random mutations drive evolution. In typical scenarios, the relevant mutation rate is exceedingly small, and mutants are counted only at the final time point. Here, inspired by recent experiments on DNA repair, we study a mathematical model that is formally equivalent to the Luria-Delbrück setup, with the repair rate playing the role of mutation rate, albeit taking on large values, of order unity per cell division. We find that although at large times the fraction of repaired cells approaches one, the variance of the number of repaired cells undergoes a phase transition: when the variance decreases with time, but, intriguingly, for even though the fraction of repaired cells approaches 1, the variance in number of repaired cells increases with time. Analyzing DNA-repair experiments, we find that in order to explain the data the model should also take into account the probability of a successful repair process once it is initiated. Taken together, our work shows how the study of variability can lead to surprising phase-transitions as well as provide biological insights into the process of DNA-repair.
The Luria-Delbrück experiment [1] is a remarkable example where the analysis of random fluctuations leads to deep insights. A population of bacteria was grown, from an initial population of to about cells, which are then exposed to a virus (i.e., a bacteriophage). The number of survivors is counted (by plating and counting colonies), which is the main output of the experiment. In a large fraction of cases, the result is zero – no bacteria survive the viral attack. But in some instances, hundreds of bacteria survive. While many scientists would toss away such non-reproducible experiments, Luria and Delbrück realized that the large variance:mean ratio they observed is itself the key experimental result, that rules out the Lamarckian picture of adaptation and was consistent with random mutations (that lead to viral resistance) occurring during the population growth.
This seminal work was later shown to have a profound mathematical structure. While in the original paper, only the first and second moments of the distribution were evaluated (and shown consistent with the experiments), the full distribution was studied in later works [2]. It is also referred to as the “jackpot distribution” (since it has a heavy tail scaling as , resulting from the rare events where a bacterium “hits the jackpot” and acquires a mutation early on in the lineage tree), and in a certain limit it approaches the Landau distribution [3], which Lev Landau studied in the context of the energy distribution of fast particles colliding and ionizing molecules in their path. Mandelbrot also showed an intriguing connection to the Levy-stable distribution and the generalized central-limit-theorem [4]. See Ref. [5] for a review, and Ref. [6] for further mathematical progress. In one commonly used model, growth is essentially deterministic and each cell cycle takes an identical, precise duration. Hence, the only source of stochasticity is related to the occurrence of random mutations. This model was used in the original work, due to its conceptual simplicity and analytical advantage. We will refer to this model as the synchronous growth model, since in this case, all cells of a given generation divide at precisely the same time (note that we are also assuming that mutants and wild-type cells have identical doubling time). In another, more realistic, mathematical model, cell divisions are also a source of stochasticity [6], though the qualitative behavior of both models is similar.
Since the original work, in addition to the mathematical advances described above, the LD model and its variants have seen wide applications in different fields. The Luria-Delbrück fluctuation assay is useful in order to determine the relevant mutations rates leading to important phenomena such as antibiotic resistance [7]. More recently, the LD model has been used to study drug-resistant cancer cells and carcinogenesis [8, 9]. In a recent line of research, the Luria-Delbrück fluctuation assay is used to assess phenotypic variability, i.e. traits that are not genetically encoded and thus not fully heritable, with a memory spanning only a few generations. Nonetheless, the fluctuations can provide valuable information regarding the underlying mechanisms, see Ref. [10] for a review.
In a recent experimental setup, yeast cells were genetically engineered such that a segment of their DNA contains repetitive sequences, also known as microsatellites, and upon removal of this segment (guided by CRISPR), cells concurrently begin to express Green Fluorescent Protein (GFP) such that their status may be monitored using video microscopy [11]. In this double-strand break repair (DSBR) experiment, the GFP-expressing status is fully heritable, and although the repair is not due to a random mutation, we may consider it as a random process (occurring with some probability per generation) – hence mathematically it meets the conditions of the LD model:(1) The occurrence of random mutations leading to a distinct trait (e.g. GFP positive in the yeast experiment) (2) The heritability of the trait. Nonetheless, this setup is profoundly different than that of the original LD experiment in terms of the relevant parameters: in the LD setup, the mutation probability per generation is of the order of , as is clear from the fact that out of the division events, only a handful at most will have relevant mutations. In the DNA-repair experiment, on the other hand, was found to be of the order of unity [11]. This distinction necessitates consideration of the irreversible version of the LD model, where a mutated cell cannot revert to its wild-type state. This premise was less critical in the original LD model due to the negligible probability of such reversion with the typically small population of mutated cells. Additionally, in this experiment, the number of repaired cells is tracked throughout the experiment, not only at the final time point (as is the case in the original LD setup).
Here, we analyze the fluctuations observed in a LD setup in this very different regime. Ultimately, all cells will become repaired (no matter what the value of is). However, we find that the variance in the number of repaired cells exhibits two distinct fates, depending on the value of : it may decay over time, as is perhaps the naive intuition since all cells are eventually repaired. However, for , we find that the variance increases exponentially with time, due to the subpopulation of non-repaired cells (the fraction of which monotonically decreases with time).
Comparing the LD model with the DSBR experimental data, we find that by fitting the repair probability , the model can explain the mean fraction of repaired yeast cells as a function of time, but leads to an incorrect prediction for the standard deviation vs. time, growing slower than the experimental data. To explain the deviation, we introduce a modified LD model, where each repair initiated has two possible outcomes: either successful repair or dormant cells that do not divide. The modified model aligns with the experimental data for both the mean and standard deviation.
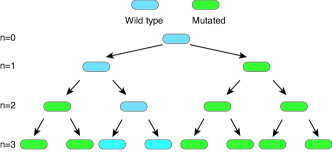
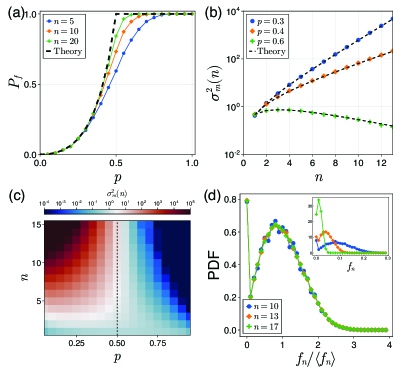
Synchronous growth model.— We consider an exponentially growing population descending from a single wild-type (WT) cell, where each cell has a constant probability to mutate irreversibly per cell cycle (corresponding to the repair of the microsatellite region of the genome in the DSBR experiment). We assume that the timing of cell division is synchronous so that a population starting from a single WT cell, which we define as generation , will have cells in generation (Figure 1). It is well known that this branching process has a phase transition at [12]: above this critical value, at long times all of the cells in the population become mutants, while below this critical value, there is a finite probability of having WT cells also at arbitrarily long times. It is straightforward to show that obeys the following equation, also shown in Figure 2(a) for finite number of generations:
| (1) |
Inspired by the original LD problem, where the study of variance was key in distinguishing Darwinian and Larmarckian evolution, we will be interested in the variance of the number of mutated cells over time. Intriguingly, the temporal dynamics of the variance will also manifest a phase transition at . Moreover, as we shall see, comparing this property with experimental data will also lead us to useful insights.
To this end, we will first consider a recursive equation for the number of mutated cells over time.
| (2) |
where is a random variable, which is with probability and 0 with probability . The first term on the RHS comes from the doubling of mutated cells in generation . The second term comes from non-mutated cells, which may mutate in generation .
We can compute the average number of mutated cells by applying Wald’s equation to decouple the summation bound ( and the random variable () [13], resulting in the following solution
| (3) |
Eq. (3) shows that the average number of mutated cells approaches the total number in the long time limit.
We next compute the variance of the number of mutated cells. If we denote the number of wild-type cells as , then we have
| (4) |
Therefore the variance of the number of mutated cells should be equal to the variance of wild-type cells .
By applying the Blackwell–Girshick equation to the recurrence relation, we are able to find the recursive relation of the variance [14] ,
| (5) |
Solving the equation, we obtain:
| (6) |
A critical transition happens at , below which the variance diverges in the long time limit , and above which the variance vanishes in the long time limit (Figure 2b,c). At , diverges linearly. One can also express the variance as a function of the total cell number using , which will allow us to compare the predictions of the synchronous growth model with simulations based on asynchronous growing populations:
| (7) |
We define the fraction of WT cells in generation as so that it is between and . From Eq. (3) and Eq. (6), we find that the coefficient of variation (CV, the ratio of the standard deviation and the mean) of ,
| (8) |
In fact, our numerical simulations suggest a stronger result, namely, that for the distribution is approximately scale-invariant (also for small values of ), and takes the following form:
| (9) |
see Figure 2d. In the Supplementary Materials (SM), we show rigorously that this form is approached asymptotically (for large ), using the theory of classical branching processes and generating functions [12].
Before comparing these analytical results with experimental data, we also want to verify that they are valid within the context of more realistic models that account for asynchronous growth.
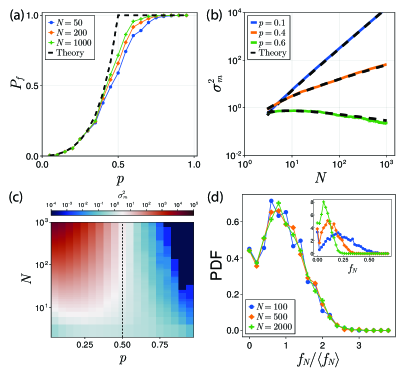
Asynchronous populations.— We simulate an asynchronous growing population in which the generation times are correlated random variables. To this end, we use a phenomenological model utilized in prior works on microbial growth [15, 16, 17, 18], where the generation time of the daughter cell is related to that of the mother cell:
| (10) |
Here, and are constants and is a Gaussian noise. We choose the parameters such that the CV of the generation time distribution is . When we plot the simulation results for the variance vs. the number of cells, we find that asynchronous model exhibits a phase transition analogous to the one discussed previously for the synchronous model (Figure 3a,b,c). Note that this is not the case when the variance is plotted vs. time, since the stochastic divisions may lead to growing variance vs. time also for (Figure S1). Interestingly, our simulations suggest that also for the asynchronous model, the distribution of the fraction of WT cells (conditioned on the number of cells) is scale-invariant (Figure 3d).
Comparison with experiments.— Next, we compare our theoretical predictions with the DNA-repair data of Ref. [11]. The double-strand break repair experiment was studied for 8 different combinations, including two endonucleases (Cas9 and Cpf1) and four target sequences (NR,CGG,GAA and CTG). The endonucleases, enzymes which can cut DNA strands at specific locations, have different affinities to different target DNA sequences, which therefore could result in different DNA break and repair probabilities. Out of the 8 combinations, 4 of them are identified as high-efficacy error-free repair, which means the DSBR process happened on most of the wells in the microfluidic array and did not significantly affect the cell fitness, hence they fall into the high “mutation” rate LD model cases if the DSBR process is thought as a random inheritable and irreversible mutation [11]. Therefore, we focus on these for our analysis (for the other conditions, the number of repaired cells is too low). However, they do not agree with the prediction of the LD model in standard deviation and variance when conditioned on the total number of cells , as shown in Figure 4. While by fitting the parameters of the LD model we can capture the mean number of repaired yeast cells as a function of time, the standard deviation given by the LD model grows slower than the experimental data (the standard deviation of the experiment is valid until it decreases sharply, which is the result of the decrease in sample size due to experiment time constraint). To explain the deviation, we introduce a modified LD model with a probability of successful repair that can match the experimental data in both the mean and standard deviation.
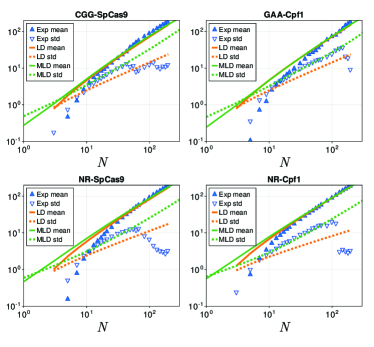
Modified LD model.— In the yeast DSBR experiment, several foundational assumptions of the LD model might not hold, including: (1) mutations not affecting cell fitness, whereas repaired cells in the DSBR could exhibit varied fitness; (2) for the DSBR setup, once a DNA break occurs, the repair process might have a non-negligible probability to fail; This implies that there are two probabilities characterizing each cell cycle (of a break, and of successful repair), in contrast to the LD model where one mutation probability per cell cycle defines the model fully (3) the LD model assumes a constant cell division time, whereas yeast in the DSBR may experience asymmetric budding with variable division times. Although any of the three factors could change the population dynamics significantly, one observation of the experiments implies that the most likely cause of the deviation could be the second: for each of the experimental conditions, a large portion (about 30%) of the wells do not have any repaired cells by the end of the experiment. It is plausible that the broken DNA strands in these wells remain unrepaired. Since cells with broken DNA cannot divide, a modified LD model could introduce repair success probability for the breaking and repair processes so that once a cell is broken it can be either repaired or dormant. The modified LD model shows excellent agreement with the experimental data in both the mean and standard deviation, as shown in Figure 4. It is not a simple result from modeling with more parameters, as we also tested models relaxing assumptions (1) and (3), by introducing different growth rate of repaired cells and adding extra noise to division time, neither alone could make the model fit better with the DSBR experimental data. In addition, the modified LD model with proper fitting parameters can match the distribution of repaired cells across wells, as supported by hypothesis testing (see SM and Table. S1). There is some discrepancy between the model prediction and experimental data in the initial phase when the cell count is low. Firstly, the figure is on a log-log scale, so the deviation is not large in the absolute magnitude. Secondly, the deviation can be attributed to a delay of GFP expression following DNA repair, which could span up to 6 hours (equivalent to approximately 1-2 cell generation periods) [11]. This delay results in a reduced count of GFP-positive cells in the early stages.
Discussion.— In this work, we studied the Luria-Delbrück model with a large mutation rate, which is relevant to the DNA-repair experiment. We found that the variance of the number of mutated cells exhibits a phase transition at , below which the variance increases with time, and above which the variance decreases with time. We also found that the distribution of the fraction of WT cells is scale-invariant when . Both are verified by synchronous and asynchronous LD model simulations. We compared the LD model with the DSBR experimental data and found that by introducing a probability of successful repair, a modified LD model can match the experimental data in both the mean and standard deviation. Our results demonstrate that by studying the fluctuations of the temporal dynamics across different wells, we can learn about the underlying mechanisms of the DNA repair process. For example, within the four examined combinations of endonucleases and target sequences, the successful repair probability of non-repeated control sequences (NR) is found to be twice as high as that for CGG and GAA sequences. This difference is not discernible through the average number of repaired cells (see Table S1). In fact, the inference of new insights from the variability rather than the mean behavior, via the utilization of mathematical and physical models, is exemplified in various other examples in biology [19]. These include the original Luria-Delbrück problem, as well as, more recently, in studies interrogating the microbial cell cycle [20, 21], the mammalian cell cycle [22] and bacterial populations in droplets [23], to name but a few.
Acknowledgement.— We would like to thank Ethan Levien and Prathitha Kar for their invaluable discussions and insights that significantly contributed to this work.
References
- Luria and Delbrück [1943] S. E. Luria and M. Delbrück, Mutations of bacteria from virus sensitivity to virus resistance, Genetics 28, 491 (1943).
- Lea and Coulson [1949] D. E. Lea and C. A. Coulson, The distribution of the numbers of mutants in bacterial populations, Journal of genetics 49, 264 (1949).
- Landau [1944] L. D. Landau, On the energy loss of fast particles by ionization, J. Phys. 8, 201 (1944).
- Mandelbrot [1974] B. Mandelbrot, A population birth-and-mutation process, i: explicit distributions for the number of mutants in an old culture of bacteria, Journal of Applied Probability 11, 437 (1974).
- Zheng [1999] Q. Zheng, Progress of a half century in the study of the luria–delbrück distribution, Mathematical biosciences 162, 1 (1999).
- Kessler and Levine [2013] D. A. Kessler and H. Levine, Large population solution of the stochastic luria–delbrück evolution model, Proceedings of the National Academy of Sciences 110, 11682 (2013).
- Oakberg and Luria [1947] E. F. Oakberg and S. E. Luria, Mutations to sulfonamide resistance in staphylococcus aureus, Genetics 32, 249 (1947).
- Jr et al. [2012] L. A. D. Jr, R. T. Williams, J. Wu, I. Kinde, J. R. Hecht, J. Berlin, B. Allen, I. Bozic, J. G. Reiter, M. A. Nowak, K. W. Kinzler, K. S. Oliner, and B. Vogelstein, The molecular evolution of acquired resistance to targeted EGFR blockade in colorectal cancers, Nature 486, 537 (2012).
- Bozic and Nowak [2014] I. Bozic and M. A. Nowak, Timing and heterogeneity of mutations associated with drug resistance in metastatic cancers, Proceedings of the National Academy of Sciences 111, 15964 (2014).
- Singh and Saint-Antoine [2023] A. Singh and M. Saint-Antoine, Probing transient memory of cellular states using single-cell lineages, Frontiers in Microbiology 13, 1050516 (2023).
- Vertti-Quintero et al. [2022] N. Vertti-Quintero, E. Levien, L. Poggi, A. Amir, G.-F. Richard, and C. N. Baroud, Time-resolved microfluidics unravels individual cellular fates during double-strand break repair, BMC biology 20, 269 (2022).
- Kimmel and Axelrod [2015] M. Kimmel and D. E. Axelrod, Branching Processes in Biology, 2nd ed., Interdisciplinary applied mathematics, v. 19, Vol. 19 (Springer Nature, New York, NY, 2015).
- Wald [1944] A. Wald, On cumulative sums of random variables, The Annals of Mathematical Statistics 15, 283 (1944).
- Blackwell and Girshick [1946] D. Blackwell and M. Girshick, On functions of sequences of independent chance vectors with applications to the problem of the” random walk” in k dimensions, The Annals of Mathematical Statistics , 310 (1946).
- Cerulus et al. [2016] B. Cerulus, A. M. New, K. Pougach, and K. J. Verstrepen, Noise and epigenetic inheritance of single-cell division times influence population fitness, Current Biology 26, 1138 (2016).
- Barber et al. [2021] F. Barber, J. Min, A. W. Murray, and A. Amir, Modeling the impact of single-cell stochasticity and size control on the population growth rate in asymmetrically dividing cells, PLoS Computational Biology 17, 10.1371/journal.pcbi.1009080 (2021).
- Lin et al. [2020] J. Lin, M. Manhart, and A. Amir, Evolution of microbial growth traits under serial dilution, Genetics 10.1534/genetics.120.303149 (2020).
- Lin and Amir [2020] J. Lin and A. Amir, From single-cell variability to population growth, Physical Review E 101, 012401 (2020).
- Amir and Balaban [2018] A. Amir and N. Q. Balaban, Learning from noise: How observing stochasticity may aid microbiology., Trends in microbiology 26 4, 376 (2018).
- yi Ho et al. [2018] P. yi Ho, J. Lin, and A. Amir, Modeling cell size regulation: From single-cell-level statistics to molecular mechanisms and population-level effects., Annual review of biophysics 47, 251 (2018).
- Kar et al. [2023] P. Kar, S. Tiruvadi-Krishnan, J. Männik, J. Männik, and A. Amir, Using conditional independence tests to elucidate causal links in cell cycle regulation in escherichia coli, Proceedings of the National Academy of Sciences of the United States of America 120 (2023).
- Sandler et al. [2015] O. Sandler, S. P. Mizrahi, N. Weiss, O. Agam, I. Simon, and N. Q. Balaban, Lineage correlations of single cell division time as a probe of cell-cycle dynamics, Nature 519, 468 (2015).
- Taylor et al. [2022] D. Taylor, N. Verdon, P. Lomax, R. J. Allen, and S. Titmuss, Tracking the stochastic growth of bacterial populations in microfluidic droplets, Physical Biology 19, 026003 (2022).