Softmax Probabilities (Mostly) Predict Large Language Model Correctness on Multiple-Choice Q&A
Abstract
Although large language models (LLMs) perform impressively on many tasks, overconfidence remains a problem. We hypothesized that on multiple-choice Q&A tasks, wrong answers would be associated with smaller maximum softmax probabilities (MSPs) compared to correct answers. We comprehensively evaluate this hypothesis on ten open-source LLMs and five datasets, and find strong evidence for our hypothesis among models which perform well on the original Q&A task. For the six LLMs with the best Q&A performance, the AUROC derived from the MSP was better than random chance with in instances. Among those six LLMs, the average AUROC ranged from to . Leveraging these findings, we propose a multiple-choice Q&A task with an option to abstain and show that performance can be improved by selectively abstaining based on the MSP of the initial model response. We also run the same experiments with pre-softmax logits instead of softmax probabilities and find similar (but not identical) results.
1 Introduction
Large language models (LLMs) have demonstrated profound capabilities in many domains, but a persistent problem remains in that they sometimes generate plausible-sounding, yet false, responses. In one high-profile case, the LLM invented a litany of nonexistent court cases, leading to formal sanctions for two lawyers (Mangan, 2023). Although ongoing work has reduced the rate of these mistakes,111https://huggingface.co/spaces/hallucinations-leaderboard/leaderboard we expect that LLMs (and indeed, all learning agents, including humans) will always have to handle novel situations that surpass the boundaries of their existing knowledge. It is crucial for the LLM to decline to answer when encountering such queries, rather than confidently misleading users.
But how can a model decide when it is in such a situation? On several vision and NLP tasks, wrong answers and out-of-distribution (OOD) inputs are associated with smaller maximum softmax probabilities (MSPs) and maximum logits compared to correct answers and inputs from the training distribution (Nguyen & O’Connor, 2015; Hendrycks & Gimpel, 2017; Hendrycks et al., 2022). Intuitively, if the model assigns near 100% probability to a single class, one would hope this indicates a high degree of confidence compared to assigning 25% probability to four different classes.
If this pattern holds for LLMs as well, it could be a powerful tool for mitigating misleading LLM responses. Although one can always teach a model when to abstain using standard supervised methods (as done in (Kadavath et al., 2022; Zhang et al., 2023; Azaria & Mitchell, 2023; Yin et al., 2023)), that approach requires a labeled dataset containing both in- and out-of-distribution examples. Exposing the model to “out-of-distribution” data essentially turns them into in-distribution data, and thus does not constitute true OOD detection. In other words, the LLM may still fail when encountering a scenario outside of that dataset. A truly robust method should enable the model to detect unfamiliar situations without having seen similar situations previously; indeed, that is the definition of a novel situation.
In general, we think it is unreasonable to expect models to a priori know the correct action in unfamiliar situations. However, simply identifying unfamiliar situations (and then acting cautiously) seems much more tractable, and may be sufficient to avert or at least mitigate harmful misgeneralization. Promisingly, Kang et al. (2023) show that for a wide range of neural network architectures, as inputs become increasingly OOD, the softmax probabilities approach a fixed value: this suggests that OOD detection might actually become easier as inputs become more extreme.
We do not claim that OOD classifiers based solely on the MSP or maximum logit can attain anywhere near the desired level of robustness. In general, our goal in this paper is not to design a state-of-the-art OOD detection method for LLMs. Rather, we aim to investigate a potentially invaluable source of uncertainty information—softmax probabilities and pre-softmax logits—as an intermediate step in devising robust methods for averting harmful LLM responses.
1.1 Experiment design
Specifically, we hypothesized that wrong answers on multiple-choice Q&A tasks would be associated with lower MSPs and maximum logits.222Although wrong outputs are conceptually distinct from OOD inputs, one typically expect models to perform well on the training distribution. We chose to study wrong answers because those are what we ultimately want to avert and are easier to define for LLMs. We chose multiple-choice Q&A because there is exactly one correct answer: this allows us to study the core hypothesis of whether the MSPs and maximum logits contain useful discriminative information, without having to deal with more complex issues such as degrees of correctness or multiple valid phrasings of the same correct answer.
We evaluated our hypothesis on ten popular open-source LLMs. Each model was tested on each of the five multiple-choice Q&A datasets used in the Hugging Face Open LLM leaderboard (Beeching et al., 2023), which constitutes the state-of-the-art for benchmarking open-source LLMs. To test our hypothesis in the simplest setting possible, we used a plain zero-shot prompting style, with two different prompt phrasings (Figure 1). To our knowledge, this is one of the most comprehensive studies of open-source LLMs on Q&A tasks.
Formally, for each LLM-dataset-phrasing combination, we studied a binary classification task: given a multiple-choice question and the LLM’s response, predict whether the response is correct. We hypothesized that the MSP and Max Logit333We use “Max Logit” to refer to the classifier based on the maximum logit. classifiers would be able to discriminate between correct and incorrect answers better than random chance.
Our primary success metric was the Area Under the Receiver Operating Characteristic curve (AUROC) (Bradley, 1997). The AUROC of a binary classifier ranges from 0% to 100%, where 0% corresponds to getting every prediction wrong, 50% is random chance, and 100% is perfect classification. AUROC is also equivalent to the probability that a randomly chosen positive instance is ranked higher than a randomly chosen negative instance. Conveniently, AUROC is threshold independent: it captures the model’s performance across the entire range of possible thresholds.
Our code can be found at https://github.com/bplaut/softmax-probs-predict-llm-correctness.
1.2 Our results
| MSP | Max Logit | ||||
|---|---|---|---|---|---|
| LLM | Q&A Accuracy | AUROC | AUROC | ||
| Falcon 7B | 29.1 | 51.8 | 1/10 | 51.7 | 0/10 |
| Falcon 40B | 44.2 | 59.6 | 7/10 | 55.1 | 4/10 |
| LLaMA 2 7B | 40.6 | 57.3 | 6/10 | 55.9 | 5/10 |
| LLaMA 2 13B | 46.7 | 60.1 | 6/10 | 58.0 | 6/10 |
| LLaMA 2 70B | 58.3 | 69.4 | 10/10 | 63.3 | 8/10 |
| Mistral 7B | 56.9 | 63.5 | 10/10 | 62.7 | 10/10 |
| Mixtral 8x7B | 69.0 | 61.6 | 10/10 | 62.4 | 10/10 |
| SOLAR 10.7B | 67.2 | 59.9 | 9/10 | 65.2 | 10/10 |
| Yi 6B | 52.1 | 66.8 | 10/10 | 61.7 | 10/10 |
| Yi 34B | 69.0 | 67.5 | 10/10 | 66.4 | 10/10 |
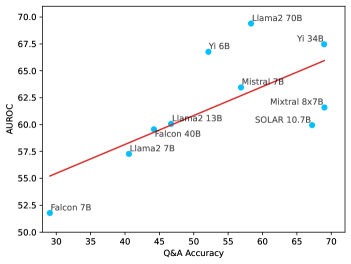
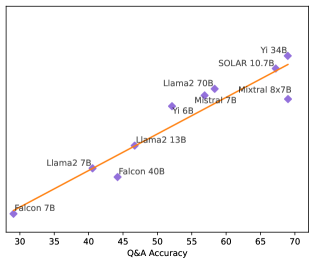
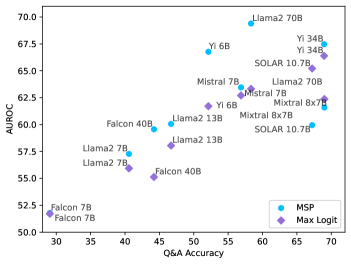
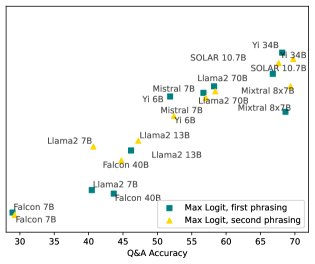
We computed the AUROC for each combination of LLM, dataset, prompt phrasing, and classifier (MSP or Max Logit), resulting in 200 total data points. Among the six LLMs with the best average Q&A accuracy (percentage of questions answered correctly), the AUROC outperformed random chance with for 59/60 MSP data points and 58/60 Max Logit data points (Table 1). Among the other four LLMs, statistically significant AUROC was obtained for only 20/40 MSP data points and 15/40 Max Logit data points. We also found strong evidence for a direct correlation between average Q&A accuracy and average AUROC: the Pearson correlation coefficients for MSP AUROC and Max Logit AUROC were () and (), respectively (Figure 2). See Section 4 for details.
Having established the predictive power of softmax probabilities and logits, we next provide a proof-of-concept for how this information can be leveraged to reduce LLM harm in practice. We propose a variant of the original Q&A task where models are also offered the option to abstain, and receive 1 point per correct answer, 0 points per abstention, and points per wrong answer. We find that for both and , selectively abstaining based on the MSP and/or maximum logit leads to substantial improvements over the base models. See Section 5 for details.
Overall, our work demonstrates both the viability and importance of incorporating uncertainty information into LLM responses. We show that the MSP and maximum logit provide useful signals for detecting model mistakes, and observe that this capability correlates with the LLM’s accuracy on the original Q&A task. We hope that our work will inspire further investigations to understand the root causes of these phenomena.
The rest of the paper is structured as follows. Section 2 discusses related work. Section 3 describes our general experimental setup. Section 4 presents our AUROC results, and Section 5 studies a variant of the Q&A task where an option to abstain is added. The appendices discuss a caveat for the Falcon 7B results and provide complete dataset-level results.
2 Related work
Uncertainty in NLP.
Uncertainty has been an increasingly important topic in NLP (Hu et al., 2023). Identifying data points on which a model is uncertain is a common heuristic in active learning (Settles, 2009; Tharwat & Schenck, 2023). Popular approaches rely on model output distribution, such as least confidence (Culotta & McCallum, 2005; Settles & Craven, 2008), margin sampling (Scheffer et al., 2001), and maximum entropy (Settles & Craven, 2008). Calibration (DeGroot & Fienberg, 1983; Bennet, 2000; Niculescu-Mizil & Caruana, 2005; Nguyen & O’Connor, 2015; Guo et al., 2017a; Desai & Durrett, 2020) examines whether a model’s predicted probability of an event accurately reflects the actual likelihood of that event occurring in the real world. Our work investigates a less strict yet useful condition, which is whether the predicted probabilities of true and false events are distinguishable. In the context of error detection through model probabilities, Nguyen & O’Connor (2015) propose using MSP as an indicator for identifying incorrect predictions in coreference resolution tasks. Subsequently, Hendrycks et al. (2020) demonstrate that MSPs from pre-trained BERT models are effective in filtering out anomalous and out-of-distribution data points. Our work shows that LLMs exhibit similar capability in Q&A tasks.
Uncertainty assessments of large language models.
As LLMs are often the state-of-the-art solution in many high-stake applications, endowing these models with the ability to accurately estimate and convey uncertainty to users becomes a pressing problem (Baan et al., 2023; Geng et al., 2023). Several papers have evaluated the degree of calibration of these models (Kadavath et al., 2022; Krause et al., 2023; Tian et al., 2023). Generally, state-of-the-art LLMs tend to produce overconfident probabilities (OpenAI, 2023; Zhou et al., 2024). This line of work is closest to ours, but as mentioned, we consider a weaker condition than calibration and conduct studies on a large set of open-source models.
One line of work leverages the internal representations of LLMs to train classifiers to predict the correctness of their answers (Kadavath et al., 2022; Zhang et al., 2023; Azaria & Mitchell, 2023; Yin et al., 2023). While this approach yields positive results, since the models are trained on “out-of-distribution” examples, these results illustrate only in-distribution generalization, not a true OOD detection capability. In contrast, our unsupervised method can identify wrong answers without needing a labeled dataset of similar examples. Although wrong answers do not inherently correspond to OOD inputs, we view these categories similarly, since adequately trained models can be expected to perform well on in-distribution questions.
Orthogonal to our work, Tian et al. (2023) devise prompting strategies to improve the calibration of LLMs. We defer the investigation of the effects of advanced prompting techniques to future work. Beyond numerical probability, recent work considers alternative media for expressing uncertainty such as natural language (Lin et al., 2022a; Mielke et al., 2022; Xiong et al., 2023; Zhou et al., 2024) or set-based similarity metrics (Lin et al., 2023).
3 Experimental setup
As discussed, we patterned our evaluation after the Hugging Face Open LLM leaderboard (Beeching et al., 2023). We used all five multiple-choice Q&A datasets444The leaderboard also includes the GSM8k dataset, which we excluded since it is not multiple-choice. from that leaderboard: ARC-Challenge (Clark et al., ), HellaSwag (Zellers et al., 2019), MMLU (Hendrycks et al., 2021), TruthfulQA (Lin et al., 2022b), and WinoGrande (Sakaguchi et al., 2021). We randomly sampled 6,000 questions from each dataset, except for those with fewer than 6,000, in which case we used all of the questions (ARC-Challenge and TruthfulQA have 2,590 and 817 questions, respectively).
We chose ten open-source LLMs to test based on a combination of performance on said leaderboard and number of downloads on Hugging Face. The models we selected are Falcon (7B and 40B)555Falcon also has a 180B version, which we did not test due to computational constraints. (Almazrouei et al., 2023), LLaMA 2 (7B, 13B, 70B) (Touvron et al., 2023), Mistral 7B v0.2 (Jiang et al., 2023), Mixtral 8x7B (Jiang et al., 2024), SOLAR 10.7B (Kim et al., 2023), and Yi (6B and 34B) (01-ai, 2023). We used the fine-tuned “chat” or “instruct” versions of all models, as these have been specifically trained to answer user queries. All LLMs were accessed through the Hugging Face interface. They were run with dynamic 4-bit quantization, which has been shown to preserve performance while significantly reducing the computational requirements (Dettmers et al., 2023). All experiments were run on NVIDIA RTX A6000 GPUs.
We wanted to test our hypothesis in its simplest form, so we used a plain zero-shot prompting style, with two different prompt phrasings (Figure 1). The Hugging Face Open LLM leaderboard also uses a plain prompting style (i.e., no chain-of-thought or other advanced techniques), albeit with few-shot prompting.
3.1 Computing MSP and Max Logit
Let be a vocabulary and let be a sequence of tokens from that vocabulary. For each token and prefix , an LLM computes a logit value . It then applies a softmax function to the logits to derive the probability of being the next token:
The Max Logit of token is and the MSP is . Also, note that the Max Logit and MSP both correspond to the same token: .
In our experiments, we formulated each question as a prompt (Figure 1), then used greedy decoding to generate a response (i.e., we always picked the token with the maximum logit).
For the classification tasks studied in (Hendrycks & Gimpel, 2017; Hendrycks et al., 2022; Kang et al., 2023), there is a single MSP and Max Logit per response. However, an LLM response can consists of multiple tokens and the model produces an MSP and Max Logit for each token. To address this issue, we extracted from the response a single token that indicates the LLM’s answer to the question. Specifically, we searched the output string for the first occurrence of “A.”, “B.”, “C.”, etc, then recorded the MSP and Max Logit corresponding to that capital letter token. If there was no such occurrence, we searched instead for just “A”, “B”, “C”, etc, or the text of one of the options (e.g. for the question in Figure 1, this would be “lightning”, “cellular respiration”, etc.). If the search failed, we recorded the MSP and Max Logit as zero.
3.2 Evaluating Q&A correctness
We used a similar approach to determine whether each LLM response was correct: we first searched for “A.”, “B.”, “C.”, etc, and then fell back to the text of an option or “A”, “B”, “C”, etc. In some rare cases (0.3% of questions), we could not find anything resembling a response, either because the model outputted gibberish or because the model claimed that the question was offensive. These “unparseable” responses were marked as wrong. We considered excluding these questions, but we decided that practically speaking, these responses are not correctly answering the question and thus should be treated as wrong.
3.3 Aggregating results across datasets
In order to weight each dataset equally666Grouping the questions from all datasets together to compute a single AUROC per model would undervalue datasets with fewer questions., we computed a separate AUROC for each combination of model, dataset, prompt phrasing, and classifier (MSP vs Max Logit).777The Python module sklearn was used to compute AUROC. All in all, we recorded 200 AUROC data points (ten models, five datasets, two phrasings, two classifiers) and 100 Q&A accuracy data points (ten models, five datasets, two phrasings) over a total of 428,140 questions (ten models, 21,407 questions across datasets, two phrasings). We then calculated per-model unweighted averages to obtain the results in Table 1.
4 Predicting answer correctness with MSP and Max Logit
Section 1.2 covers the most important elements of our AUROC results for MSP and Max Logit. We do not repeat those results here and instead proceed directly to other considerations.
Statistical significance.
We conducted a series of hypothesis tests to confirm that our AUROC results were in fact statistically significant. We used the Mann-Whitney test (Wilcoxon, 1945; Mann & Whitney, 1947) as it directly tests the AUROC: a significant statistic from this test indicates that the classifier obtains AUROC greater than 50% (i.e., random guessing) in discriminating between two populations. Here the two populations are (1) questions where the LLM got the correct answer and (2) questions where the LLM got the wrong answer. As the non-parametric equivalent of the -test, the test requires the data to be independent but not normally distributed, which our randomly-sampled multiple choice questions satisfy.
For each combination of model, dataset, prompt phrasing, and classifier (MSP and Max Logit), we tested the null hypothesis that the AUROC is equal to 50%. This corresponds to a total of 200 Mann-Whitney tests. We summarize these results in Table 1, reporting the number of -values that were lower than for each model and classifier. We chose the significance threshold of to account for a Bonferroni correction (Bonferroni, 1936). A Bonferroni correction is applied when performing multiple hypothesis tests (in our case, 200) to ensure that the chance of falsely rejecting any null hypothesis is small. Starting from the standard threshold of , the Bonferroni correction yields . We adhere to the stricter threshold of for simplicity.
| MSP percentiles | ||||
| LLM | Q&A Accuracy | 10th | 50th | 90th |
| Falcon 7B | 29.1 | 25.8 | 35.0 | 65.1 |
| Falcon 40B | 44.2 | 17.7 | 30.4 | 54.9 |
| LLaMA 2 7B | 40.6 | 42.1 | 77.9 | 98.0 |
| LLaMA 2 13B | 46.7 | 51.9 | 84.4 | 99.9 |
| LLaMA 2 70B | 58.3 | 65.1 | 98.5 | 99.9 |
| Mistral 7B | 56.9 | 85.0 | 100 | 100 |
| Mixtral 8x7B | 69.0 | 98.4 | 100 | 100 |
| SOLAR 10.7B | 67.2 | 72.8 | 99.2 | 100 |
| Yi 6B | 52.1 | 42.6 | 66.0 | 92.7 |
| Yi 34B | 69.0 | 48.3 | 73.8 | 95.4 |
Calibration.
A prediction model is calibrated if the probability it assigns to an outcome matches the true frequency of that outcome (DeGroot & Fienberg, 1983; Nguyen & O’Connor, 2015). For example, on questions where the MSP is 0.8, is the model actually correct 80% of the time? A high AUROC does not imply calibration: AUROC only depends on which questions have higher or lower MSPs, not the actual MSP values.
Overall, we find that the LLMs are not particularly calibrated and generally exhibit overly confident MSPs (Table 2). For example, Mistral 7B and Mixtral 8x7B both have a median MSP value of 100%, meaning that they claim a 100% chance of correctness on more than half of the questions. Prior work has made similar observations about convolutional neural networks (Guo et al., 2017b)888Interestingly, the paper also finds that neural networks from around the turn of the century were actually more calibrated, despite being less accurate. and proprietary LLMs (OpenAI, 2023).
However, as we show in Section 5.2, calibration is not necessary for the MSPs to be useful in practice. As long as we are able to select an appropriate threshold for abstaining, the MSPs themselves need not have any direct frequency interpretation. Indeed, it is unclear how to even define calibration for the maximum logit, which is amenable to the same approaching of abstaining based on a threshold.
Comparison of MSP AUROC and Max Logit AUROC.
The correlation coefficients between average Q&A accuracy and average AUROC were and ( for MSP and Max Logit, respectively (Figure 2). One hypothesis is that the softmax function is lossy, so it is possible that useful signals are discarded in that process. On the other hand, the AUROC values themselves were slightly higher on average for MSP compared to Max Logit (61.7 vs 60.3), although not quite significantly ().
WinoGrande.
WinoGrande was by far the hardest dataset for our classification task (Table 3). Our best hypothesis for this discrepancy is that WinoGrande is intentionally adversarial and tries to “trick” the model. An illustrative question from this dataset is “Neil told Craig that he has to take care of the child for the day because did it last time.” Even for some humans, it could be unclear whether Neil is assuming responsibility or assigning responsibility.
| MSP | Max Logit | ||
|---|---|---|---|
| Dataset | Q&A accuracy | AUROC | AUROC |
| ARC-Challenge | 65.4 | 66.6 | 64.6 |
| HellaSwag | 53.9 | 63.1 | 61.6 |
| MMLU | 50.7 | 64.0 | 62.0 |
| TruthfulQA | 41.4 | 61.2 | 60.1 |
| WinoGrande | 57.9 | 53.3 | 53.8 |
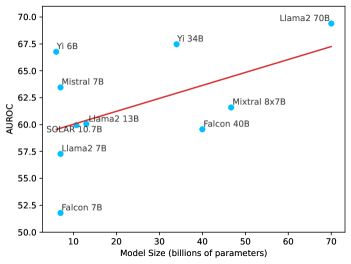
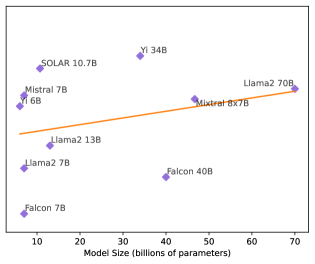
Minimal correlation between model size and AUROC.
The Pearson correlation coefficients between model size and AUROC were () and () for MSP and Max Logit, respectively (Figure 3). This suggests that adding more parameters does not directly improve the model’s representation of uncertainty, other than perhaps improving the model’s overall Q&A accuracy, which we know is correlated with AUROC.
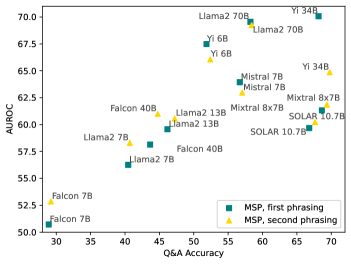
Impact of prompt phrasing.
Overall, the two phrasings in Figure 1 did not yield significantly different results (Figure 4). The largest difference was for the MSP classifier for Yi 34B, where the first phrasing achieved much higher AUROC, despite similar Q&A accuracy. However, both phrasings produced AUROC with for all datasets (Table 1), so the presence of an effect does not appear to depend on the phrasing (even if the magnitude of the effect differs in some cases).
5 Reducing wrong answers by abstention
5.1 Setup
In Section 4, we showed that the softmax probabilities and logits contain important statistical signals for predicting correctness. To demonstrate the practical relevance of this finding, we studied a second task where an “I don’t know” option was included in addition to the original answer options. For example, the prompts in Figure 1 would now include “E. I don’t know”.
For each classifier (MSP or Max Logit) and a given threshold, we conducted the following experiment. First, we showed the new question prompt (including the “I don’t know” option) to the base LLM, which is also allowed to abstain. Second, we computed the classifier value (MSP or maximum logit) based on the LLM’s initial response. Third, we defined the “augmented LLM response” as the original response if the classifier value exceeded the threshold, and otherwise as “I don’t know”.
For both the base LLM and augmented LLM, we awarded 1 point per correct answer, 0 points per abstention, and points per wrong answer, normalized by the total number of questions.999A more sophisticated scoring scheme based on the degree of wrongness is beyond the scope of this paper. We ran two versions of this experiment: once for (“balanced score”) and (“conservative score”). For , the benefit of a correct answer is equal to the cost of a wrong answer. However, in many situations, a wrong answer is significantly worse, justifying . (An even more extreme penalty of is used by Kang et al. (2023).)
Unlike when computing the AUROC, here we must choose a specific confidence threshold. To do so, we randomly split each dataset into train and test sets of equal size. For each model, we computed which threshold performed best on the train size and then used that threshold to evaluate performance on the test set. Note that we use a single test threshold each model, based on the average performance across the five datasets and two prompt phrasings.
5.2 Results
| Balanced | Conservative | |||||
|---|---|---|---|---|---|---|
| LLM | Base | MSP | Max Logit | Base | MSP | Max Logit |
| Falcon 7B | -40.4 | 0.0 | 0.0 | -108.8 | 0.0 | 0.0 |
| Falcon 40B | -9.7 | 1.9 | 0.7 | -63.2 | -0.5 | 0.0 |
| LLaMA 2 7B | -16.9 | -0.2 | 0.1 | -75.1 | 0.0 | 0.0 |
| LLaMA 2 13B | -7.9 | 6.6 | 6.6 | -61.8 | 1.2 | 0.2 |
| LLaMA 2 70B | 18.2 | 24.1 | 21.4 | -22.3 | 9.2 | 4.9 |
| Mistral 7B | 16.9 | 19.6 | 18.7 | -21.4 | 0.6 | 5.6 |
| Mixtral 8x7B | 37.6 | 38.1 | 38.3 | 9.5 | 17.3 | 17.2 |
| SOLAR 10.7B | 34.2 | 34.4 | 34.5 | 3.4 | 6.4 | 12.4 |
| Yi 6B | 2.6 | 12.2 | 10.2 | -43.0 | 4.0 | 1.8 |
| Yi 34B | 36.2 | 38.0 | 36.6 | 5.2 | 18.6 | 15.6 |
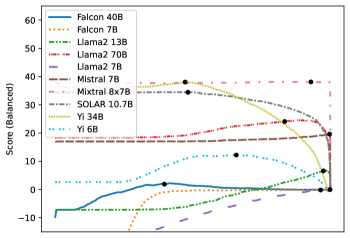
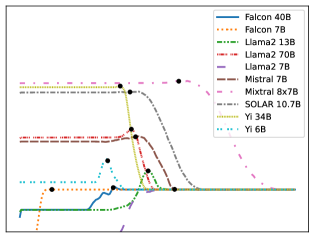
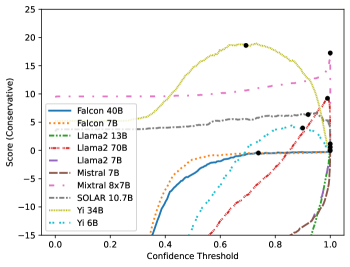
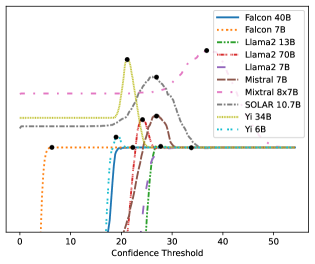
For each LLM, each classifier, and each , Table 4 reports the scores obtained by the base LLM and the augmented LLM on the test set, where the augmented LLM uses the threshold determined by training set. Figure 5 shows the performance of each model across the entire range of possible thresholds. A threshold of zero corresponds to the base LLM and the black dot indicates the threshold chosen during the training phase, i.e., the threshold used to compute the score in Table 4.
As expected, models with low initial scores exhibit the most dramatic improvements. For example, any model with a negative initial score can trivially improve to 0 by simply abstaining on every question. More generally, the higher the fraction of correct answers, the more likely the model is to accidentally abstain on a correct answer. As a result, it is unsurprising that the three best models show minimal improvements on the balanced score metric. However, our method still outperformed the base LLM in all conditions, and substantially outperformed the base LLM on the conservative score metric.
These results show how the uncertainty signals from softmax probabilities and/or logits can be leveraged to improve performance on practical language tasks.
6 Conclusion and future work
In this paper, we examined the ability of the MSP and maximum logit to quantify an LLM’s uncertainty in multiple-choice Q&A. We found a promising trend across ten of the most popular open-source LLMs today and five multiple-choice Q&A datasets: for models which perform well on the underlying Q&A task, the MSP and Max Logit classifiers predict whether the LLM’s response is correct statistically significantly better than random chance. While this finding does not directly increase the number of questions answered correctly, we show that adding a post-hoc “uncertainty check” layer that forces the LLMs to abstain given high uncertainty reduces the number of wrong answers significantly, without comparably reducing the number of right answers. We think that introducing this type of uncertainty check into existing LLM architectures – whether to require complete abstention or just to present a disclaimer on the model’s confidence in its answer – could be an important step for increasing LLM safety.
Our work offers a simple baseline for helping LLMs identify when they are facing unfamiliar situations in the context of multiple-choice Q&A. We are excited about future work which leverages these building blocks to develop more robust LLM OOD detection methods, both for Q&A tasks and for other contexts. We are also interested in better understanding when and why these methods fail: are there particular subcategories of unfamiliar situations are especially challenging to identify? For example, why was the WinoGrande dataset so much harder for our classification task?
Overall, we think that the deceptively simple idea of noticing unfamiliar situations and then acting cautiously could be a powerful tool for averting harmful misgeneralization.
Impact statement
The capabilities of AI systems have advanced rapidly over the past several years and will likely continue to grow. In order to ensure that AI is beneficial for society, we believe it is paramount to understand the risks of such systems, and take steps to address those risks. In this paper, we focus on one particular risk: harmful responses from LLMs. Our work makes a small contribution to the ongoing effort of identifying and averting such responses. We hope that our findings are of use to other researchers studying this same problem. We are also optimistic about the broader idea of identifying unfamiliar situations and then acting cautiously, and hope that our work contributes positively to the ongoing discourse on robust safety methods.
Acknowledgements
This work was supported in part by a gift from Open Philanthropy to the Center for Human-Compatible AI (CHAI) at UC Berkeley. We would like to thank Cassidy Laidlaw, Katie Kang, and Yaodong Yu for helpful discussions and feedback.
References
- 01-ai (2023) 01-ai. 01-ai/Yi-6B-Chat · Hugging Face, 2023. Accessed Jan 2024.
- Almazrouei et al. (2023) Almazrouei, E., Alobeidli, H., Alshamsi, A., Cappelli, A., Cojocaru, R., Debbah, M., Goffinet, E., Heslow, D., Launay, J., Malartic, Q., Noune, B., Pannier, B., and Penedo, G. Falcon-40B: an open large language model with state-of-the-art performance. 2023.
- Azaria & Mitchell (2023) Azaria, A. and Mitchell, T. The internal state of an llm knows when its lying. arXiv preprint arXiv:2304.13734, 2023.
- Baan et al. (2023) Baan, J., Daheim, N., Ilia, E., Ulmer, D., Li, H.-S., Fernández, R., Plank, B., Sennrich, R., Zerva, C., and Aziz, W. Uncertainty in natural language generation: From theory to applications. arXiv preprint arXiv:2307.15703, 2023.
- Beeching et al. (2023) Beeching, E., Fourrier, C., Habib, N., Han, S., Lambert, N., Rajani, N., Sanseviero, O., Tunstall, L., and Wolf, T. Open llm leaderboard. https://huggingface.co/spaces/HuggingFaceH4/open_llm_leaderboard, 2023.
- Bennet (2000) Bennet, P. N. Assessing the calibration of Naive Bayes’ posterior estimates. School of Computer Science, Carnegie Mellon University, 2000.
- Bonferroni (1936) Bonferroni, C. E. Teoria statistica delle classi e calcolo delle probabilità. Pubblicazioni del R Istituto Superiore di Scienze Economiche e Commerciali di Firenze, 8:3–62, 1936.
- Bradley (1997) Bradley, A. P. The use of the area under the ROC curve in the evaluation of machine learning algorithms. Pattern Recognition, 30(7):1145–1159, 1997. ISSN 0031-3203. doi: https://doi.org/10.1016/S0031-3203(96)00142-2.
- (9) Clark, P., Cowhey, I., Etzioni, O., Khot, T., Sabharwal, A., Schoenick, C., and Tafjord, O. Think you have Solved Question Answering? Try ARC, the AI2 Reasoning Challenge.
- Culotta & McCallum (2005) Culotta, A. and McCallum, A. Reducing labeling effort for structured prediction tasks. In AAAI, volume 5, pp. 746–751, 2005.
- DeGroot & Fienberg (1983) DeGroot, M. H. and Fienberg, S. E. The comparison and evaluation of forecasters. Journal of the Royal Statistical Society: Series D (The Statistician), 32(1-2):12–22, 1983.
- Desai & Durrett (2020) Desai, S. and Durrett, G. Calibration of pre-trained transformers. In Webber, B., Cohn, T., He, Y., and Liu, Y. (eds.), Proceedings of the 2020 Conference on Empirical Methods in Natural Language Processing (EMNLP), pp. 295–302, Online, November 2020. Association for Computational Linguistics. doi: 10.18653/v1/2020.emnlp-main.21.
- Dettmers et al. (2023) Dettmers, T., Pagnoni, A., Holtzman, A., and Zettlemoyer, L. Qlora: Efficient finetuning of quantized llms. arXiv preprint arXiv:2305.14314, 2023.
- Geng et al. (2023) Geng, J., Cai, F., Wang, Y., Koeppl, H., Nakov, P., and Gurevych, I. A survey of language model confidence estimation and calibration. arXiv preprint arXiv:2311.08298, 2023.
- Guo et al. (2017a) Guo, C., Pleiss, G., Sun, Y., and Weinberger, K. Q. On calibration of modern neural networks. In International conference on machine learning, pp. 1321–1330. PMLR, 2017a.
- Guo et al. (2017b) Guo, C., Pleiss, G., Sun, Y., and Weinberger, K. Q. On calibration of modern neural networks. In Proceedings of the 34th International Conference on Machine Learning - Volume 70, ICML’17, pp. 1321–1330, Sydney, NSW, Australia, August 2017b. JMLR.org.
- Hendrycks & Gimpel (2017) Hendrycks, D. and Gimpel, K. A Baseline for Detecting Misclassified and Out-of-Distribution Examples in Neural Networks. In Proceedings of the 5th International Conference on Learning Representations (ICLR ’17), October 2017.
- Hendrycks et al. (2020) Hendrycks, D., Liu, X., Wallace, E., Dziedzic, A., Krishnan, R., and Song, D. Pretrained transformers improve out-of-distribution robustness. arXiv preprint arXiv:2004.06100, 2020.
- Hendrycks et al. (2021) Hendrycks, D., Burns, C., Basart, S., Zou, A., Mazeika, M., Song, D., and Steinhardt, J. Measuring Massive Multitask Language Understanding. In Proceedings of the Ninth International Conference on Learning Representations (ICLR ’21), 2021.
- Hendrycks et al. (2022) Hendrycks, D., Basart, S., Mazeika, M., Zou, A., Kwon, J., Mostajabi, M., Steinhardt, J., and Song, D. Scaling Out-of-Distribution Detection for Real-World Settings. In Proceedings of the 39th International Conference on Machine Learning, pp. 8759–8773. PMLR, June 2022. ISSN: 2640-3498.
- Hu et al. (2023) Hu, M., Zhang, Z., Zhao, S., Huang, M., and Wu, B. Uncertainty in natural language processing: Sources, quantification, and applications. arXiv preprint arXiv:2306.04459, 2023.
- Jiang et al. (2023) Jiang, A. Q., Sablayrolles, A., Mensch, A., Bamford, C., Chaplot, D. S., Casas, D. d. l., Bressand, F., Lengyel, G., Lample, G., Saulnier, L., Lavaud, L. R., Lachaux, M.-A., Stock, P., Scao, T. L., Lavril, T., Wang, T., Lacroix, T., and Sayed, W. E. Mistral 7B, October 2023. arXiv:2310.06825 [cs].
- Jiang et al. (2024) Jiang, A. Q., Sablayrolles, A., Roux, A., Mensch, A., Savary, B., Bamford, C., Chaplot, D. S., Casas, D. d. l., Hanna, E. B., Bressand, F., et al. Mixtral of experts. arXiv preprint arXiv:2401.04088, 2024.
- Kadavath et al. (2022) Kadavath, S., Conerly, T., Askell, A., Henighan, T., Drain, D., Perez, E., Schiefer, N., Dodds, Z., DasSarma, N., Tran-Johnson, E., et al. Language models (mostly) know what they know. URL https://arxiv. org/abs/2207.05221, 5, 2022.
- Kang et al. (2023) Kang, K., Setlur, A., Tomlin, C., and Levine, S. Deep Neural Networks Tend To Extrapolate Predictably, October 2023. arXiv:2310.00873 [cs].
- Kim et al. (2023) Kim, D., Park, C., Kim, S., Lee, W., Song, W., Kim, Y., Kim, H., Kim, Y., Lee, H., Kim, J., Ahn, C., Yang, S., Lee, S., Park, H., Gim, G., Cha, M., Lee, H., and Kim, S. SOLAR 10.7B: Scaling Large Language Models with Simple yet Effective Depth Up-Scaling, December 2023. arXiv:2312.15166 [cs].
- Krause et al. (2023) Krause, L., Tufa, W., Santamaría, S. B., Daza, A., Khurana, U., and Vossen, P. Confidently wrong: Exploring the calibration and expression of (un) certainty of large language models in a multilingual setting. In Proceedings of the Workshop on Multimodal, Multilingual Natural Language Generation and Multilingual WebNLG Challenge (MM-NLG 2023), pp. 1–9, 2023.
- Lin et al. (2022a) Lin, S., Hilton, J., and Evans, O. Teaching models to express their uncertainty in words. arXiv preprint arXiv:2205.14334, 2022a.
- Lin et al. (2022b) Lin, S., Hilton, J., and Evans, O. TruthfulQA: Measuring How Models Mimic Human Falsehoods. In Muresan, S., Nakov, P., and Villavicencio, A. (eds.), Proceedings of the 60th Annual Meeting of the Association for Computational Linguistics (Volume 1: Long Papers), pp. 3214–3252, Dublin, Ireland, May 2022b. Association for Computational Linguistics. doi: 10.18653/v1/2022.acl-long.229.
- Lin et al. (2023) Lin, Z., Trivedi, S., and Sun, J. Generating with confidence: Uncertainty quantification for black-box large language models. arXiv preprint arXiv:2305.19187, 2023.
- Mangan (2023) Mangan, D. Judge sanctions lawyers for brief written by A.I. with fake citations. CNBC, June 2023. Accessed Jan 2024.
- Mann & Whitney (1947) Mann, H. B. and Whitney, D. R. On a test of whether one of two random variables is stochastically larger than the other. The annals of mathematical statistics, pp. 50–60, 1947.
- Mielke et al. (2022) Mielke, S. J., Szlam, A., Dinan, E., and Boureau, Y.-L. Reducing conversational agents’ overconfidence through linguistic calibration. Transactions of the Association for Computational Linguistics, 10:857–872, 2022.
- Nguyen & O’Connor (2015) Nguyen, K. and O’Connor, B. Posterior calibration and exploratory analysis for natural language processing models. arXiv preprint arXiv:1508.05154, 2015.
- Niculescu-Mizil & Caruana (2005) Niculescu-Mizil, A. and Caruana, R. Predicting good probabilities with supervised learning. In Proceedings of the 22nd international conference on Machine learning, pp. 625–632, 2005.
- OpenAI (2023) OpenAI. Gpt-4 technical report. arXiv preprint arXiv:2303.08774, 2023.
- Sakaguchi et al. (2021) Sakaguchi, K., Bras, R. L., Bhagavatula, C., and Choi, Y. WinoGrande: an adversarial winograd schema challenge at scale. Communications of the ACM, 64(9):99–106, August 2021. ISSN 0001-0782. doi: 10.1145/3474381.
- Scheffer et al. (2001) Scheffer, T., Decomain, C., and Wrobel, S. Active hidden markov models for information extraction. In International symposium on intelligent data analysis, pp. 309–318. Springer, 2001.
- Settles (2009) Settles, B. Active learning literature survey. 2009.
- Settles & Craven (2008) Settles, B. and Craven, M. An analysis of active learning strategies for sequence labeling tasks. In proceedings of the 2008 conference on empirical methods in natural language processing, pp. 1070–1079, 2008.
- Tharwat & Schenck (2023) Tharwat, A. and Schenck, W. A survey on active learning: State-of-the-art, practical challenges and research directions. Mathematics, 11(4):820, 2023.
- Tian et al. (2023) Tian, K., Mitchell, E., Zhou, A., Sharma, A., Rafailov, R., Yao, H., Finn, C., and Manning, C. D. Just ask for calibration: Strategies for eliciting calibrated confidence scores from language models fine-tuned with human feedback. arXiv preprint arXiv:2305.14975, 2023.
- Touvron et al. (2023) Touvron, H., Martin, L., Stone, K., Albert, P., Almahairi, A., Babaei, Y., Bashlykov, N., Batra, S., Bhargava, P., Bhosale, S., Bikel, D., Blecher, L., Ferrer, C. C., Chen, M., Cucurull, G., Esiobu, D., Fernandes, J., Fu, J., Fu, W., Fuller, B., Gao, C., Goswami, V., Goyal, N., Hartshorn, A., Hosseini, S., Hou, R., Inan, H., Kardas, M., Kerkez, V., Khabsa, M., Kloumann, I., Korenev, A., Koura, P. S., Lachaux, M.-A., Lavril, T., Lee, J., Liskovich, D., Lu, Y., Mao, Y., Martinet, X., Mihaylov, T., Mishra, P., Molybog, I., Nie, Y., Poulton, A., Reizenstein, J., Rungta, R., Saladi, K., Schelten, A., Silva, R., Smith, E. M., Subramanian, R., Tan, X. E., Tang, B., Taylor, R., Williams, A., Kuan, J. X., Xu, P., Yan, Z., Zarov, I., Zhang, Y., Fan, A., Kambadur, M., Narang, S., Rodriguez, A., Stojnic, R., Edunov, S., and Scialom, T. Llama 2: Open Foundation and Fine-Tuned Chat Models, July 2023. arXiv:2307.09288 [cs].
- Wilcoxon (1945) Wilcoxon, F. Individual comparisons by ranking methods. Biometrics, 1(6):80–83, 1945.
- Xiong et al. (2023) Xiong, M., Hu, Z., Lu, X., Li, Y., Fu, J., He, J., and Hooi, B. Can llms express their uncertainty? an empirical evaluation of confidence elicitation in llms. ArXiv preprint, abs/2306.13063, 2023.
- Yin et al. (2023) Yin, Z., Sun, Q., Guo, Q., Wu, J., Qiu, X., and Huang, X. Do large language models know what they don’t know? arXiv preprint arXiv:2305.18153, 2023.
- Zellers et al. (2019) Zellers, R., Holtzman, A., Bisk, Y., Farhadi, A., and Choi, Y. HellaSwag: Can a Machine Really Finish Your Sentence? In Korhonen, A., Traum, D., and Màrquez, L. (eds.), Proceedings of the 57th Annual Meeting of the Association for Computational Linguistics, pp. 4791–4800, Florence, Italy, July 2019. Association for Computational Linguistics. doi: 10.18653/v1/P19-1472.
- Zhang et al. (2023) Zhang, H., Diao, S., Lin, Y., Fung, Y. R., Lian, Q., Wang, X., Chen, Y., Ji, H., and Zhang, T. R-tuning: Teaching large language models to refuse unknown questions. arXiv preprint arXiv:2311.09677, 2023.
- Zhou et al. (2024) Zhou, K., Hwang, J. D., Ren, X., and Sap, M. Relying on the unreliable: The impact of language models’ reluctance to express uncertainty. arXiv preprint arXiv:2401.06730, 2024.
Appendix A Caveat for Falcon 7B
Initially, many of Falcon 7B’s responses fell into the “unparseable” category described in Section 3.2. Upon investigation, we found that many of these responses were simply a period or an end-of-text token. Removing the final newline in the prompt resolved this behavior, so we believe that this newline was somehow convincing the model that was conversation was “over”. These initial results had the side effect of making it very easy to detect wrong answers, since a solitary period is obviously not a correct answer. For this reason, we removed the final newline for Falcon 7B only. We considered removing the final newline for all models or excluding Falcon 7B entirely, but we felt that our chosen approach would be more scientifically honest. As Falcon 7B performed by far the worst on both Q&A and AUROC even with this concession, we do not think this decision holds much import, but we report it for transparency.
Appendix B Dataset-level results
For the curious reader, this section presents the full results for each dataset, including AUROC, Q&A accuracy, and scores on the “Q&A with an option to abstain” task.
| MSP | Max Logit | ||||
|---|---|---|---|---|---|
| LLM | Q&A Accuracy | AUROC | AUROC | ||
| Falcon 7B | 25.3 | 50.4 | 0/2 | 50.9 | 0/2 |
| Falcon 40B | 55.2 | 64.3 | 2/2 | 57.6 | 1/2 |
| LLaMA 2 7B | 45.9 | 63.4 | 2/2 | 61.3 | 2/2 |
| LLaMA 2 13B | 58.1 | 64.9 | 2/2 | 62.8 | 2/2 |
| LLaMA 2 70B | 74.4 | 77.8 | 2/2 | 69.2 | 2/2 |
| Mistral 7B | 70.9 | 67.9 | 2/2 | 67.8 | 2/2 |
| Mixtral 8x7B | 84.3 | 65.4 | 2/2 | 66.7 | 2/2 |
| SOLAR 10.7B | 80.8 | 61.4 | 2/2 | 70.8 | 2/2 |
| Yi 6B | 68.1 | 75.3 | 2/2 | 65.1 | 2/2 |
| Yi 34B | 84.6 | 70.7 | 2/2 | 73.2 | 2/2 |
| MSP | Max Logit | ||||
|---|---|---|---|---|---|
| LLM | Q&A Accuracy | AUROC | AUROC | ||
| Falcon 7B | 24.7 | 50.1 | 0/2 | 49.9 | 0/2 |
| Falcon 40B | 43.4 | 61.5 | 2/2 | 58.8 | 2/2 |
| LLaMA 2 7B | 40.9 | 58.5 | 2/2 | 54.7 | 1/2 |
| LLaMA 2 13B | 49.8 | 62.3 | 2/2 | 58.7 | 2/2 |
| LLaMA 2 70B | 64.3 | 70.0 | 2/2 | 64.4 | 2/2 |
| Mistral 7B | 51.8 | 62.8 | 2/2 | 62.3 | 2/2 |
| Mixtral 8x7B | 65.5 | 58.5 | 2/2 | 60.1 | 2/2 |
| SOLAR 10.7B | 78.8 | 63.1 | 2/2 | 67.1 | 2/2 |
| Yi 6B | 39.5 | 68.2 | 2/2 | 62.5 | 2/2 |
| Yi 34B | 75.5 | 73.7 | 2/2 | 67.0 | 2/2 |
| MSP | Max Logit | ||||
|---|---|---|---|---|---|
| LLM | Q&A Accuracy | AUROC | AUROC | ||
| Falcon 7B | 25.7 | 49.1 | 0/2 | 49.4 | 0/2 |
| Falcon 40B | 44.0 | 61.4 | 2/2 | 52.4 | 1/2 |
| LLaMA 2 7B | 40.2 | 62.2 | 2/2 | 59.3 | 2/2 |
| LLaMA 2 13B | 47.1 | 63.4 | 2/2 | 62.2 | 2/2 |
| LLaMA 2 70B | 56.3 | 71.3 | 2/2 | 64.8 | 2/2 |
| Mistral 7B | 52.7 | 64.5 | 2/2 | 64.3 | 2/2 |
| Mixtral 8x7B | 64.4 | 63.9 | 2/2 | 65.6 | 2/2 |
| SOLAR 10.7B | 57.4 | 62.5 | 2/2 | 68.5 | 2/2 |
| Yi 6B | 50.7 | 68.9 | 2/2 | 63.0 | 2/2 |
| Yi 34B | 64.0 | 66.0 | 2/2 | 66.2 | 2/2 |
| MSP | Max Logit | ||||
|---|---|---|---|---|---|
| LLM | Q&A Accuracy | AUROC | AUROC | ||
| Falcon 7B | 19.8 | 59.5 | 1/2 | 58.1 | 0/2 |
| Falcon 40B | 26.9 | 59.3 | 1/2 | 56.5 | 0/2 |
| LLaMA 2 7B | 24.9 | 51.2 | 0/2 | 53.3 | 0/2 |
| LLaMA 2 13B | 26.4 | 57.9 | 0/2 | 54.4 | 0/2 |
| LLaMA 2 70B | 44.5 | 72.1 | 2/2 | 66.8 | 2/2 |
| Mistral 7B | 54.5 | 68.1 | 2/2 | 65.1 | 2/2 |
| Mixtral 8x7B | 67.6 | 66.4 | 2/2 | 64.9 | 2/2 |
| SOLAR 10.7B | 49.9 | 57.7 | 1/2 | 62.3 | 2/2 |
| Yi 6B | 44.2 | 64.9 | 2/2 | 62.6 | 2/2 |
| Yi 34B | 53.7 | 67.7 | 2/2 | 65.5 | 2/2 |
| MSP | Max Logit | ||||
|---|---|---|---|---|---|
| LLM | Q&A Accuracy | AUROC | AUROC | ||
| Falcon 7B | 49.8 | 49.8 | 0/2 | 50.2 | 0/2 |
| Falcon 40B | 51.5 | 51.2 | 0/2 | 50.4 | 0/2 |
| LLaMA 2 7B | 50.9 | 51.0 | 0/2 | 51.1 | 0/2 |
| LLaMA 2 13B | 52.1 | 51.9 | 0/2 | 52.1 | 0/2 |
| LLaMA 2 70B | 52.2 | 55.9 | 2/2 | 51.5 | 0/2 |
| Mistral 7B | 54.4 | 54.0 | 2/2 | 54.0 | 2/2 |
| Mixtral 8x7B | 63.2 | 53.7 | 2/2 | 54.6 | 2/2 |
| SOLAR 10.7B | 69.2 | 55.1 | 2/2 | 57.4 | 2/2 |
| Yi 6B | 58.1 | 56.6 | 2/2 | 55.4 | 2/2 |
| Yi 34B | 67.1 | 59.2 | 2/2 | 60.1 | 2/2 |
| Balanced Score | Conservative Score | |||||
|---|---|---|---|---|---|---|
| LLM | Base LLM | MSP | Max Logit | Base LLM | MSP | Max Logit |
| Falcon 7B | -46.5 | -0.2 | 0.0 | -118.3 | 0.0 | 0.0 |
| Falcon 40B | 16.3 | 19.7 | 18.3 | -24.2 | 2.5 | 1.0 |
| LLaMA 2 7B | -6.4 | 8.0 | 4.8 | -59.6 | 0.8 | -0.2 |
| LLaMA 2 13B | 14.7 | 21.0 | 22.5 | -28.0 | 12.4 | 9.9 |
| LLaMA 2 70B | 49.7 | 52.6 | 51.1 | 24.9 | 40.5 | 32.5 |
| Mistral 7B | 46.3 | 45.2 | 45.4 | 21.2 | 28.6 | 29.2 |
| Mixtral 8x7B | 66.0 | 65.6 | 65.8 | 51.0 | 51.9 | 51.4 |
| SOLAR 10.7B | 62.0 | 62.2 | 62.5 | 44.4 | 44.7 | 48.8 |
| Yi 6B | 34.3 | 37.9 | 35.5 | 2.2 | 24.1 | 16.9 |
| Yi 34B | 66.6 | 67.5 | 66.6 | 50.9 | 55.8 | 53.9 |
| Balanced Score | Conservative Score | |||||
|---|---|---|---|---|---|---|
| LLM | Base LLM | MSP | Max Logit | Base LLM | MSP | Max Logit |
| Falcon 7B | -50.0 | 0.0 | 0.0 | -125.0 | -0.1 | 0.0 |
| Falcon 40B | -16.9 | 1.9 | 1.3 | -74.9 | -1.0 | -0.3 |
| LLaMA 2 7B | -14.2 | 2.5 | 0.0 | -71.2 | 0.0 | 0.0 |
| LLaMA 2 13B | -6.1 | 9.5 | 8.2 | -59.2 | 3.3 | 0.0 |
| LLaMA 2 70B | 28.1 | 32.8 | 31.2 | -7.9 | 17.9 | 11.1 |
| Mistral 7B | 11.5 | 15.2 | 15.6 | -28.2 | 0.0 | 3.2 |
| Mixtral 8x7B | 36.5 | 37.0 | 36.6 | 8.2 | 15.1 | 14.6 |
| SOLAR 10.7B | 60.8 | 61.3 | 61.3 | 43.1 | 44.3 | 46.1 |
| Yi 6B | -26.2 | 3.8 | 1.3 | -85.9 | 0.4 | 0.0 |
| Yi 34B | 46.4 | 47.1 | 46.4 | 20.9 | 31.7 | 26.2 |
| Balanced Score | Conservative Score | |||||
|---|---|---|---|---|---|---|
| LLM | Base LLM | MSP | Max Logit | Base LLM | MSP | Max Logit |
| Falcon 7B | -47.2 | 0.0 | 0.0 | -119.2 | -0.1 | 0.0 |
| Falcon 40B | -10.4 | 3.7 | 0.1 | -63.1 | 0.0 | -0.2 |
| LLaMA 2 7B | -18.6 | 3.0 | -0.1 | -77.6 | 0.0 | 0.1 |
| LLaMA 2 13B | -7.5 | 10.4 | 9.4 | -61.3 | 5.0 | 3.8 |
| LLaMA 2 70B | 11.3 | 22.0 | 17.8 | -32.6 | 10.9 | 4.0 |
| Mistral 7B | 9.0 | 17.2 | 16.9 | -33.8 | 0.0 | 4.4 |
| Mixtral 8x7B | 28.2 | 30.2 | 31.6 | -5.5 | 11.0 | 13.8 |
| SOLAR 10.7B | 14.6 | 17.0 | 21.0 | -25.7 | 4.5 | 8.4 |
| Yi 6B | -0.8 | 12.6 | 7.2 | -49.8 | 5.2 | 3.3 |
| Yi 34B | 28.6 | 31.2 | 30.2 | -5.8 | 13.4 | 10.1 |
| Balanced Score | Conservative Score | |||||
|---|---|---|---|---|---|---|
| LLM | Base LLM | MSP | Max Logit | Base LLM | MSP | Max Logit |
| Falcon 7B | -57.2 | 0.0 | 0.1 | -135.1 | -0.1 | 0.1 |
| Falcon 40B | -41.2 | -2.3 | -0.5 | -111.3 | 0.1 | 0.0 |
| LLaMA 2 7B | -47.5 | 0.0 | -0.1 | -121.1 | 0.0 | -0.2 |
| LLaMA 2 13B | -45.3 | 0.0 | 0.2 | -117.5 | 0.0 | 0.0 |
| LLaMA 2 70B | -11.6 | 7.1 | 7.2 | -67.3 | 2.0 | 5.0 |
| Mistral 7B | 4.4 | 12.2 | 10.4 | -39.7 | 0.0 | 0.0 |
| Mixtral 8x7B | 31.7 | 33.8 | 34.3 | 0.9 | 16.0 | 11.5 |
| SOLAR 10.7B | -2.8 | -1.7 | 3.2 | -51.0 | 0.0 | 0.0 |
| Yi 6B | -10.5 | 3.5 | 1.5 | -62.5 | -2.4 | -0.2 |
| Yi 34B | 5.1 | 14.2 | 12.9 | -42.0 | 7.3 | 4.0 |
| Balanced Score | Conservative Score | |||||
|---|---|---|---|---|---|---|
| LLM | Base LLM | MSP | Max Logit | Base LLM | MSP | Max Logit |
| Falcon 7B | -1.0 | -0.3 | 0.0 | -46.6 | 0.0 | -0.1 |
| Falcon 40B | 3.7 | 3.6 | 3.7 | -42.6 | -0.4 | 0.0 |
| LLaMA 2 7B | 2.4 | 2.8 | 2.4 | -46.2 | 0.0 | 0.0 |
| LLaMA 2 13B | 4.6 | 5.4 | 5.1 | -42.8 | 0.0 | 0.0 |
| LLaMA 2 70B | 13.4 | 13.5 | 13.6 | -28.4 | -1.2 | -0.3 |
| Mistral 7B | 13.2 | 13.3 | 13.1 | -26.6 | 0.0 | 1.6 |
| Mixtral 8x7B | 25.7 | 25.7 | 25.6 | -7.2 | 2.8 | 3.8 |
| SOLAR 10.7B | 36.3 | 36.3 | 36.4 | 6.0 | 4.9 | 8.1 |
| Yi 6B | 16.2 | 16.6 | 16.2 | -19.0 | 1.2 | 0.0 |
| Yi 34B | 34.4 | 34.4 | 34.6 | 2.1 | 6.6 | 10.5 |