Enhancing Real-World Complex Network Representations with Hyperedge Augmentation
Abstract.
Graph augmentation methods play a crucial role in improving the performance and enhancing generalisation capabilities in Graph Neural Networks (GNNs). Existing graph augmentation methods mainly perturb the graph structures and are usually limited to pairwise node relations. These methods cannot fully address the complexities of real-world large-scale networks that often involve higher-order node relations beyond only being pairwise. Meanwhile, real-world graph datasets are predominantly modelled as simple graphs, due to the scarcity of data that can be used to form higher-order edges. Therefore, reconfiguring the higher-order edges as an integration into graph augmentation strategies lights up a promising research path to address the aforementioned issues. In this paper, we present Hyperedge Augmentation (HyperAug), a novel graph augmentation method that constructs virtual hyperedges directly form the raw data, and produces auxiliary node features by extracting from the virtual hyperedge information, which are used for enhancing GNN performances on downstream tasks. We design three diverse virtual hyperedge construction strategies to accompany the augmentation scheme: (1) via graph statistics, (2) from multiple data perspectives, and (3) utilising multi-modality. Furthermore, to facilitate HyperAug evaluation, we provide 23 novel real-world graph datasets across various domains including social media, biology, and e-commerce. Our empirical study shows that HyperAug consistently and significantly outperforms GNN baselines and other graph augmentation methods, across a variety of application contexts, which clearly indicates that it can effectively incorporate higher-order node relations into graph augmentation methods for real-world complex networks. Specifically, on the Amazon datasets, our method surpass the GCN baseline by an average of 37.0%, outperform the GAT baseline by an average of 30.8%, and exceed the GraphSAGE baseline by an average of 33.8%.
1. Introduction
Graph Neural Networks (GNNs) (Kipf and Welling, 2017; Hamilton et al., 2017; Veličković et al., 2018; Brody et al., 2022; Zeng et al., 2020) are powerful tools for learning the representation of relationships between objects, ranging from social networks (Monti et al., 2019), biology (Rozemberczki et al., 2021) to e-commerce (McAuley et al., 2015; He and McAuley, 2016; Ni et al., 2019). Representation learning tasks, such as node prediction, constitute a major category of tasks for Graph Neural Networks (GNNs). However, limitations in the generalisability of GNNs have obstructed their broader application in real-world settings (Rusch et al., 2023).
Several graph augmentation techniques have been introduced to enhance the performance and foster better generalisation for GNNs, specifically in the context of node prediction tasks invovling large graphs. Current graph augmentation methods include graph structures perturbation (Rong et al., 2020; Ding et al., 2022), feature perturbation (Feng et al., 2019a), and label-oriented augmentations (Han et al., 2022; Wang et al., 2021). Simple-GNNs – GNNs that operate on simple graphs with only pairwise relations, normally use perturbation-based augmentation techniques. However, these augmentation methods do not adequately grasp the complexities of real-world, large-scale networks that frequently display intricate node relationships beyond having only pairwise connections. While Hypergraph Neural Networks (hyper-GNNs) (Yadati et al., 2019; Dong et al., 2020; Wang et al., 2023) have been developed to model higher-order node relations, they encounter a significant challenge due to the scarcity of explicitly recorded data to form high-order edges in many real-world datasets. This scarcity hampers the direct application of hyper-GNNs, as they rely on comprehensive data that captures complex node relations.
Although the scarcity of higher-order edges presents a challenge, integrating advanced modeling methods into augmentation strategies offers a promising avenue to address this issue. Traditionally, graph augmentation has focused on first-order connections, primarily modifying or adding direct links between nodes (Rong et al., 2020; Ding et al., 2022). However, this approach overlooks the rich, multi-level interactions captured in higher-order edges, which encompass indirect connections, such as patterns of group interactions within the networks. By incorporating these higher-order relations, graph augmentation can achieve a more nuanced understanding of network dynamics, revealing hidden structures and patterns that are not apparent in direct links alone. This approach is particularly beneficial in real-world complex networks, where the interplay of various types of connections can provide deeper insights into the underlying system, across a wide range of domains including social media, biological ecosystems and e-commerce network. The integration of higher-order edge information into graph augmentation strategies therefore opens up new possibilities for more sophisticated and accurate network analysis.
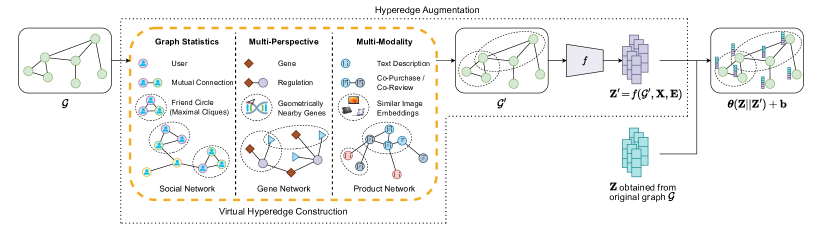
In our study, we introduce a suite of graph augmentation techniques that extend beyond conventional approaches. Our methodology encompasses higher-order node relations, and we present a novel graph augmentation strategy termed Hyperedge Augmentation (HyperAug). As illustrated in Figure 1, HyperAug employs a two-step augmentation mechanism. First, HyperAug constructs virtual hyperedges from the original graph. Second, HyperAug further processes the virtual hyperedges through a feature extraction function ( in Figure 1) to produce auxiliary node embeddings. These auxiliary embeddings can then be used by GNNs to improve their robustness and accuracy on downstream tasks. We present three distinct ways for constructing these virtual hyperedges: (1) via graph statistics, (2) from multiple data perspectives, and (3) using multiple data modalities. Our augmentation schemes showcase notable flexibility across a variety of datasets, catering to diverse applications such as social, biological, e-commerce, and knowledge networks. Our main contributions are as follows:
-
•
We introduce HyperAug, a novel data augmentation method for GNNs on node prediction tasks. HyperAug allows the network to integrate high-order edge information. Along with our method, we also release 23 new datasets, encompassing diverse domains including social media, biological networks as well as e-commerce graphs.
-
•
We assess various design choices within HyperAug, including different methods for constructing virtual hyperedges and varying feature extraction functions. Our examination of diverse HyperAug variants across multiple GNNs and prediction tasks underscores HyperAug’s versatility for various application contexts.
-
•
Through a comprehensive empirical evaluation on various real-world datasets and GNN architectures, we demonstrate that HyperAug offers consistent and significant performance improvements. For example, on the Amazon datasets, HyperAug boosts the node prediction accuracy of GCN (Kipf and Welling, 2017) by an average of 37.0%, GAT (Veličković et al., 2018) by an average of 30.8%, and GraphSAGE (Hamilton et al., 2017) by an average of 33.8%.
2. Related Work
Graph Neural Networks for Simple Graphs
Graph Neural Networks (GNNs) on simple graphs encode the nodes through neural networks and learn the representations of the nodes through message-passing within the graph structure. GCN incorporates the convolution operation in computer vision into GNNs (Kipf and Welling, 2017) . GAT (Veličković et al., 2018) and GATv2 (Brody et al., 2022) are another family of GNN variants that focus on improving the expressive power of GNNs by using the attention mechanism. GraphSAGE (Hamilton et al., 2017) is a general inductive framework that leverages node information to efficiently generate node embeddings for previously unseen data. GraphSAINT (Zeng et al., 2020) underscores the significance of graph sampling-based inductive learning – it utilises diverse graph sampling techniques and illustrates how learning on smaller, sampled graphs can enhance training efficiency, particularly with large graphs. While these models demonstrate the success on simple graph datasets, they continue to face challenges in their generalisation to unseen data and are susceptible to small variations in graph structures (Cai and Wang, 2020).
Data Augmentation Methods for GNNs
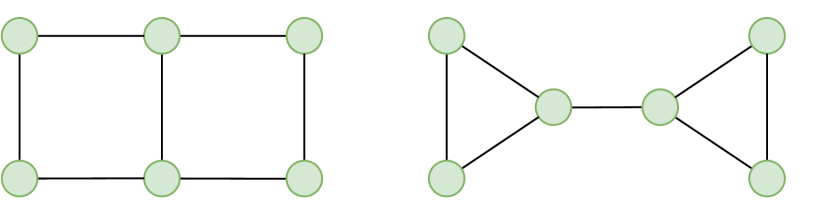
Enhancing the generalisability of GNNs through graph augmentation methods remains a key area of research interest in recent years. Existing graph augmentation methods introduce perturbations to the graph structure, enabling GNNs trained on these altered graphs to learn and capture invariances. This includes adding perturbations to the graphs’ adjacency matrices through DropEdge (Rong et al., 2020), randomly removing nodes through DropNode (You et al., 2020; Ding et al., 2022), and perturbing node edge features through feature masking. Another line of graph augmentations relies on the generation of synthetic data, which can be acheived through the interpolation of existing data via Mixup (Zhang et al., 2018; Han et al., 2022; Wang et al., 2021), or using generative models to enrich the training data (Liu et al., 2023). However, these existing augmentation strategies do not inherently increase the expressiveness of GNNs. Standard GNNs typically aggregate information from their neighbourhoods, a process that shares limitations with the Weisfeiler-Lehman (1-WL) graph isomorphism test (Weisfeiler and Leman, 1968; Xu et al., 2019; Hamilton, 2020). For instance, as depicted in Figure 2(a), simple-GNNs fail to distinguish between two structurally different graphs with the same node degrees due to this limitation. This research aims to develop augmentation-based methods that address and overcome these constraints, thereby enhancing the capabilities of GNNs beyond their current limits.
Representation Learning on Hypergraphs
Hypergraphs are designed to capture more complex node relations, where an edge can connect two or more nodes. In general, GNNs for hypergraphs optimise the node representation through a two-step process. Initially, the node embeddings within each hyperedge are aggregated to form a hidden embedding of each hyperedge. Subsequently, the hidden embeddings of hyperedges with common nodes are aggregated to update the representations of their common nodes. Both HGNN (Feng et al., 2019b) and HyperConv (Bai et al., 2021) precisely follow this process. The expressiveness of hypergraph GNNs could be enhanced by modifying this procedure. For instance, HyperGCN (Yadati et al., 2019) refines the node aggregation within hyperedges using mediators (Chan and Liang, 2020). HyperAtten (Bai et al., 2021) uses attention to measure the degree to which a node belongs to a hyperedge. HNHN (Dong et al., 2020) applies nonlinear functions to both node and edge aggregation processes. ED-HNN (Wang et al., 2023) approximates continuous equivariant hypergraph diffusion operators on hypergraphs by feeding node representations into the message from hyperedges to nodes. GNNs designed for hypergraphs are effective in modelling complex networks. However, real-world datasets are predominantly recorded as simple graphs, which has limited the application of hyper-GNNs due to the scarcity of data that can form hyperedges. In this study, we propose HyperAug that derives hyperedges directly from the raw data, thereby extending the applicability of hypergraph GNNs to cases where only conventional simple graph data is available. By utilising higher-order GNNs on virtually established hyperedges to produce auxiliary features, HyperAug effectively broadens the potential of hyperedges to scenarios previously confined to simple graph data.
3. Method
3.1. Hyperedge Construction
| Name | #Graphs | Avg. #Nodes | Avg. #Edges | Avg. #Hyperedges | Avg. Node Degree | Avg. Hyperedge Degree | #Classes |
| MUSAE-GitHub | 1 | 37,700 | 578,006 | 223,672 | 30.7 | 4.6 | 4 |
| MUSAE-Facebook | 1 | 22,470 | 342,004 | 236,663 | 30.4 | 9.9 | 4 |
| MUSAE-Twitch | 6 | 5,686 | 143,038 | 110,142 | 50.6 | 6.0 | 2 |
| MUSAE-Wiki | 3 | 6,370 | 266,998 | 118,920 | 88.8 | 14.4 | Regression |
| GRAND-Tissues | 6 | 5,931 | 5,926 | 11,472 | 2.0 | 1.3 | 3 |
| GRAND-Diseases | 4 | 4,596 | 6,252 | 7,743 | 2.7 | 1.3 | 3 |
| Cora | 2 | 2,708 | 5,429 | 1,326 | 4.0 | 3.5 | 7 |
| Pubmed | 1 | 19,717 | 44,338 | 7,963 | 4.5 | 4.3 | 3 |
| Amazon-Computers | 1 | 10,226 | 55,324 | 10,226 | 10.8 | 4.0 | 10 |
| Amazon-Photos | 1 | 6,777 | 45,306 | 6,777 | 13.4 | 4.8 | 10 |
Formally, a simple graph is a collection of nodes and edges between pairs of nodes. This graph abstraction assumes that each edge only connects two nodes. However, as discussed in the previous sections, many real-world networks have more complex node relations than just pairwise relations. Inspired by the hypergraph modelling, HyperAug attempts to capture such complex relations, by incorporating virtual hyperedges—edges that can connect more than two nodes—into the network. Specifically, HyperAug augments a simple graph by constructing a set of virtual hyperedges from the original graph, producing an augmented graph . Each hyperedge is a non-empty subset of , which contains at least three nodes, thereby capturing complex multi-node relations. Depending on the nature of the original graph, the virtual hyperedges can be constructed in one of the following three ways: from the graph statistics, from a different data perspective, or from a different data modality.
From the Graph Statistics.
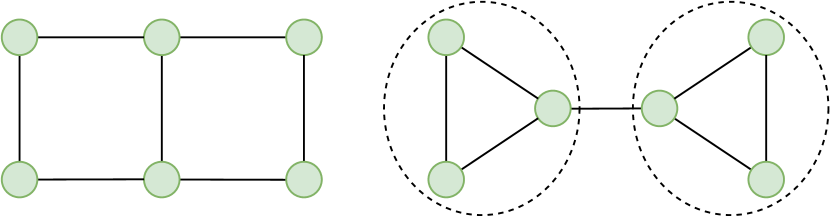
For graphs that can reveal valuable information from their local clusters and cliques, such as the social networks, HyperAug constructs virtual hyperedges by computing from graph statistics, such as maximal cliques. HyperAug then groups those nodes within the same maximal cliques. This virtual hyperedge augmentation acts as a complement to the simple edges in the original graph by calculating the local clustering relationships amongst the nodes. This approach enables GNNs seeking to utilise local clustering information to rapidly access that information without needing to explicitly pre-compute it. In addition, by separating out the local clusters and cliques from the simple edge adjacency of the original graph, HyperAug can prevent GNNs from mixing up those information, thereby potentially enhancing its training performance. Another crucial advantage for this type of augmentation is that it enables GNNs to overcome the expressiveness limitations posed by the Weisfeiler-Lehman (1-WL) graph isomorphism test (Weisfeiler and Leman, 1968; Xu et al., 2019; Hamilton, 2020): it is able to help GNNs distinguish non-isomorphic graphs with identical node degrees, by specifying their distinct maximal cliques, as illustrated in Figure 2.
From a different Data Perspective.
Many graphs carry information from different data perspectives. Stacking various types of information from different data perspectives, whether as the graph’s node features or edges, can potentially make the learning challenging, since the underlying GNN would then have to learn from these manually mixed information. Real-world examples of such graphs include the biological networks, where both entity-entity interactions and geometrical information are critical to the prediction tasks. For example, gene regulatory interactions might be represented as an adjacency matrix, while the spatial positioning of genes can be used to establish higher-order relationships. The data inherently offer multiple ways for connecting entities within a graph. In this scenario, HyperAug constructs virtual hyperedges by extracting information, preferably featuring multi-node relations, from a different data perspective than the node embeddings and edges. These hyperedges can then be processed separately from the node embeddings and edge adjacency, which are derived from a different data perspective, and ultimately serve as auxiliary node embeddings for the prediction tasks. This type of virtual hyperedge augmentation serves not only as a complement to to the simple edges, but also as an enhancement to the overall information obtained – this additional information is from a different data source that contain high-order node realtion that cannot be simply captured by the simple edges or node embeddings of the original graph.
From a different Data Modality.
For graphs that incorporate information from various data modalities, such as product networks containing both textual and image data, effectively integrating the information from different data modalities can be challenging for a GNN. Similar to the previous scenario, HyperAug addresses this by constructing virtual hyperedges using information from one of the data modalities, preferably exhibiting multi-node relations, which are distinct from the other data modalities used by node embeddings and edges. With this approach, information from different data modalities can be processed independently, and the data from the additional modality essentially serve as an augmentation. Note that this differs from simply incorporating an additional data source into the node embedding, as the alternative data modality may only convey ‘grouping’ information, which is more suitably represented as higher-order graph relations, such as virtual hyperedges. As the virtual hyperedges are constructed from a different modality, this type of virtual hyperedge augmentation provides both a complement to the simple edges of the original graph, and an enhancement to the overall information.
In graph representation learning, while the simple edges of the graph can be represented as an adjacency matrix , where if and 0 otherwise, the virtual hyperedges of the augmented graph can be represented as an incidence matrix , with each entry if and 0 otherwise. The augmented graph is then further processed to produce the final auxiliary features for the original graph’s nodes.
3.2. Utilising the Hyperedge Information
In order to thoroughly and appropriately utilise the additional information from HyperAug’s virtual hyperedges, we introduce a feature extraction function that operates specifically on the augmented graph with virtual hyperedges , and outputs a set of auxiliary node features :
| (1) |
where denotes the node feature matrix of the graph, with each row being the -dimensional features of node , and denotes the edge feature matrix of the graph, with each row being the -dimensional features of edge . To integrate the auxiliary features into the node embeddings obtained from the original graph , we employ a simple mechanism: concatenating the original node embeddings and the auxiliary features , regularised by a linear layer with weights and bias , as defined in the following equation:
| (2) |
The final augmented node embeddings are then used for the downstream prediction tasks. The complete HyperAug pipeline is illustrated in Figure 1. While this flexible HyperAug pipeline allows other mechanisms for integrating the auxiliary features into the original graph than using a linear layer, it is worth pointing out that this work primarily focuses on exploring the potential of leveraging GNN performance through incorporating higher-order node relations into the original graphs. Designing fine-grained feature integration mechanisms is not the main focus of this research.
4. Experiments
4.1. Datasets
| Method | GitHub | Brain | Computers |
| GCN | 87.2 0.0 | 62.5 0.0 | 75.6 4.1 |
| GCN+HyperAug(HyperConv, input) | 86.9 0.3 | 63.6 1.3 | 96.0 0.5 |
| GCN+HyperAug(ED-HNN, input) | 87.1 0.5 | 63.6 1.3 | 95.8 0.4 |
| GCN+HyperAug(HyperConv, emb.) | 87.2 0.0 | 63.7 0.2 | 96.8 0.5 |
| GCN+HyperAug(ED-HNN, emb.) | 87.4 0.3 | 66.7 2.6 | 98.1 0.7 |
To our knowledge, there is a deficiency in the quantity and variety of widely-accepted graph datasets that support data augmentation beyond simple graphs. This is largely attributable to the scarcity of explicitly labelled higher-order node relationships. In order to thoroughly evaluate the effectiveness of HyperAug across varied domains, we build 23 novel graph datasets derived from real-world networks across varied domains, including social media, biology, and e-commerce. Care has been taken to ensure that the datasets do not contain any personally identifiable information. The 23 datasets can be splitted into three groups according to the intended virtual hyperedge construction process for HyperAug:
MUSAE
We build eight social networks derived from the Facebook pages, GitHub developers and Twitch gamers, plus three English Wikipedia page-page networks on specific topics (chameleons, crocodiles and squirrels) based on MUSAE (Rozemberczki et al., 2021). Nodes represent users or articles, and edges are mutual followers relationships between the users, or mutual links between the articles. These datasets are intended to assess HyperAug’s effectiveness in constructing virtual hyperedges from the graph statistics: on these datasets, HyperAug constructs the virtual hyperedges to be mutually connected sub-groups that contain at least three nodes (i.e., maximal cliques with sizes of at least 3).
GRAND
We select and build ten gene regulatory networks in different tissues and diseases from GRAND (Ben Guebila et al., 2022), a public database for gene regulation. Nodes represent gene regulatory elements (Maston et al., 2006), and edges are regulatory effects between genes. Node features are extracted based on the gene sequences. These datasets are intended to assess HyperAug’s effectiveness in constructing virtual hyperedges from a different data perspective: on these datasets, HyperAug constructs the virtual hyperedges by grouping geometrically nearby genomic elements on the chromosomes, i.e., the genomic elements within 200k base pair distance.
Amazon
Following existing works on graph representation learning on e-commerce networks (Shchur et al., 2018; Zeng et al., 2020), we faithfully reconstruct a subset of the OGB (Hu et al., 2020) ogbn-products dataset, and build two product co-purchase/co-review networks based on the Amazon Product Reviews dataset (McAuley et al., 2015; He and McAuley, 2016; Ni et al., 2019). Nodes represent products, and an edge between two products is established if a user buys or writes reviews for both products. Node features are extracted based on the textual description of the products. These datasets are intended to assess HyperAug’s effectiveness in constructing virtual hyperedges from a different data modality: on these datasets, HyperAug introduces the image modality into the construction of virtual hyperedges. To be specific, the raw images of the products are fed into a CLIP (Radford et al., 2021) classifier, and a 512-dimensional feature embedding for each image is returned to assist the clustering. HyperAug then constructs the virtual hyperedges by grouping products whose image embeddings have pairwise distances within a certain threshold.
In addition to the 23 novel datasets, we also adopt three commonly used citation datasets: Cora-CoCitation, Cora-CoAuthorship, and Pubmed-CoCitation, to match HyperAug’s performance with the community standard. We use these three datasets to also assess HyperAug’s effectiveness in constructing virtual hyperedges from a different data perspective: the edges of the original graph and the virtual hyperedges constructed by HyperAug are co-citation links and co-authorship groups respectively, or vice versa (i.e., co-authorship links and co-citation groups). Table 1 reports the key graph statistics for each dataset group, and more details of the used datasets are described in Appendix B. We make our source code and full datasets publicly available at https://anonymous-url/.
4.2. Designing HyperAug: Placement Choices and Feature Extraction Techniques
| Method | GitHub | Brain | Computers |
| GCN | 87.2 0.0 | 62.5 0.0 | 75.6 4.1 |
| GCN+HyperAug(GAT) | 86.7 0.1 | 62.5 0.3 | 91.3 0.1 |
| GCN+HyperAug(GraphSAGE) | 87.0 0.4 | 65.3 0.9 | 93.0 0.0 |
| GCN+HyperAug(HyperConv) | 87.2 0.0 | 63.7 0.2 | 96.8 0.5 |
| GCN+HyperAug(ED-HNN) | 87.4 0.3 | 66.7 2.6 | 98.1 0.7 |
4.2.1. Appropriate Phase for Applying HyperAug
Before conducting the full evaluation on HyperAug, we analyse the optimal usage of HyperAug through a series of ablation studies. The auxiliary features generated by HyperAug provide significant flexibility regarding the stage of integration, including simultaneous injection with the input or blending with the original GNN’s activations. To thoroughly identify the appropriate place for inserting HyperAug’s auxiliary features, we compare the performance of HyperAug with the following settings: (1) concatenate HyperAug’s auxiliary features directly with the input, proceed the concatenated features with a linear layer, then feed into the GNN (denoted as HyperAug(, input), where is the feature extraction function); (2) concatenate HyperAug’s auxiliary features with the GNN activations, followed by a linear layer (denoted as HyperAug(, emb.)). This ablation study is conducted on the MUSAE-GitHub, GRAND-Brain and Amazon-Computers datasets, each featuring a distinct virtual hyperedge construction strategy. These augmetnations are then used on top of a GCN (Kipf and Welling, 2017). HyperConv (Bai et al., 2021) and ED-HNN (Wang et al., 2023) are selected as the feature extraction functions for HyperAug, since HyperConv is one of the most classic hyper-GNN baseline, and ED-HNN is known as the state-of-the-art in hyper-GNNs up to the point of this research.
Table 2 summarises the results for this set of ablation studies. The results show a consistent and much more significant increase in accuracy for GCN with HyperAug(, emb.), compared with the vanilla GCN and GCN with HyperAug(, input), demonstrating that inserting HyperAug’s auxiliary features at the output embedding phase is the more appropriate choice. Inserting HyperAug’s auxiliary features at the input phase does not guarantee to leverage GCN’s performance. This is because concatenating the auxiliary features with the node features at the input phase can potentially mix-up those different types of information, and confuses the GNNs. This also contradicts the intuition behind HyperAug.
4.2.2. Choice of the Feature Extraction Function in HyperAug
It is intuitive to use hyper-GNNs as feature extraction functions in HyperAug, so that the virtual hyperedge information can be fully captured. However, it is still worth verifying that hyper-GNNs indeed outperform simple-GNNs as feature extraction functions in HyperAug, in order to prove the efficacy of HyperAug. Therefore, we compare the performance of HyperAug with different classes of GNNs as the feature extraction function , denoted as HyperAug(): (1) hyper-GNNs, namely HyperConv and ED-HNN; (2) simple-GNNs, namely GAT (Veličković et al., 2018) and GraphSAGE (Hamilton et al., 2017). These ablation experiments are again conducted on the MUSAE-GitHub, GRAND-Brain and Amazon-Computers datasets, and GCN remains as the GNN for applying HyperAug. Starting from this stage, all experiments apply HyperAug’s auxiliary features at the output embedding phase. Table 3 reports the results for this set of ablation studies. The results clearly show that HyperAug with hyper-GNNs as feature extraction functions outperform HyperAug with simple-GNNs, thereby justifying that the HyperAug pipeline indeed utilises the virtual hyperedges it constructs.
| Method | Average Ranking |
| GCN | 6.96 |
| GAT | 7.91 |
| GraphSAGE | 7.09 |
| GCN+HyperAug(HyperConv) | 5.26 |
| GCN+HyperAug(ED-HNN) | 3.09 |
| GAT+HyperAug(HyperConv) | 5.22 |
| GAT+HyperAug(ED-HNN) | 3.04 |
| GraphSAGE+HyperAug(HyperConv) | 2.26 |
| GraphSAGE+HyperAug(ED-HNN) | 2.74 |
4.2.3. Identifying the Best Feature Extraction Function for HyperAug
Now that the efficacy of HyperAug has been affirmed through the aforementioned ablation studies, we conduct extensive experiments to identify the optimal feature extraction function for HyperAug. We use GCN, GAT and GraphSAGE as the GNNs for applying HyperAug, and test the performance of HyperAug with either HyperConv or ED-HNN as the feature extraction function, on all 23 node classification datasets we build (described in Section 4.1). The experimental settings for these experiments are set to be the same as the final evaluation of HyperAug, as descrbed in Appendix C.
For clarity, we present in Table 4 the average rankings of those six HyperAug applications, together with the three vanilla GNNs without applying HyperAug. The results clearly show that all HyperAug applications surpass the performance of the vanilla GNNs, which further validate the superior efficacy of HyperAug. Among those HyperAug variants, GraphSAGE with HyperAug(HyperConv) demonstrates to be the most effective combination. In addition, for both GCN and GAT, HyperAug(ED-HNN) outperforms HyperAug(HyperConv), suggesting a positive correlation between the expressiveness of the feature extraction hyper-GNN and the performance gain provided by HyperAug. This is likely due to the enhanced ability of more expressive hyper-GNNs to extract hyperedge information, leading to more informative auxiliary embeddings.
| Method | GitHub | TwitchDE | Cora- CoCitation | Brain | Lung Cancer | Computers |
| RandomGuess | 25.0 | 50.0 | 14.3 | 33.3 | 33.3 | 10.0 |
| GCN | 87.2 0.0 | 65.5 0.2 | 81.4 0.5* | 62.5 0.0 | 59.6 0.1 | 75.6 4.1 |
| GAT | 86.4 0.1 | 64.5 0.4 | 83.0 0.7* | 62.5 0.1 | 59.6 0.0 | 74.2 4.3 |
| GraphSAGE | 87.1 0.2 | 65.7 0.1 | 83.2 0.1 | 61.8 0.2 | 61.5 1.5 | 75.0 1.9 |
| HyperConv | 80.8 0.1 | 65.4 0.2 | 79.1 1.0** | 62.5 0.0 | 59.3 0.3 | 84.2 2.0 |
| ED-HNN | 86.2 0.1 | 68.1 0.6 | 80.3 1.4** | 66.3 1.3 | 60.2 1.4 | 97.3 0.2 |
| GCN+DropNode | 86.2 0.1 | 67.9 0.7 | 85.5 1.0 | 63.3 0.2 | 58.2 1.3 | 91.8 2.1 |
| GCN+DropEdge | 86.6 0.2 | 67.7 1.0 | 86.3 0.4 | 63.2 0.4 | 60.7 0.3 | 92.2 0.7 |
| GCN+Mixup | 85.8 0.3 | 67.6 0.8 | 85.6 1.4 | 65.0 1.0 | 59.0 0.6 | 87.7 2.9 |
| GCN+NodeFeatureMasking | 85.9 0.0 | 67.8 0.2 | 85.2 0.9 | 64.0 1.2 | 59.2 0.8 | 91.7 0.3 |
| GraphSAGE+DropNode | 86.2 0.1 | 68.3 0.6 | 86.4 0.0 | 63.3 0.1 | 64.5 0.8 | 95.9 0.2 |
| GraphSAGE+DropEdge | 86.8 0.1 | 67.8 1.3 | 87.1 0.1 | 64.2 0.2 | 64.7 0.7 | 95.9 0.3 |
| GraphSAGE+Mixup | 85.9 0.3 | 67.1 0.2 | 87.2 1.3 | 64.2 1.5 | 63.4 0.1 | 92.2 0.0 |
| GraphSAGE+NodeFeatureMasking | 86.1 0.0 | 68.1 0.7 | 87.1 0.5 | 64.4 0.4 | 64.9 2.3 | 95.7 0.2 |
| GCN+HyperAug | 87.4 0.3 | 67.9 0.9 | 86.6 1.4 | 66.7 2.6 | 63.7 0.9 | 98.1 0.7 |
| GraphSAGE+HyperAug | 87.3 0.2 | 68.3 0.3 | 87.2 1.8 | 66.6 1.6 | 66.4 0.2 | 98.2 0.7 |
4.3. Main Results
We thoroughly evaluate the performance of HyperAug against three simple-GNN baselines: GCN, GAT and GraphSAGE, and two hyper-GNN baselines: HyperConv and ED-HNN, on all 23 node classification datasets we build. We include two hyper-GNNs as baselines since these augmented graphs also make use of the hyperedge information. Moreover, we also compare the performance of HyperAug with four different existing graph augmentation methods: DropNode (You et al., 2020), DropEdge (Rong et al., 2020), Mixup (Zhang et al., 2018) and NodeFeatureMasking (Feng et al., 2019a). We evaluate those graph augmentation methods on six selected datasets: MUSAE-GitHub and MUSAE-TwitchDE (featuring virtual hyperedge construction from graph statistics); Cora-CoCitation, GRAND-Brain, and GRAND-LungCancer (featuring virtual hyperedge construction from different data perspectives); and Amazon-Computers (featuring virtual hyperedge construction from different data modalities). Each of dataset chosen in this comparison is the largest graph in their corresponding dataset subgroups. GCN and GraphSAGE are used as the GNNs for the evaluation with the graph augmentation methods. Details about the experimental settings can be found in our Appendix C.
Table 5 summarises the results of the experiments. The results unequivocally demonstrate that HyperAug consistently outperform the vanilla GNN baselines and other graph augmentation methods, across all three types of virtual hyperedge construction strategies. This again highlights the superiority of HyperAug, as well as the idea of incorporating higher-order node relations into graph augmentation methods for real-world complex networks. Besides, HyperAug also outperforms both hyper-GNN baselines, thereby indicating that integrating the original graph with the auxiliary features as augmentations is preferable over only learning from the virtual hyperedges and auxiliary features alone. To fully evaluate the performance of HyperAug, we present in Tables 8, 9, 11, 12, 13, 14 and 10 in Appendix D how it performs with different baselines and different setups.
It can be noted that on the MUSAE-TwitchDE and Cora-Co Citation datasets, although HyperAug is still the best performing graph augmentation method, its performance improvements compared to other graph augmentation methods are not as significant as on other datasets. This can be attributed to the following specific characteristics of the two datasets:
-
•
The MUSAE-TwitchDE and Cora-CoCitation datasets are comparatively small containing a few thousands of nodes, and most appropriate graph augmentation methods can help the GNNs saturate in extracting their information.
-
•
The virtual hyperedges for the MUSAE-TwitchDE dataset is constructed by computing from the original graph’s statistics, which does not introduce new information to the graph, thus also limiting HyperAug’s effectiveness in leveraging GNNs’ performance.
-
•
The virtual hyperedges for the Cora-CoCitation dataset is construct by grouping papers with co-authors, which are not diverse to the co-citation links and may contiain redundant information, compared with the GRAND (gene regulations vs. geometrical information) and Amazon (text vs. image modality) datasets.
These findings also serve as valuable guidance for employing HyperAug in real-world applications, in order to fully release its potential.
4.4. HyperAug with Graph Sampling
| MUSAE-GitHub | MUSAE-Facebook | |||||
| Samplers | Avg. Node Degree | Avg. Hyperedge Degree | Clustering Coef. | Avg. Node Degree | Avg. Hyperedge Degree | Clustering Coef. |
| 30.66 | 0.168 | 4.590 | 30.44 | 0.360 | 9.905 | |
| + GraphSAINT-Node | 42.59 | 0.268 | 13.20 | 42.72 | 0.268 | 13.11 |
| + GraphSAINT-Edge | 38.63 | 0.366 | 11.42 | 38.66 | 0.366 | 11.50 |
| + GraphSAINT-RW | 35.35 | 0.203 | 6.48 | 35.03 | 0.206 | 6.54 |
| + RandomNode | 2.25 | 0.020 | 19.16 | 2.58 | 0.037 | 21.73 |
| + RandomHyperedge | 72.38 | 0.282 | 7.48 | 72.74 | 0.279 | 7.44 |
HyperAug effectively improves the performance of GNNs. However, the creation of auxiliary features relies on the learning process in the virtual hypergraph space, and this could be inefficient with a large number of virtual hyperedges. In this section, we demonstrate how HyperAug augmentation can be integrated with graph sampling to enable scalability on very large graphs. Various hypergraph sampling strategies have been proposed for sampling subgraphs with the purpose of preserving the graph statistics (Choe et al., 2022; Dyer et al., 2021). To perform graph sampling on the virtual hypergraphs, we adopt the same sampling strategies in GraphSAINT (Zeng et al., 2020), but extend them to hyperedges. We propose three graph sampler variants: GraphSAINT-Node (node sampler), GraphSAINT-Edge (edge sampler), and GraphSAINT-RW (random walk sampler).
An intuitive procedure is performed to adopt GraphSAINT for virtual hyperedge sampling: any hyperedges containing at least one node in the sampled subgraph are retained, but all nodes not in the subgraph are masked out from those hyperedges. With this method, we preserve the original virtual hypergraph characteristics in the sampled subgraphs to the maximum extent. We also construct two naïve random samplers as baselines for evaluation: random node sampler and random hyperedge sampler, which randomly sample a subset of nodes or hyperedges from the virtual hypergraph according to a uniform sampling distribution.
We evaluate these samplers on the MUSAE Facebook and GitHub datasets, the two largest graphs among the evaluation datasets. Firstly, we sample subgraphs with various samplers to examine how they preserve the structure of the original graphs. This is measured by three graph statistics: average node and virtual hyperedge degrees, and clustering coefficient. We sample subgraphs multiple times and report the average graph statistics in Table 6. Among all constructed samplers, GraphSAINT-Edge and GraphSAINT-RW perform the best in preserving the graph-level statistics. The two random samplers tend to sample subgraphs with distinct structures from the virtual hypergraphs constructed by HyperAug.
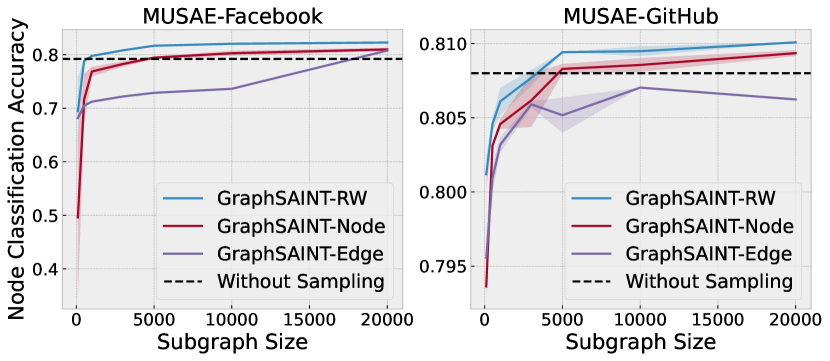
To assess the quality of the auxiliary features generated by HyperAug with various graph samplers, the feature extraction function is fixed to HyperConv. We then directly use the produced auxiliary features to perform node prediction tasks. Figure 3 shows distinct patterns regarding how the accuracy varied with different subgraph sizes. Evaluations were carried out on two distinct datasets, yielding the following key observations:
-
•
There exists a positive correlation between the size of sampled subgraphs and model accuracy across both datasets.
-
•
At subgraph sizes of 5000 or larger, both GraphSAINT-RW and GraphSAINT-Node outperform vanilla HyperConv (trained on the whole graph without sampling).
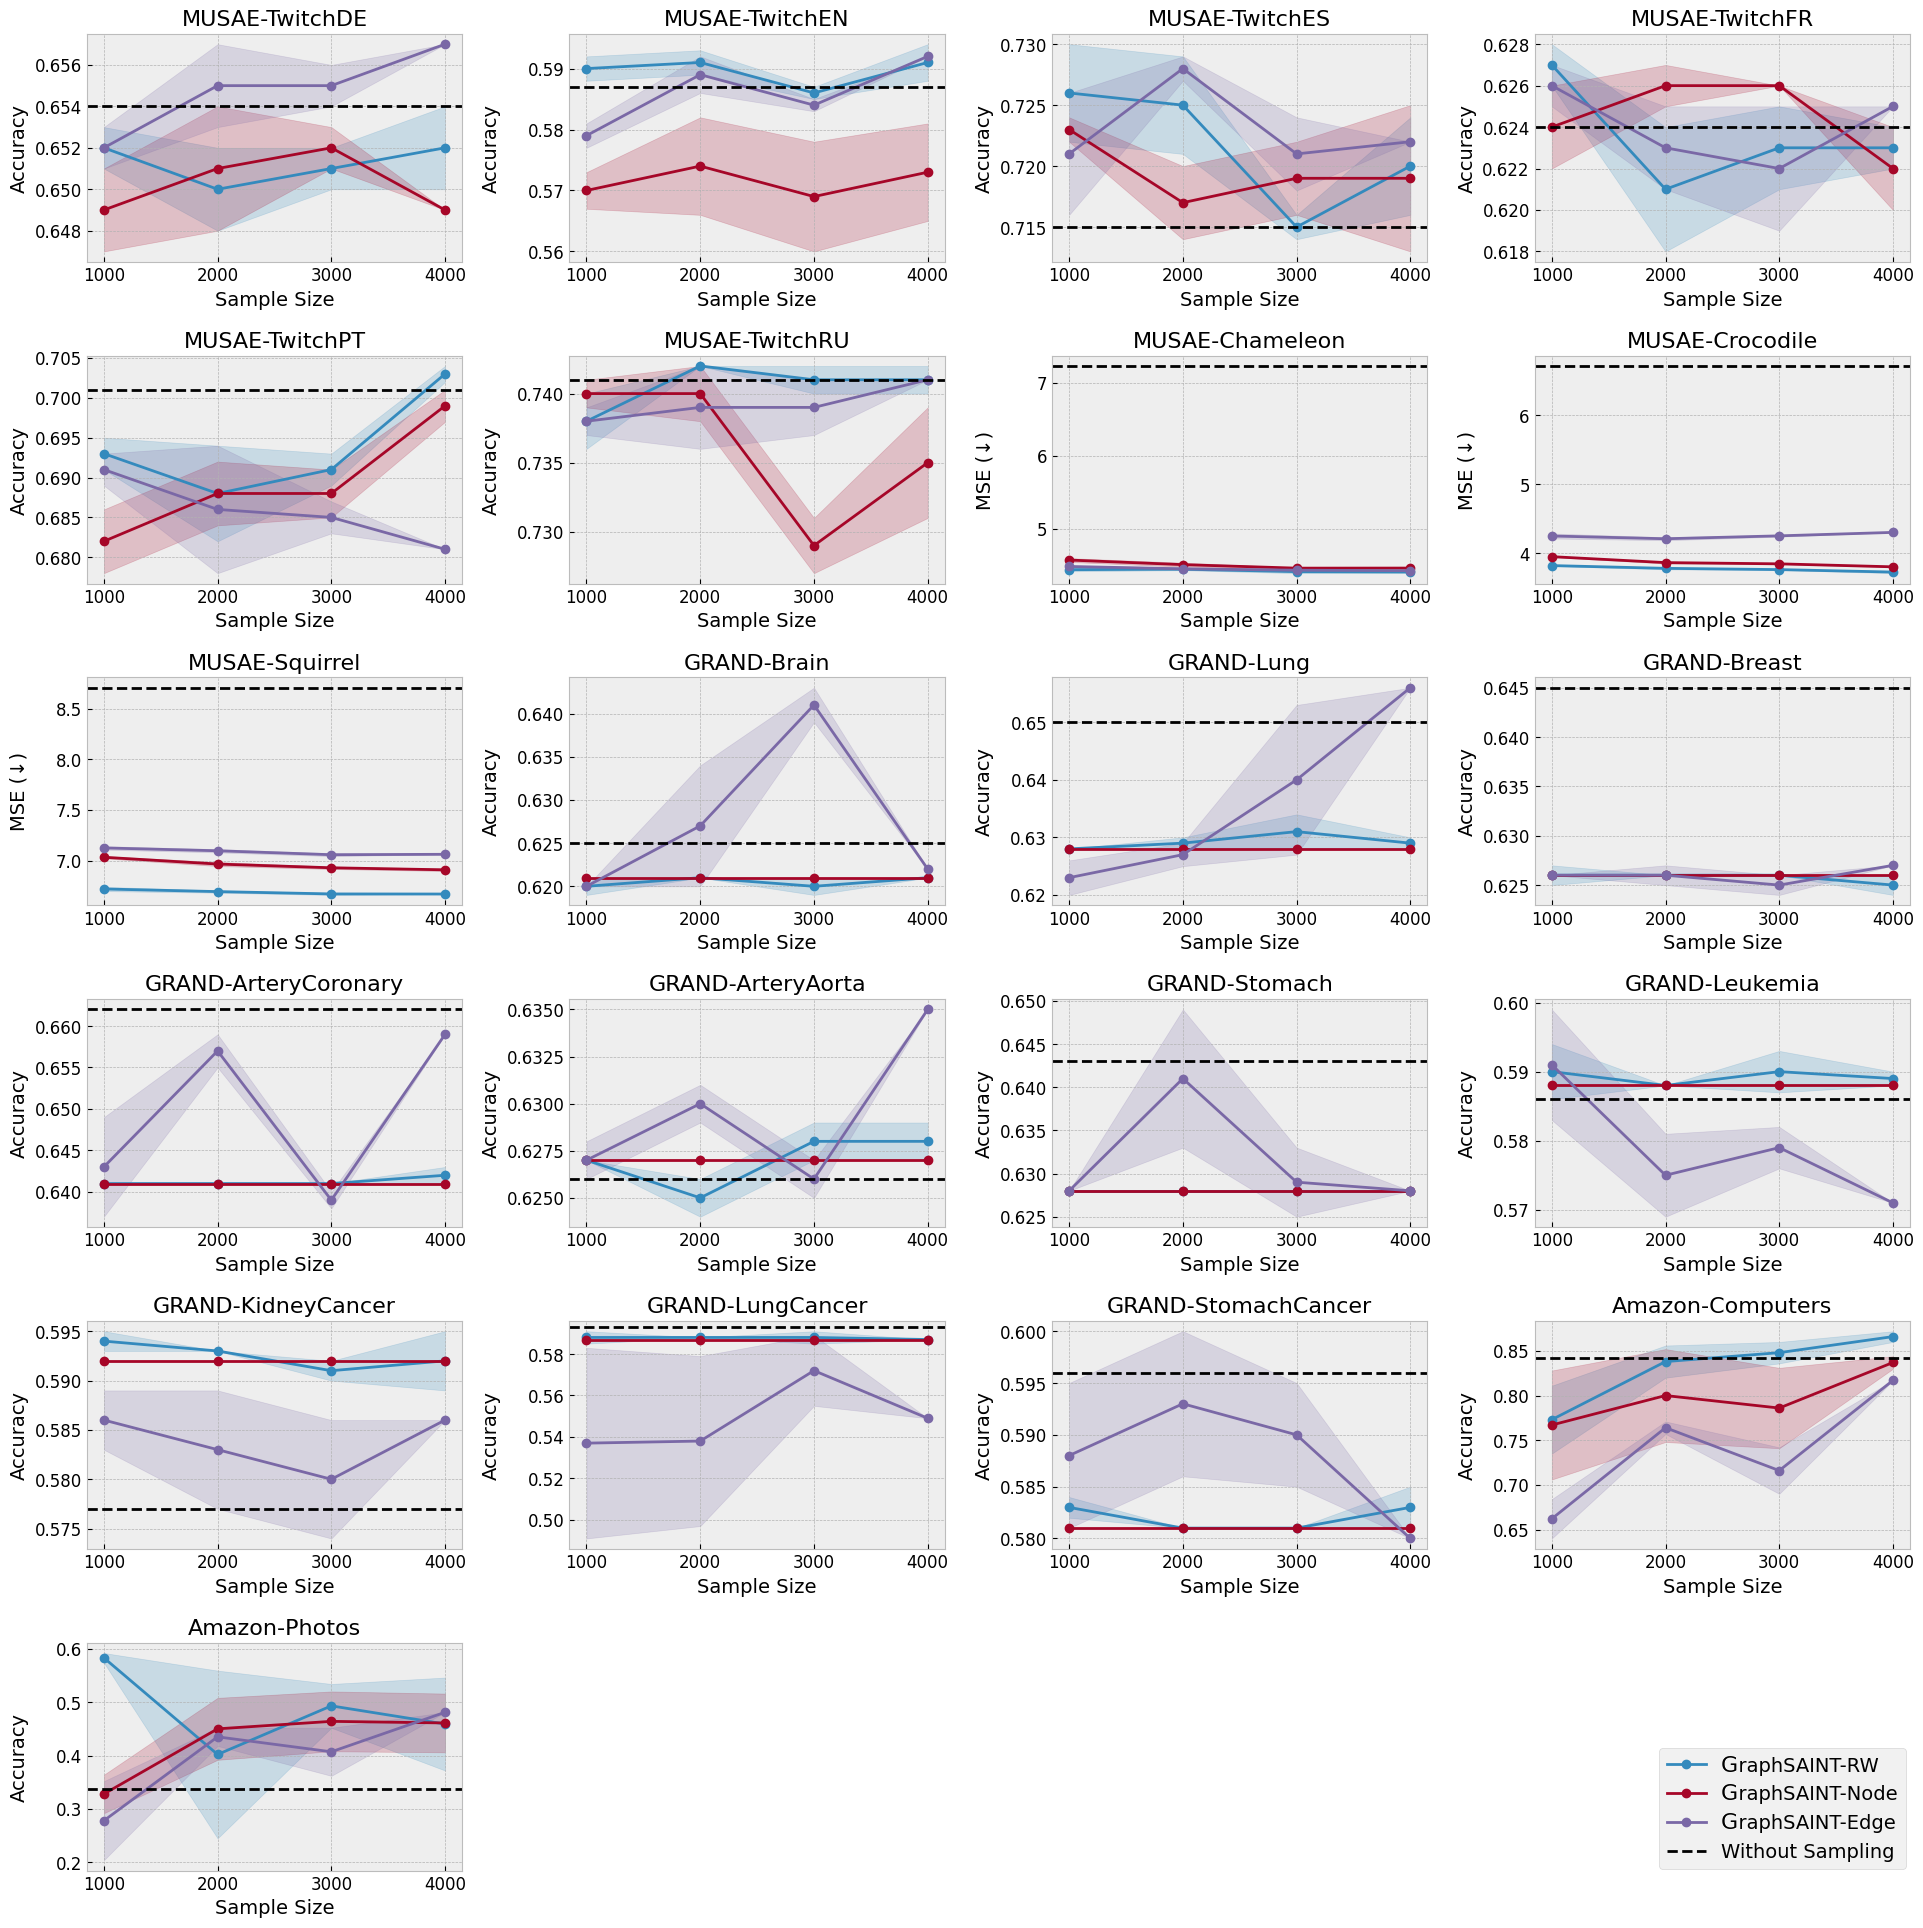
This highlights the potential for improved performance of HyperAug integrated with GraphSAINT samplers. This performance gain can be explained by the reduction of over-smoothing brought by sampling subgraphs. We then apply these three GraphSAINT samplers to all 21 subsequent graphs in the evaluation datasets excluding the citation datasets, extracting subgraphs of 1000, 2000, 3000, and 4000 nodes from each. The results of HyperConv with these three samplers on those graphs are summarised in Figure 4.
Generally, HyperAug with graph sampling techniques enhance HyperConv’s accuracy across most graphs. It is especially significant for node regression datasets like MUSAE-Chameleon, MUSAE-Crocodile, and MUSAE-Squirrel, where the MSE improvement is considerable. Overall, the GraphSAINT samplers, which mostly use simple edge information, can both effectively preserve the virtual hypergraph characteristics, and improve the quality of auxiliary features produced by HyperAug.
5. Conclusion
This work introduces Hyperedge Augmentation (HyperAug), a novel graph augmentation method designed to improve the performance of GNNs in node prediction tasks across diverse real-world large-scale graph datasets. HyperAug enhances the capability of GNNs by generating auxiliary features for each node using virtual hypergraphs. This improvement allows even basic GNN models to surpass the limitations of the 1-WL graph isomorphism test. Empirical results confirm that HyperAug outperforms traditional data augmentation methods in terms of accuracy across various graph types. Additionally, the study showcases HyperAug’s adaptability by integrating it with graph sampling methods, making it applicable to real-world large-scale graphs.
In this study, we demonstrate that augmenting GNNs with a straightforward strategy—concatenating the auxiliary feature derived from hypergraph space with the original feature—significantly boosts their performance. However, several potential methods to leverage the auxiliary feature remain unexplored. These include applying a cross-attention mechanism, as detailed in works (Wei et al., 2020; Vaswani et al., 2017), to effectively integrate the auxiliary and original features. Another unexplored avenue is the concurrent optimisation of the auxiliary and original features using contrastive loss, a technique discussed in ViLT (Kim et al., 2021). Employing these methods has the potential to optimise the integration and utility of the auxiliary features within GNNs, thereby further increasing their overall performance.
Acknowledgements.
This work was performed using the Sulis Tier 2 HPC platform hosted by the Scientific Computing Research Technology Platform at the University of Warwick, the JADE Tier 2 HPC facility, and the Cirrus UK National Tier-2 HPC Service at EPCC. Sulis is funded by EPSRC Grant EP/T022108/1 and the HPC Midlands+ consortium. JADE is funded by EPSRC Grant EP/T022205/1. Cirrus is funded by the University of Edinburgh and EPSRC Grant EP/P020267/1. Zehui Li acknowledges the funding from the UKRI 21EBTA: EB-AI Consortium for Bioengineered Cells & Systems (AI-4-EB) award, Grant BB/W013770/1. Xiangyu Zhao acknowledges the funding from the Imperial College London Electrical and Electronic Engineering PhD Scholarship. Mingzhu Shen acknowledges the funding from the Imperial College London President’s PhD Scholarship. For the purpose of open access, the authors have applied a Creative Commons Attribution (CC BY) licence to any Author Accepted Manuscript version arising.References
- (1)
- Bai et al. (2021) Song Bai, Feihu Zhang, and Philip H.S. Torr. 2021. Hypergraph convolution and hypergraph attention. Pattern Recognition 110 (2021), 107637.
- Ben Guebila et al. (2022) Marouen Ben Guebila, Camila M Lopes-Ramos, Deborah Weighill, Abhijeet Rajendra Sonawane, Rebekka Burkholz, Behrouz Shamsaei, John Platig, Kimberly Glass, Marieke L Kuijjer, and John Quackenbush. 2022. GRAND: a database of gene regulatory network models across human conditions. Nucleic Acids Research 50, D1 (2022), D610–D621.
- Brody et al. (2022) Shaked Brody, Uri Alon, and Eran Yahav. 2022. How attentive are graph attention networks?. In The 10th International Conference on Learning Representations. OpenReview.net, Virtual.
- Cai and Wang (2020) Chen Cai and Yusu Wang. 2020. A note on over-smoothing for graph neural networks. ICML 2020 Graph Representation Learning and Beyond Workshop.
- Chan and Liang (2020) T-H Hubert Chan and Zhibin Liang. 2020. Generalizing the hypergraph laplacian via a diffusion process with mediators. Theoretical Computer Science 806 (2020), 416–428.
- Choe et al. (2022) Minyoung Choe, Jaemin Yoo, Geon Lee, Woonsung Baek, U Kang, and Kijung Shin. 2022. MiDaS: Representative sampling from real-world hypergraphs. In Proceedings of the ACM Web Conference 2022. ACM, New York, NY, USA, 1080–1092.
- Ding et al. (2022) Kaize Ding, Zhe Xu, Hanghang Tong, and Huan Liu. 2022. Data augmentation for deep graph learning: A survey. ACM SIGKDD Explorations Newsletter 24, 2 (2022), 61–77.
- Dong et al. (2020) Yihe Dong, Will Sawin, and Yoshua Bengio. 2020. HNHN: Hypergraph networks with hyperedge neurons. ICML 2020 Graph Representation Learning and Beyond Workshop.
- Dyer et al. (2021) Martin Dyer, Catherine Greenhill, Pieter Kleer, James Ross, and Leen Stougie. 2021. Sampling hypergraphs with given degrees. Discrete Mathematics 344, 11 (2021), 112566.
- Eraslan et al. (2019) Gökcen Eraslan, Žiga Avsec, Julien Gagneur, and Fabian J Theis. 2019. Deep learning: new computational modelling techniques for genomics. Nature Reviews Genetics 20, 7 (2019), 389–403.
- Feng et al. (2019a) Fuli Feng, Xiangnan He, Jie Tang, and Tat-Seng Chua. 2019a. Graph adversarial training: Dynamically regularizing based on graph structure. IEEE Transactions on Knowledge and Data Engineering 33, 6 (2019), 2493–2504.
- Feng et al. (2019b) Yifan Feng, Haoxuan You, Zizhao Zhang, Rongrong Ji, and Yue Gao. 2019b. Hypergraph neural networks. Proceedings of the AAAI Conference on Artificial Intelligence 33, 01 (2019), 3558–3565.
- Gotmare et al. (2019) Akhilesh Gotmare, Nitish Shirish Keskar, Caiming Xiong, and Richard Socher. 2019. A Closer Look at Deep Learning Heuristics: Learning rate restarts, Warmup and Distillation. In The 7th International Conference on Learning Representations. OpenReview.net, New Orleans, LA, USA.
- Hamilton et al. (2017) Will Hamilton, Zhitao Ying, and Jure Leskovec. 2017. Inductive representation learning on large graphs. In Advances in Neural Information Processing Systems, Vol. 30. Curran Associates, Inc., Red Hook, NY, USA, 1024–1034.
- Hamilton (2020) William L. Hamilton. 2020. Graph representation learning. Synthesis Lectures on Artificial Intelligence and Machine Learning, Vol. 14, No. 3. Morgan & Claypool Publishers, Kentfield, CA, USA.
- Han et al. (2022) Xiaotian Han, Zhimeng Jiang, Ninghao Liu, and Xia Hu. 2022. G-Mixup: Graph Data Augmentation for Graph Classification. In Proceedings of the 39th International Conference on Machine Learning, Vol. 162. PMLR, Baltimore, MD, USA, 8230–8248.
- He and McAuley (2016) Ruining He and Julian McAuley. 2016. Ups and Downs: Modeling the Visual Evolution of Fashion Trends with One-Class Collaborative Filtering. In Proceedings of the 25th International Conference on World Wide Web. International World Wide Web Conferences Steering Committee, Geneva, Switzerland, 507–517.
- Hu et al. (2020) Weihua Hu, Matthias Fey, Marinka Zitnik, Yuxiao Dong, Hongyu Ren, Bowen Liu, Michele Catasta, and Jure Leskovec. 2020. Open Graph Benchmark: Datasets for Machine Learning on Graphs. In Advances in Neural Information Processing Systems, Vol. 33. Curran Associates, Inc., Red Hook, NY, USA, 22118–22133.
- Kim et al. (2021) Wonjae Kim, Bokyung Son, and Ildoo Kim. 2021. ViLT: Vision-and-Language Transformer Without Convolution or Region Supervision. In Proceedings of the 38th International Conference on Machine Learning, Vol. 139. PMLR, Virtual, 5583–5594.
- Kingma and Ba (2015) Diederik P. Kingma and Jimmy Ba. 2015. Adam: A Method for Stochastic Optimization. In The 3rd International Conference on Learning Representations, Conference Track Proceedings. ICLR, San Diego, CA, USA.
- Kipf and Welling (2017) Thomas N Kipf and Max Welling. 2017. Semi-supervised classification with graph convolutional networks. In The 5th International Conference on Learning Representations, Conference Track Proceedings. OpenReview.net, Toulon, France.
- Liu et al. (2023) Gang Liu, Eric Inae, Tong Zhao, Jiaxin Xu, Tengfei Luo, and Meng Jiang. 2023. Data-Centric Learning from Unlabeled Graphs with Diffusion Model. In Advances in Neural Information Processing Systems. Curran Associates, Inc., Red Hook, NY, USA, 19 pages.
- Long et al. (2017) Yicheng Long, Xueyin Wang, Daniel T Youmans, and Thomas R Cech. 2017. How do lncRNAs regulate transcription? Science Advances 3, 9 (2017), eaao2110.
- Maston et al. (2006) Glenn A Maston, Sara K Evans, and Michael R Green. 2006. Transcriptional regulatory elements in the human genome. Annual Review of Genomics and Human Genetics 7 (2006), 29–59.
- McAuley et al. (2015) Julian McAuley, Christopher Targett, Qinfeng Shi, and Anton van den Hengel. 2015. Image-Based Recommendations on Styles and Substitutes. In Proceedings of the 38th International ACM SIGIR Conference on Research and Development in Information Retrieval. ACM, New York, NY, USA, 43–52.
- Monti et al. (2019) Federico Monti, Fabrizio Frasca, Davide Eynard, Damon Mannion, and Michael M Bronstein. 2019. Fake news detection on social media using geometric deep learning. ICLR 2019 Workshop on Representation Learning on Graphs and Manifolds.
- Ni et al. (2019) Jianmo Ni, Jiacheng Li, and Julian McAuley. 2019. Justifying recommendations using distantly-labeled reviews and fine-grained aspects. In Proceedings of the 2019 Conference on Empirical Methods in Natural Language Processing and the 9th International Joint Conference on Natural Language Processing. ACL, Hong Kong, China, 188–197.
- Radford et al. (2021) Alec Radford, Jong Wook Kim, Chris Hallacy, Aditya Ramesh, Gabriel Goh, Sandhini Agarwal, Girish Sastry, Amanda Askell, Pamela Mishkin, Jack Clark, et al. 2021. Learning transferable visual models from natural language supervision. In Proceedings of the 38th International Conference on Machine Learning, Vol. 139. PMLR, Virtual, 8748–8763.
- Rong et al. (2020) Yu Rong, Wenbing Huang, Tingyang Xu, and Junzhou Huang. 2020. DropEdge: Towards Deep Graph Convolutional Networks on Node Classification. In The 8th International Conference on Learning Representations. OpenReview.net, Virtual.
- Rozemberczki et al. (2021) Benedek Rozemberczki, Carl Allen, and Rik Sarkar. 2021. Multi-Scale attributed node embedding. Journal of Complex Networks 9, 2 (2021), cnab014.
- Rusch et al. (2023) T Konstantin Rusch, Michael M Bronstein, and Siddhartha Mishra. 2023. A survey on oversmoothing in graph neural networks. arXiv preprint arXiv:2303.10993.
- Shchur et al. (2018) Oleksandr Shchur, Maximilian Mumme, Aleksandar Bojchevski, and Stephan Günnemann. 2018. Pitfalls of graph neural network evaluation. NeurIPS 2018 Relational Representation Learning Workshop.
- Vaswani et al. (2017) Ashish Vaswani, Noam Shazeer, Niki Parmar, Jakob Uszkoreit, Llion Jones, Aidan N Gomez, Łukasz Kaiser, and Illia Polosukhin. 2017. Attention is all you need. Advances in neural information processing systems 30 (2017), 5998–6008.
- Veličković et al. (2018) Petar Veličković, Guillem Cucurull, Arantxa Casanova, Adriana Romero, Pietro Liò, and Yoshua Bengio. 2018. Graph attention networks. In The 6th International Conference on Learning Representations, Conference Track Proceedings. OpenReview.net, Vancouver, Canada.
- Wang et al. (2023) Peihao Wang, Shenghao Yang, Yunyu Liu, Zhangyang Wang, and Pan Li. 2023. Equivariant Hypergraph Diffusion Neural Operators. In The 11th International Conference on Learning Representations. OpenReview.net, Kigali, Rwanda.
- Wang et al. (2021) Yiwei Wang, Wei Wang, Yuxuan Liang, Yujun Cai, and Bryan Hooi. 2021. Mixup for Node and Graph Classification. In Proceedings of the Web Conference 2021. ACM, New York, NY, USA, 3663–3674.
- Wei et al. (2020) Xi Wei, Tianzhu Zhang, Yan Li, Yongdong Zhang, and Feng Wu. 2020. Multi-modality cross attention network for image and sentence matching. In Proceedings of the IEEE/CVF Conference on Computer Vision and Pattern Recognition. IEEE, Seattle, WA, USA, 10941–10950.
- Weisfeiler and Leman (1968) Boris Weisfeiler and Andrei Leman. 1968. A reduction of a graph to canonical form and an algebra arising during this reduction. Nauchno-Technicheskaya Informatsia 2, 9 (1968), 12–16. English translation available at https://www.iti.zcu.cz/wl2018/pdf/wl_paper_translation.pdf.
- Xu et al. (2019) Keyulu Xu, Weihua Hu, Jure Leskovec, and Stefanie Jegelka. 2019. How Powerful are Graph Neural Networks?. In The 7th International Conference on Learning Representations. OpenReview.net, New Orleans, LA, USA.
- Yadati et al. (2019) Naganand Yadati, Madhav Nimishakavi, Prateek Yadav, Vikram Nitin, Anand Louis, and Partha Talukdar. 2019. HyperGCN: A new method for training graph convolutional networks on hypergraphs. In Advances in Neural Information Processing Systems, Vol. 32. Curran Associates, Inc., Red Hook, NY, USA, 1511–1522.
- You et al. (2020) Yuning You, Tianlong Chen, Yongduo Sui, Ting Chen, Zhangyang Wang, and Yang Shen. 2020. Graph Contrastive Learning with Augmentations. In Advances in Neural Information Processing Systems, Vol. 33. Curran Associates, Inc., Red Hook, NY, USA, 5812–5823.
- Zeng et al. (2020) Hanqing Zeng, Hongkuan Zhou, Ajitesh Srivastava, Rajgopal Kannan, and Viktor Prasanna. 2020. GraphSAINT: Graph sampling based inductive learning method. In The 8th International Conference on Learning Representations. OpenReview.net, Virtual.
- Zhang et al. (2018) Hongyi Zhang, Moustapha Cissé, Yann N. Dauphin, and David Lopez-Paz. 2018. mixup: Beyond Empirical Risk Minimization. In 6th International Conference on Learning Representations, Conference Track Proceedings. OpenReview.net, Vancouver, Canada.
Appendix A Full Statistics of Evaluation Datasets
| Name | Hyperedge Construction Mechanism | #Nodes | #Edges | #Hyperedges | Avg. Node Degree | Avg. Hyperedge Degree | #Node Features | #Classes |
| MUSAE-GitHub | Graph Statistics | 37,700 | 578,006 | 223,672 | 30.66 | 4.591 | 4,005 or 128 | 4 |
| MUSAE-Facebook | Graph Statistics | 22,470 | 342,004 | 236,663 | 30.44 | 9.905 | 4,714 or 128 | 4 |
| MUSAE-TwitchDE | Graph Statistics | 9,498 | 306,276 | 297,315 | 64.49 | 7.661 | 3,170 or 128 | 2 |
| MUSAE-TwitchEN | Graph Statistics | 7,126 | 70,648 | 13,248 | 19.83 | 3.666 | 3,170 or 128 | 2 |
| MUSAE-TwitchES | Graph Statistics | 4,648 | 118,764 | 77,135 | 51.10 | 5.826 | 3,170 or 128 | 2 |
| MUSAE-TwitchFR | Graph Statistics | 6,549 | 225,332 | 172,653 | 68.81 | 5.920 | 3,170 or 128 | 2 |
| MUSAE-TwitchPT | Graph Statistics | 1,912 | 62,598 | 74,830 | 65.48 | 7.933 | 3,170 or 128 | 2 |
| MUSAE-TwitchRU | Graph Statistics | 4,385 | 74,608 | 25,673 | 34.03 | 4.813 | 3,170 or 128 | 2 |
| MUSAE-Wiki-Chameleon | Graph Statistics | 2,277 | 62,742 | 14,650 | 55.11 | 7.744 | 3,132 or 128 | Regression |
| MUSAE-Wiki-Crocodile | Graph Statistics | 11,631 | 341,546 | 121,431 | 58.73 | 4.761 | 13,183 or 128 | Regression |
| MUSAE-Wiki-Squirrel | Graph Statistics | 5,201 | 396,706 | 220,678 | 152.55 | 30.735 | 3,148 or 128 | Regression |
| GRAND-ArteryAorta | Multi-Perspective | 5,848 | 5,823 | 11,368 | 1.991 | 1.277 | 4,651 | 3 |
| GRAND-ArteryCoronary | Multi-Perspective | 5,755 | 5,722 | 11,222 | 1.989 | 1.273 | 4,651 | 3 |
| GRAND-Breast | Multi-Perspective | 5,921 | 5,910 | 11,400 | 1.996 | 1.281 | 4,651 | 3 |
| GRAND-Brain | Multi-Perspective | 6,196 | 6,245 | 11,878 | 2.016 | 1.296 | 4,651 | 3 |
| GRAND-Lung | Multi-Perspective | 6,119 | 6,160 | 11,760 | 2.013 | 1.291 | 4,651 | 3 |
| GRAND-Stomach | Multi-Perspective | 5,745 | 5,694 | 11,201 | 1.982 | 1.274 | 4,651 | 3 |
| GRAND-Leukemia | Multi-Perspective | 4,651 | 6,362 | 7,812 | 2.736 | 1.324 | 4,651 | 3 |
| GRAND-LungCancer | Multi-Perspective | 4,896 | 6,995 | 8,179 | 2.857 | 1.334 | 4,651 | 3 |
| GRAND-StomachCancer | Multi-Perspective | 4,518 | 6,051 | 7,611 | 2.679 | 1.312 | 4,651 | 3 |
| GRAND-KidneyCancer | Multi-Perspective | 4,319 | 5,599 | 7,369 | 2.593 | 1.297 | 4,651 | 3 |
| Cora-CoAuthorship | Multi-Perspective | 2,708 | 5,429 | 1,072 | 4.010 | 4.277 | 1,433 | 7 |
| Cora-CoCitation | Multi-Perspective | 2,708 | 5,429 | 1,579 | 4.010 | 3.030 | 1,433 | 7 |
| Pubmed-CoCitation | Multi-Perspective | 19,717 | 44,338 | 7,963 | 4.497 | 4.349 | 500 | 3 |
| Amazon-Computers | Multi-Modality | 10,226 | 55,324 | 10,226 | 10.82 | 3.000 | 1,000 | 10 |
| Amazon-Photos | Multi-Modality | 6,777 | 45,306 | 6,777 | 13.37 | 4.800 | 1,000 | 10 |
Appendix B Dataset and Task Specifications
B.1. MUSAE Datasets
B.1.1. MUSAE-GitHub
This is a large social network of GitHub developers introduced in MUSAE (Rozemberczki et al., 2021). Nodes represent developers on GitHub, and edges are mutual follower relationships. HyperAug constructs the virtual hyperedges as mutually following developer groups that contain at least 3 developers (i.e., maximal cliques with sizes of at least 3). We enable the option to use either the 4,005-dimensional raw node features extracted based on the location, repositories starred, employer and e-mail address, or the 128-dimensional preprocessed node embeddings by MUSAE. The task is to predict whether a user is a web or a machine learning developer (could also be both or neither).
B.1.2. MUSAE-Facebook
This is a large Facebook page-page network introduced in MUSAE. Nodes represent verified pages on Facebook, and edges are mutual likes. HyperAug constructs the virtual hyperedges as mutually liked page groups that contain at least 3 pages (i.e., maximal cliques with sizes of at least 3). We enable the option to use either the 4,714-dimensional raw node features extracted from the site descriptions, or the 128-dimensional preprocessed node embeddings by MUSAE. The task is to predict which of the four categories a page belongs to: politicians, governmental organizations, television shows and companies.
B.1.3. MUSAE-Twitch
These are six small Twitch user-user networks introduced in MUSAE. Nodes represent gamers on Twitch, and edges are mutual follower relationships between them. HyperAug constructs the virtual hyperedges as mutually following user groups that contain at least 3 gamers (i.e., maximal cliques with sizes of at least 3). We enable the option to use either the 3,170-dimensional raw node features extracted based on the games played and liked, location and streaming habits, or the 128-dimensional preprocessed node embeddings by MUSAE. The task is to predict whether a user streams mature content.
B.1.4. MUSAE-Wiki
These are three Wikipedia page-page networks dataset introduced in MUSAE. Nodes represent articles, and edges represent mutual hyperlinks between them. HyperAug constructs the virtual hyperedges as mutually linked page groups that contain at least 3 pages (i.e., maximal cliques with sizes of at least 3). We enable each dataset to have an option to use either the raw node features extracted based on informative nouns appeared in the text of the Wikipedia articles, or the 128-dimensional preprocessed node embeddings by MUSAE. The task is to predict the average monthly traffic of the web page.
B.2. GRAND Datasets
B.2.1. GRAND-Tissues
We select and build six gene regulatory networks in different tissues (artery aorta, artery coronary, breast, brain, lung, and stomach) from GRAND (Ben Guebila et al., 2022), a public database for gene regulation. Nodes represent gene regulatory elements (Maston et al., 2006) with three distinct types: protein-encoding gene, lncRNA gene (Long et al., 2017), and other regulatory elements. Edges are regulatory effects between genes. We train a CNN (Eraslan et al., 2019) and use it to take the gene sequence as input and create a 4,651-dimensional embedding for each node. HyperAug constructs the virtual hyperedges by grouping nearby genomic elements on the chromosomes, i.e., the genomic elements within 200k base pair distance are grouped as virtual hyperedges. The task is a multi-class classification of gene regulatory elements.
B.2.2. GRAND-Diseases
We select and build four gene regulatory networks in different genetic diseases (leukemia, lung cancer, stomach cancer, and kidney cancer) from GRAND, a public database for gene regulation. Nodes represent gene regulatory elements with three distinct types: protein-encoding gene, lncRNA gene, and other regulatory elements. Edges are regulatory effects between genes. We train a CNN and use it to take the gene sequence as input and create a 4,651-dimensional embedding for each node. HyperAug constructs the virtual hyperedges by grouping nearby genomic elements on the chromosomes, i.e., the genomic elements within 200k base pair distance are grouped as virtual hyperedges. The task is a multi-class classification of gene regulatory elements.
B.3. Amazon Datasets
The Amazon Computers and Photos datasets are two e-commerce graphs based on the Amazon Product Reviews dataset (McAuley et al., 2015; He and McAuley, 2016; Ni et al., 2019). Nodes represent products, and an edge between two products is established if a user buys or writes reviews for both products. Node features are extracted based on the textual description of the products. HyperAug constructs the virtual hyperedges through the following process: first, it feeds the raw images of the products into a CLIP (Radford et al., 2021) classifier, obtaining a 512-dimensional feature embedding for each image to assist the clustering; it then groups the products whose image embeddings’ pairwise distances are within a certain threshold into the same virtual hyperedges. The task is to predict the sub-category of a product in a multi-class classification setup.
Appendix C Experimental Setup
C.1. Training Details
We run all the experiments on NVIDIA A100 PCIe GPUs with 40GB memory (Sulis), NVIDIA V100 NVLink GPUs with 32GB memory (JADE), and NVIDIA V100 SXM2 GPUs with 16GB memory (Cirrus). Adam (Kingma and Ba, 2015) is used as the optimiser, and CosineAnnealingLR (Gotmare et al., 2019) is used as the learning rate scheduler for all training. For each experiment, the nodes of the graph dataset are randomly split into training, validation, and test sets with a split ratio of 6:2:2. All models are trained for 500 epochs. For node classification tasks, the negative log likelihood loss (NLLLoss) is used as the loss function. For node regression tasks, the mean square error (MSELoss) is used as the loss function. Training typically takes less than 5 minutes for each experiment, when ED-HNN is not incorporated in the model. Due to the significantly larger architecture of ED-HNN, experiments involving it can take up to 2 hours.
C.2. Hyperparameter Settings
We perform a hyperparameter search for the learning rate and dropout rate, while keeping the hidden dimension of the layers fixed. To ensure fair comparison, all evaluated GNNs (GCN, GAT, GraphSAGE, HyperConv, and ED-HNN) share the same hyperparameter combinations. After hyperparameter searching, we adopt the following hyperparameter selections: learning rate = 0.001, hidden dimension = 64, and dropout rate = 0.5. For the additional hyperparameters of ED-HNN, we closely adhere to the hyperparameter settings specified in the original ED-HNN paper (Wang et al., 2023), and set the number of all inner multi-layer perceptrons (MLPs) within ED-HNN to 2.
Appendix D Results
We evaluate the following models on all 26 datasets we build:
-
•
Simple-GNN baselines: GCN, GAT, and GraphSAGE;
-
•
Hyper-GNN baselines: HyperConv, ED-HNN;
-
•
Simple-GNNs with HyperAug, using simple-GNNs as feature extraction functions:
-
–
GCN+HyperAug(GAT)
-
–
GCN+HyperAug(GraphSAGE)
-
–
GAT+HyperAug(GraphSAGE)
These are used as baselines of ablation studies, as described in Section 4.2.2;
-
–
-
•
A hyper-GNN with HyperAug, using a hyper-GNN as the feature extraction function:
-
–
HyperConv+HyperAug(ED-HNN)
This is intended to assess whether the auxiliary features produced by HyperAug can be used to augment themselves, and improve the node prediction performance using only hyperedge information;
-
–
-
•
Simple-GNNs with HyperAug, using hyper-GNNs as feature extraction functions:
-
–
GCN+HyperAug(HyperConv)
-
–
GCN+HyperAug(ED-HNN)
-
–
GAT+HyperAug(HyperConv)
-
–
GAT+HyperAug(ED-HNN)
-
–
GraphSAGE+HyperAug(GraphSAGE)
-
–
GraphSAGE+HyperAug(ED-HNN)
These are the standard usage of HyperAug.
-
–
Based on the time and compute resource constraints, each experiment is repeated two to five times with different random seeds. The results are summarised in Tables 8, 9, 11, 12, 13, 14 and 10, organised by the dataset subgroups. The results clearly demonstrate that simple-GNNs with HyperAug using hyper-GNNs as feature extraction functions consistently outperform the vanilla GNN baselines and other HyperAug combinations, underscoring the superior efficacy of incorporating information from higher-order node relations into graph augmentation methods under the HyperAug framework. Among all the HyperAug methods, GraphSAGE+HyperAug(HyperConv) generally stands out as the most effective combination.
Figure 4 summarises the performance of HyperConv (accuracy for prediction tasks, and MSE for regression tasks) with the three GraphSAINT samplers on 21 virtual hypergraphs produced by HyperAug, other than MUSAE-GitHub and MUSAE-Facebook (which are illustrated in Figure 3). HyperAug with the GraphSAINT sampling techniques generally enhance HyperConv’s accuracy across most graphs, and are especially significant for regression tasks like MUSAE-Chameleon, MUSAE-Crocodile, and MUSAE-Squirrel.
Appendix E Licence
The raw data for the MUSAE datasets are licenced under the the GNU General Public Licence, version 3 (GPLv3)111https://www.gnu.org/licenses/gpl-3.0.html. The raw data for the GRAND datasets are licenced under the Creative Commons Attribution-ShareAlike 4.0 International Public Licence (CC BY-SA 4.0)222https://creativecommons.org/licenses/by-sa/4.0/. The raw data for the Amazon datasets are licenced under the Amazon Service licence333https://s3.amazonaws.com/amazon-reviews-pds/LICENSE.txt. Having carefully observed the licence requirements of all data sources and code dependencies, we apply the same licenses to our constructed datasets as those of the raw data respectively.
Appendix F Ethics Statement
All datasets constructed in this project are generated from public open-source datasets, and the original raw data downloaded from the data sources do not contain any personally identifiable information or other sensitive contents. The node prediction tasks for the datasets constructed in this project are designed to ensure that they do not, by any means, lead to discriminations against any social groups. Therefore, we are not aware of any social or ethical concern of HyperAug. Since HyperAug is a general graph augmentation method for representation learning on complex graphs, we also do not foresee any direct application of HyperAug to malicious purposes. However, the community should be aware of any potential negative social and ethical impacts that may arise from their chosen datasets or tasks outside of those provided in this project.
| Method | GitHub | |
| RandomGuess | 25.0 | 25.0 |
| GCN | 88.6 0.1 | 87.2 0.0 |
| GAT | 87.6 0.1 | 86.4 0.1 |
| GraphSAGE | 90.2 0.2 | 87.1 0.2 |
| HyperConv | 79.2 0.1 | 80.8 0.1 |
| ED-HNN | 86.1 0.4 | 86.2 0.1 |
| GCN+HyperAug(GAT) | 91.0 0.1 | 86.7 0.1 |
| GCN+HyperAug(GraphSAGE) | 93.8 0.3 | 87.0 0.4 |
| GAT+HyperAug(GraphSAGE) | 93.7 0.4 | 86.8 0.6 |
| HyperConv+HyperAug(ED-HNN) | 94.2 0.1 | 86.9 0.3 |
| GCN+HyperAug(HyperConv) | 89.8 0.0 | 87.2 0.0 |
| GCN+HyperAug(ED-HNN) | 92.6 0.7 | 87.4 0.3 |
| GAT+HyperAug(HyperConv) | 90.5 0.0 | 86.0 0.2 |
| GAT+HyperAug(ED-HNN) | 93.4 0.1 | 87.3 0.1 |
| GraphSAGE+HyperAug(HyperConv) | 93.6 0.0 | 87.3 0.2 |
| GraphSAGE+HyperAug(ED-HNN) | 93.2 0.7 | 87.4 0.1 |
| Method | TwitchES | TwitchFR | TwitchDE | TwitchEN | TwitchPT | TwitchRU |
| RandomGuess | 50.0 | 50.0 | 50.0 | 50.0 | 50.0 | 50.0 |
| GCN | 72.1 0.4 | 62.4 0.1 | 65.5 0.2 | 62.0 0.3 | 68.9 0.6 | 74.5 0.0 |
| GAT | 69.4 0.2 | 62.3 0.0 | 64.5 0.4 | 59.4 0.6 | 66.4 0.7 | 74.3 0.2 |
| GraphSAGE | 69.0 0.2 | 61.6 0.3 | 65.7 0.1 | 60.5 0.0 | 67.2 1.3 | 74.5 0.1 |
| HyperConv | 71.5 0.1 | 62.4 0.2 | 65.4 0.2 | 58.7 0.7 | 70.1 0.5 | 74.1 0.1 |
| ED-HNN | 72.2 1.3 | 62.9 1.1 | 68.1 0.6 | 60.3 1.1 | 69.5 1.5 | 75.1 1.5 |
| GCN+HyperAug(GAT) | 72.7 0.1 | 62.3 0.1 | 66.2 0.1 | 61.2 0.2 | 68.6 0.8 | 74.5 0.1 |
| GCN+HyperAug(GraphSAGE) | 71.8 2.5 | 61.2 0.0 | 68.2 1.6 | 59.2 2.1 | 70.0 1.9 | 74.8 0.0 |
| GAT+HyperAug(GraphSAGE) | 70.8 0.7 | 61.4 0.0 | 67.7 0.5 | 59.3 0.2 | 68.0 2.1 | 74.9 0.4 |
| HyperConv+HyperAug(ED-HNN) | 71.8 1.0 | 61.2 0.3 | 68.3 0.3 | 59.3 0.7 | 67.9 0.2 | 75.1 0.3 |
| GCN+HyperAug(HyperConv) | 72.9 0.1 | 62.6 0.0 | 65.7 0.1 | 60.7 0.1 | 69.6 0.4 | 74.4 0.0 |
| GCN+HyperAug(ED-HNN) | 72.8 1.4 | 63.4 2.1 | 67.9 0.9 | 62.2 1.0 | 70.6 3.7 | 75.2 0.4 |
| GAT+HyperAug(HyperConv) | 71.4 0.1 | 62.2 0.0 | 65.4 0.1 | 60.8 0.3 | 67.2 0.3 | 74.4 0.0 |
| GAT+HyperAug(ED-HNN) | 72.1 2.3 | 63.2 3.1 | 68.5 0.2 | 61.0 0.6 | 68.7 2.8 | 75.3 0.2 |
| GraphSAGE+HyperAug(HyperConv) | 71.8 1.0 | 63.3 2.2 | 68.3 0.3 | 61.1 0.2 | 69.9 2.4 | 75.1 0.3 |
| GraphSAGE+HyperAug(ED-HNN) | 70.5 0.8 | 63.3 2.4 | 68.1 0.8 | 60.7 0.0 | 68.9 0.2 | 75.2 0.3 |
| Method | Squirrel | Crocodile | Chameleon |
| GCN | 7.319 0.000 | 8.761 0.001 | 6.779 0.005 |
| GAT | 6.557 0.154 | 8.093 0.054 | 6.249 0.261 |
| HyperConv | 7.230 0.002 | 8.706 0.000 | 6.712 0.001 |
| GCN+HyperAug(GAT) | 7.554 0.029 | 4.827 0.087 | 5.203 0.147 |
| GCN+HyperAug(HyperConv) | 7.313 0.007 | 4.851 0.014 | 5.515 0.008 |
| GAT+HyperAug(HyperConv) | 6.049 0.204 | 4.875 0.031 | 4.665 0.050 |
| Method | Artery Aorta | Artery Coronary | Breast | Brain | Lung | Stomach |
| RandomGuess | 33.3 | 33.3 | 33.3 | 33.3 | 33.3 | 33.3 |
| GCN | 62.7 0.7 | 66.2 0.1 | 63.9 1.0 | 62.5 0.0 | 65.0 0.0 | 64.3 0.0 |
| GAT | 62.8 0.4 | 66.3 0.0 | 64.3 0.1 | 62.5 0.1 | 64.8 0.4 | 64.3 0.0 |
| GraphSAGE | 62.8 0.2 | 66.3 0.1 | 64.4 0.0 | 61.8 0.2 | 64.6 0.5 | 63.0 1.0 |
| HyperConv | 62.6 0.8 | 66.2 0.0 | 64.5 0.1 | 62.5 0.0 | 65.0 0.0 | 64.3 0.0 |
| ED-HNN | 66.7 1.3 | 66.7 1.5 | 66.1 1.4 | 66.3 1.3 | 67.0 1.0 | 66.1 0.6 |
| GCN+HyperAug(GAT) | 62.7 0.0 | 64.1 0.0 | 62.6 0.1 | 62.5 0.3 | 62.7 0.1 | 62.6 0.1 |
| GCN+HyperAug(GraphSAGE) | 64.6 0.3 | 65.9 2.2 | 65.3 0.3 | 65.3 0.9 | 64.0 0.1 | 63.8 1.6 |
| GAT+HyperAug(GraphSAGE) | 66.4 0.1 | 66.3 1.8 | 65.4 0.2 | 65.1 0.8 | 65.0 0.1 | 65.0 2.2 |
| HyperConv+HyperAug(ED-HNN) | 65.9 0.0 | 66.2 1.1 | 66.7 1.0 | 66.1 1.6 | 67.0 0.7 | 66.8 2.7 |
| GCN+HyperAug(HyperConv) | 64.7 0.3 | 66.0 0.3 | 65.2 0.6 | 63.7 0.2 | 65.4 0.4 | 65.4 0.1 |
| GCN+HyperAug(ED-HNN) | 64.3 0.2 | 66.0 2.0 | 66.1 1.0 | 66.7 2.6 | 67.9 1.3 | 66.9 0.0 |
| GAT+HyperAug(HyperConv) | 64.9 0.1 | 66.4 0.1 | 65.7 0.1 | 64.5 0.1 | 66.2 0.2 | 65.6 0.2 |
| GAT+HyperAug(ED-HNN) | 65.3 2.0 | 66.3 1.1 | 65.6 1.7 | 65.5 2.4 | 68.3 0.7 | 66.3 0.8 |
| GraphSAGE+HyperAug(HyperConv) | 66.9 0.9 | 67.9 0.0 | 67.5 0.6 | 66.6 1.6 | 67.4 0.7 | 68.1 0.3 |
| GraphSAGE+HyperAug(ED-HNN) | 66.2 0.5 | 67.1 2.5 | 64.7 0.8 | 66.0 0.2 | 67.9 0.5 | 66.9 0.5 |
| Method | Leukemia | Lung Cancer | Stomach Cancer | Kidney Cancer |
| RandomGuess | 33.3 | 33.3 | 33.3 | 33.3 |
| GCN | 58.2 0.1 | 59.6 0.1 | 60.2 0.7 | 58.1 0.2 |
| GAT | 58.7 0.5 | 59.6 0.0 | 60.0 0.7 | 58.1 0.3 |
| GraphSAGE | 60.4 1.6 | 61.5 1.5 | 60.2 1.6 | 59.6 1.4 |
| HyperConv | 58.6 0.3 | 59.3 0.3 | 59.6 0.4 | 57.7 0.6 |
| ED-HNN | 60.3 1.3 | 60.2 1.4 | 61.0 1.1 | 60.3 1.1 |
| GCN+HyperAug(GAT) | 59.0 0.2 | 58.3 0.2 | 58.1 0.4 | 58.4 0.2 |
| GCN+HyperAug(GraphSAGE) | 60.1 0.2 | 64.1 0.2 | 62.1 0.2 | 62.1 0.2 |
| GAT+HyperAug(GraphSAGE) | 61.8 0.5 | 63.2 0.7 | 62.4 1.9 | 61.2 1.1 |
| HyperConv+HyperAug(ED-HNN) | 58.9 1.4 | 61.5 1.0 | 62.3 2.1 | 61.1 0.3 |
| GCN+HyperAug(HyperConv) | 60.4 0.4 | 61.4 0.6 | 60.5 0.3 | 60.9 0.4 |
| GCN+HyperAug(ED-HNN) | 61.5 1.0 | 63.7 0.9 | 63.4 2.0 | 62.4 1.3 |
| GAT+HyperAug(HyperConv) | 62.5 1.2 | 61.8 0.3 | 64.2 1.6 | 64.0 0.3 |
| GAT+HyperAug(ED-HNN) | 62.3 1.2 | 61.5 1.2 | 64.5 1.9 | 63.8 1.8 |
| GraphSAGE+HyperAug(HyperConv) | 62.9 0.5 | 66.4 0.2 | 66.3 1.5 | 64.8 0.4 |
| GraphSAGE+HyperAug(ED-HNN) | 62.6 0.3 | 64.5 0.1 | 64.7 0.7 | 63.9 0.2 |
| Method | Cora-CoCite | Cora-CoAuth | Pubmed-CoCite |
| RandomGuess | 14.3 | 14.3 | 33.3 |
| GCN* | 81.4 0.5 | 81.4 0.5 | 79.0 0.3 |
| GAT* | 83.0 0.7 | 83.0 0.7 | 79.0 0.3 |
| GraphSAGE | 83.2 0.1 | 83.2 0.1 | 86.5 0.8 |
| HyperConv** | 79.1 1.0 | 82.6 1.0 | 86.4 0.4 |
| ED-HNN** | 80.3 1.4 | 84.0 1.6 | 89.0 0.5 |
| GCN+HyperAug(GAT) | 86.9 0.6 | 86.9 0.6 | 87.0 1.0 |
| GCN+HyperAug(GraphSAGE) | 87.4 1.4 | 87.4 1.4 | 87.4 0.6 |
| GAT+HyperAug(GraphSAGE) | 85.8 0.0 | 85.8 0.0 | 87.3 1.0 |
| HyperConv+HyperAug(ED-HNN) | 83.0 1.0 | 85.2 1.4 | 87.4 0.1 |
| GCN+HyperAug(HyperConv) | 86.9 1.7 | 87.5 0.9 | 87.3 0.4 |
| GCN+HyperAug(ED-HNN) | 86.6 1.4 | 87.0 0.8 | 89.0 0.2 |
| GAT+HyperAug(HyperConv) | 86.7 0.4 | 86.0 2.2 | 86.6 0.7 |
| GAT+HyperAug(ED-HNN) | 87.0 1.3 | 86.7 0.0 | 89.0 0.6 |
| GraphSAGE+HyperAug(HyperConv) | 87.2 1.8 | 86.3 0.8 | 87.3 0.4 |
| GraphSAGE+HyperAug(ED-HNN) | 87.4 1.0 | 87.7 0.8 | 88.8 1.1 |
| Method | Computers | Photos |
| RandomGuess | 10.0 | 10.0 |
| GCN | 75.6 4.1 | 29.5 1.7 |
| GAT | 74.2 4.3 | 43.4 7.4 |
| GraphSAGE | 75.0 1.9 | 36.6 6.1 |
| HyperConv | 84.2 2.0 | 33.7 5.9 |
| ED-HNN | 97.3 0.2 | 78.6 1.2 |
| GCN+HyperAug(GAT) | 91.3 0.1 | 71.1 0.5 |
| GCN+HyperAug(GraphSAGE) | 93.0 0.0 | 78.6 0.6 |
| GAT+HyperAug(GraphSAGE) | 96.8 0.6 | 78.0 0.1 |
| HyperConv+HyperAug(ED-HNN) | 97.8 0.1 | 80.7 0.6 |
| GCN+HyperAug(HyperConv) | 96.8 0.5 | 69.8 0.5 |
| GCN+HyperAug(ED-HNN) | 98.1 0.7 | 80.5 0.6 |
| GAT+HyperAug(HyperConv) | 96.8 0.6 | 71.5 0.3 |
| GAT+HyperAug(ED-HNN) | 98.2 0.1 | 80.9 0.3 |
| GraphSAGE+HyperAug(HyperConv) | 98.2 0.7 | 79.3 0.8 |
| GraphSAGE+HyperAug(ED-HNN) | 98.1 0.1 | 80.9 0.7 |