[table]capposition=top
Between Green Hills and Green Bills: Unveiling the Green Shades of Sustainability and Burden Shifting through Multi-Objective Optimization in Swiss Energy System Planning
Abstract
The Paris agreement is the first-ever universally accepted and legally binding agreement on global climate change. It is a bridge between today’s and climate-neutrality policies and strategies before the end of the century. Critical to this endeavor is energy system modeling, which, while adept at devising cost-effective carbon-neutral strategies, often overlooks the broader environmental and social implications. This study introduces an innovative methodology that integrates life-cycle impact assessment indicators into energy system modeling, enabling a comprehensive assessment of both economic and environmental outcomes.
Focusing on Switzerland’s energy system as a case study, our model reveals that optimizing key environomic indicators can lead to significant economic advantages, with system costs potentially decreasing by to by minimizing potential impacts from operating fossil technologies to the indirect impact related to the construction of the renewable infrastructure. However, a system optimized solely for economic efficiency, despite achieving reduction in carbon footprint compared to 2020, our results show a potential risk of burden shift to other environmental issues.
The adoption of multi-objective optimization in our approach nuances the exploration of the complex interplay between environomic objectives and technological choices. Our results illuminate pathways towards more holistically optimized energy systems, effectively addressing trade-offs across environmental problems and enhancing societal acceptance of the solutions to this century’s defining challenge.
Keywords: Energy System Modeling, Life-Cycle Impact Assessment, Multi-Objective Optimization, Renewable Energy, Environmental Burden Shifting, Switzerland, Carbon Neutrality
1Industrial Process and Energy Systems Engineering group, École Polytechnique Fédérale de Lausanne, Rue de l’Industrie 17, 1950 Sion, Switzerland;
2CIRAIG, Institute for Sustainable Energy, University of Applied Sciences Western Switzerland, Rue de l’Industrie 23, 1950 Sion, Switzerland;
3CIRAIG, École Polytechnique de Montreal, 3333 Queen Mary Rd, Montréal, Québec;
∗jonas.schnidrig@hevs.ch
‡ Authors contributed equally
1 Introduction
1.1 Background
The escalation in the intensity and frequency of climate change events underscores the critical need for robust mitigation strategies. The Intergovernmental Panel on Climate Change (IPCC) emphasizes a global effort to curtail Greenhouse Gas (GHG) emissions, aiming to contain global warming within 1.5 - 2°C above pre-industrial levels. The Paris Agreement, formulated at COP21 in 2015, mandates signatories to present increasingly ambitious Nationally Determined Contributions (NDCs) every five years to articulate mid to long-term emissions reduction goals. Institutions such as Climate Action Tracker (CAT) and the International Renewable Energy Agency (IRENA) assess the alignment of NDCs with the targeted temperature thresholds and offer guidance for enhancements. With a growing focus on sustainable development and the shift toward renewable energy sources, energy system modeling has garnered significant interest. Concurrently, the Life Cycle Assessment (LCA) approach, which evaluates potential impacts of products and technologies over the whole value chain on a broader spectrum of environmental impacts like ozone depletion and particulate matter formation, has grown substantially over the past two decades.
To genuinely transition to a low-carbon energy system, accounting for and monitoring potential environmental burden shifts beyond GHG emissions is imperative. Our methodology seeks to meld LCA within Energy System Modeling, optimizing the energy system’s carbon footprint, water scarcity footprint, fossil & nuclear energy use, and remaining damages to human health and ecosystem quality.
1.2 Literature Review
Energy system design traditionally pivots around economic optimization. However, in the wake of growing environmental concerns and sustainability priorities, there has been a discernible shift in focus towards more comprehensive assessment methods. LCA, which primarily found applications in analyzing small-scale technologies [1, 2, 3], is rapidly gaining prominence in evaluating larger systems such as processes [4], plants [5], and buildings [6].
LCA has been comprehensively coupled with an energy system model for the first time by Loulou et al. [7] within the NEEDS project in 2008, in order to assess the external costs of power production. Since then, numerous energy system models have been coupled to LCA, with varying integration levels, environmental comprehensiveness and sectoral coverage. Most energy system models are soft-linked to LCA, i.e., the output of the model feed the LCA model, resulting in an environmental profile of the energy system, which may eventually be given back to the energy model until a convergence criterion is met. However, a unique iteration is typically performed, thus resulting in a so-called ex-post analysis. Ex-post analyses [8, 9, 10, 11, 12, 13, 14, 15, 16, 17] are static by nature and thus limited regarding the use of LCA metrics in the energy model. A few models are hard-linked to LCA, i.e., LCA metrics are endogenously integrated into the model, thus allowing to use them in the objective function or constraints in the case of an optimization model. LCA metrics can be integrated within the optimization problem using three main techniques: 1) the normalization and weighting of different objectives in the objective function [18, 19, 20, 21] ; 2) the -constraint method [18, 22], i.e., optimize for a single objective and set an upper bound to other objectives as constraints ; 3) the monetization of environmental objectives [23]. On one hand, Vandepaer et al. [18] optimized the sum of two objectives, namely the system total cost and the so-called total cumulative LCIA score. A main limitation is the cost weighting factor that had to be arbitrarily chosen to allow the model convergence. Vandepaer et al. further used the -constraint method by setting upper bounds to objectives, which were chosen using the minimum value derived from the single-objective optimizations of those, and adding a relaxation term varying between 5 and 50%. On the other hand, Algunaibet et al. [23] monetized three damage-level indicators, namely human health, ecosystem quality and resource availability, to include them in an economic objective function. Even if monetization avoids the normalization and weighting steps, the conversion of environmental impact into monetary terms remains highly uncertain.
The coupling between energy models and LCA being complex, most analyses started by focusing on the electricity sector alone [21, 24, 25, 17, 26, 16, 20, 27, 28]. However, a few studies now include multi-energy models [14, 12, 11, 18, 10, 29, 30], thus accounting for the inter-dependencies of the energy sectors, namely electricity, heat and mobility. Still, using a too wide model may eventually result in an incomplete mapping of the model’s technologies with life-cycle inventories. This issue leads to only using a sub-set of most contributing processes [12] or having non-characterized, and thus environmentally favored, energy technologies [18, 28].
The comprehensiveness of environmental impact categories varies significantly across studies and strongly depends on their research questions and objectives. While some solely focus of GHG emissions [25, 31], other use a full [9, 11, 28, 14, 20, 32, 23] or selection [33, 15, 17] of midpoint-level indicators [33, 9, 11, 28, 14, 20, 17], damage-level indicators [32, 23], or a combination of those [15].
However, a critical observation emerges from the current literature: while he coupling between LCA and optimization tools is an active research area, none of the previously studied literature encompasses (i) a national model addressing all energy demands, (ii) the systematic and consistent integration of a comprehensive set of LCA metrics, and (iii) consideration of uncertainties, which remains elusive.
2 Problem Statement
In the evolving landscape of energy system design, LCA has become increasingly critical, particularly in the transition from smaller-scale technologies to more comprehensive systems like processes, plants, and buildings. Traditional models often focus on economic optimization, with LCA considerations taking a secondary role, especially in larger systems where economic objectives have predominated. This prioritization has led to a notable gap in the literature, where the integration of comprehensive environmental indicators with economic goals in energy system modeling, particularly in optimizing for these environmental indicators while addressing uncertainties, is still largely unexplored.
This project utilizes the energy system model EnergyScope (ES), a Mixed Integer Linear Programming (MILP) approach, to develop a global Swiss energy model. It is designed to contrast the outcomes from energy systems optimized solely for economic benefits against those optimized for reducing environmental impacts through LCA indicators. This involves a suite of comprehensive, independent impact indicators (Areas of Concern and Areas of Protection). In 2020, the project aims to explore Switzerland’s capacity to transition to an energy-independent state, focusing on broader environmental impacts, avoiding shifts in environmental burden, and highlighting potential co-benefits.
Research Objectives
The core objectives of this project are:
Research Focus
To address these challenges, our research will focus on:
-
•
Developing techniques for accurate characterization of technologies within the LCA framework.
-
•
Formulating strategies to integrate Life Cycle Impact Assessment (LCIA) seamlessly into energy system modeling.
-
•
Innovating methods for the monitoring and evaluation of LCA indicators within the energy modeling process.
-
•
Assessing potential shifts in environmental burdens within a transitioning low-carbon Swiss energy system.
-
•
Analyzing the impact of Multi-Objective Optimization (MOO) on energy system configurations, particularly in balancing environmental and economic objectives.
Through this research, we aim to bridge the identified gaps in current literature, contributing to a more holistic and sustainable approach in energy system design and optimization.
3 Methods
3.1 Modeling Framework
This work builds on an exploratory work [34, 35] integrating LCA in the pre-existing MILP-based EnergyScope framework, a model initially formulated by Moret et al. [36], and continuously improved by Li et al. [37], and Schnidrig et al. [38].
The EnergyScope framework delineates a comprehensive multi-energy model, evaluated on a monthly averaged basis. This ensures a balanced mass and energy conservation equation between the demands and resources. Demand has been segmented into sectors, such as households, services, industry, and transportation, and further broken down by energy types to create a more precise categorization. In a bid to achieve optimal configurations, the key decision variables, represented by the installed size and use of technologies (Figure 1).
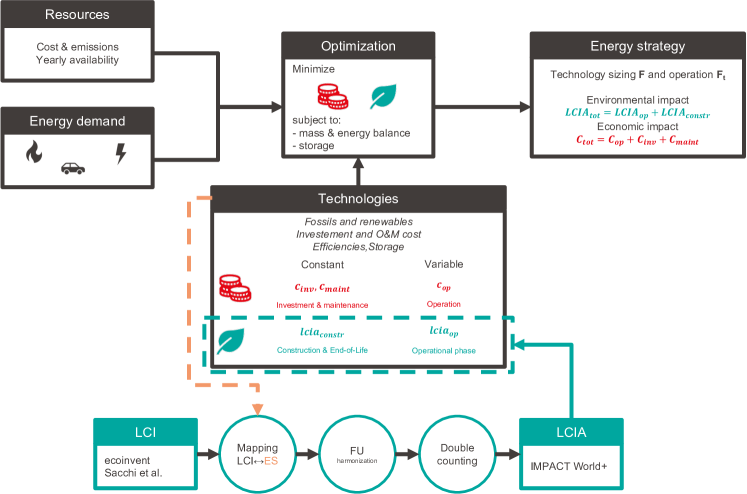
3.1.1 Economic objective
Central to the primary Objective Function (OF) of EnergyScope is the total cost (Eq. 1). This total cost is composed of a constant and a variable part. The constant cost corresponds to the annualized technology-specific cost for investment (Eq. 2) and maintenance (Eq. 3), defined by the decision variable . As we consider only the hypothetical optimal energy system for 2020 within this study, we only consider new installations, subtracting existing infrastructure . The variable part corresponds to the use of technologies resulting in the operational costs of resources (Eq. 4).
| (1) | ||||
| (2) | ||||
| (3) | ||||
| (4) | ||||
3.1.2 LCA objectives
The environmental OF variable assesses the sum of life cycle impacts of a technology throughout its construction, operation and end-of-life (Eq. 5) for the different LCA indicators listed in Table 2.
Constant impact
The LCA impact score compute the LCA annualized impact score of the technology over its useful life time, encompassing its construction and its end-of-life. It is calculated by multiplying the installed technology size with the specific impact factor by unit of technology installed (Table 1), divided by the technology’s useful lifetime (Eq. 6).
Variable impact
The variable LCA impact score provides the impacts generated during the operation of the technology, calculated by multiplying the annual use of the technology with the specific operational impact factor (Eq. 7). The latter is expressed in terms of impact per unit of provided energy service (impact/FU).
| (5) | ||||
| (6) | ||||
| (7) | ||||
The functional units for generating LCA metrics are ”Production of in Switzerland in 2020” for the operation phase, and ”Provide capacity in Switzerland in 2020” for construction phase.
| End use categories | Operation | Construction |
|---|---|---|
| Electricity | [GWh] | [GW] |
| Heat | [GWh] | [GW] |
| Mobility freight | [Mtkm] | [] |
| Mobility passenger | [Mpkm] | [] |
3.2 Life Cycle Assessment (LCA)
3.2.1 Mapping of Technologies with Life-Cycle Inventories
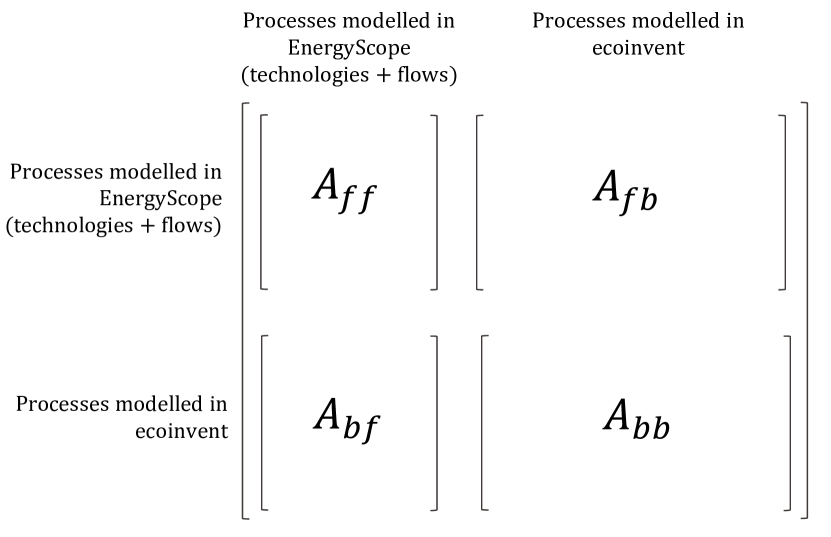
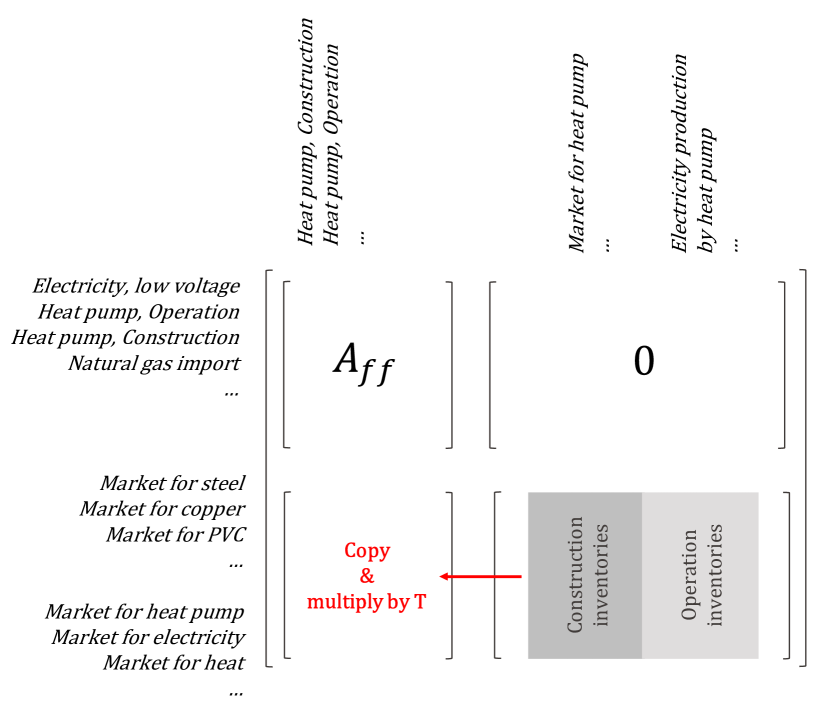
The systematic integration of LCA within the framework of ES encompasses a comprehensive mapping of 216 energy conversion and storage technologies with similar technologies documented in life cycle assessment databases. Each mapped technology from the LCA databases is decomposed in a constant (comprising construction and decommissioning) and a variable life cycle stage (covering operation). For instance, in the case of Photovoltaic Panel (PV) technology, the construction phase includes the activity ”Production of of PV panels”, whereas the operation phase encompasses the ”Production of of electricity by PV panels.” Certain technologies, such as electrolysis, are devoid of an operation inventory due to their exclusive environmental impact through the consumption of ES flows, thus eliminating redundancy (refer to Section 3.2.3 for details). The life-cycle inventory data is primarily sourced from ecoinvent 3.8 cut-off version (for established technologies) and from contemporary research (e.g., Sacchi et al.[39]) for emergent technologies. This data informs the expansion of the technology matrix (Figures 2(a) and 2(b)) and the elementary flows matrix in the context of ES.
3.2.2 Harmonization of EnergyScope and LCA Data
The harmonization process addresses the discrepancy in units between ES technologies operation and construction, and their life-cycle inventories activities, employing conversion factors to standardize impact measurement (detailed in Appendix LABEL:tab:app_tech_map). The background-foreground technology matrix is the result of the multiplication between the transformation matrix , which is populated by the conversion factors, and the sub-matrix of , which provides ecoinvent background processes (Figure 2(b)). Conversion factors in the transformation matrix T for mobility and energy transmission technologies includes other key parameters such as occupancy rates and transmission distances.
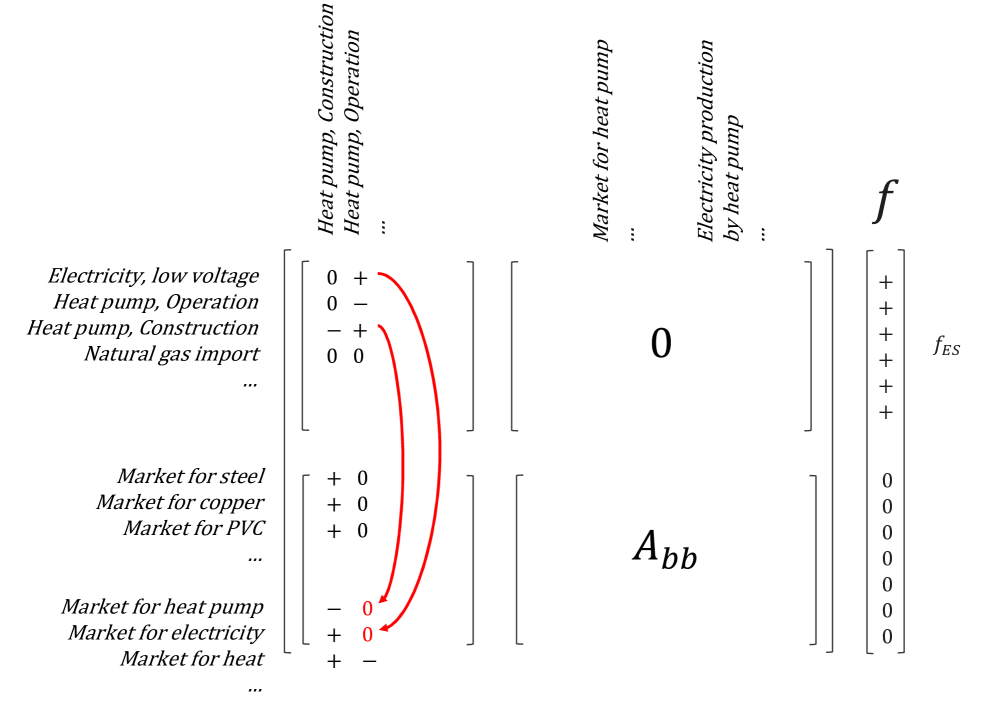
3.2.3 Double-counting Removal
Double-counting removal involves identifying and nullifying redundant flows within the integrated system. This process begins by identifying all input flows of a given technology in ES and cross-referencing them with the variable input flows from the corresponding technology in the technosphere matrix (essentially operation and maintenance). The intersection of both lists, facilitated by the Central Product Classification (CPC), highlights double-counted flows from the operation and maintenance that are excluded from the matrix (Figure 2(c)). Markets denote a specific kind of ecoinvent process, as they typically average different processes leading to the same product within a region. Market are thus composed of multiple similar flows. A recursive algorithm is employed to delve into the process tree and isolate pertinent flows. This refinement is reflected in the adjusted technology matrix, denoted as (Eq. 8).
3.2.4 Life-cycle Impact Assessment
The LCA metrics are derived using the IMPACT World+ (IW+) v2.0.1 impact assessment method, characterized by its matrix (Eq. 8) reporting characterization factors for given impact categories. This method delineates three Areas of Concern (AoC)—carbon footprint, fossil and nuclear energy use, and water scarcity footprint—alongside the Areas of Protection (AoP), namely human health and ecosystem quality. These two latter AoP aggregate the contribution of impact categories affecting human health such as (name few of them) and respectively ecosystem quality (such as ”name few of them”). The IW+ expert version allow to disaggregate these two AoP into 21 impact categories and evaluating their respective relative contribution. The computation of the overall environmental impact scores of each technology employs matrix , comprising impact results vectors specific a final demand vector (Eq. 9) for both operational and construction phases. In other words, an LCA is performed for each technology and phase of the model.
| (8) |
| (9) |
| Category | AoP | Acronym | Indicator | Unit |
|---|---|---|---|---|
| Impact profile | CF | Carbon footprint | ||
| FNEU | Fossil and nuclear energy use | |||
| REQD | Remaining Ecosystem quality damage | |||
| RHHD | Remaining Human health damage | |||
| WSF | Water scarcity footprint | |||
| Impact categories | Human Health | CCHHL | Climate change, human health, long term | |
| CCHHS | Climate change, human health, short term | |||
| HTXCL | Human toxicity cancer, long term | |||
| HTXCS | Human toxicity cancer, short term | |||
| HTXNCL | Human toxicity non-cancer, long term | |||
| HTXNCS | Human toxicity non-cancer, short term | |||
| IRHH | Ionizing radiation, human health | |||
| OLD | Ozone layer depletion | |||
| PMF | Particulate matter formation | |||
| PCOX | Photochemical oxidant formation | |||
| TTHH | Total human health | |||
| WAVHH | Water availability, human health | |||
| Ecosystem Quality | CCEQL | Climate change, ecosystem quality, long term | ||
| CCEQS | Climate change, ecosystem quality, short term | |||
| FWA | Freshwater acidification | |||
| FWEXL | Freshwater ecotoxicity, long term | |||
| FWEXS | Freshwater ecotoxicity, short term | |||
| FWEU | Freshwater eutrophication | |||
| IREQ | Ionizing radiation, ecosystem quality | |||
| LOBDV | Land occupation, biodiversity | |||
| LTBDV | Land transformation, biodiversity | |||
| MAL | Marine acidification, long term | |||
| MAS | Marine acidification, short term | |||
| MEU | Marine eutrophication | |||
| TRA | Terrestrial acidification | |||
| TPW | Thermally polluted water | |||
| TTEQ | Total ecosystem quality | |||
| WAVFWES | Water availability, freshwater ecosystem | |||
| WAVTES | Water availability, terrestrial ecosystem |
3.3 Multi-Objective Optimization (MOO)
MOO is an integral component of multi-criteria decision-making. It focuses on solving mathematical problems where several OFs must be optimized simultaneously. This approach is especially beneficial in energy planning scenarios with multiple competing objectives. For instance, EnergyScope, in its traditional applications, either optimized a single OF [36, 40, 37] or engaged in bi-objective optimization, generating carbo-economic Pareto curves in specific cases [41].
MOO aims to achieve various goals, which include:
-
•
Identifying solutions that align with the specific preferences of a decision-maker.
-
•
Curating a diverse set of Pareto-optimal solutions.
-
•
Quantifying the necessary trade-offs associated with each objective.
In this research, we have approached MOO by incorporating the LCIA OF, denoted as , as constraints during economic optimization (as shown in Eq. 10). This strategy defines the size and use of technology denoted as and , respectively. The weighting mechanism, provided in Eq. 11, navigates through the multidimensional Pareto curve, distinguishing between the extreme points recognized during Single-Objective Optimization (SOO). Here, and .
| (10) | ||||
| (11) | ||||
To comprehensively explore the solution space of MOO, we employed the quasi Monte-Carlo methodology [42] Sobol to sample the weights . The decision variables elucidate the modeled solution space , considering the varying weighting parameters , as presented in Eq. 12. Moreover, the probability of each weight is uniformly distributed between 0 and 1 around their median value , as indicated in Eq. 13.
| (12) | ||||
| (13) |
3.4 Application
The methodology was applied to the 2020 Swiss energy system to ensure consistency in term of temporal and technological representativeness between the technologies of ES with the LCA inventory database. Energy demands were derived from the 2020 Swiss energy statistics [43], with the overarching aim to explore hypotetical scenarios that meets the long-term ambition of a carbon-free energy system by 2020, as advocated by Energieperspektiven 2050 + (EP50+) ([44]), while ensuring energy supply security, but acknowledging the limitation of relying on the current technological context. This scenario deliberately excludes nuclear power, focusing on Switzerland’s ’best case’ in 2020, characterized by reliance on domestic energy sources and without energy imports to bolster supply security.
Demands
The energy statistics provide a breakdown of the final energy demand segmented by sectors. By leveraging the 2020 energy demand data [43] and categorizing it into distinct energy types. These sectoral demands are summarized in Table 3.
| Households | Services | Industry | Mobility | ||
|---|---|---|---|---|---|
| Electricity LV | 9818 | 9154 | 0 | 0 | |
| Electricity MV | 0 | 1407 | 3173 | 0 | |
| Electricity HV | 0 | 0 | 5350 | 0 | |
| Heat HT | 0 | 183 | 5855 | 0 | |
| Heat LT SH | 31849 | 6994 | 1965 | 0 | |
| Heat LT HW | 6322 | 1605 | 393 | 0 | |
| Freight | 0 | 0 | 0 | 21106 | |
| Passenger | 0 | 0 | 0 | 74590 |
Potentials
In modeling our energy system, we prioritize the security of supply by reducing any energy vector imports to zero. Consequently, all primary energy sources are derived from within the region under study, as defined by their potentials (see Table 4). We model the potential of the resources from a technical perspective rather than an economic one, as this latter is subject to arbitrary and uncertain estimation of future renewable energy markets.
Values in parentheses for hydropower technologies represent potential with reinforcement.
| Resources | Waste Fossil | Waste Bio | Wood | Wet Biomass | Hydro Storage |
|---|---|---|---|---|---|
| 10833 | 8917 | 15278 | 12472 | 8900 | |
| Technologies | Geothermal | Hydro Dam | Hydro River | PV | Wind |
| 4.8 | 8.08 (8.52) | 3.8 (4.65) | 67 | 20 | |
| 42.08 | 17.48 | 19.726 | 66.4 | 40.3 |
4 Results
4.1 Single-Objective Optimization
Pursuing of a comprehensive environomic analysis, each OF was individually optimized. This initial step was pivotal to ascertain the boundary values and , which serve as foundational metrics the subsequent MOO. A detailed representation of the tracking of OF values through individual optimization is illustrated in Figure 3. These values are evaluated to the current 2020 scenario to provide a coherent context, offering a comparative perspective on the shifts and nuances observed across each isolated optimization.
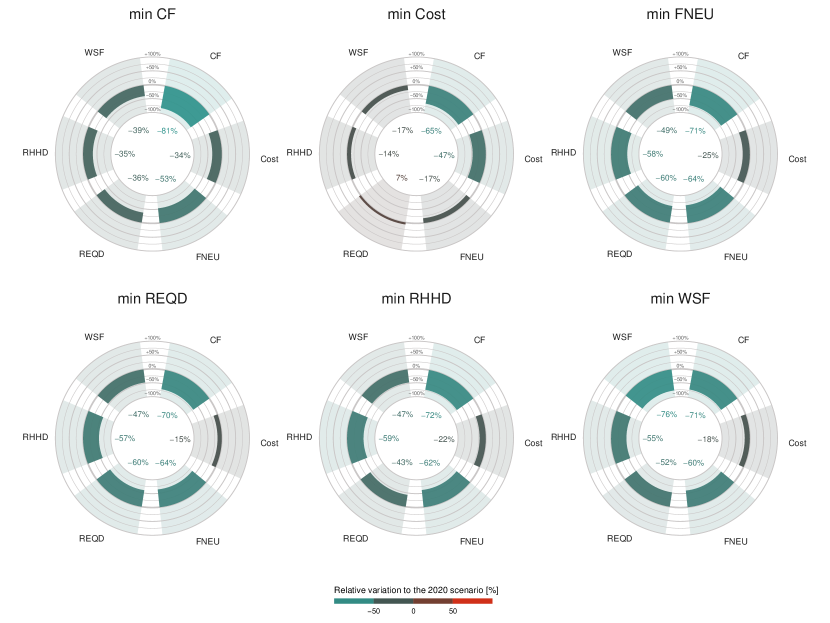
CF: Carbon Footprint, Cost: Total Cost, FNEU: Fossil and Nuclear Energy Use, REQD: Remaining Ecosystem Quality Dammage, RHHD: Remaining Human Health Dammage, WSF: Water Scarcity Footprint
Overview of Optimizations and Trade-offs
Minimizing different objective functions unveiled trade-offs between the economic and environmental objectives. For instance, when focusing solely on the reduction of Carbon Footprint (CF), a decrease of 81% of the same indicator was observed, accompanied by a significant drop in cost by 34% and reductions of the remaining environmental indicators of 35%-53% compared to the 2020 baseline scenario. However, when directing efforts to minimize cost, a substantial decrease in CF by 65% can be observed, but at the expense of a minor increase in Remaining Ecosystem Quality Dammage (REQD) by 7%. This pattern underscores that while striving to minimize costs might yield environmental benefits, such as a reduced carbon footprint, but it could also unintentionally aggravate other environmental challenges.
Diversifying the Environmental Focus
The results emphasize the intricacy of environomic relations. While CF, with its variations ranging between 65% and 81%, stands out as a significant environmental factor, our findings prompt us to consider the broader picture. This realization accentuates the necessity to expand our environmental scope, recognizing that metrics such as Fossil and Nuclear Energy Use (FNEU), REQD, Remaining Human Health Dammage (RHHD), and Water Scarcity Footprint (WSF), which have shown variations as pronounced as a 76% decrease in the case of WSF minimization, demand our attention and can’t be overlooked.
Energy system configurations
All optimal configurations, when compared to the 2020 reference scenario, have demonstrated an cost reduction of the energy system. The overall cost composition for the 2020 baseline scenario and six OF minimizations is depicted in Figure 4.

The optimal configurations are based on an energetically self-sustained system, thereby eliminating energy imports. Such optimized configurations correspond to hypothetical scenarios which are lean on local energy resources, with distinctions noticeable in utilizing primary energy sources, mobility and heating service technologies, and energy storage requisites. In contrast, the 2020 reference case representing current Swiss energy system, heavily depends on operational costs due to extensive fossil fuel imports.
In all optimized scenarios, renewable resources are leveraged extensively as seen in Figure 4. Wind turbines are deployed to their full potential, synergizing with existing hydropower plants. Variations arise when complementing this hydro-wind ensemble: PVs span between -. An exception is the CF minimization, which opts for geothermal power plants () over PV. The tangible operational costs stem from harnessing local biomass—utilized maximally in most scenarios, with the cost minimization scenario as an exception. Sectoral analysis can be found in the supplementary material B.
4.2 Multi-Objective Optimization
Upon executing the MOO, as detailed in Equation 12, for terations varying the OF-weight , 500 distinct Pareto-optimal configurations emerge. A comparative analysis among these configurations was performed, constructing the Pearson correlation coefficient matrix, focusing on the technologies and the OFs (Fig. 5).
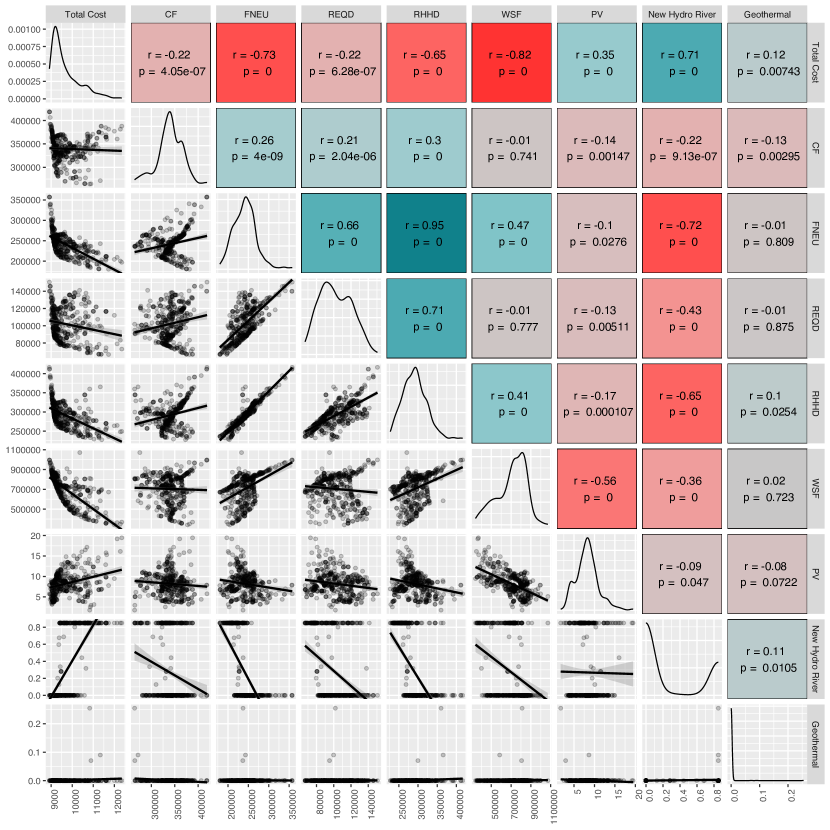
Technological and environomic Trade-Offs
Distinct correlations between technologies and OFs are identifiable within the matrix’s upper segment. Notably, a strong positive correlation is present between RHHD and FNEU, evidenced by a correlation coefficient (). This suggests a directly proportional relationship where an increase in RHHD results in a concurrent rise in FNEU and vice versa. Conversely, a significant negative correlation is observed between WSF and Total Cost (), implying that reduced water usage incurs higher energy system costs, thereby restricting the employment of existing hydroelectric infrastructure and necessitating supplemental energy solutions. Lesser yet noticeable correlations are apparent between Total Cost and other environmental OFs, specifically FNEU () and RHHD (), indicating that elevated environmental impacts accompany cost reductions. Although cost is inversely related to environmental OFs, FNEU demonstrates positive correlations with other environmental impacts, exhibiting a strong relationship with RHHD () and REQD (), as well as weaker associations with WSF and CF, thereby signaling a substantial potential for synergistic environmental benefits. RHHD exhibits a similar pattern, with strong correlations with both FNEU and REQD (), and weaker with CF and WSF.
In the context of technology and OFs interrelations, negative correlations suggest a minimizing effect on the OF with increased technology deployment. For example, New Hydro River demonstrates environmental benefits with negative correlations to FNEU () and RHHD (), yet this is coupled with an escalated Total Cost (). PV presents a parallel trend; elevating Total Cost with increased deployment (), while concurrently diminishing WSF (). Geothermal technology exhibits only nominal correlations with the remaining OFs and technologies, indicating a less pronounced impact on the overall system.
The scatter plot divulges the assortment of solutions in the matrix’s lower part. The Pareto frontier concerning environmental indicators is discernible within the Total Cost vector. Deviations from this frontier primarily emerge from solutions with a diminished focus on cost optimization. The robust correlation between RHHD and FNEU is prominent, with data points closely clustered along the linear regression line. A thorough examination of patterns in the LCA indicator columns reveals a wide dispersion of data points attributed to the stochastic nature of the Monte Carlo simulations (Eq. 13).
Exploring Renewable Energy Synergies: Correlations and Trade-offs in MOO
In the elucidation of Figure 5, a detailed exposition is conducted with the coordinates X and Y, symmetrically representing the objective functions, predominantly the costs and areas of concern juxtaposed against key renewable technologies like PV, new hydro river, and geothermal energy. Notably absent is wind energy, given its consistent deployment at maximal capacity. Each point delineated within the matrix symbolizes an optimization instance with varied weighting among the objectives, all of which are situated on a 6-dimensional Pareto front. This matrix distinctly excludes the current energy system, recognizing its inefficiency in meeting any of the considered objectives. A specific case in point is the analysis of the indicators FNEU and RHHD. As discerned in the matrix segment at (RHHD/FNEU), these objective functions demonstrate a significant correlation (, denoted by a green square), which is further elucidated through the point distribution and trend line in the segment (FNEU/RHHD). This correlation suggests that increases in RHHD are paralleled by increases in FNEU and vice versa. For instance, minimizing RHHD concurrently minimizes FNEU. This trend is further illuminated by examining the correlation of RHHD with specific technologies. A prime example is the inverse relationship between New Hydro River and FNEU (, indicated by a red square), suggesting that an increase in New Hydro River installations correlates with a decrease in FNEU. However, it is imperative to approach these findings with caution. As all points lie within the optimal space, the trends are not universally applicable but confined to the solution space. Thus, the assertion that increased New Hydro River installations invariably lead to lower FNEU values is not a generalizable conclusion but a trend observed within this specific set of optimal solutions.
Technology size distribution
The single-peak distribution, indicative of a single optimal systemic value, is seen for Total Costs (with the highest frequency at occurring at ), FNEU (), and RHHD (). These distributions suggest a preferred optimal solution across optimizations. The distance of these peaks from the respective minima in environomic indicators underscores the inherent trade-offs among the objective functions, evidenced by a relatively low frequency () for the minimal Total Cost configuration, highlighting that none of the indicators is positioned at its potential minimum.
Multi-peak distributions are observed for REQD, which shows a bimodal distribution, and for CF and WSF, each presenting a primary peak accompanied by a less pronounced secondary peak. Notably, PV installation capacity exhibits a primary peak at , with subsequent lesser peaks at and .
Extreme behavior, characterized by a binary distribution pattern of either zero installation or maximum potential utilization, is noted in the installed capacities of renewable technologies. New Hydro River installations, for instance, are either absent ( of cases) or realized at the full potential of in the remaining instances. An even more pronounced extreme distribution is observed for geothermal power plants, which are installed at the available potential of in only of cases. Unrepresented renewable resources such as Wind (), Hydro Dams (), and Hydro River () also exhibit extreme behavior, as they are consistently utilized at their maximum capacity across all scenarios, thereby denoting a characteristic of objective-independent optimality in the optimization process.
5 Discussion
Burden-Shifting
When minimizing total costs of the 2020 the Swiss energy system, CF is notably reduced by , reflecting a significant synergy between cost and carbon footprint reduction. However, this focus on cost tends to exacerbate other environmental indicators, manifesting a burden shift rather than a net reduction in environmental impact, as shown in similar economic optimizations of the carbon-neutral Switzerland [38]. Furthermore, the data reveals that specific environmental dimensions, especially FNEU and REQD, are highly reactive to fluctuations in cost. This insight is crucial as it suggests that economic interventions might occasionally lead to environmental ramifications not immediately apparent if success is judged by the decrease of the carbon footprint alone. Conclusively, a comprehensive and diversified approach, rather than a carbon-centric paradigm, is indispensable for genuine environomic synergy.
Conversely, targeting CF minimization yields broad environmental improvements, with only slight increases observed in RHHD and REQD. This suggest a more balanced trade-off between different environmental aspects.
Crucially, targeting the minimization of other environmental indicators invariably results in better overall environomic outcomes. These strategies surpass the current system in both environmental and economic terms, underscoring the benefit of a multi-faceted environmental approach to energy system optimization. The findings advocate for nuanced strategies that consider the interconnectedness of environomic indicators to avoid shifting burdens and achieve genuine sustainability improvements.
Renewable is the solution, but…
Switzerland’s energy system leverages wind and hydro resources to their limits, with wind installations at and hydro at across all examined scenarios. Solar PV’s capacity fluctuates between and , indicating adaptive strategies for solar energy use based on varying environmental and economic goals.
Energy storage is a linchpin in managing the supply-demand balance, with hydro dam storage consistently maxed at . Scenarios also integrate of biogenic methane or of diesel for seasonal energy storage, underscoring the tailored approaches to achieving system resilience and environmental goals.
Dependencies
The study shows that environmental and economic goals in energy systems are closely interconnected, often with direct trade-offs between cost and environmental impacts. Specifically, the positive correlation between RHHD and FNEU with indicates that minimizing the reliance on fossil fuels and nuclear energy can significantly reduce damages on human health RHHD and vice-versa. Conversely, the negative correlation between WSF and Total Cost () reveals the economic challenges inherent in reducing water use, as less reliance on hydroelectric power demands investment in alternative, more expensive energy sources such as geothermal power plants.
The study also highlights the complexities in the energy transition, where choosing environmentally beneficial technologies may result in higher costs. For example, adopting new hydro river technology demonstrates environmental benefits but at the expense of increased total costs ( with Total Cost), illustrating the difficulty of simultaneously achieving both economic and comprehensive environmental goals. The nuanced relationship between Total Cost and environmental objectives is evident, where cost reductions may potentially increase environmental impacts ( with FNEU and with RHHD), suggesting that low-cost energy solutions could have unintended environmental consequences. Nevertheless, the study demonstrates that minimizing each environmental indicator leads to a more cost-effective solution than in 2020.
Towards a renewable energy system
In analyzing Swiss energy system optimization, single-peak distributions for Total Costs, FNEU, and RHHD converge towards specific system values, yet they remain suboptimal. For instance, the highest frequency for Total Costs occurs at 9,500 MCHF (10.5%), suggesting a generally accepted system cost that is not at the absolute minimum, highlighting necessary trade-offs between objectives. Multi-peak distributions in indicators like REQD, CF, and WSF, with PV installations peaking at and showing lesser peaks at and , imply multiple potential configurations that cater to different prioritizations, enforcing the inevitability of compromise in system design.
Extreme binary distributions in technology installations further illustrate this point. For example, New Hydro River installations are either fully utilized at or not at all, evident in of cases. Similarly, geothermal plants reach their potential in only of cases. On the other hand, technologies like Wind (20 GW), Hydro Dams (), and Hydro River () are consistently maximized, indicating a strategic preference irrespective of the scenario. This showcases the system’s inclination towards certain technologies, underscoring a deliberate trade-off in exploiting renewable resources to meet set environomic objectives.
Go green: A Perspective on Burden-Shifting
The phenomenon of burden-shifting in the context of energy system optimization presents a nuanced landscape, particularly when contrasting SOO with MOO results. In the realm of SOO, we observe clear instances of burden-shifting: for instance, minimizing total cost significantly enhances the CF but at the expense of other environmental indicators. This points towards a unilateral approach where focusing excessively on one objective can inadvertently aggravate other environmental facets. However, the landscape shifts when considering MOO. Here, positive correlations emerge across all environmental indicators, indicating a more harmonious and balanced improvement across various environmental aspects. This dichotomy between SOO and MOO underlines the pitfalls of extreme, singular-focus strategies in optimizing energy systems.
This observation aligns with the current state of energy systems, which are far from their optimal states. In such a scenario, improving any single environmental indicator does not lead to a negative impact on others. This underscores the importance of a balanced, multi-dimensional approach to optimization, where improvements are not just desirable but necessary in any direction. By doing so, it’s possible to navigate away from the pitfalls of burden-shifting and move towards a more sustainable and holistic optimization of energy systems, aligning with the broader goals of environmental stewardship and sustainable development.
Limitation
The study’s discussion reveals several key limitations that influence the interpretation of our results.
Firstly, focusing on Switzerland in 2020, the case study’s reliance on the EcoInvent database, which assesses the current energy system, might limit the generalization of our findings to other geographical regions or different time periods.
Another significant limitation is the absence of regionalization in impact value assessments. This methodological choice led to the application of global average values for certain parameters, most notably in the water scarcity footprint. By using a global impact factor, hydro power stations in Switzerland, where water scarcity is a minor issue compared to the global average, were inadvertently disadvantaged.
Additionally, the exclusion of carbon as a resource within the energy system is a notable limitation. This omission prevented the implementation of negative emission technologies, thereby hindering the creation of fully carbon-neutral scenarios that compensate for both direct and indirect emissions of the energy system.
Finally, the study’s approach presents a challenge in adequately addressing the remaining areas of protection, specifically RHHD and REQD. By individually considering carbon footprint and water scarcity footprint, the study overlooks the significant interplay between these indicators and their collective impact on RHHD and REQD. This oversight suggests a need for more integrated assessment methods in future research to fully capture the interconnected impacts on these crucial areas of protection.
6 Conclusions
Methodological Innovations and Technological Validation
This study marks a significant advancement in integrating LCIA impacts within energy system modeling, particularly tailored for the Swiss energy landscape. We introduced a methodological framework that not only accurately characterizes technologies within LCI but also embeds LCA into the energy system modeling process. The inclusion of diverse environmental metrics alongside traditional economic considerations paves the way for a more comprehensive and multifaceted approach to energy system analysis.
Burden shifting in Single Objective Optimization
While any optimizations (economic and environmental) lead to cost and environmental impact reductions compared to the current energy system, environmental burden shifting in between the environmental optimal solutions appears. This outcome highlights the complexity of balancing environmental and economic objectives and the importance of considering a broader range of environmental impacts in energy system optimization.
Compromises in Multi Objective Optimizations
Our study delves deeply into MOO, presenting solutions to avoid environmental burden shifting. By optimizing for multiple environmental indicators simultaneously, MOO approaches succeeded in minimizing overall environmental impacts without the trade-offs observed in single-objective optimization. For example, strategies focusing on reducing the CF improved the overall environmental profile while causing only marginal burden shifts in RHHD and REQD.
Impact on Swiss Energy System Configuration
The application of our methodology to the Swiss energy system optimization yields critical quantitative findings. Renewable energy sources, such as wind power, were maximized to , and hydro power to . Solar PV installations varied between and , depending on the optimization scenario. For energy storage, hydro dam storage was key at , supplemented by biogenic methane () and diesel reserves (), highlighting their role in balancing seasonal fluctuations.
7 Future work
Beyond identifying the optimal peaks in indicators and technologies that showcase trade-offs, future research should delineate typical configurations that energy planners can reliably refer to, which implies establishing clearer direct correlations between specific technologies and environmental indicators, aiding in designing sustainable energy systems.
While the MOO assessment reveals correlations between environomic objective functions, there is a need to determine which environomic indicators should be prioritized for detailed monitoring. Future studies should aim to identify these critical indicators that significantly influence energy systems’ sustainability and economic feasibility. Identifying typical configurations and the assessment of environomic dependencies is subject to a future publication in redaction.
Declaration of generative AI and AI-assisted technologies in the writing process
During the preparation of this work the authors used Grammarly in order to improve the language used in this article. After using this tool, the authors reviewed and edited the content as needed and take full responsibility for the content of the publication.
Data availability
The datasets for this study can be found in the respective Gitlab repositories:
-
•
EnergyScope technologies documentation
https://gitlab.com/ipese/energyscope/data/energy-technologies -
•
LCA technology documentation
https://gitlab.com/ipese/energyscope-lca
Additional data is available upon pertinent request.
Acknowledgments
This research has received funding from (i) the Flagship Initiative under the project “Flagship PFFS-21-03” Blue City.
Competing Interests
The authors declare that they have no competing financial interests.
Glossary
- AoC
- Areas of Concern
- AoP
- Areas of Protection
- CAT
- Climate Action Tracker
- CF
- Carbon Footprint
- EP50+
- Energieperspektiven 2050 +
- ES
- EnergyScope
- FNEU
- Fossil and Nuclear Energy Use
- GHG
- Greenhouse Gas
- IPCC
- Intergovernmental Panel on Climate Change
- IRENA
- International Renewable Energy Agency
- IW+
- IMPACT World+
- LCA
- Life Cycle Assessment
- LCI
- Life Cycle Inventory
- LCIA
- Life Cycle Impact Assessment
- MILP
- Mixed Integer Linear Programming
- MOO
- Multi-Objective Optimization
- NDCs
- Nationally Determined Contributions
- OF
- Objective Function
- PV
- Photovoltaic Panel
- REQD
- Remaining Ecosystem Quality Dammage
- RHHD
- Remaining Human Health Dammage
- SOO
- Single-Objective Optimization
- WSF
- Water Scarcity Footprint
Nomenclature
The following convention in nomenclature is applied
-
•
Modeling variables:
-
•
Modeling parameters:
-
•
Modeling sets:
-
•
General parameters not included in the model:
Parameters
Variables
| Cost | ||
| Installation size | ||
| Installation use | ||
| LCIA Impact |
Sets
Subscripts
| Investment | |
| Maintenance | |
| Objective | |
| Static | |
| Period | |
| Total | |
| Variable |
References
- [1] Alexis Laurent, Nieves Espinosa and Michael Z. Hauschild “LCA of Energy Systems” In Life Cycle Assessment: Theory and Practice Cham: Springer International Publishing, 2018, pp. 633–668 DOI: 10.1007/978-3-319-56475-3˙26
- [2] Antonella Petrillo, Fabio De Felice, Elio Jannelli, Claudio Autorino, Mariagiovanna Minutillo and Antonio Lubrano Lavadera “Life Cycle Assessment (LCA) and Life Cycle Cost (LCC) Analysis Model for a Stand-Alone Hybrid Renewable Energy System” In Renewable Energy 95, 2016, pp. 337–355 DOI: 10.1016/j.renene.2016.04.027
- [3] Antonio Valente, Diego Iribarren and Javier Dufour “Life Cycle Assessment of Hydrogen Energy Systems: A Review of Methodological Choices” In The International Journal of Life Cycle Assessment 22.3, 2017, pp. 346–363 DOI: 10.1007/s11367-016-1156-z
- [4] Carla Pieragostini, Miguel C. Mussati and Pío Aguirre “On Process Optimization Considering LCA Methodology” In Journal of Environmental Management 96.1, 2012, pp. 43–54 DOI: 10.1016/j.jenvman.2011.10.014
- [5] Rutian Wang, Xiangyun Wen, Xiuyun Wang, Yanbo Fu and Yu Zhang “Low Carbon Optimal Operation of Integrated Energy System Based on Carbon Capture Technology, LCA Carbon Emissions and Ladder-Type Carbon Trading” In Applied Energy 311, 2022, pp. 118664 DOI: 10.1016/j.apenergy.2022.118664
- [6] Martin János Mayer, Artúr Szilágyi and Gyula Gróf “Environmental and Economic Multi-Objective Optimization of a Household Level Hybrid Renewable Energy System by Genetic Algorithm” In Applied Energy 269, 2020, pp. 115058 DOI: 10.1016/j.apenergy.2020.115058
- [7] R Loulou, D Van Regemorter, R Dones, B Droste-Franke, R Friedrich, R Frischknecht, S Hirschberg, W Krewitt, S Kypreos and P Preiss “Final Report on the Harmonization of Methodologies” In NEEDS Deliverable, 2008
- [8] Nils Baumgärtner, Sarah Deutz, Christiane Reinert, Niklas Nolzen, Lucas Elias Kuepper, Maike Hennen, Dinah Elena Hollermann and André Bardow “Life-Cycle Assessment of Sector-Coupled National Energy Systems: Environmental Impacts of Electricity, Heat, and Transportation in Germany Till 2050” In Frontiers in Energy Research 9, 2021, pp. 621502 DOI: 10.3389/fenrg.2021.621502
- [9] Dominik Huber, Daniele Costa, Alex Felice, Pieter Valkering, Thierry Coosemans and Maarten Messagie “Decentralized Energy in Flexible Energy System: Life Cycle Environmental Impacts in Belgium” In Science of The Total Environment 886, 2023, pp. 163882 DOI: 10.1016/j.scitotenv.2023.163882
- [10] T. Naegler, J. Buchgeister, H. Hottenroth, S. Simon, I. Tietze, T. Viere and T. Junne “Life Cycle-Based Environmental Impacts of Energy System Transformation Strategies for Germany: Are Climate and Environmental Protection Conflicting Goals?” In Energy Reports 8, 2022, pp. 4763–4775 DOI: 10.1016/j.egyr.2022.03.143
- [11] Herib Blanco, Victor Codina, Alexis Laurent, Wouter Nijs, François Maréchal and André Faaij “Life Cycle Assessment Integration into Energy System Models: An Application for Power-to-Methane in the EU” In Applied Energy 259, 2020, pp. 114160 DOI: 10.1016/j.apenergy.2019.114160
- [12] Miguel Fernández Astudillo, Kathleen Vaillancourt, Pierre-Olivier Pineau and Ben Amor “Human Health and Ecosystem Impacts of Deep Decarbonization of the Energy System” In Environmental Science & Technology 53.23, 2019, pp. 14054–14062 DOI: 10.1021/acs.est.9b04923
- [13] Antoine Boubault, Seungwoo Kang and Nadia Maïzi “Closing the TIMES Integrated Assessment Model (TIAM-FR) Raw Materials Gap with Life Cycle Inventories” In Journal of Industrial Ecology 23.3, 2019, pp. 587–600 DOI: 10.1111/jiec.12780
- [14] Kathrin Volkart, Christopher L. Mutel and Evangelos Panos “Integrating Life Cycle Assessment and Energy System Modelling: Methodology and Application to the World Energy Scenarios” In Sustainable Production and Consumption 16, 2018, pp. 121–133 DOI: 10.1016/j.spc.2018.07.001
- [15] Diego García-Gusano, Daniel Garraín and Javier Dufour “Prospective Life Cycle Assessment of the Spanish Electricity Production” In Renewable and Sustainable Energy Reviews 75, 2017, pp. 21–34 DOI: 10.1016/j.rser.2016.10.045
- [16] Michaja Pehl, Anders Arvesen, Florian Humpenöder, Alexander Popp, Edgar G. Hertwich and Gunnar Luderer “Understanding Future Emissions from Low-Carbon Power Systems by Integration of Life-Cycle Assessment and Integrated Energy Modelling” In Nature Energy 2.12, 2017, pp. 939–945 DOI: 10.1038/s41560-017-0032-9
- [17] Peter Berrill, Anders Arvesen, Yvonne Scholz, Hans Christian Gils and Edgar G Hertwich “Environmental Impacts of High Penetration Renewable Energy Scenarios for Europe” In Environmental Research Letters 11.1, 2016, pp. 014012 DOI: 10.1088/1748-9326/11/1/014012
- [18] Laurent Vandepaer, Evangelos Panos, Christian Bauer and Ben Amor “Energy System Pathways with Low Environmental Impacts and Limited Costs: Minimizing Climate Change Impacts Produces Environmental Cobenefits and Challenges in Toxicity and Metal Depletion Categories” In Environmental Science & Technology 54.8, 2020, pp. 5081–5092 DOI: 10.1021/acs.est.9b06484
- [19] Jean-Nicolas Louis, Stéphane Allard, Freideriki Kotrotsou and Vincent Debusschere “A Multi-Objective Approach to the Prospective Development of the European Power System by 2050” In Energy 191, 2020, pp. 116539 DOI: 10.1016/j.energy.2019.116539
- [20] Sebastian Rauner and Maik Budzinski “Holistic Energy System Modeling Combining Multi-Objective Optimization and Life Cycle Assessment” In Environmental Research Letters 12.12, 2017, pp. 124005 DOI: 10.1088/1748-9326/aa914d
- [21] Christian Barteczko-Hibbert, Ioannis Bonis, Michael Binns, Constantinos Theodoropoulos and Adisa Azapagic “A Multi-Period Mixed-Integer Linear Optimisation of Future Electricity Supply Considering Life Cycle Costs and Environmental Impacts” In Applied Energy 133, 2014, pp. 317–334 DOI: 10.1016/j.apenergy.2014.07.066
- [22] Koji Tokimatsu, Longlong Tang, Rieko Yasuoka, Ryota Ii, Norihiro Itsubo and Masahiro Nishio “Toward More Comprehensive Environmental Impact Assessments: Interlinked Global Models of LCIA and IAM Applicable to This Century” In The International Journal of Life Cycle Assessment 25.9, 2020, pp. 1710–1736 DOI: 10.1007/s11367-020-01750-8
- [23] Ibrahim M. Algunaibet, Carlos Pozo, Ángel Galán-Martín and Gonzalo Guillén-Gosálbez “Quantifying the Cost of Leaving the Paris Agreement via the Integration of Life Cycle Assessment, Energy Systems Modeling and Monetization” In Applied Energy 242, 2019, pp. 588–601 DOI: 10.1016/j.apenergy.2019.03.081
- [24] Stanislav E. Shmelev and Jeroen C.J.M. van den Bergh “Optimal Diversity of Renewable Energy Alternatives under Multiple Criteria: An Application to the UK” In Renewable and Sustainable Energy Reviews 60, 2016, pp. 679–691 DOI: 10.1016/j.rser.2016.01.100
- [25] Joana Portugal-Pereira, Alexandre C. Köberle, Rafael Soria, André F.P. Lucena, Alexandre Szklo and Roberto Schaeffer “Overlooked Impacts of Electricity Expansion Optimisation Modelling: The Life Cycle Side of the Story” In Energy 115, 2016, pp. 1424–1435 DOI: 10.1016/j.energy.2016.03.062
- [26] Diego García-Gusano, Diego Iribarren, Mario Martín-Gamboa, Javier Dufour, Kari Espegren and Arne Lind “Integration of Life-Cycle Indicators into Energy Optimisation Models: The Case Study of Power Generation in Norway” In Journal of Cleaner Production 112, 2016, pp. 2693–2696 DOI: 10.1016/j.jclepro.2015.10.075
- [27] Will McDowall, Baltazar Solano Rodriguez, Arkaitz Usubiaga and José Acosta Fernández “Is the Optimal Decarbonization Pathway Influenced by Indirect Emissions? Incorporating Indirect Life-Cycle Carbon Dioxide Emissions into a European TIMES Model” In Journal of Cleaner Production 170, 2018, pp. 260–268 DOI: 10.1016/j.jclepro.2017.09.132
- [28] Jean-Nicolas Louis, Stéphane Allard, Vincent Debusschere, Silvana Mima, Tuan Tran-Quoc and Nouredine Hadjsaid “Environmental Impact Indicators for the Electricity Mix and Network Development Planning towards 2050 – A POLES and EUTGRID Model” In Energy 163, 2018, pp. 618–628 DOI: 10.1016/j.energy.2018.08.093
- [29] Tom Terlouw, Paolo Gabrielli, Tarek AlSkaif, Christian Bauer, Russell McKenna and Marco Mazzotti “Optimal Economic and Environmental Design of Multi-Energy Systems” In Applied Energy 347, 2023, pp. 121374 DOI: 10.1016/j.apenergy.2023.121374
- [30] Christiane Reinert, Niklas Nolzen, Julia Frohmann, Dominik Tillmanns and André Bardow “Design of Low-Carbon Multi-Energy Systems in the SecMOD Framework by Combining MILP Optimization and Life-Cycle Assessment” In Computers & Chemical Engineering 172, 2023, pp. 108176 DOI: 10.1016/j.compchemeng.2023.108176
- [31] Fabio Menten, Stéphane Tchung-Ming, Daphné Lorne and Frédérique Bouvart “Lessons from the Use of a Long-Term Energy Model for Consequential Life Cycle Assessment: The BTL Case” In Renewable and Sustainable Energy Reviews 43, 2015, pp. 942–960 DOI: 10.1016/j.rser.2014.11.072
- [32] Diego García-Gusano, Mario Martín-Gamboa, Diego Iribarren and Javier Dufour “Prospective Analysis of Life-Cycle Indicators through Endogenous Integration into a National Power Generation Model” In Resources 5.4, 2016, pp. 39 DOI: 10.3390/resources5040039
- [33] Nick Martin, Laura Talens-Peiró, Gara Villalba-Méndez, Rafael Nebot-Medina and Cristina Madrid-López “An Energy Future beyond Climate Neutrality: Comprehensive Evaluations of Transition Pathways” In Applied Energy 331, 2023, pp. 120366 DOI: 10.1016/j.apenergy.2022.120366
- [34] Justine Brun, Jonas Schnidrig, Manuele Margni and François Maréchal “Reducing Greenhouse Gas Emissions Is Not the Only Solution”, 2022, pp. 92
- [35] Jonas Schnidrig, Justine Brun, François Maréchal and Manuele Margni “Integration of Life Cycle Impact Assessment in Energy System Modelling” In 36th International Conference on Efficiency, Cost, Optimization, Simulation and Environmental Impact of Energy Systems (ECOS 2023) Las Palmas De Gran Canaria, Spain: ECOS 2023, 2023, pp. 2810–2822 DOI: 10.52202/069564-0252
- [36] Stefano Moret “Strategic energy planning under uncertainty”, 2017 DOI: 10.5075/epfl-thesis-7961
- [37] Xiang Li, Theodoros Damartzis, Zoe Stadler, Stefano Moret, Boris Meier, Markus Friedl and François Maréchal “Decarbonization in Complex Energy Systems: A Study on the Feasibility of Carbon Neutrality for Switzerland in 2050” In Frontiers in Energy Research 8, 2020, pp. 549615 DOI: 10/gjgz7v
- [38] Jonas Schnidrig, Rachid Cherkaoui, Yasmine Calisesi, Manuele Margni and François Maréchal “On the Role of Energy Infrastructure in the Energy Transition. Case Study of an Energy Independent and CO2 Neutral Energy System for Switzerland” In Frontiers in Energy Research 11, 2023 DOI: 10.3389/fenrg.2023.1164813
- [39] R. Sacchi, T. Terlouw, K. Siala, A. Dirnaichner, C. Bauer, B. Cox, C. Mutel, V. Daioglou and G. Luderer “PRospective EnvironMental Impact asSEment (Premise): A Streamlined Approach to Producing Databases for Prospective Life Cycle Assessment Using Integrated Assessment Models” In Renewable and Sustainable Energy Reviews 160, 2022, pp. 112311 DOI: 10.1016/j.rser.2022.112311
- [40] Gauthier Limpens, Stefano Moret, Hervé Jeanmart and Francois Maréchal “EnergyScope TD: A novel open-source model for regional energy systems” In Applied Energy 255, 2019, pp. 113729 DOI: 10.1016/j.apenergy.2019.113729
- [41] Jonas Schnidrig, Tuong-Van Nguyen, Xiang Li and Francois Maréchal “A modelling framework for assessing the impact of green mobility technologies on energy systems” In Proceedings of ECOS 2021 Taormina, ITALY: ECOS 2021 Local Organizing Committee, 2021, pp. 13
- [42] Nicholas Metropolis and S. Ulam “The Monte Carlo Method” Publisher: [American Statistical Association, Taylor & Francis, Ltd.] In Journal of the American Statistical Association 44.247, 1949, pp. 335–341 DOI: 10.2307/2280232
- [43] Giulia Leuchthaler-Felber “Schweizerische Gesamtenergiestatistik 2019”, 2020, pp. 72
- [44] Andreas Kemmler, Almut Kirchner and Sven Kreidelmeyer “Energieperspektiven 2050+, Technischer Bericht”, 2021, pp. 501 URL: https://www.bfe.admin.ch/bfe/de/home/politik/energieperspektiven-2050-plus.exturl.html/aHR0cHM6Ly9wdWJkYi5iZmUuYWRtaW4uY2gvZGUvcHVibGljYX/Rpb24vZG93bmxvYWQvMTA3ODM=.html
- [45] International Organization for Standardization (ISO) “ISO 14040 : Environmental management— Life cycle assessment — Principles and framework”, 2006 URL: https://www.iso.org/obp/ui/fr/#iso:std:iso:14040:ed-2:v1:en
- [46] Gregor Wernet “The ecoinvent database version 3 (part I): overview and methodology” In The International Journal of Life Cycle Assessment 21.9, 2016, pp. 1218–1230 DOI: 10.1007/s11367-016-1087-8
- [47] Cécile Bulle et al. “IMPACT World+: a globally regionalized life cycle impact assessment method” In The International Journal of Life Cycle Assessment 24.9, 2019, pp. 1653–1674 DOI: 10.1007/s11367-019-01583-0
Appendix A Life Cycle Assessment (LCA)
A.1 General theory
The objective of LCA is to assess the potential impacts of a product system throughout its whole life cycle. The typical model employed is the cradle-to-grave approach, commencing with raw material extraction and culminating in product disposal via recycling, landfilling, or incineration [45]. The LCA procedure encompasses four stages:
-
1.
Definition of goal and scope
- 2.
- 3.
-
4.
Interpretation
A.1.1 Definition of Goal and Scope
Each technology must be delineated distinctly to accurately incorporate LCA into the ES model. A dual-product specification—of its construction and operation—characterizes every technology, mirroring the cradle-to-grave approach. The functional units are contingent upon the technology’s end-use category, as detailed in Table 1.
A.1.2 Life Cycle Inventory (LCI)
Instead of a sequential method, the LCI computation employed a matrix approach. This method facilitates the seamless integration of feedback loops in product systems. It negates the need for explicit scaling factor computation, provided the final demand vector is known (Table 5). The relationships between products are described by the technology matrix . Further matrix structure and relationship specifications are available within the ecoinvent database [46]. The LCI’s expressions in terms of matrices are as follows:
| (14) | ||||
| (15) |
A.1.3 Life Cycle Impact Assessment
The LCIA uses twenty-nine damage level indicators, which are further complemented by three AoCs (CF, FNEU and WSF) and two Areas of Protections (AoPs) (REQD, RHHD). The impact assessment leverages the IW+ method [47], which matrix is multiplied by the LCI’s vector to get the impact result vector :
| (16) |
| Notation | Name |
|---|---|
| A | Leontief technology matrix |
| B | Matrix of elementary flows |
| Final demand vector | |
| Scaling vector | |
| Life cycle inventory vector |
A.1.4 Assumptions
In mobility, car products from the ecoinvent database are specified per kilometer. For Switzerland, an average of 1.6 passengers per car was assumed, as cited in [41]. Although impacts from technology maintenance and transportation are predominantly encapsulated within the operation, the granularity of the details might vary. Consequently, the decision was to integrate these impacts into the operational facet rather than treating them separately.
A.2 Functional units
| Technology(EnergyScope) | Type | Name of the activity (LCA) | Product of the activity (LCA) | Region (LCA) | Source | Conversion factor | Unit |
|---|---|---|---|---|---|---|---|
| Alkaline Electrolysis | Construction | electrolyzer production, 1MWe, AEC, Stack | electrolyzer, 1MWe, AEC, Stack | RER | Sacchi et al. | 1492.537313 | unit / GW |
| Alkaline Electrolysis | Operation | hydrogen production, gaseous, 20 bar, from AEC electrolysis, from grid electricity | hydrogen, gaseous, 20 bar | CH | Sacchi et al. | 30030.03003 | kg / GWh |
| Aluminum Making | Construction | aluminium casting facility construction | aluminium casting facility | RER | ecoinvent 3.8 cut-off | 67.38461538 | unit / kt/h |
| Aluminum Making | Operation | aluminium production, primary, ingot | aluminium, primary, ingot | IAI Area, EU27 & EFTA | ecoinvent 3.8 cut-off | 1000000.0 | kg / kt |
| Aluminum Making Heat Recovery | Construction | aluminium casting facility construction | aluminium casting facility | RER | ecoinvent 3.8 cut-off | 67.38461538 | unit / kt/h |
| Aluminum Making Heat Recovery | Operation | aluminium production, primary, ingot | aluminium, primary, ingot | IAI Area, EU27 & EFTA | ecoinvent 3.8 cut-off | 1000000.0 | kg / kt |
| Anaerobic Digestion of Sewage Sludge | Construction | anaerobic digestion plant construction, for biowaste | anaerobic digestion plant, for biowaste | CH | ecoinvent 3.8 cut-off | 63.02158273 | unit / GW |
| Anaerobic Digestion of Sewage Sludge | Operation | anaerobic digestion of manure | biogas | RoW | ecoinvent 3.8 cut-off | 100478.2766 | m3 / GWh |
| Anaerobic Digestion of Sewage Sludge Cogeneration | Operation | anaerobic digestion of manure | biogas | RoW | ecoinvent 3.8 cut-off | 229175.4677 | m3 / GWh |
| ”Compressed Natural Gas-Powered Bus ” | Construction | Passenger bus, compressed gas, 13m single deck urban bus, 2020, EURO-VI | Passenger bus, EURO-VI | RER | Sacchi et al. | 9358.974359 | unit / Mpkm/h |
| ”Compressed Natural Gas-Powered Bus ” | Operation | transport, passenger bus, compressed gas, 13m single deck urban bus, 2020, EURO-VI | transport, passenger bus, EURO-VI | RER | Sacchi et al. | 1000000.0 | pkm / Mpkm |
| Diesel-Powered Bus | Construction | Passenger bus, diesel, 13m single deck urban bus, 2020, EURO-VI | Passenger bus, EURO-VI | RER | Sacchi et al. | 9358.974359 | unit / Mpkm/h |
| Diesel-Powered Bus | Operation | transport, passenger bus, diesel, 13m single deck urban bus, 2020, EURO-VI | transport, passenger bus, EURO-VI | RER | Sacchi et al. | 1000000.0 | pkm / Mpkm |
| Electric-Powered Bus | Construction | Passenger bus, battery electric - overnight charging, NMC-622 battery, 13m single deck urban bus, 2020 | Passenger bus | RER | Sacchi et al. | 9358.974359 | unit / Mpkm/h |
| Electric-Powered Bus | Operation | transport, passenger bus, battery electric - overnight charging, NMC-622 battery, 13m single deck urban bus, 2020 | transport, passenger bus | RER | Sacchi et al. | 1000000.0 | pkm / Mpkm |
| Hydrogen Fuel Cell Bus with Methane Hybridization | Construction | Passenger bus, fuel cell electric, 13m single deck urban bus, 2020 | Passenger bus | RER | Sacchi et al. | 9358.974359 | unit / Mpkm/h |
| Hydrogen Fuel Cell Bus with Methane Hybridization | Operation | transport, passenger bus, fuel cell electric, 13m single deck urban bus, 2020 | transport, passenger bus | RER | Sacchi et al. | 1000000.0 | pkm / Mpkm |
| Hydrogen Fuel Cell Bus with Hydrogen Hybridization | Construction | Passenger bus, fuel cell electric, 13m single deck urban bus, 2020 | Passenger bus | RER | Sacchi et al. | 9358.974359 | unit / Mpkm/h |
| Hydrogen Fuel Cell Bus with Hydrogen Hybridization | Operation | transport, passenger bus, fuel cell electric, 13m single deck urban bus, 2020 | transport, passenger bus | RER | Sacchi et al. | 1000000.0 | pkm / Mpkm |
| Diesel Hybrid Bus | Construction | Passenger bus, diesel hybrid, 13m double deck urban bus, 2020, EURO-VI | Passenger bus, EURO-VI | RER | Sacchi et al. | 9358.974359 | unit / Mpkm/h |
| Diesel Hybrid Bus | Operation | transport, passenger bus, diesel, 13m single deck urban bus, 2020, EURO-VI | transport, passenger bus, EURO-VI | RER | Sacchi et al. | 1000000.0 | pkm / Mpkm |
| Battery Electric Car with Low Range | Construction | Passenger car, battery electric, NMC-622 battery, Small, 2020 | Passenger car | RER | Sacchi et al. | 768421.0526 | unit / Mpkm/h |
| Battery Electric Car with Low Range | Operation | transport, passenger car, battery electric, NMC-622 battery, Small, 2020 | transport, passenger car | RER | Sacchi et al. | 666666.6667 | km / Mpkm |
| Battery Electric Car with Medium Range for Local Use | Construction | Passenger car, battery electric, NMC-622 battery, Lower medium, 2020 | Passenger car | RER | Sacchi et al. | 768421.0526 | unit / Mpkm/h |
| Battery Electric Car with Medium Range for Local Use | Operation | transport, passenger car, battery electric, NMC-622 battery, Lower medium, 2020 | transport, passenger car | RER | Sacchi et al. | 666666.6667 | km / Mpkm |
| Battery Electric Car with Medium Range for Long Distances | Construction | Passenger car, battery electric, NMC-622 battery, Medium, 2020 | Passenger car | RER | Sacchi et al. | 768421.0526 | unit / Mpkm/h |
| Battery Electric Car with Medium Range for Long Distances | Operation | transport, passenger car, battery electric, NMC-622 battery, Medium, 2020 | transport, passenger car | RER | Sacchi et al. | 666666.6667 | km / Mpkm |
| Diesel-Powered Car for Local Use | Construction | Passenger car, diesel, Lower medium, 2020, EURO-6d | Passenger car, EURO-6d | RER | Sacchi et al. | 768421.0526 | unit / Mpkm/h |
| Diesel-Powered Car for Local Use | Operation | transport, passenger car, diesel, Lower medium, 2020, EURO-6d-TEMP | transport, passenger car, EURO-6d-TEMP | RER | Sacchi et al. | 666666.6667 | km / Mpkm |
| Diesel-Powered Car for Long Distances | Construction | Passenger car, diesel, Medium, 2020, EURO-6d | Passenger car, EURO-6d | RER | Sacchi et al. | 768421.0526 | unit / Mpkm/h |
| Diesel-Powered Car for Long Distances | Operation | transport, passenger car, diesel, Medium, 2020, EURO-6d-TEMP | transport, passenger car, EURO-6d-TEMP | RER | Sacchi et al. | 666666.6667 | km / Mpkm |
| Ethanol-Powered Car (E10 Blend) for Local Use | Construction | Passenger car, gasoline, Lower medium, 2020, EURO-6d | Passenger car, EURO-6d | RER | Sacchi et al. | 768421.0526 | unit / Mpkm/h |
| Ethanol-Powered Car (E10 Blend) for Local Use | Operation | transport, passenger car, gasoline, Lower medium, 2020, EURO-6d-TEMP | transport, passenger car, EURO-6d-TEMP | RER | Sacchi et al. | 666666.6667 | km / Mpkm |
| Ethanol-Powered Car (E10 Blend) for Long Distances | Construction | Passenger car, gasoline, Medium, 2020, EURO-6d | Passenger car, EURO-6d | RER | Sacchi et al. | 768421.0526 | unit / Mpkm/h |
| Ethanol-Powered Car (E10 Blend) for Long Distances | Operation | transport, passenger car, gasoline, Medium, 2020, EURO-6d-TEMP | transport, passenger car, EURO-6d-TEMP | RER | Sacchi et al. | 666666.6667 | km / Mpkm |
| Fuel Cell-Powered Car with Methane for Local Use | Construction | Passenger car, fuel cell electric, Lower medium, 2020 | Passenger car | RER | Sacchi et al. | 768421.0526 | unit / Mpkm/h |
| Fuel Cell-Powered Car with Methane for Local Use | Operation | transport, passenger car, fuel cell electric, Lower medium, 2020 | transport, passenger car | RER | Sacchi et al. | 666666.6667 | km / Mpkm |
| Fuel Cell-Powered Car with Methane for Long Distances | Construction | Passenger car, fuel cell electric, Medium, 2020 | Passenger car | RER | Sacchi et al. | 768421.0526 | unit / Mpkm/h |
| Fuel Cell-Powered Car with Methane for Long Distances | Operation | transport, passenger car, fuel cell electric, Medium, 2020 | transport, passenger car | RER | Sacchi et al. | 666666.6667 | km / Mpkm |
| Fuel Cell-Powered Car with Hydrogen for Local Use | Construction | Passenger car, fuel cell electric, Lower medium, 2020 | Passenger car | RER | Sacchi et al. | 768421.0526 | unit / Mpkm/h |
| Fuel Cell-Powered Car with Hydrogen for Local Use | Operation | transport, passenger car, fuel cell electric, Lower medium, 2020 | transport, passenger car | RER | Sacchi et al. | 666666.6667 | km / Mpkm |
| Fuel Cell-Powered Car with Hydrogen for Long Distances | Construction | Passenger car, fuel cell electric, Medium, 2020 | Passenger car | RER | Sacchi et al. | 768421.0526 | unit / Mpkm/h |
| Fuel Cell-Powered Car with Hydrogen for Long Distances | Operation | transport, passenger car, fuel cell electric, Medium, 2020 | transport, passenger car | RER | Sacchi et al. | 666666.6667 | km / Mpkm |
| Gasoline-Powered Car for Local Use | Construction | Passenger car, gasoline, Lower medium, 2020, EURO-6d | Passenger car, EURO-6d | RER | Sacchi et al. | 768421.0526 | unit / Mpkm/h |
| Gasoline-Powered Car for Local Use | Operation | transport, passenger car, gasoline, Lower medium, 2020, EURO-6d-TEMP | transport, passenger car, EURO-6d-TEMP | RER | Sacchi et al. | 666666.6667 | km / Mpkm |
| Gasoline-Powered Car for Long Distances | Construction | Passenger car, gasoline, Medium, 2020, EURO-6d | Passenger car, EURO-6d | RER | Sacchi et al. | 768421.0526 | unit / Mpkm/h |
| Gasoline-Powered Car for Long Distances | Operation | transport, passenger car, gasoline, Medium, 2020, EURO-6d-TEMP | transport, passenger car, EURO-6d-TEMP | RER | Sacchi et al. | 666666.6667 | km / Mpkm |
| Hybrid Electric Car for Local Use | Construction | Passenger car, gasoline hybrid, Lower medium, 2020, EURO-6d | Passenger car, EURO-6d | RER | Sacchi et al. | 768421.0526 | unit / Mpkm/h |
| Hybrid Electric Car for Local Use | Operation | transport, passenger car, plugin gasoline hybrid, Lower medium, 2020, EURO-6d-TEMP | transport, passenger car, EURO-6d-TEMP | RER | Sacchi et al. | 666666.6667 | km / Mpkm |
| Hybrid Electric Car for Long Distances | Construction | Passenger car, gasoline hybrid, Medium, 2020, EURO-6d | Passenger car, EURO-6d | RER | Sacchi et al. | 768421.0526 | unit / Mpkm/h |
| Hybrid Electric Car for Long Distances | Operation | transport, passenger car, plugin gasoline hybrid, Medium, 2020, EURO-6d-TEMP | transport, passenger car, EURO-6d-TEMP | RER | Sacchi et al. | 666666.6667 | km / Mpkm |
| Methanol-Powered Car for Local Use | Construction | Passenger car, gasoline, Lower medium, 2020, EURO-6d | Passenger car, EURO-6d | RER | Sacchi et al. | 768421.0526 | unit / Mpkm/h |
| Methanol-Powered Car for Local Use | Operation | transport, passenger car, gasoline, Lower medium, 2020, EURO-6d-TEMP | transport, passenger car, EURO-6d-TEMP | RER | Sacchi et al. | 666666.6667 | km / Mpkm |
| Methanol-Powered Car for Long Distances | Construction | Passenger car, gasoline, Medium, 2020, EURO-6d | Passenger car, EURO-6d | RER | Sacchi et al. | 768421.0526 | unit / Mpkm/h |
| Methanol-Powered Car for Long Distances | Operation | transport, passenger car, gasoline, Medium, 2020, EURO-6d-TEMP | transport, passenger car, EURO-6d-TEMP | RER | Sacchi et al. | 666666.6667 | km / Mpkm |
| Natural Gas-Powered Car for Local Use | Construction | Passenger car, compressed gas, Lower medium, 2020, EURO-6d | Passenger car, EURO-6d | RER | Sacchi et al. | 768421.0526 | unit / Mpkm/h |
| Natural Gas-Powered Car for Local Use | Operation | transport, passenger car, compressed gas, Lower medium, 2020, EURO-6d-TEMP | transport, passenger car, EURO-6d-TEMP | RER | Sacchi et al. | 666666.6667 | km / Mpkm |
| Natural Gas-Powered Car for Long Distances | Construction | Passenger car, compressed gas, Medium, 2020, EURO-6d | Passenger car, EURO-6d | RER | Sacchi et al. | 768421.0526 | unit / Mpkm/h |
| Natural Gas-Powered Car for Long Distances | Operation | transport, passenger car, compressed gas, Medium, 2020, EURO-6d-TEMP | transport, passenger car, EURO-6d-TEMP | RER | Sacchi et al. | 666666.6667 | km / Mpkm |
| Plug-in Hybrid Electric Car for Local Use | Construction | Passenger car, plugin gasoline hybrid, Lower medium, 2020, EURO-6d | Passenger car, EURO-6d | RER | Sacchi et al. | 768421.0526 | unit / Mpkm/h |
| Plug-in Hybrid Electric Car for Local Use | Operation | transport, passenger car, plugin gasoline hybrid, Lower medium, 2020, EURO-6d-TEMP | transport, passenger car, EURO-6d-TEMP | RER | Sacchi et al. | 666666.6667 | km / Mpkm |
| Plug-in Hybrid Electric Car for Long Distances | Construction | Passenger car, plugin gasoline hybrid, Medium, 2020, EURO-6d | Passenger car, EURO-6d | RER | Sacchi et al. | 768421.0526 | unit / Mpkm/h |
| Plug-in Hybrid Electric Car for Long Distances | Operation | transport, passenger car, plugin gasoline hybrid, Medium, 2020, EURO-6d-TEMP | transport, passenger car, EURO-6d-TEMP | RER | Sacchi et al. | 666666.6667 | km / Mpkm |
| Combined Cycle Gas Turbine | Construction | market for gas power plant, combined cycle, 400MW electrical | NGCC power plant, 400MWe | GLO | Sacchi et al. | 2.5 | unit / GW |
| Combined Cycle Gas Turbine | Operation | electricity production, at natural gas-fired combined cycle power plant | electricity, high voltage | RER | Sacchi et al. | 1000000.0 | kWh / GWh |
| Combined Cycle Gas Turbine with Carbon Capture | Construction | market for gas power plant, combined cycle, 400MW electrical | NGCC power plant, 400MWe | GLO | Sacchi et al. | 2.5 | unit / GW |
| Combined Cycle Gas Turbine with Carbon Capture | Operation | electricity production, at natural gas-fired combined cycle power plant, post, pipeline 200km, storage 1000m | electricity, high voltage | RER | Sacchi et al. | 1000000.0 | kWh / GWh |
| Cement Production | Construction | cement factory construction | cement factory | CH | ecoinvent 3.8 cut-off | 25.76470588 | unit / kt/h |
| Cement Production | Operation | cement production, alternative constituents 21-35% | cement, alternative constituents 21-35% | CH | ecoinvent 3.8 cut-off | 1000000.0 | kg / kt |
| Cement Production with High Performance | Construction | cement factory construction | cement factory | CH | ecoinvent 3.8 cut-off | 25.76470588 | unit / kt/h |
| Cement Production with High Performance | Operation | cement production, alternative constituents 21-35% | cement, alternative constituents 21-35% | CH | ecoinvent 3.8 cut-off | 1000000.0 | kg / kt |
| Conversion of CO2 to Methanol | Construction | methanol factory construction | methanol factory | GLO | ecoinvent 3.8 cut-off | 8.888888889 | unit / kt/h |
| Conversion of CO2 to Methanol | Operation | methanol production | methanol | GLO | ecoinvent 3.8 cut-off | 1000000.0 | kg / kt |
| Conversion of CO2 to Diesel | Construction | petroleum refinery construction | petroleum refinery | RoW | ecoinvent 3.8 cut-off | 0.1709867163 | unit / GW |
| Conversion of CO2 to Diesel | Operation | Diesel production, synthetic, Fischer Tropsch process, hydrogen from electrolysis, energy allocation | Diesel, synthetic | RER | Sacchi et al. | 84530.85376 | kg / GWh |
| Conversion of CO2 to Jet Fuels | Construction | methanol production facility, construction | methanol production facility, construction | RER | Sacchi et al. | 585.6397914 | unit / GW |
| Conversion of CO2 to Jet Fuels | Operation | kerosene production, from methanol, hydrogen from electrolysis, CO2 from cement plant, energy allocation | kerosene, synthetic | RER | Sacchi et al. | 83720.93023 | kg / GWh |
| Compressed Natural Gas-Powered Coach | Construction | Passenger bus, compressed gas, 13m single deck coach bus, 2020, EURO-VI | Passenger bus, EURO-VI | RER | Sacchi et al. | 10138.88889 | unit / Mpkm/h |
| Compressed Natural Gas-Powered Coach | Operation | transport, passenger bus, compressed gas, 13m single deck urban bus, 2020, EURO-VI | transport, passenger bus, EURO-VI | RER | Sacchi et al. | 1000000.0 | pkm / Mpkm |
| Diesel-Powered Coach | Construction | Passenger bus, diesel, 13m single deck coach bus, 2020, EURO-VI | Passenger bus, EURO-VI | RER | Sacchi et al. | 10138.88889 | unit / Mpkm/h |
| Diesel-Powered Coach | Operation | transport, passenger bus, diesel, 13m single deck urban bus, 2020, EURO-VI | transport, passenger bus, EURO-VI | RER | Sacchi et al. | 1000000.0 | pkm / Mpkm |
| Electric-Powered Coach | Construction | Passenger bus, battery electric - overnight charging, NMC-622 battery, 13m single deck urban bus, 2020 | Passenger bus | RER | Sacchi et al. | 10138.88889 | unit / Mpkm/h |
| Electric-Powered Coach | Operation | transport, passenger bus, battery electric - overnight charging, NMC-622 battery, 13m single deck urban bus, 2020 | transport, passenger bus | RER | Sacchi et al. | 1000000.0 | pkm / Mpkm |
| Hydrogen Fuel Cell Coach with Methane Hybridization | Construction | Passenger bus, fuel cell electric, 13m single deck coach bus, 2020 | Passenger bus | RER | Sacchi et al. | 10138.88889 | unit / Mpkm/h |
| Hydrogen Fuel Cell Coach with Methane Hybridization | Operation | transport, passenger bus, fuel cell electric, 13m single deck urban bus, 2020 | transport, passenger bus | RER | Sacchi et al. | 1000000.0 | pkm / Mpkm |
| Hydrogen Fuel Cell Coach with Hydrogen Hybridization | Construction | Passenger bus, fuel cell electric, 13m single deck coach bus, 2020 | Passenger bus | RER | Sacchi et al. | 10138.88889 | unit / Mpkm/h |
| Hydrogen Fuel Cell Coach with Hydrogen Hybridization | Operation | transport, passenger bus, fuel cell electric, 13m single deck urban bus, 2020 | transport, passenger bus | RER | Sacchi et al. | 1000000.0 | pkm / Mpkm |
| Diesel Hybrid Coach | Construction | Passenger bus, diesel hybrid, 13m double deck coach bus, 2020, EURO-VI | Passenger bus, EURO-VI | RER | Sacchi et al. | 10138.88889 | unit / Mpkm/h |
| Diesel Hybrid Coach | Operation | transport, passenger bus, diesel, 13m single deck urban bus, 2020, EURO-VI | transport, passenger bus, EURO-VI | RER | Sacchi et al. | 1000000.0 | pkm / Mpkm |
| Integrated Gasification Combined Cycle | Construction | Hard coal IGCC power plant 450MW | Hard coal IGCC power plant 450MW | RER | Sacchi et al. | 2.222222222 | unit / GW |
| Integrated Gasification Combined Cycle | Operation | electricity production, at hard coal-fired IGCC power plant | electricity, high voltage | RER | Sacchi et al. | 1000000.0 | kWh / GWh |
| Integrated Gasification Combined Cycle with Carbon Capture | Construction | Hard coal IGCC power plant 450MW | Hard coal IGCC power plant 450MW | RER | Sacchi et al. | 2.222222222 | unit / GW |
| Integrated Gasification Combined Cycle with Carbon Capture | Operation | electricity production, at hard coal-fired IGCC power plant, pre, pipeline 200km, storage 1000m | electricity, high voltage | RER | Sacchi et al. | 1000000.0 | kWh / GWh |
| Coal Ultra-Supercritical | Construction | market for lignite power plant | lignite power plant | GLO | ecoinvent 3.8 cut-off | 2.631578947 | unit / GW |
| Coal Ultra-Supercritical | Operation | electricity production, at lignite-fired power plant, pulverised | electricity, high voltage | RER | Sacchi et al. | 1000000.0 | kWh / GWh |
| Coal Ultra-Supercritical with Carbon Capture | Construction | market for lignite power plant | lignite power plant | GLO | ecoinvent 3.8 cut-off | 2.631578947 | unit / GW |
| Coal Ultra-Supercritical with Carbon Capture | Operation | electricity production, at lignite-fired power plant, post, pipeline 200km, storage 1000m | electricity, high voltage | RER | Sacchi et al. | 1000000.0 | kWh / GWh |
| Diesel-Powered Commuter Train | Construction | train production, passenger, regional | train, passenger, regional | CH | ecoinvent 3.8 cut-off | 1269.565217 | unit / Mpkm/h |
| Diesel-Powered Commuter Train | Operation | transport, passenger train | transport, passenger train | RoW | ecoinvent 3.8 cut-off | 1000000.0 | pkm / Mpkm |
| Electric-Powered Commuter Train | Construction | train production, passenger, regional | train, passenger, regional | CH | ecoinvent 3.8 cut-off | 1269.565217 | unit / Mpkm/h |
| Electric-Powered Commuter Train | Operation | transport, passenger train, regional | transport, passenger train | CH | ecoinvent 3.8 cut-off | 1000000.0 | pkm / Mpkm |
| Conversion of Crops to Ethanol | Construction | market for ethanol fermentation plant | ethanol fermentation plant | GLO | ecoinvent 3.8 cut-off | 13.11769991 | unit / GW |
| Conversion of Crops to Ethanol | Operation | Ethanol production, via fermentation, from corn, energy allocation | ethanol, from corn | US | Sacchi et al. | 134770.8895 | kg / GWh |
| Conversion of Crops to Jet Fuels | Construction | petroleum refinery construction | petroleum refinery | RoW | ecoinvent 3.8 cut-off | 29.89760844 | unit / GW |
| Conversion of Crops to Jet Fuels | Operation | kerosene production, synthetic, Fischer Tropsch process, hydrogen from wood gasification, energy allocation | kerosene, synthetic | RER | Sacchi et al. | 83720.93023 | kg / GWh |
| Cumene Production Process | Construction | chemical factory construction, organics | chemical factory, organics | RoW | ecoinvent 3.8 cut-off | 0.1530242376 | unit / GW |
| Cumene Production Process | Operation | cumene production | cumene | RoW | ecoinvent 3.8 cut-off | 87342.60135 | kg / GWh |
| Direct Air Capture at High Temperature | Construction | direct air capture system, sorbent-based, 100ktCO2 | direct air capture system | RER | Sacchi et al. | 87.6 | unit / kt/h |
| Direct Air Capture at High Temperature | Operation | carbon dioxide, captured from atmosphere, with a sorbent-based direct air capture system, 100ktCO2 | carbon dioxide, captured from atmosphere | RER | Sacchi et al. | 1000000.0 | kg / kt |
| Direct Air Capture at Low Temperature | Construction | direct air capture system, solvent-based, 1MtCO2 | direct air capture system | RER | Sacchi et al. | 8.76 | unit / kt/h |
| Direct Air Capture at Low Temperature | Operation | carbon dioxide, captured from atmosphere, with a solvent-based direct air capture system, 1MtCO2 | carbon dioxide, captured from atmosphere | RER | Sacchi et al. | 1000000.0 | kg / kt |
| Decentralized Cogeneration with Hydrogen | Construction | fuel cell production, polymer electrolyte membrane, 2kW electrical, future | fuel cell, polymer electrolyte membrane, 2kW electrical, future | RoW | ecoinvent 3.8 cut-off | 500000.0 | unit / GW |
| Decentralized Boiler with Gas Combustion | Construction | gas boiler production | gas boiler | RoW | ecoinvent 3.8 cut-off | 100000.0 | unit / GW |
| Decentralized Boiler with Gas Combustion | Operation | heat production, natural gas, at boiler modulating ¡100kW | heat, central or small-scale, natural gas | RoW | ecoinvent 3.8 cut-off | 3600000.0 | MJ / GWh |
| Decentralized Boiler with Oil Combustion | Construction | oil boiler production, 10kW | oil boiler, 10kW | RoW | ecoinvent 3.8 cut-off | 100000.0 | unit / GW |
| Decentralized Boiler with Oil Combustion | Operation | heat production, light fuel oil, at boiler 10kW condensing, non-modulating | heat, central or small-scale, other than natural gas | RoW | ecoinvent 3.8 cut-off | 3600000.0 | MJ / GWh |
| Decentralized Boiler with Wood Combustion | Construction | furnace production, wood chips, hardwood storage area, 50kW | furnace, wood chips, hardwood storage area, 50kW | RoW | ecoinvent 3.8 cut-off | 20000.0 | unit / GW |
| Decentralized Boiler with Wood Combustion | Operation | heat production, wood chips from industry, at furnace 50kW, state-of-the-art 2014 | heat, central or small-scale, other than natural gas | RoW | ecoinvent 3.8 cut-off | 3600000.0 | MJ / GWh |
| Decentralized Cogeneration with Gas Combustion | Operation | heat production, natural gas, at boiler modulating ¡100kW | heat, central or small-scale, natural gas | RoW | ecoinvent 3.8 cut-off | 3600000.0 | MJ / GWh |
| Decentralized Cogeneration with Oil Combustion | Operation | heat production, light fuel oil, at boiler 10kW condensing, non-modulating | heat, central or small-scale, other than natural gas | RoW | ecoinvent 3.8 cut-off | 3600000.0 | MJ / GWh |
| Decentralized Cogeneration with Wood Combustion | Operation | heat production, wood chips from industry, at furnace 50kW, state-of-the-art 2014 | heat, central or small-scale, other than natural gas | RoW | ecoinvent 3.8 cut-off | 3600000.0 | MJ / GWh |
| Decentralized Direct Electricity | Construction | auxiliary heating unit production, electric, 5kW | auxiliary heating unit, electric, 5kW | RoW | ecoinvent 3.8 cut-off | 200000.0 | unit / GW |
| ”Decentralized Heat Pump Electricity ” | Construction | heat pump production, brine-water, 10kW | heat pump, brine-water, 10kW | RoW | ecoinvent 3.8 cut-off | 100000.0 | unit / GW |
| ”Decentralized Heat Pump Electricity ” | Operation | heat production, air-water heat pump 10kW | heat, air-water heat pump 10kW | RoW | ecoinvent 3.8 cut-off | 3600000.0 | MJ / GWh |
| ”Decentralized Solar Thermal ” | Construction | flat plate solar collector production, Cu absorber | flat plate solar collector, Cu absorber | RoW | ecoinvent 3.8 cut-off | 1428571.429 | m2 / GW |
| Decentralized Thermal Gas Heat Pump | Construction | heat pump production, diffusion absorption, 4kW, future | heat pump, diffusion absorption, 4kW, future | RoW | ecoinvent 3.8 cut-off | 250000.0 | unit / GW |
| Decentralized Thermal Gas Heat Pump | Operation | heat production, natural gas, at diffusion absorption heat pump 4kW, future | heat, future | CH | ecoinvent 3.8 cut-off | 3600000.0 | MJ / GWh |
| Decentralized Thermal Storage | Construction | thermal storage system construction, solar tower power plant, 20 MW | thermal storage system, solar tower power plant, 20 MW | RoW | ecoinvent 3.8 cut-off | 50.0 | unit / GW |
| District Heating Network Boiler with Gas Combustion | Construction | gas boiler production | gas boiler | RoW | ecoinvent 3.8 cut-off | 100000.0 | unit / GW |
| District Heating Network Boiler with Gas Combustion | Operation | heat production, natural gas, at boiler modulating ¡100kW | heat, central or small-scale, natural gas | RoW | ecoinvent 3.8 cut-off | 3600000.0 | MJ / GWh |
| District Heating Network Boiler with Oil Combustion | Construction | oil boiler production, 100kW | oil boiler, 100kW | RoW | ecoinvent 3.8 cut-off | 10000.0 | unit / GW |
| District Heating Network Boiler with Oil Combustion | Operation | heat production, light fuel oil, at boiler 100kW condensing, non-modulating | heat, central or small-scale, other than natural gas | RoW | ecoinvent 3.8 cut-off | 3600000.0 | MJ / GWh |
| District Heating Network Boiler with Wood Combustion | Construction | furnace production, wood chips, with silo, 5000kW | furnace, wood chips, with silo, 5000kW | RoW | ecoinvent 3.8 cut-off | 200.0 | unit / GW |
| District Heating Network Boiler with Wood Combustion | Operation | heat production, wood chips from industry, at furnace 5000kW | heat, district or industrial, other than natural gas | RoW | ecoinvent 3.8 cut-off | 3600000.0 | MJ / GWh |
| District Heating Network Cogeneration with Gas Combustion | Operation | heat production, natural gas, at boiler modulating ¡100kW | heat, central or small-scale, natural gas | RoW | ecoinvent 3.8 cut-off | 3600000.0 | MJ / GWh |
| District Heating Network Cogeneration with Waste Combustion | Operation | market for heat, for reuse in municipal waste incineration only | heat, for reuse in municipal waste incineration only | RoW | ecoinvent 3.8 cut-off | 3600000.0 | MJ / GWh |
| District Heating Network Cogeneration with Wood Combustion | Operation | heat production, wood chips from industry, at furnace 300kW, state-of-the-art 2014 | heat, district or industrial, other than natural gas | RoW | ecoinvent 3.8 cut-off | 3600000.0 | MJ / GWh |
| District Heating Network with Deep Geothermal Heat | Construction | geothermal heat plant construction | geothermal heat plant | GLO | Sacchi et al. | 21.26500337 | unit / GW |
| District Heating Network with Deep Geothermal Heat | Operation | heat production, deep geothermal | heat, deep geothermal | GLO | Sacchi et al. | 3600000.0 | MJ / GWh |
| District Heating Network with Heat Pump Electricity | Construction | heat pump production, 30kW | heat pump, 30kW | RoW | ecoinvent 3.8 cut-off | 33333.33333 | unit / GW |
| District Heating Network with Heat Pump Electricity | Operation | heat production, at heat pump 30kW, allocation exergy | heat, central or small-scale, other than natural gas | RoW | ecoinvent 3.8 cut-off | 3600000.0 | MJ / GWh |
| District Heating Network Thermal Storage | Construction | thermal storage system construction, solar tower power plant, 20 MW | thermal storage system, solar tower power plant, 20 MW | RoW | ecoinvent 3.8 cut-off | 50.0 | unit / GW |
| Diesel Storage | Construction | liquid storage tank production, chemicals, organics | liquid storage tank, chemicals, organics | RoW | ecoinvent 3.8 cut-off | 0.00690989497 | unit / GWh |
| Deep Oil Reservoir Gas Recovery | Operation | carbon dioxide compression, transport and storage | carbon dioxide, stored | RER | Sacchi et al. | 1000000.0 | kg / kt |
| Hydrogen Grid at Extra High Pressure | Construction | transmission pipeline for hydrogen, dedicated hydrogen pipeline | pipeline, for hydrogen transmission | RER | Sacchi et al. | 13.87283237 | km / GW |
| Natural Gas Grid at Extra High Pressure | Construction | pipeline construction, natural gas, high pressure distribution network | pipeline, natural gas, high pressure distribution network | RoW | ecoinvent 3.8 cut-off | 3.517915309 | km / GW |
| Electric Grid at Extra High Voltage | Construction | transmission network construction, electricity, high voltage | transmission network, electricity, high voltage | RoW | ecoinvent 3.8 cut-off | 78.2 | km / GW |
| Electricity Storage | Construction | battery cell production, Li-ion | battery cell, Li-ion | RoW | ecoinvent 3.8 cut-off | 2150.537634 | kg / unit |
| Enhanced Oil Recovery | Operation | carbon dioxide compression, transport and storage | carbon dioxide, stored | RER | Sacchi et al. | 1000000.0 | kg / kt |
| Ethane Cracking Process | Construction | chemical factory construction, organics | chemical factory, organics | RoW | ecoinvent 3.8 cut-off | 0.1254290544 | unit / GW |
| Ethane Cracking Process | Operation | natural gas liquids fractionation | ethane | GLO | ecoinvent 3.8 cut-off | 71591.92602 | kg / GWh |
| Ethane Oxidation Process | Construction | chemical factory construction, organics | chemical factory, organics | RoW | ecoinvent 3.8 cut-off | 0.4334845361 | unit / GW |
| Ethane Oxidation Process | Operation | acetic acid production, product in 98% solution state | acetic acid, without water, in 98% solution state | RoW | ecoinvent 3.8 cut-off | 247422.6804 | kg / GWh |
| Conversion of Ethane to Ethylene | Construction | chemical factory construction, organics | chemical factory, organics | RoW | ecoinvent 3.8 cut-off | 0.1254290544 | unit / GW |
| Conversion of Ethane to Ethylene | Operation | ethylene production, average | ethylene | RoW | ecoinvent 3.8 cut-off | 71591.92602 | kg / GWh |
| Conversion of Ethanol to Jet Fuels | Construction | chemical factory construction, organics | chemical factory, organics | RoW | ecoinvent 3.8 cut-off | 0.1466790698 | unit / GW |
| Conversion of Ethanol to Jet Fuels | Operation | kerosene production, from methanol, hydrogen from coal gasification, energy allocation | kerosene, synthetic | RER | Sacchi et al. | 83720.93023 | kg / GWh |
| Ethylene Polymerization | Construction | chemical factory construction, organics | chemical factory, organics | RoW | ecoinvent 3.8 cut-off | 1.752 | unit / kt/h |
| Ethylene Polymerization | Operation | ethylene production, average | ethylene | RoW | ecoinvent 3.8 cut-off | 1000000.0 | kg / kt |
| Food Production | Construction | sugar refinery construction | sugar refinery | GLO | ecoinvent 3.8 cut-off | 43.8 | unit / kt/h |
| Food Production | Operation | beet sugar production | sugar, from sugar beet | RoW | ecoinvent 3.8 cut-off | 1000000.0 | kg / kt |
| Food Production with Heat Pump | Construction | sugar refinery construction | sugar refinery | GLO | ecoinvent 3.8 cut-off | 43.8 | unit / kt/h |
| Food Production with Heat Pump | Operation | beet sugar production | sugar, from sugar beet | RoW | ecoinvent 3.8 cut-off | 1000000.0 | kg / kt |
| Food Production with Heat Recovery | Construction | sugar refinery construction | sugar refinery | GLO | ecoinvent 3.8 cut-off | 43.8 | unit / kt/h |
| Food Production with Heat Recovery | Operation | beet sugar production | sugar, from sugar beet | RoW | ecoinvent 3.8 cut-off | 1000000.0 | kg / kt |
| Fischer-Tropsch Synthesis | Construction | chemical factory construction, organics | chemical factory, organics | RoW | ecoinvent 3.8 cut-off | 0.1480980558 | unit / GW |
| Fischer-Tropsch Synthesis | Operation | diesel production, synthetic, from Fischer Tropsch process, hydrogen from wood gasification, energy allocation, at fuelling station | diesel, synthetic, vehicle grade | RER | Sacchi et al. | 84530.85376 | kg / GWh |
| Hydrogen Production via Gasification | Construction | synthetic gas factory construction | synthetic gas factory | CH | ecoinvent 3.8 cut-off | 200.0 | unit / GW |
| Hydrogen Production via Gasification | Operation | hydrogen production, gaseous, 25 bar, from heatpipe reformer gasification of woody biomass, at gasification plant | hydrogen, gaseous, 25 bar | RER | Sacchi et al. | 30030.03003 | kg / GWh |
| Synthetic Natural Gas Production via Gasification | Construction | anaerobic digestion plant construction, agricultural | anaerobic digestion plant, agricultural | RoW | ecoinvent 3.8 cut-off | 0.133740458 | unit / GW |
| Synthetic Natural Gas Production via Gasification | Operation | biogas production from grass | biogas, from grass | CH | ecoinvent 3.8 cut-off | 98244.37305 | m3 / GWh |
| Gasoline Storage | Construction | liquid storage tank production, chemicals, organics | liquid storage tank, chemicals, organics | RoW | ecoinvent 3.8 cut-off | 0.00690989497 | unit / GWh |
| Geothermal Energy Utilization | Construction | geothermal power plant construction | geothermal power plant, 5.5MWel | CH | ecoinvent 3.8 cut-off | 181.8181818 | unit / GW |
| Geothermal Energy Utilization | Operation | electricity production, deep geothermal | electricity, high voltage | CH | ecoinvent 3.8 cut-off | 1000000.0 | kWh / GWh |
| Hydrogen Compression from High Pressure to Extra High Pressure | Construction | air compressor production, screw-type compressor, 300kW | air compressor, screw-type compressor, 300kW | RoW | ecoinvent 3.8 cut-off | 3333.333333 | unit / GW |
| Hydrogen Compression from Low Pressure to Medium Pressure | Construction | air compressor production, screw-type compressor, 4kW | air compressor, screw-type compressor, 4kW | RoW | ecoinvent 3.8 cut-off | 250000.0 | unit / GW |
| Hydrogen Compression from Medium Pressure to High Pressure | Construction | air compressor production, screw-type compressor, 300kW | air compressor, screw-type compressor, 300kW | RoW | ecoinvent 3.8 cut-off | 3333.333333 | unit / GW |
| Hydrogen Expansion with Cogeneration from Extra High Pressure to High Pressure | Construction | air input/output unit production, heat and power co-generation unit, 160kW electrical | air input/output unit, heat and power co-generation unit, 160kW electrical | RoW | ecoinvent 3.8 cut-off | 6250.0 | unit / GW |
| Hydrogen Expansion with Cogeneration from High Pressure to Medium Pressure | Construction | air input/output unit production, heat and power co-generation unit, 160kW electrical | air input/output unit, heat and power co-generation unit, 160kW electrical | RoW | ecoinvent 3.8 cut-off | 6250.0 | unit / GW |
| Hydrogen Expansion with Cogeneration from Medium Pressure to Low Pressure | Construction | air input/output unit production, heat and power co-generation unit, 160kW electrical | air input/output unit, heat and power co-generation unit, 160kW electrical | RoW | ecoinvent 3.8 cut-off | 6250.0 | unit / GW |
| Hydrogen Storage | Construction | liquid storage tank production, chemicals, organics | liquid storage tank, chemicals, organics | RoW | ecoinvent 3.8 cut-off | 20.85418752 | unit / GWh |
| Hydrogen Storage | Operation | geological hydrogen storage | hydrogen storage | RER | Sacchi et al. | 30030.03003 | kg / GWh |
| Hydrogen Grid at High Pressure | Construction | transmission pipeline for hydrogen, dedicated hydrogen pipeline | pipeline, for hydrogen transmission | RER | Sacchi et al. | 5.202312139 | km / GW |
| Natural Gas Grid at High Pressure | Construction | pipeline construction, natural gas, high pressure distribution network | pipeline, natural gas, high pressure distribution network | RoW | ecoinvent 3.8 cut-off | 1.319218241 | km / GW |
| Electric Grid at High Voltage | Construction | transmission network construction, electricity, high voltage | transmission network, electricity, high voltage | RoW | ecoinvent 3.8 cut-off | 23.0 | km / GW |
| Hydroelectric Dam | Construction | hydropower plant construction, reservoir, alpine region | hydropower plant, reservoir, alpine region | RoW | ecoinvent 3.8 cut-off | 0.5280289331 | unit / GW |
| Hydroelectric Dam | Operation | electricity production, hydro, reservoir, alpine region | electricity, high voltage | CH | ecoinvent 3.8 cut-off | 1000000.0 | kWh / GWh |
| Hydrothermal Gasification | Construction | anaerobic digestion plant construction, for biowaste | anaerobic digestion plant, for biowaste | CH | ecoinvent 3.8 cut-off | 63.02158273 | unit / GW |
| Hydrothermal Gasification | Operation | biogas production from grass | biogas, from grass | CH | ecoinvent 3.8 cut-off | 100478.2766 | m3 / GWh |
| Hydrothermal Gasification with Combined Heat and Power | Operation | heat production, natural gas, at boiler modulating ¡100kW | heat, central or small-scale, natural gas | RoW | ecoinvent 3.8 cut-off | 3600000.0 | MJ / GWh |
| Hydroelectric Power from River Flow | Construction | hydropower plant construction, run-of-river | hydropower plant, run-of-river | RoW | ecoinvent 3.8 cut-off | 0.5434243176 | unit / GW |
| Hydroelectric Power from River Flow | Operation | electricity production, hydro, run-of-river | electricity, high voltage | CH | ecoinvent 3.8 cut-off | 1000000.0 | kWh / GWh |
| Industrial Boiler with Coal Combustion | Construction | industrial furnace production, coal, 1-10MW | industrial furnace, coal, 1-10MW | RoW | ecoinvent 3.8 cut-off | 1000.0 | unit / GW |
| Industrial Boiler with Coal Combustion | Operation | heat production, at hard coal industrial furnace 1-10MW | heat, district or industrial, other than natural gas | RoW | ecoinvent 3.8 cut-off | 3600000.0 | MJ / GWh |
| Industrial Boiler with Gas Combustion | Construction | industrial furnace production, natural gas | industrial furnace, natural gas | RoW | ecoinvent 3.8 cut-off | 10000.0 | unit / GW |
| Industrial Boiler with Gas Combustion | Operation | heat production, natural gas, at industrial furnace ¿100kW | heat, district or industrial, natural gas | RoW | ecoinvent 3.8 cut-off | 3600000.0 | MJ / GWh |
| Industrial Boiler with Oil Combustion | Construction | industrial furnace production, 1MW, oil | industrial furnace, 1MW, oil | CH | ecoinvent 3.8 cut-off | 1000.0 | unit / GW |
| Industrial Boiler with Oil Combustion | Operation | heat production, heavy fuel oil, at industrial furnace 1MW | heat, district or industrial, other than natural gas | CH | ecoinvent 3.8 cut-off | 3600000.0 | MJ / GWh |
| Industrial Boiler with Waste Combustion | Construction | municipal waste incineration facility construction | municipal waste incineration facility | RoW | ecoinvent 3.8 cut-off | 25.53522267 | unit / GW |
| Industrial Boiler with Waste Combustion | Operation | market for heat, for reuse in municipal waste incineration only | heat, for reuse in municipal waste incineration only | RoW | ecoinvent 3.8 cut-off | 3600000.0 | MJ / GWh |
| Industrial Boiler with Wood Combustion | Construction | furnace production, wood chips, with silo, 1000kW | furnace, wood chips, with silo, 1000kW | RoW | ecoinvent 3.8 cut-off | 1000.0 | unit / GW |
| Industrial Boiler with Wood Combustion | Operation | heat production, wood chips from industry, at furnace 1000kW | heat, district or industrial, other than natural gas | RoW | ecoinvent 3.8 cut-off | 3600000.0 | MJ / GWh |
| Industrial Cogeneration with Gas Combustion | Operation | heat production, natural gas, at industrial furnace ¿100kW | heat, district or industrial, natural gas | RoW | ecoinvent 3.8 cut-off | 3600000.0 | MJ / GWh |
| Industrial Cogeneration using Waste Combustion | Operation | market for heat, for reuse in municipal waste incineration only | heat, for reuse in municipal waste incineration only | RoW | ecoinvent 3.8 cut-off | 3600000.0 | MJ / GWh |
| Industrial Cogeneration with Wood Combustion | Operation | heat production, wood chips from industry, at furnace 1000kW | heat, district or industrial, other than natural gas | RoW | ecoinvent 3.8 cut-off | 3600000.0 | MJ / GWh |
| Industrial Direct Electricity Usage | Construction | auxiliary heating unit production, electric, 5kW | auxiliary heating unit, electric, 5kW | RoW | ecoinvent 3.8 cut-off | 200000.0 | unit / GW |
| Industrial Heat Pump Electricity Usage | Construction | heat pump production, brine-water, 10kW | heat pump, brine-water, 10kW | RoW | ecoinvent 3.8 cut-off | 100000.0 | unit / GW |
| Industrial Heat Pump Electricity Usage | Operation | heat production, air-water heat pump 10kW | heat, air-water heat pump 10kW | RoW | ecoinvent 3.8 cut-off | 3600000.0 | MJ / GWh |
| Hydrogen Grid at Low Pressure | Construction | distribution pipeline for hydrogen, dedicated hydrogen pipeline | pipeline, for hydrogen distribution | RER | Sacchi et al. | 550.0 | km / GW |
| Natural Gas Grid at Low Pressure | Construction | pipeline construction, natural gas, low pressure distribution network | pipeline, natural gas, low pressure distribution network | RoW | ecoinvent 3.8 cut-off | 258.8235294 | km / GW |
| Electric Grid at Low Voltage | Construction | distribution network construction, electricity, low voltage | distribution network, electricity, low voltage | RoW | ecoinvent 3.8 cut-off | 200.0 | km / GW |
| Propylene Production via Metathesis | Construction | chemical factory construction, organics | chemical factory, organics | RoW | ecoinvent 3.8 cut-off | 0.1254290544 | unit / GW |
| Propylene Production via Metathesis | Operation | propylene production | propylene | RoW | ecoinvent 3.8 cut-off | 71591.92602 | kg / GWh |
| Methanation Process | Construction | chemical factory construction, organics | chemical factory, organics | RoW | ecoinvent 3.8 cut-off | 0.133740458 | unit / GW |
| Methanation Process | Operation | methane, from electrochemical methanation, with carbon from municipal waste incineration plant | methane, from electrochemical methanation | RER | Sacchi et al. | 76335.87786 | kg / GWh |
| Conversion of Methane to Methanol | Construction | chemical factory construction, organics | chemical factory, organics | RoW | ecoinvent 3.8 cut-off | 0.3162454874 | unit / GW |
| Conversion of Methane to Methanol | Operation | methanol production | methanol | GLO | ecoinvent 3.8 cut-off | 180505.4152 | kg / GWh |
| Methanol Cabonylation Process | Construction | chemical factory construction, organics | chemical factory, organics | RoW | ecoinvent 3.8 cut-off | 0.4334845361 | unit / GW |
| Methanol Cabonylation Process | Operation | acetic acid production, product in 98% solution state | acetic acid, without water, in 98% solution state | RoW | ecoinvent 3.8 cut-off | 247422.6804 | kg / GWh |
| Methanol Synthesis via Fischer-Tropsch Process | Construction | market for methanol factory | methanol factory | GLO | ecoinvent 3.8 cut-off | 0.5856397914 | unit / GW |
| Methanol Synthesis via Fischer-Tropsch Process | Operation | methanol production, from synthetic gas | methanol, from biomass | CH | ecoinvent 3.8 cut-off | 180505.4152 | kg / GWh |
| Conversion of Methanol to Aromatic Compounds | Construction | chemical factory construction, organics | chemical factory, organics | RoW | ecoinvent 3.8 cut-off | 0.1507709225 | unit / GW |
| Conversion of Methanol to Aromatic Compounds | Operation | xylene production | xylene | RER | ecoinvent 3.8 cut-off | 86056.4626 | kg / GWh |
| Conversion of Methanol to Olefinic Compounds | Construction | chemical factory construction, organics | chemical factory, organics | RoW | ecoinvent 3.8 cut-off | 0.1254290544 | unit / GW |
| Conversion of Methanol to Olefinic Compounds | Operation | n-olefins production | n-olefins | RoW | ecoinvent 3.8 cut-off | 71591.92602 | kg / GWh |
| Hydrogen Grid at Medium Pressure | Construction | distribution pipeline for hydrogen, dedicated hydrogen pipeline | pipeline, for hydrogen distribution | RER | Sacchi et al. | 66000.0 | km / GW |
| Natural Gas Grid at Medium Pressure | Construction | pipeline construction, natural gas, low pressure distribution network | pipeline, natural gas, low pressure distribution network | RoW | ecoinvent 3.8 cut-off | 31058.82353 | km / GW |
| Electric Grid at Medium Voltage | Construction | distribution network construction, electricity, low voltage | distribution network, electricity, low voltage | RoW | ecoinvent 3.8 cut-off | 20000.0 | km / GW |
| New Hydroelectric Dam | Construction | hydropower plant construction, reservoir, alpine region | hydropower plant, reservoir, alpine region | RoW | ecoinvent 3.8 cut-off | 0.5280289331 | unit / GW |
| New Hydroelectric Dam | Operation | electricity production, hydro, reservoir, alpine region | electricity, high voltage | RoW | ecoinvent 3.8 cut-off | 1000000.0 | kWh / GWh |
| New Hydroelectric Power from River Flow | Construction | hydropower plant construction, run-of-river | hydropower plant, run-of-river | RoW | ecoinvent 3.8 cut-off | 0.5434243176 | unit / GW |
| New Hydroelectric Power from River Flow | Operation | electricity production, hydro, run-of-river | electricity, high voltage | RoW | ecoinvent 3.8 cut-off | 1000000.0 | kWh / GWh |
| Natural Gas Compression from High Pressure to Extra High Pressure | Construction | air compressor production, screw-type compressor, 300kW | air compressor, screw-type compressor, 300kW | RoW | ecoinvent 3.8 cut-off | 3333.333333 | unit / GW |
| Natural Gas Compression from Low Pressure to Medium Pressure | Construction | air compressor production, screw-type compressor, 4kW | air compressor, screw-type compressor, 4kW | RoW | ecoinvent 3.8 cut-off | 250000.0 | unit / GW |
| Natural Gas Compression from Medium Pressure to High Pressure | Construction | air compressor production, screw-type compressor, 300kW | air compressor, screw-type compressor, 300kW | RoW | ecoinvent 3.8 cut-off | 3333.333333 | unit / GW |
| Natural Gas Expansion with Cogeneration from Extra High Pressure to High Pressure | Construction | air input/output unit production, heat and power co-generation unit, 160kW electrical | air input/output unit, heat and power co-generation unit, 160kW electrical | RoW | ecoinvent 3.8 cut-off | 6250.0 | unit / GW |
| Natural Gas Expansion with Cogeneration from High Pressure to Medium Pressure | Construction | air input/output unit production, heat and power co-generation unit, 160kW electrical | air input/output unit, heat and power co-generation unit, 160kW electrical | RoW | ecoinvent 3.8 cut-off | 6250.0 | unit / GW |
| Natural Gas Expansion with Cogeneration from Medium Pressure to Low Pressure | Construction | air input/output unit production, heat and power co-generation unit, 160kW electrical | air input/output unit, heat and power co-generation unit, 160kW electrical | RoW | ecoinvent 3.8 cut-off | 6250.0 | unit / GW |
| Natural Gas Reforming | Construction | chemical factory construction, organics | chemical factory, organics | RoW | ecoinvent 3.8 cut-off | 0.05261261261 | unit / GW |
| Natural Gas Reforming | Operation | hydrogen production, steam methane reforming of natural gas, 25 bar | hydrogen, gaseous, 25 bar | CH | Sacchi et al. | 30030.03003 | kg / GWh |
| Natural Gas Storage | Construction | liquid storage tank production, chemicals, organics | liquid storage tank, chemicals, organics | RoW | ecoinvent 3.8 cut-off | 6.140273316 | unit / GWh |
| Nuclear Power Generation | Construction | nuclear power plant construction, pressure water reactor, 1000MW | nuclear power plant, pressure water reactor, 1000MW | RoW | ecoinvent 3.8 cut-off | 1.0 | unit / GW |
| Nuclear Power Generation | Operation | electricity production, nuclear, pressure water reactor | electricity, high voltage | RoW | ecoinvent 3.8 cut-off | 1000000.0 | kWh / GWh |
| Paper Production | Construction | paper mill construction, integrated | paper mill, integrated | RoW | ecoinvent 3.8 cut-off | 23.80434783 | unit / kt/h |
| Paper Production | Operation | paper production, newsprint, recycled | paper, newsprint | RoW | ecoinvent 3.8 cut-off | 1000000.0 | kg / kt |
| Paper Production with Heat Pump | Construction | paper mill construction, integrated | paper mill, integrated | RoW | ecoinvent 3.8 cut-off | 23.80434783 | unit / kt/h |
| Paper Production with Heat Pump | Operation | paper production, newsprint, recycled | paper, newsprint | RoW | ecoinvent 3.8 cut-off | 1000000.0 | kg / kt |
| Paper Production with Heat Recovery | Construction | paper mill construction, integrated | paper mill, integrated | RoW | ecoinvent 3.8 cut-off | 23.80434783 | unit / kt/h |
| Paper Production with Heat Recovery | Operation | paper production, newsprint, recycled | paper, newsprint | RoW | ecoinvent 3.8 cut-off | 1000000.0 | kg / kt |
| Proton Exchange Membrane Electrolysis | Construction | electrolyzer production, 1MWe, PEM, Stack | electrolyzer, 1MWe, PEM, Stack | RER | Sacchi et al. | 1430.0 | unit / GW |
| Proton Exchange Membrane Electrolysis | Operation | hydrogen production, gaseous, 30 bar, from PEM electrolysis, from grid electricity | hydrogen, gaseous, 30 bar | RER | Sacchi et al. | 30030.03003 | kg / GWh |
| Polyethylene Terephthalate Formation | Construction | chemical factory construction, organics | chemical factory, organics | RoW | ecoinvent 3.8 cut-off | 1.752 | unit / kt/h |
| Polyethylene Terephthalate Formation | Operation | polyethylene production, linear low density, granulate | polyethylene, linear low density, granulate | RoW | ecoinvent 3.8 cut-off | 1000000.0 | kg / kt |
| Polypropylene Production | Construction | chemical factory construction, organics | chemical factory, organics | RoW | ecoinvent 3.8 cut-off | 1.752 | unit / kt/h |
| Polypropylene Production | Operation | polypropylene production, granulate | polypropylene, granulate | RoW | ecoinvent 3.8 cut-off | 1000000.0 | kg / kt |
| Photovoltaic Solar Energy | Construction | photovoltaic slanted-roof installation, 1.3 MWp, multi-Si, panel, mounted, on roof | photovoltaic slanted-roof installation, 1.3 MWp, multi-Si, panel, mounted, on roof | CH | Sacchi et al. | 769.2307692 | unit / GW |
| Photovoltaic Solar Energy | Operation | electricity production, photovoltaic, at 1.3 MWp slanted-roof, multi-Si, panel, mounted | electricity production, photovoltaic, at 1.3 MWp slanted-roof, multi-Si, panel, mounted | CH | Sacchi et al. | 1000000.0 | kWh / GWh |
| Polyvinyl Chloride Formation | Construction | chemical factory construction, organics | chemical factory, organics | RoW | ecoinvent 3.8 cut-off | 1.752 | unit / kt/h |
| Polyvinyl Chloride Formation | Operation | polyvinylchloride production, bulk polymerisation | polyvinylchloride, bulk polymerised | RoW | ecoinvent 3.8 cut-off | 1000000.0 | kg / kt |
| Photovoltaic Solar Energy | Construction | photovoltaic open ground installation, 560 kWp, single-Si, on open ground | photovoltaic open ground installation, 560 kWp, single-Si, on open ground | CH | Sacchi et al. | 1785.714286 | unit / GW |
| Photovoltaic Solar Energy | Operation | electricity production, photovoltaic, at 560 kWp open ground, single-Si | electricity production, photovoltaic, at 560 kWp open ground, single-Si | CH | Sacchi et al. | 1000000.0 | kWh / GWh |
| Pyrolysis Process | Construction | chemical factory construction, organics | chemical factory, organics | RoW | ecoinvent 3.8 cut-off | 0.1553191489 | unit / GW |
| Pyrolysis Process | Operation | light fuel oil production, from waste polyethylene | light fuel oil | CH | ecoinvent 3.8 cut-off | 88652.48227 | kg / GWh |
| Implementation of SMART Process from ethylbenzene to styrene | Construction | chemical factory construction, organics | chemical factory, organics | RoW | ecoinvent 3.8 cut-off | 1.752 | unit / kt/h |
| Implementation of SMART Process from ethylbenzene to styrene | Operation | styrene production | styrene | RoW | ecoinvent 3.8 cut-off | 1000000.0 | kg / kt |
| Solid Oxide Electrolysis Cell Electrolysis | Construction | electrolyzer production, 1MWe, SOEC, Stack | electrolyzer, 1MWe, SOEC, Stack | RER | Sacchi et al. | 1250.0 | unit / GW |
| Solid Oxide Electrolysis Cell Electrolysis | Operation | hydrogen production, gaseous, 1 bar, from SOEC electrolysis, from grid electricity | hydrogen, gaseous, 1 bar | CH | Sacchi et al. | 30030.03003 | kg / GWh |
| Steel Production | Construction | aluminium casting facility construction | aluminium casting facility | RoW | ecoinvent 3.8 cut-off | 67.38461538 | unit / kt/h |
| Steel Production | Operation | market for steel, chromium steel 18/8 | steel, chromium steel 18/8 | GLO | ecoinvent 3.8 cut-off | 1000000.0 | kg / kt |
| Steel Production with Heat Pump | Construction | aluminium casting facility construction | aluminium casting facility | RoW | ecoinvent 3.8 cut-off | 67.38461538 | unit / kt/h |
| Steel Production with Heat Pump | Operation | market for steel, chromium steel 18/8 | steel, chromium steel 18/8 | GLO | ecoinvent 3.8 cut-off | 1000000.0 | kg / kt |
| Steel Production with Heat Recovery | Construction | aluminium casting facility construction | aluminium casting facility | RoW | ecoinvent 3.8 cut-off | 67.38461538 | unit / kt/h |
| Steel Production with Heat Recovery | Operation | market for steel, chromium steel 18/8 | steel, chromium steel 18/8 | GLO | ecoinvent 3.8 cut-off | 1000000.0 | kg / kt |
| Styrene Polymerization Process | Construction | chemical factory construction, organics | chemical factory, organics | RoW | ecoinvent 3.8 cut-off | 1.752 | unit / kt/h |
| Styrene Polymerization Process | Operation | polystyrene production, expandable | polystyrene, expandable | RoW | ecoinvent 3.8 cut-off | 1000000.0 | kg / kt |
| Diesel-Powered Train | Construction | train production, passenger, long-distance | train, passenger, long-distance | RoW | ecoinvent 3.8 cut-off | 51.0787172 | unit / Mpkm/h |
| Diesel-Powered Train | Operation | transport, freight train, diesel | transport, freight train | RoW | ecoinvent 3.8 cut-off | 1000000.0 | pkm / Mpkm |
| Electric-Powered Train | Construction | train production, passenger, long-distance | train, passenger, long-distance | CH | ecoinvent 3.8 cut-off | 51.0787172 | unit / Mpkm/h |
| Electric-Powered Train | Operation | transport, passenger train | transport, passenger train | RoW | ecoinvent 3.8 cut-off | 1000000.0 | pkm / Mpkm |
| Electric-Powered Freight Train | Operation | transport, freight train, electricity | transport, freight train | RoW | ecoinvent 3.8 cut-off | 1000000.0 | tkm / Mtkm |
| Diesel-Powered Freight Train | Operation | transport, freight train, diesel | transport, freight train | RoW | ecoinvent 3.8 cut-off | 1000000.0 | tkm / Mtkm |
| Hydrogen-Powered Freight Train | Operation | transport, freight train, electricity | transport, freight train | RoW | ecoinvent 3.8 cut-off | 1000000.0 | tkm / Mtkm |
| Natural Gas-Powered Freight Train | Operation | transport, freight train, diesel | transport, freight train | RoW | ecoinvent 3.8 cut-off | 1000000.0 | tkm / Mtkm |
| Hydrogen-Powered Train | Construction | train production, passenger, long-distance | train, passenger, long-distance | CH | ecoinvent 3.8 cut-off | 51.0787172 | unit / Mpkm/h |
| Hydrogen-Powered Train | Operation | transport, passenger train | transport, passenger train | RoW | ecoinvent 3.8 cut-off | 1000000.0 | pkm / Mpkm |
| Natural Gas-Powered Train | Construction | train production, passenger, long-distance | train, passenger, long-distance | RoW | ecoinvent 3.8 cut-off | 51.0787172 | unit / Mpkm/h |
| Natural Gas-Powered Train | Operation | transport, freight train, diesel | transport, freight train | RoW | ecoinvent 3.8 cut-off | 1000000.0 | pkm / Mpkm |
| Tramway | Construction | tram production | tram | RoW | ecoinvent 3.8 cut-off | 11459.9686 | unit / Mpkm/h |
| Tramway | Operation | transport, tram | transport, tram | RoW | ecoinvent 3.8 cut-off | 1000000.0 | pkm / Mpkm |
| Diesel-Powered Truck | Construction | Medium duty truck, diesel, 26t gross weight, 2020, EURO-VI, long haul | Medium duty truck, EURO-VI | RER | Sacchi et al. | 16906.84508 | unit / Mtkm/h |
| Diesel-Powered Truck | Operation | transport, freight, lorry, diesel, 26t gross weight, 2020, EURO-VI, long haul | transport, freight, lorry, EURO-VI | RER | Sacchi et al. | 1000000.0 | tkm / Mtkm |
| Electric-Powered Truck | Construction | Medium duty truck, battery electric, NMC-622 battery, 26t gross weight, 2020, long haul | Medium duty truck | RER | Sacchi et al. | 16906.84508 | unit / Mtkm/h |
| Electric-Powered Truck | Operation | transport, freight, lorry, battery electric, NMC-622 battery, 26t gross weight, 2020, long haul | transport, freight, lorry | RER | Sacchi et al. | 1000000.0 | tkm / Mtkm |
| Fuel Cell-Powered Truck | Construction | Medium duty truck, fuel cell electric, 26t gross weight, 2020, long haul | Medium duty truck | RER | Sacchi et al. | 16906.84508 | unit / Mtkm/h |
| Fuel Cell-Powered Truck | Operation | transport, freight, lorry, fuel cell electric, 26t gross weight, 2020, long haul | transport, freight, lorry | RER | Sacchi et al. | 1000000.0 | tkm / Mtkm |
| Compressed Natural Gas-Powered Truck | Construction | Medium duty truck, compressed gas, 26t gross weight, 2020, EURO-VI, long haul | Medium duty truck, EURO-VI | RER | Sacchi et al. | 16906.84508 | unit / Mtkm/h |
| Compressed Natural Gas-Powered Truck | Operation | transport, freight, lorry, compressed gas, 26t gross weight, 2020, EURO-VI, long haul | transport, freight, lorry, EURO-VI | RER | Sacchi et al. | 1000000.0 | tkm / Mtkm |
| ”Wind Energy ” | Construction | wind turbine construction, 2MW, onshore | wind turbine, 2MW, onshore | GLO | ecoinvent 3.8 cut-off | 500.0 | unit / GW |
| ”Wind Energy ” | Operation | electricity production, wind, 1-3MW turbine, onshore | electricity, high voltage | RoW | ecoinvent 3.8 cut-off | 1000000.0 | kWh / GWh |
| Conversion of Wood to Methanol | Construction | market for methanol factory | methanol factory | GLO | ecoinvent 3.8 cut-off | 0.5856397914 | unit / GW |
| Conversion of Wood to Methanol | Operation | methanol production | methanol | GLO | ecoinvent 3.8 cut-off | 180505.4152 | kg / GWh |
A.3 EnergyScope technologies LCI database
A holistic database for all technologies in EnergyScope has been created, allowing to assess the environmental impact of all technologies throughout the End-Points, Areas of Protection and Areas of Concern. Comparison in between technologies of one sector can directly be proceeded, furthermore allowing to identify which impact weighs most in the Areas of Concern for example. Representative for all technologies, the renewable energy sector technologies is presented in Figure 6. The entire database can be found https://gitlab.com/ipese/energyscope-lca/Data/LCA-technologies.
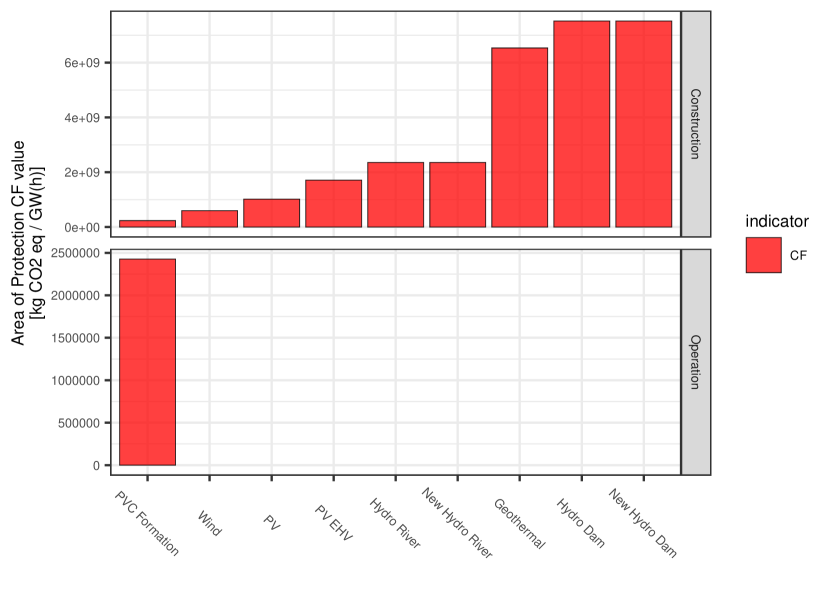
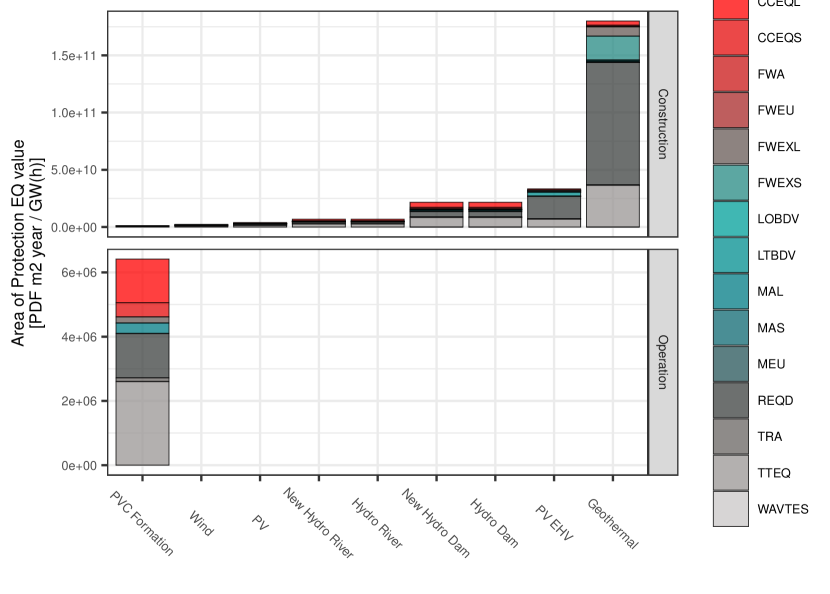
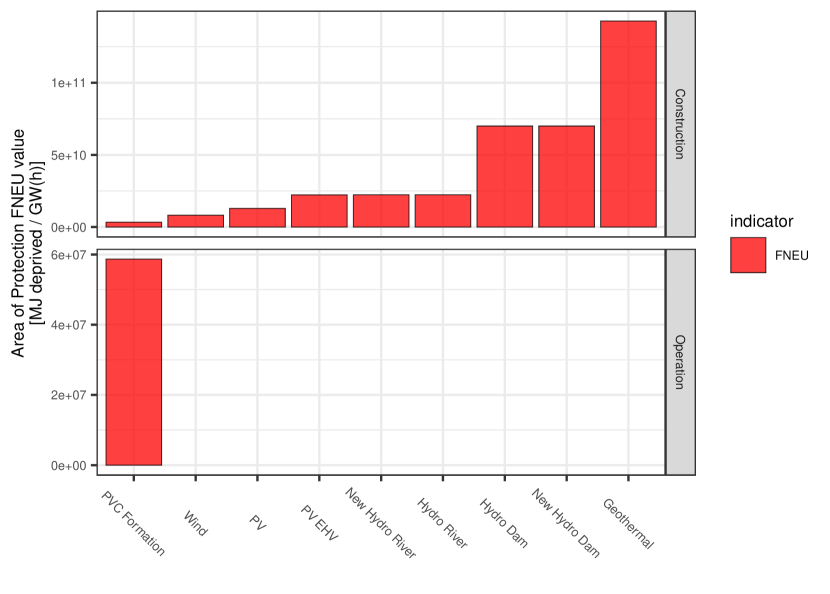
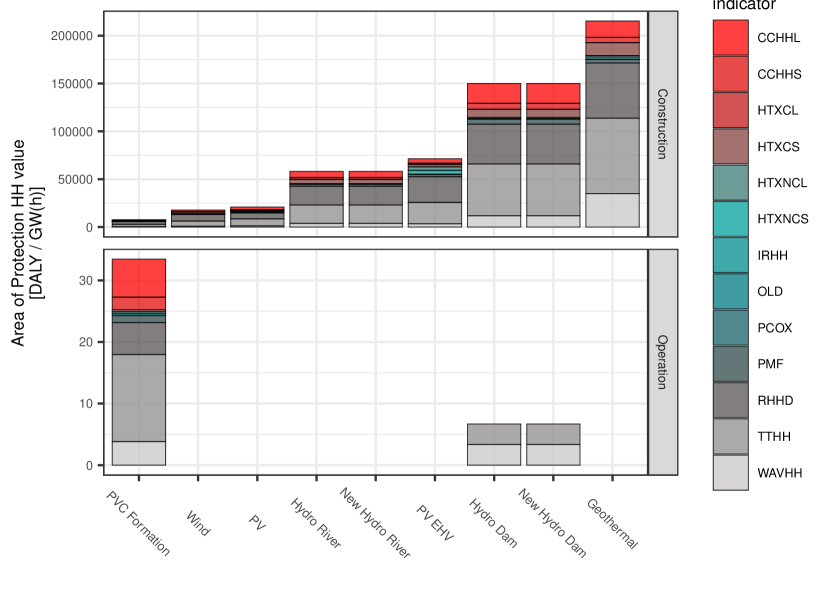
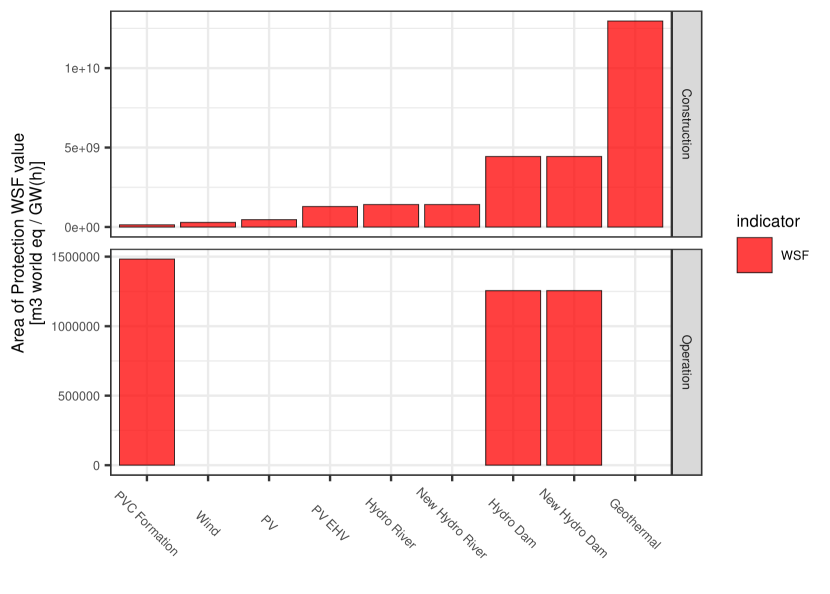
A.4 Double-counting removal
Appendix B Technology distributions
B.1 Energy system configurations
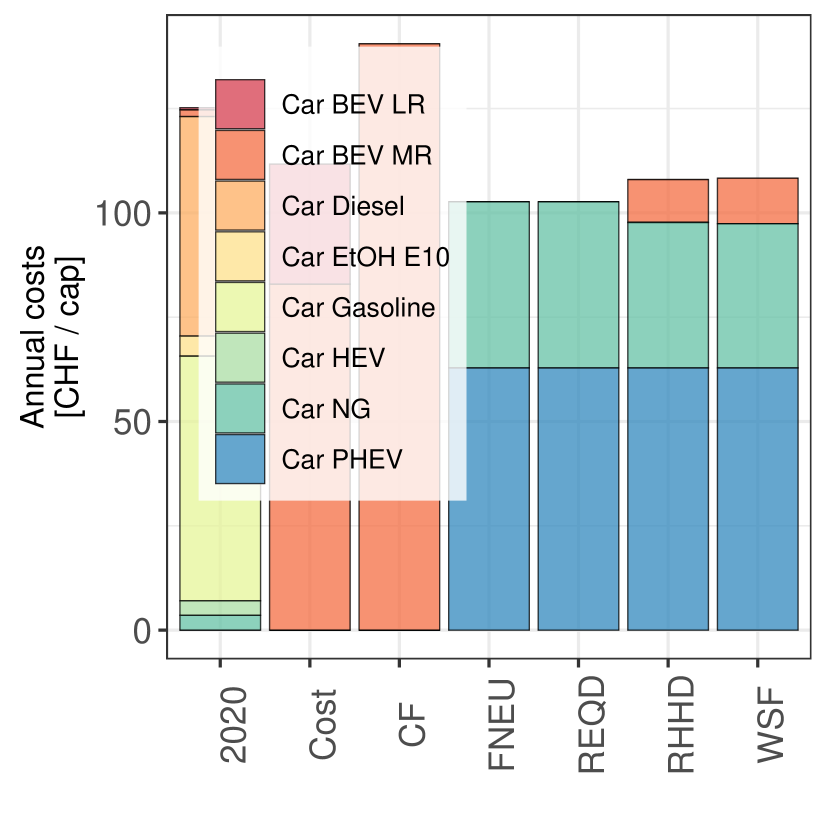
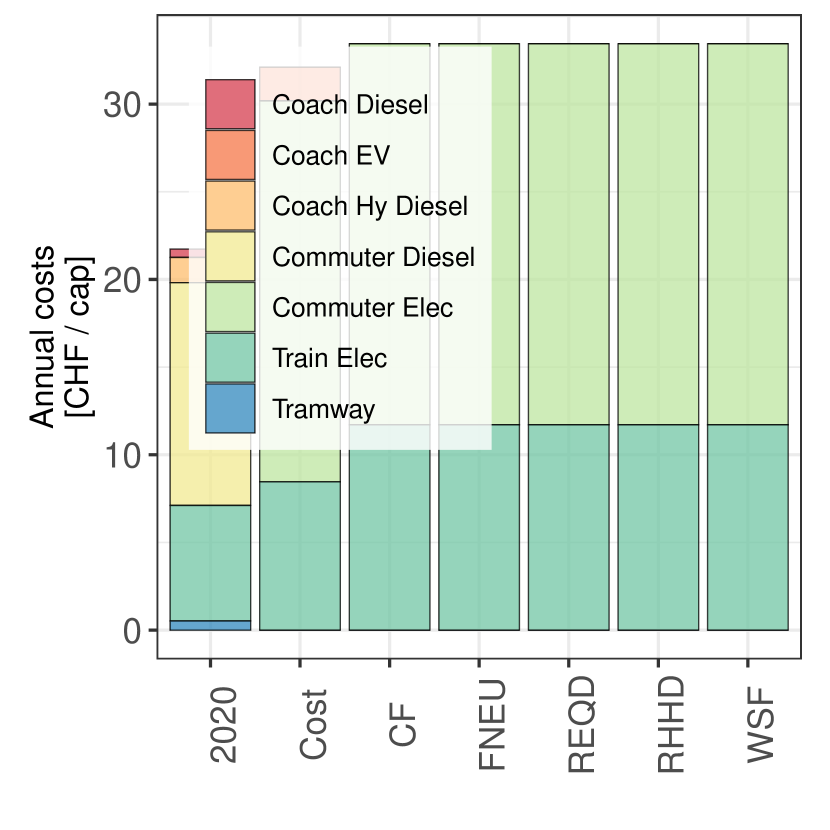
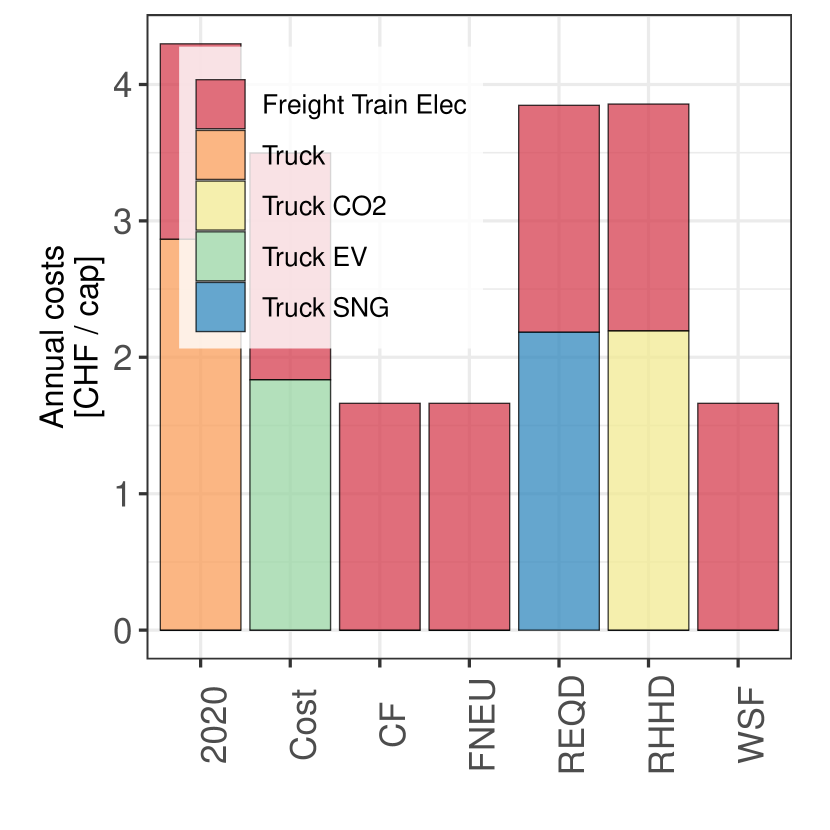
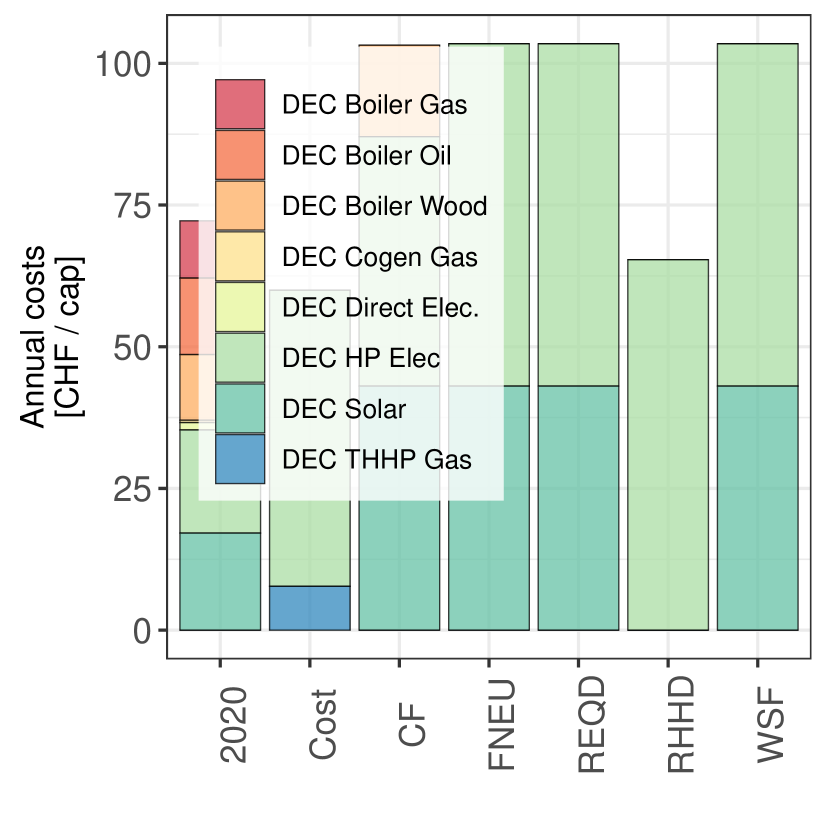
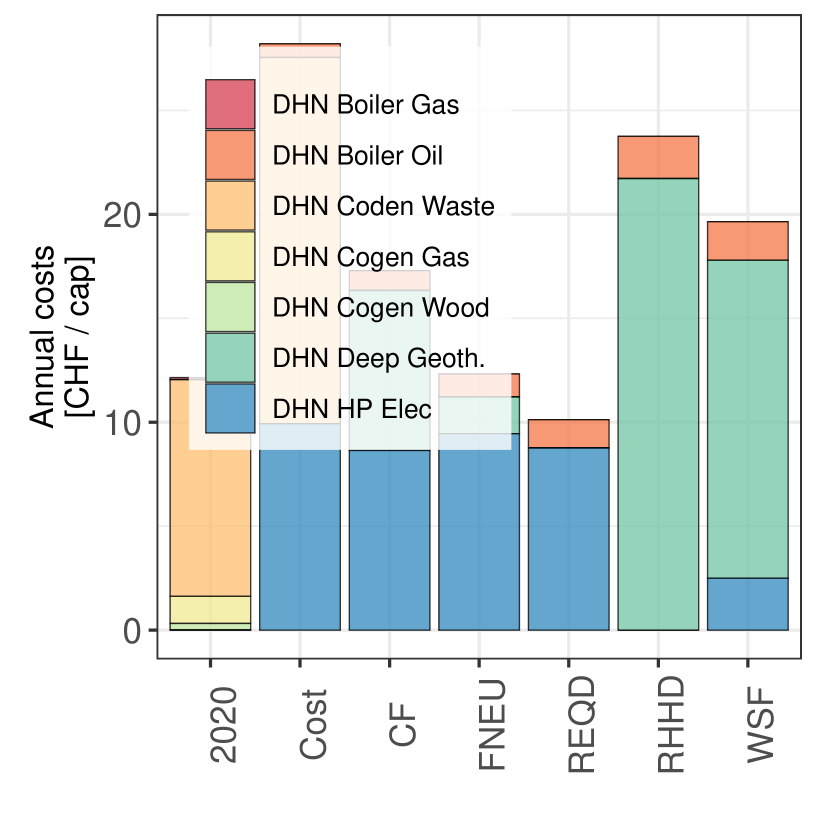
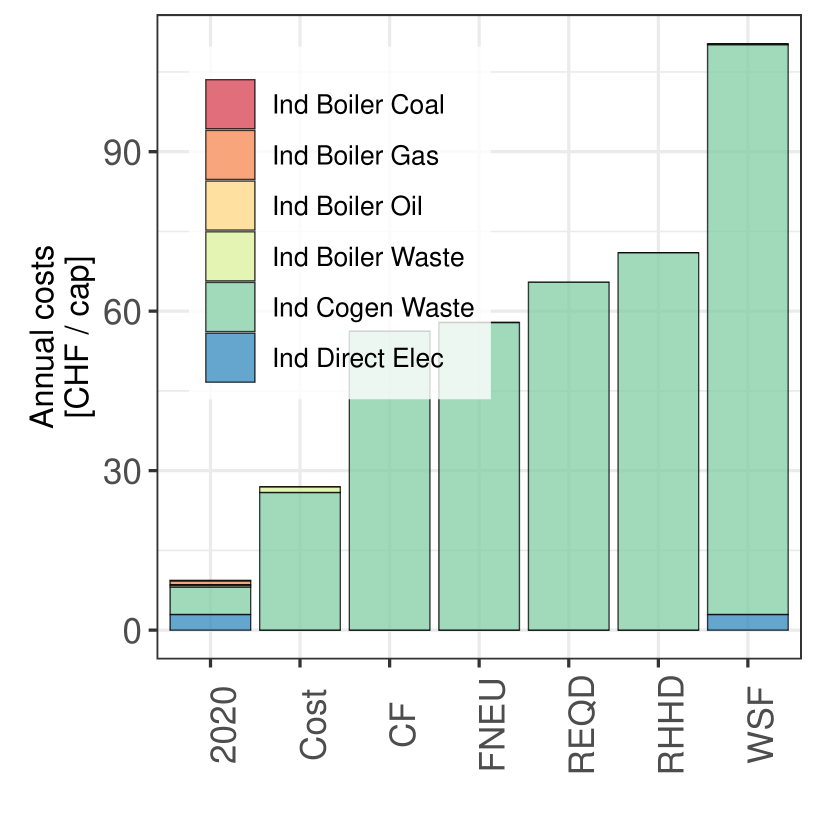
The shift from fossil fuel imports to local energy resources leads to a shift in the mobility sector too, where the fossil fuel dominated private and freight transportation (Figures 7(a), 7(b) & 7(c)) is replaced by pure battery electric vehicles for the cost and CF scenarios and a vehicle fleet based on synthetic fuels composed of hybrid electric vehicles and pure \chCH4 vehicles for the remaining environmental OF minimizations. Electric public transportation is maximized, similar to electric freight transport on rails. While CF, FNEU, and WSF minimizations all select Hydrogen Fuel Cell trucks for road transportation, other truck types are selected for the remaining scenarios (cost: battery electric trucks, REQD: \chCH4 powered trucks & RHHD: the carbon capture trucks fueled by synthetic Diesel).
The same behavior can be observed in the heating sector, where fossil fuels are replaced by electric, more efficient, technologies maximizing the use of district solutions. While at decentralized level (Figure 7(d)) the heating technologies are dominated by heat pumps complemented by solar thermal panels (except RHHD) in combination with Gas powered heat pumps in the cost minimization and wood boilers in CF minimization, the district heating (Figure 7(e)) configurations differ more: CF and FNEU are based on district scale heat pumps, RHHD and WSF on geothermal heating and cost combines heat pumps with waste cogeneration. While these district solutions are based on baseline technologies and thus subject to intermittency, backup solutions at district levels are installed based on synthetic fuels to back up the peak heating demands. Throughout the scenarios process heat for industry (Figure 7(f)) is generated on waste-based cogeneration plants, where WSF minimization uses the synergy with the district heating to provide additional low-temperature heat.
The use of local resources only leads to energy storage demands (Figure 4 secondary y-axis). Throughout the scenarios, hydro dam storage is used at its maximum capacity of . The use of \chCH4 as heating peak backup and the balancing of the dephasing between seasonal energy demand and production is balanced in the cost configuration with the installation of of biogenic \chCH4 storage. The production of synthetic fuels for mobility based on electrolysis and methanation requiring \chCO2 storage can be observed in all environmental minimization scenarios except CF, where the fleet is electric. An additional energy storage capacity in the form of of Diesel is required in the RHHD scenario, where the Carbon Capture truck is used for road freight mobility.
B.2 Sectoral environmental impacts
By analyzing the relative contribution to overall LCA and cost impact scores in term of construction (related to capital infrastructure) and operation (variable energy resource supply and cost) as depicted in Figure 8 where the first column corresponds to the 2020 baseline scenario and the remaining columns represent the histograms of the single-score optimizations, we can observe a shift from operational to capital cost and impacts. While the current energy system predominantly reflects operational environmental impacts, the LCIA indicators for economic configurations lean more towards constructional impacts. This inclination suggests a strategic minimization of specific technology constructions and uses at the expense of other indicators.
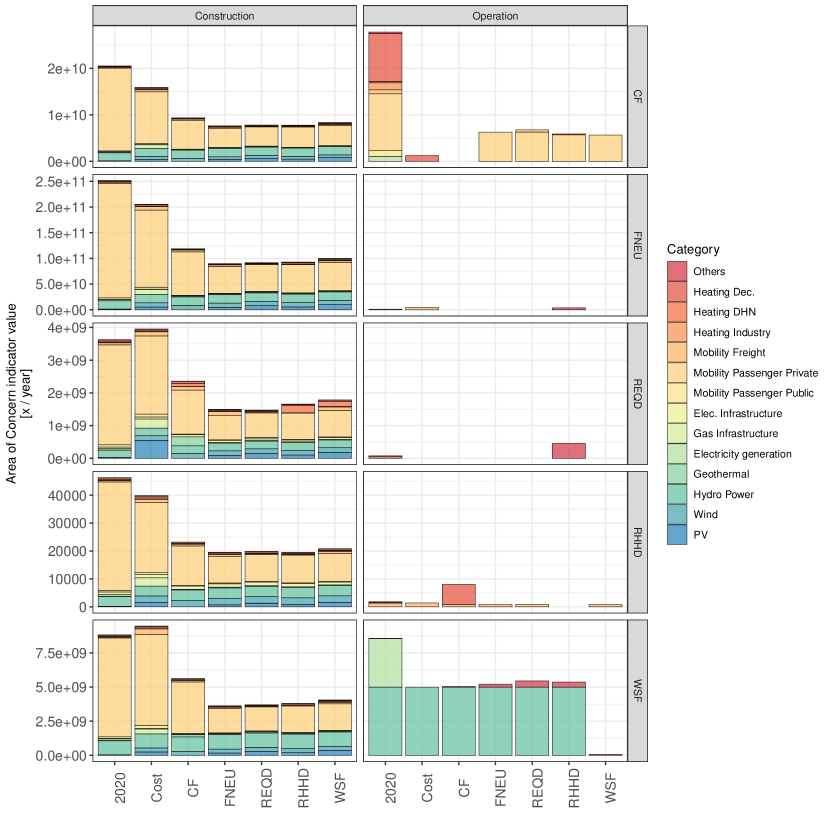
Examining the constant emissions (construction) in the left column of Figure 8, the private mobility sector is the major contributor accounting for between and of the impact across all AoCs. The residual impact is attributed to renewable energy. Here, hydropower plants have the highest impacts, trailed by PV, with the peak observed in the cost minimization scenario. Notably, the composition of these impacts remains consistent across different impact categories.
When scrutinizing operational impacts, all optimized scenarios display reduced impact compared to 2020, as the system relies on local, more efficient renewable resources. Operational impacts for indicators FNEU, REQD, and RHHD are minimal. In contrast, CF and WSF demonstrate impacts comparable to constructional ones unless these objectives are minimized. Specifically, when CF is minimized, the direct emissions are virtually eradicated, thanks to the adoption of carbon-neutral mobility and heating technologies. The water scarcity footprint, predominantly influenced by hydro dam usage and 2020’s nuclear plants, is reduced by sidelining hydro dams and compensating the energy shortfall with additional PV installations.
Transitioning from the current energy system to an environmentally optimized one inherently diminishes the indirect impact across all indicators and the direct carbon emissions. While direct impacts for FNEU, REQD, and RHHD remain minimal in both the current and optimized systems relative to their indirect counterparts, WSF at the operational level are heavily influenced by existing hydro dams. When minimizing its impact, this creates a paradoxical situation, leading to underutilizing existing infrastructure.
From variable to constant emissions
The study categorizes LCA indicators into constant emissions from construction and variable emissions from operation. Current energy systems show higher operational impacts, while economically optimized configurations skew towards construction impacts, suggesting a trade-off in technology use. The private mobility sector dominates construction impacts, ranging from to . Hydropower displays the most considerable construction emissions, followed by photovoltaics, especially in the cost-minimization scenario.
In operation, optimized scenarios reduce emissions across all indicators compared to 2020. Direct emissions for FNEU, REQD, and RHHD are minimal, but CF and WSF operational impacts can rival construction emissions unless they are targeted for minimization. CF minimization almost eliminates its operational emissions through carbon-neutral mobility and heating. WSF impact lessens when hydro dams are underused in favor of additional PV installations to address energy deficits.
Transitioning to optimized energy systems significantly lowers indirect and direct carbon emissions across all indicators. Direct impacts for FNEU, REQD, and RHHD are minor relative to their indirect counterparts in both current and optimized systems. However, WSF operational impact is significantly affected by hydro dams, presenting an economic challenge when trying to minimize its impact due to the potential underutilization of this infrastructure.