Insights into the mechanics of sessile whole blood droplet evaporation
Abstract
We study the mechanics of sessile whole blood drop evaporation using direct experimental color visualization and theoretical methods. We show that the transient evaporation process can be subdivided into three major phases (A, B, and C) based on the evaporation rate. Phase A is the fastest where edge evaporation dominates and leads to the formation of a gelated three phase contact line. Gelation is a result of sol-gel phase transition that occurs due to the accumulation of RBCs (red blood cells) as they get transported due to outward capillary flow generated during drop evaporation. The intermediate phase B consists of gelation front propagating radially inwards due to a combined effect of outward capillary flow and drop height reduction evaporating in CCR (constant contact radius) mode leading to a formation of a wet gel phase. We unearth that the gelation of the entire droplet occurs in Phase B and the gel formed contains trace amounts of water that is detectable from our experiments. Phase C is the final slowest stage of evaporation, where the wet gel transforms into dry-gel and leads to the formation of dessication stress concentrations resulting in the formation of various kinds of crack patterns in the dried blood drop precipitate. Using profilometry and scanning electron microscopy we observe radial cracks in the thicker region of the precipitate and mud flat type cracks are observed in the center part of the evaporating droplet where the drop thickness is relatively small and curvature is negligible. We also study the evaporation of bacteria laden droplets to simulate bacterial infection in human blood and show that the drop evaporation rate and final dried residue pattern does not change appreciably within the parameter variation of the bacterial concentration typically found in bacterial infection of living organisms.
keywords:
Authors should not enter keywords on the manuscript, as these must be chosen by the author during the online submission process and will then be added during the typesetting process (see http://journals.cambridge.org/data/relatedlink/jfm-keywords.pdf for the full list)1 Introduction
In this study we investigate the mechanics of sessile blood droplet evaporation. Understanding the behavior of sessile blood droplet during evaporation is essential in forensic science, biotechnology, and the development of advanced diagnostic tools (Chen et al., 2016). We also observe evaporation phenomena in different biological fluids in various natural phenomena like blood clots dessication in wounds (Sobac & Brutin, 2011; Brutin et al., 2011; Laux et al., 2016), biofilm formations (Wilking et al., 2013), drying of tears (Traipe-Castro et al., 2014) to name a few. Apart from forensics and disease diagnostics, analysis of dessicated biological samples are also important in several applications like archeological studies (Wilson et al., 2013), microarray applications for DNA, RNA, proteins, phenotype studies (Smalyukh et al., 2006). Analyzing the characteristics of sessile blood droplets during evaporation can provide valuable insights into the source, age, and composition of the blood sample. The physics of sessile blood drop evaporation falls at the intersection of various disciplines like fluid mechanics, solid mechanics, soft matter, statistical physics, surface chemistry, colloidal physics, biology to name a few and knowledge of the evaporation and precipitate formation still remains in its infancy (Lanotte et al., 2017). Blood is a complex fluid consisting of formed cellular elements suspended in blood plasma (Hoffbrand & Steensma, 2019). The various cellular elements like erythrocytes (red blood cells), leukocytes (white blood cells) and the thrombocytes (platelets) forms approximately 45-50% of the blood volume with RBCs having the largest percentage among the cellular elements. Blood plasma on the other hand is an amber color liquid component of the blood which makes approximately 50-55% of the total blood volume. 94-95% of the blood plasma by volume is essentially water with the remaining 5-6% being dissolved proteins, electrolytes, glucose, clotting factors, hormones, carbon dioxide and oxygen. We can therefore approximate blood as a colloidal suspension of RBCs in plasma to first order accuracy. The morphology of dried residues of blood drops hence depends primarily on the deposition of RBCs, the major solute component of blood plasma. The evaporation/dessication of biofluids like blood, saliva, mucus, urine has been explored majorly in sessile droplet and thin films on solid substrates due to the simplicity of the experimental setup (Hu & Larson, 2002). The major observations were the formation of a ring like deposit at the contact line and a complex set of crack patterns in dessication drops and films. The different patterns formed in evaporating drops and films of biological fluids resembled patterns found in various colloidal dessicating drops and films hinting towards some unifying underlying laws that were common to biofluids, colloids and pure systems (Tarasevich et al., 2011; Deegan et al., 1997, 2000; Dufresne et al., 2003; Allain & Limat, 1995; Denkov et al., 1992; Adachi et al., 1995). Previous studies by scientists and engineers using model fluids like mucin revealed that both deposition and crack formation depends strongly on the particle concentration and types of dissolved salts, macro-molecules, proteins and surfactants (Nguyen & Stebe, 2002). This work explores blood drop evaporation physics in depth and tests whether microbial bacteria present in blood can affect the evaporation process and dried precipitate residue.
Various kinds of optical diagnostics methods are used to study complex biological fluids in different conditions and have shown that pathological changes of solute and solvent composition affects the morphology of the dried residues in evaporating drops and films (Yakhno et al., 2005; Shatokhina et al., 2004; Esmonde-White et al., 2014). Upto the recent decade, dessication studies on biological fluids have majorly focused on solutions, but the evaporation physics of drying suspensions are relatively sparse. The seminal work of Brutin et al. (Brutin et al., 2011) and Chen et al. being some exception. Blood is a concentrated colloidal suspension with particle volume fraction / Hematocrit () of in healthy individuals [ref]. Based on volume ratio, blood can be thought of comprising of two major components, RBCs () and plasma () where , represents the respective volumes in a total blood volume of . Plasma is the protein (fibrinogen, albumin) laden aqueous salt solution suspending medium for the micron size deformable RBCs in corpuscular phase. RBCs are typically biconcave shape at rest. The very high concentration of RBCs makes visualization of evaporating blood droplets very challenging in general. Brutin and his collaborators performed blood drop evaporation analysis using optical microscopy and mass measurements. The droplet evaporation mechanism, dessication time and morphology of dried blood residues were unearthed by Brutin et al. (Brutin et al., 2011) using experimental techniques. However a comprehensive quantitative model of the various processes that occurs during blood drop evaporation are relatively unexplored in detail. This work tries to fill some of the corresponding research gap by unearthing the fundamental mechanisms quantitatively. In general, the evaporation and the dried residue of a dessicating biological fluid such as blood depends on the ambient enviromental factors (like temperature and humidity), substrate characteristics (like chemical composition, wettability, adhesion), and droplet geometry, fluid mechanical, physicochemical, thermofluidic, and biophysical properties (like density, viscosity, surface tension, pathology). The dried blood drop dominant pattern consists of a thick rim and a center region of relatively small thickness. The rim thickness is caused due to the transport of RBCs by capillary flow induced by sessile drop evaporation. The variation of thickness from the drop center to the outer rim region in the radial direction causes crack patterns of different morphologies. Radial cracks are formed in the rim region whereas mud-flat type of cracks are formed in the center and outer periphery of the dried residues. Evaporating colloidal and polymeric sessile drops in analogous forms a skin layer at the air-liquid interface which eventually undergoes a buckling.
Current literature on blood drop evaporation are primarily based on observational characteristics of drop shape, mass, and crack patterns (Choi et al., 2020; Mukhopadhyay et al., 2020; Iqbal et al., 2020; Bahmani et al., 2017). However, fundamental mechanistic understanding of blood drop dessication process is far from complete and requires thorough quantitative analysis. This work serves as a bridge to understand the mechanics of blood drop evaporation using ideas from colloidal dessicating drops. We decipher the various phases and the allied mechanisms of blood drop drying using high fidelity color optical imaging, quantitative theoretical modelling and experimental micro/nano characterization. It is important to note that the scope of the current work is to understand the various mechanisms and phases related to blood droplet drying physics in a quantitative manner using experimental and theoretical methods. However, full scale numerical simulation of the various processes involved is beyond the scope of the present work. The current manuscript is structured as follows. Section 2 discusses the materials and methods in several subsections. Blood sample preparation, experimental set up and dried residue characterization is discussed in section 2.1, 2.2 and 2.3 respectively. Section 3.1 introduces the key results as a global overview. Section 3.3 discusses the various stages of blood drop evaporation. Section 3.4 discusses the quantitative modelling and the generalized mechanics of blood drop evaporation. Section 3.5 presents the characterization of dried blood residues and discusses the cracking mechanics due to dessication stresses. Section 4 concludes the manuscript.
2 Materials and Methods
2.1 Blood sample preparation
Blood samples were collected from three healthy volunteers (1 female, 2 male) in the age group (25-40 years) with proper consent. 10 ml volume of whole blood was drawn in K3-EDTA vacutainer containers to prevent the blood from clotting. 2-4 ml of the collected blood were sent for several blood characterization tests relevant to the mechanics of the various processes during evaporation like CBC (Complete Blood Count), PT (Prothrombin Time), and ESR (Erythrocyte Sedimentation Rate). Overnight grown stationary phase cultures of Klebsiella pneumoniae MH1698 were taken, and their absorbance was measured at OD600nm. Various bacterial concentrations in the range of CFU/mL of the bacterial culture were pelleted down at 6000 rpm for 6 minutes. The pellets were washed twice with phosphate-buffered saline (PBS) pH 7.0 and finally resuspended in 500 µL EDTA whole blood. For confocal microscopy studies, S. Typhimurium expressing Green Fluorescent Protein (GFP) (pFV-GFP) (STM-GFP) strains were used.
2.2 Experimental Set up
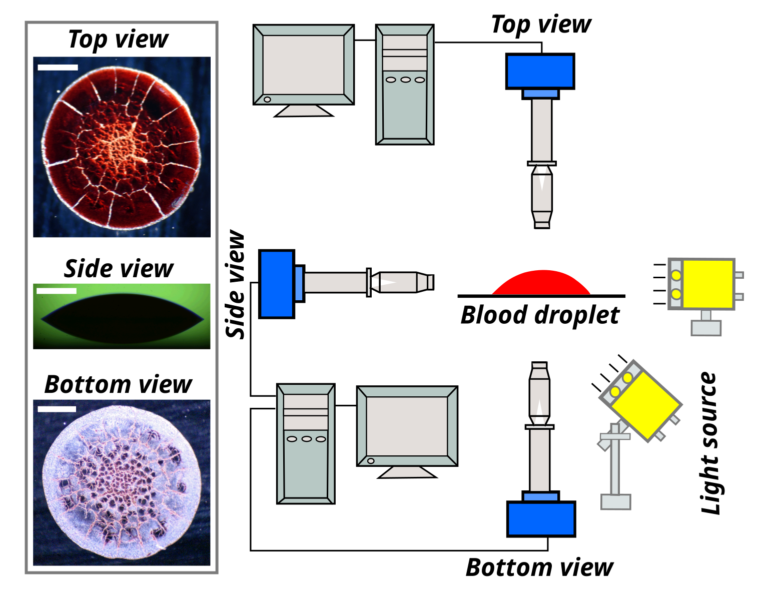
Figure 1 shows a schematic representation of the experimental setup. The experimental setup consists of a L blood droplet evaporating on a a clean glass slide of dimensions mm3 (procured from Blue Star). The blood droplet was placed gently on the glass slide using a micropipette. All the evaporation experiments were performed at a relative humidity of and a ambient temperature of measured using TSP-01 sensor, Thorlabs. The complete blood droplet evaporation process is recorded using color optical diagnostics from three views, i.e., top, side and bottom view imaging. The top and bottom view were operated in reflection mode whereas shadowgraphy was performed using side view imaging. The color images of all the corresponding views (top, bottom and side) were recorded using 3 DSLR camera (Nikon D5600) coupled with a Navitar zoom lens assembly (2X lens 4X adapter tube). 5W LED light source (Holmarc) and 50W mercury lamp were used to provide uniform illumination for the three imaging views. A spatial resolution of 1pixel/m were used for the optical color imaging. Consecutive images were captured using a time delay of 10 seconds. Typical sample top, side and bottom view images are shown in figure 1 respectively. The scale bar in white denotes 1mm. The instantaneous geometrical parameters and features were extracted using image processing techniques applied to the side, top and bottom view images using open source software ImageJ and python programming language.
2.3 Dried residue characterization
Scanning Electron Microscopy (SEM) was employed to analyze the surface characteristics of the deposits, revealing the microcrack patterns through high-resolution imaging. Ultra55 FE- SEM Karl Zeiss EDS instrument is used. SEM images showed the detailed crack patterns and stacking of RBCs on the surface. Prior to the SEM examination, the deposit surfaces were desiccated for 24 hours and then coated with a thin layer of gold, approximately 10 nm thick, to facilitate SEM and profilometric studies. For assessing the deposits geometrical features, a non-contact optical profilometry method was utilized. The measurements were conducted using a Taylor Hobson 3D surface and film thickness optical profiler. Additionally, the TalySurf CCI, a commercial optical metrology software, was used for processing the data. Zeiss LSM 880 NLO upright multi-photon confocal microscope was used to image the dried sessile blood droplet precipitate at 10X magnification. ZEN Black software (Carl Zeiss) was used to obtain the Z stacks images to study the bacterial deposition in the precipitates.
3 Results and Discussions
3.1 Global overview
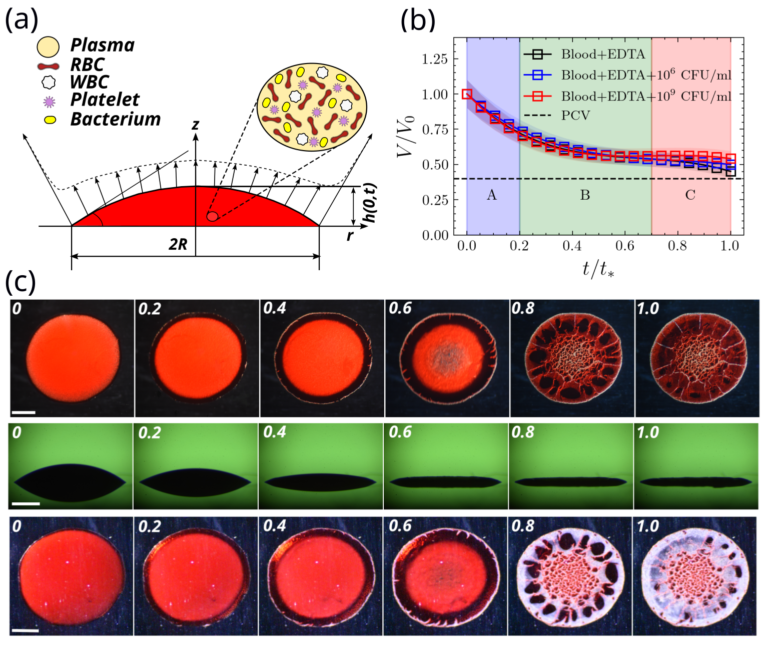
Figure 2(a) depicts the schematic representation of an evaporating sessile droplet. Figure 2(b) represents the normalized volume regression of the evaporating droplet for various blood samples (pure and bacteria laden). Figure 2(c) represents the top, side and bottom view image sequence of the evaporation process. In this work we study transient sessile blood drop evaporation (figure 2(a)) with pure EDTA whole blood and bacteria laden EDTA whole blood with varying levels of bacterial concentration theoretically and experimentally using lubrication theory, color optical imaging and micro/nano characterization. We further show that the transient evaporation dynamics can be subdivided into three phases (A, B, and C) based on the evaporation rate (figure 2(b)). Phase A (figure 2(b,c) ) is the fastest where edge evaporation dominates and leads to the formation of a gelation three phase contact line front propagating radially inwards. This occurs due to initial outward capillary flow generated due to drop evaporation that transports the RBCs radially outwards. The intermediate phase B (figure 2(b,c) ) consists of gelation of the entire droplet due to the propagating gelation front due to the radial RBCs deposition and the reduction in droplet height. Gelation in phase A and B occurs due to the sol-gel phase transition. The sol-gel phase transition occurs when the solute concentration (RBCs here) becomes larger than a critical concentration. We unearth that the gelation of the entire droplet occurs in Phase B and at the end of Phase B, the gel formed still contains small traces of water that is detectable from our experiments. Phase C (figure 2(b,c) ) is the final slowest stage of evaporation, where the wet gel formed during Phase A and Phase B transforms into dry-gel due to a very slow evaporation process. The drying droplet results in high azimuthal stress concentrations resulting in the formation of radial cracks. Mud flat cracks are observed in the center part of the evaporating droplet where the drop thickness is relatively small and curvature is negligible. We further show that the drop evaporation rate does not change appreciably within the parameter variation of the bacterial concentration typically found in blood of living organisms (figure 2(b)).
3.2 Coordinate system and drop evaporation physics
Figure 2(a) shows the schematic of the evaporating droplet and the associated coordinate system. Axisymmetric cylindrical coordinate system () is used for quantitative analysis of the evaporation process. Here represents the radial coordinate and the axial coordinate, the vertical axis along which the drop interface profile would be symmetric. For small droplets, the droplet interface geometry could be approximated by a spherical cap geometry with a particular contact angle (), contact radius () and central height () for a particular droplet volume and substrate. Isothermal sessile drop evaporation for thin droplets in the size range of mm (i.e., m and ) can be modelled to high degree of accuracy by a diffusion limited model. The size where reaction dominated evaporation phenomena begins is approximately at length scales of the order of nm which is considerably very small with respect to the typical size scale we have in our experiments, therefore conforming to diffusion limited drop evaporation. Drop evaporation in general can occur in various modes like CCR (constant contact radius) and CCA (constant contact angle) depending on the wettability of the substrate. For hydrophilic substrate with initial acute contact angle as is the present case, drop evaporation generally occurs in CCR mode of evaporation. In CCR mode of evaporation the droplet three phase contact line is pinned throughout the evaporation process while the contact angle decreases with time. For the present case of evaporating whole blood droplets, the evaporation occurs in CCR mode as can be observed from the image snapshots in figure 2(c). From figure 2(b) we can observe the entire CCR mode of evaporation process can be further subdivided into three phases A, B, and C based on descending evaporation rate. Figure 2(b) represents the graph of normalized volume ratio () with normalized time () for the evaporating drop. Here denotes the instantaneous drop volume and denotes the initial drop volume. Here denotes the instantaneous time and denotes the complete evaporation time scale (defined experimentally as the time instant where no significant changes are observed in drop morphologies in all the three views). From figure 2(b,c) we can observe that phase A corresponds to , phase B corresponds to and phase C corresponds to .
3.3 Stages of blood drop evaporation
3.3.1 Phase A
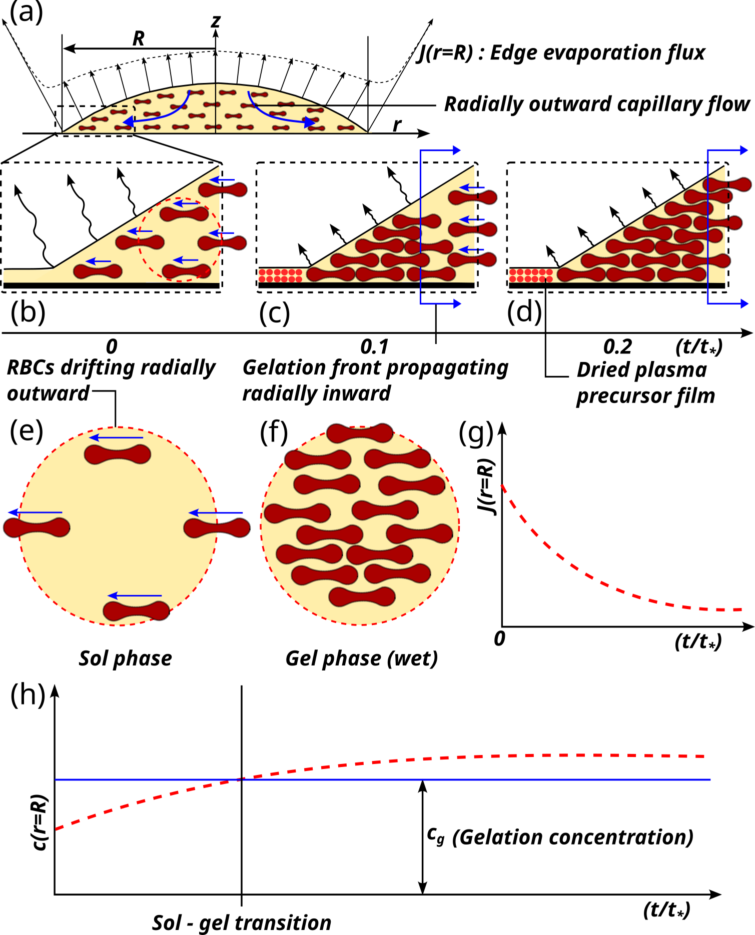
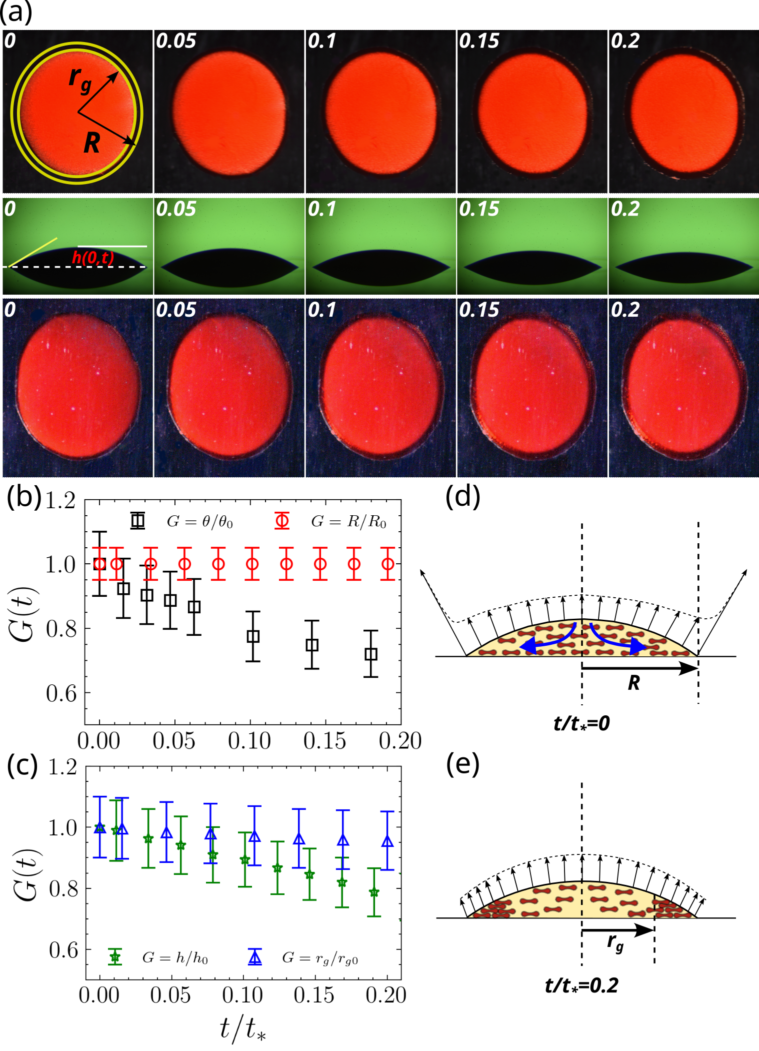
Figure 3 shows the schematic representation of various processes that occurs during Phase A of blood droplet evaporation. Figure 3(a) shows the initial configuration of the evaporating blood droplet. To first approximation, blood can be approximated as a binary suspension (RBCs suspended in plasma). The evaporation occurs in CCR mode with a constant contact radius . For small drops the droplet shape can be approximated by a spherical cap and the evaporation flux along the droplet interface increases with radial coordinate , with very large value at the three phase contact line. The non-uniform evaporation flux along the drop interface generates a radially outward capillary flow that causes the RBCs to be transported towards the three phase contact line. Figure 3(b,c,d) shows the magnified view near the three phase contact line at respectively. At initial time of drop evaporation, a very thin precursor film exist at the outer edge of the droplet which slowly solidifies as a plasma layer. The outer radial capillary flow (shown in blue) causes the RBCs to accumulate resulting in the formation of a gel phase. After the intial gelation of the three phase contact line, a gelation front radially propagating inward is observed (blue line). Further the RBCs concentration increases at the outer periphery and leads to the reduction of partial pressure of water vapor according to Raoult’s law thereby reducing the evaporation flux at the drop interface near the three phase contact line. A small dotted circle representing a control volume (CV) is shown figure 3(b). Figure 3(e) shows the zoomed in view of the CV. The blood suspension inside the CV is initially in sol phase. However, due to the outward capillary flow, the RBCs concentration inside the control volume increases leading to a phase transition forming a wet gel phase. Figure 3(g) shows the reduction of evaporation flux at radial location (at three phase contact line) due to Raoult’s law triggered by sol-gel phase transition. Figure 3(h) shows the corresponding rise in RBCs concentration at the three phase contact line due to the radially outward movement of RBCs caused by the capillary flow generated due to CCR mode of drop evaporation. Sol-gel transition occurs at the three phase contact line as the concentration becomes greater than a critical gelation concentration . Figure 4(a) shows the top, side and bottom image sequence for Phase A of the evaporating blood droplet in the top, middle and bottom panel. The constant contact pinned radius is denoted by and the gelation radius by . The drop contact angle represnted by , and drop center height by . Figure 4(b) shows the evolution of various normalized geometrical parameters like normalized contact angle () and normalized contact radius confirming CCR mode of drop evaporation. Figure 4(c) also shows the evolution of various normalized geometrical parameters like normalized droplet center height () and normalized gelation radius () during phase A. It can also be observed that the droplet height reduction is faster in comparison to the gelation front propagation. Figure 4(d,e) shows the schematic representation of the evaporation phase A at and respectively. Further figure 4(d,e) also depicts the change in evaporation flux schematically due to increase in RBCs concentration caused due to radial outward capillary flow induced by the evaporating whole blood droplet.
3.3.2 Phase B
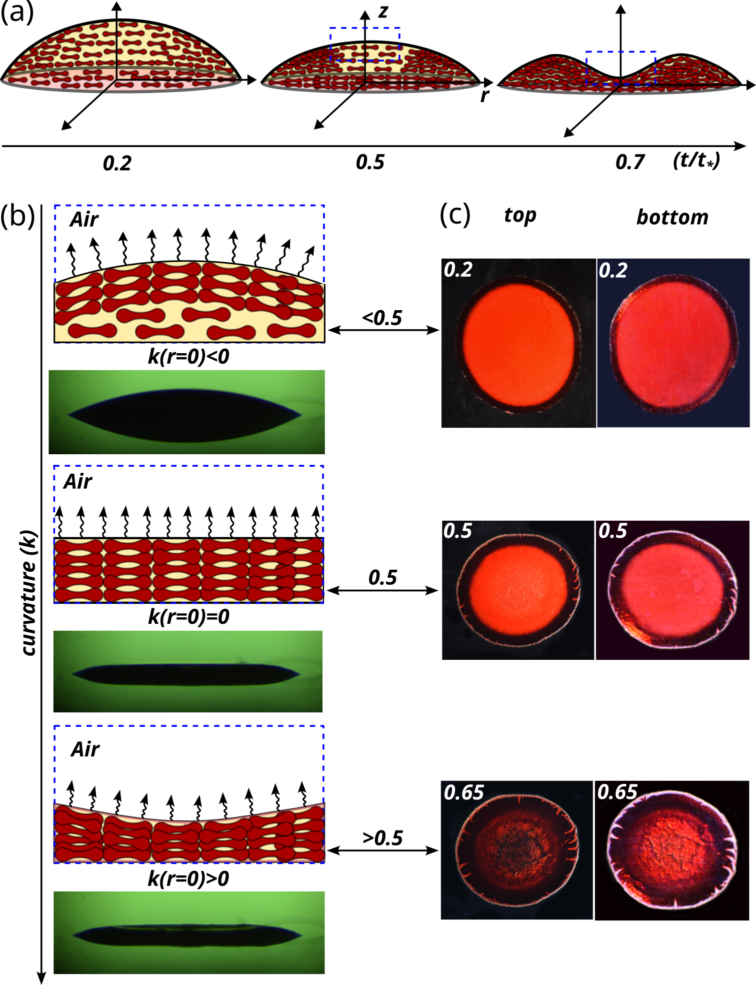
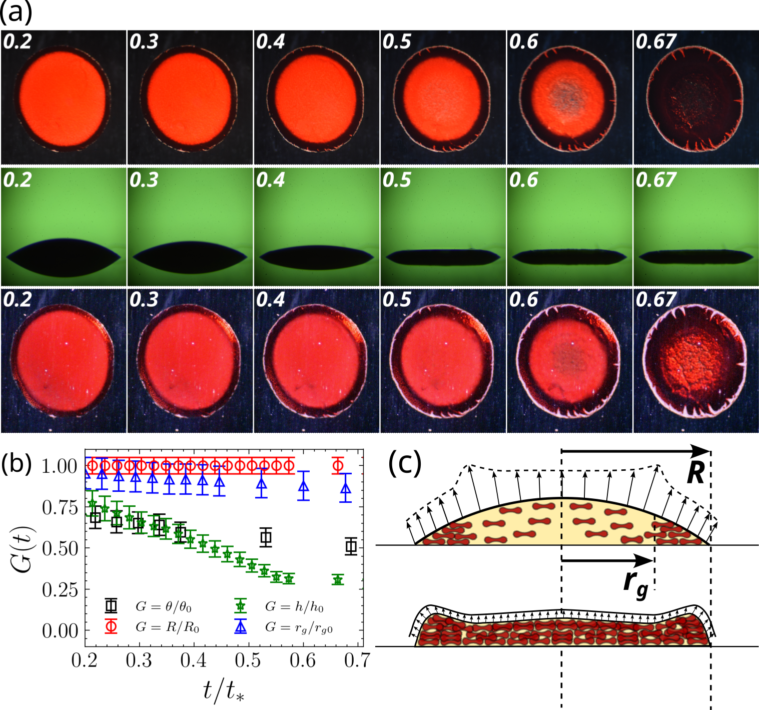
Phase B of the evaporation process spans from and has the longest duration. In this phase the gelation front propagates further inwards. As the droplet evaporates in CCR mode, the three phase contact line is pinned, but the droplet contact angle and its corresponding maximum height decreases monotonically. As the droplet evaporates, the outward capillary flow causes a depletion of RBCs in center allowing the droplet interface to smoothly change its curvature. Figure 5 shows a schematic representation of the various processes occuring during phase B of evaporation. Figure 5(a) shows a 3D schematic of the evaporation process in Phase B at . Figure 5(b) shows a magnified view of the droplet interface undergoing monotonic curvature () change from , to , to at , , and respectively. The corresponding side view images are also shown. Figure 5(c) represents the corresponding top and bottom view images. Figure 6(a) shows the top, side and bottom view image sequence during phase B of evaporation. The timestamps are normalized time (). Figure 6(b) shows the droplet non dimensional geometrical parameters evolution as a function of normalized time. Various parameters like normalized contact angle (), normalized height , normalized contact radius (), and normalized gelation radius () is plotted in black, green, red, and blue respectively. Figure 6(c) shows a schematic representation of the starting () and ending state () of phase B respectively. denotes the contact radius and denotes the gelation front radius. It is important to note the distinct color change in the top view at the end of phase B () signifying the completion of gelation of the entire droplet. At the end of phase B the entire droplet has undergone a sol-gel phase transition to a final wet gel form. The wet gel phase contains very small (trace) amounts of liquid water that evaporates in the next phase C. We can also observe from the side view image panel, that there is negligible change in droplet geometry signifying the completion of gelation for the entire droplet.
3.3.3 Phase C
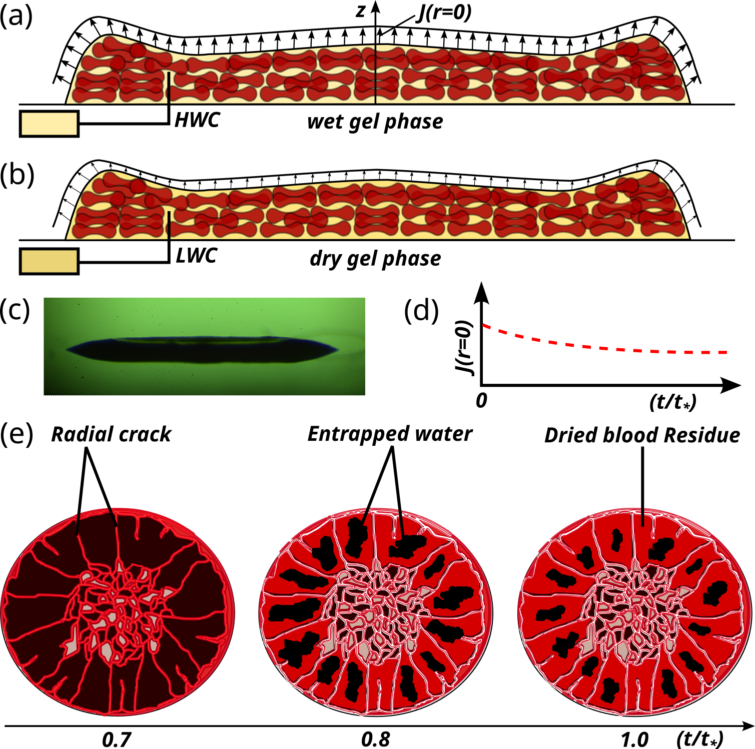
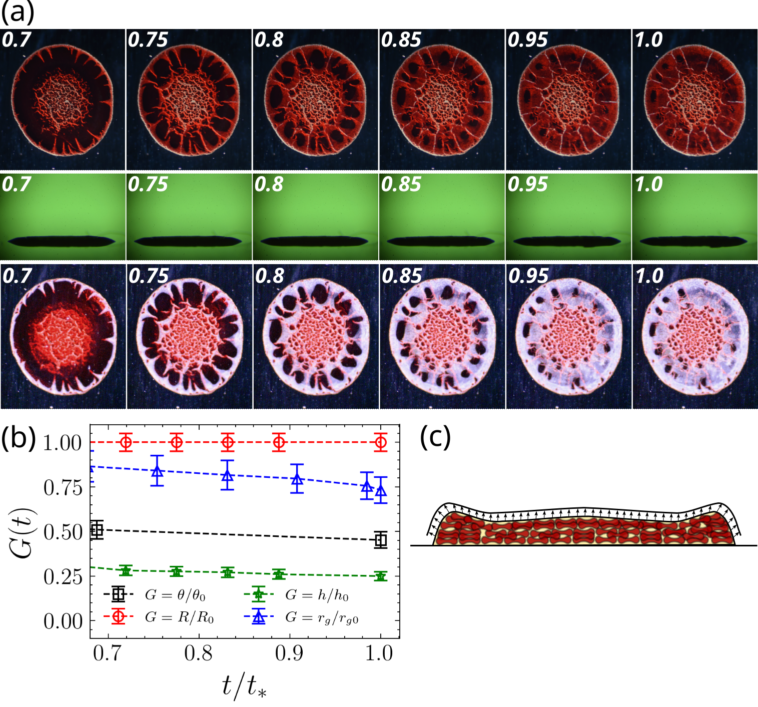
Figure 7 shows a schematic representation of phase C. Phase C is the final stage () of the evaporation process with very small evaporation rate. In this phase the wet gel from the previous phase goes further dessication and transforms to dry gel. Schematic of wet gel and dry gel state is shown in Figure 7(a) and 7(b) respectively. HWC denotes comparatively high water content in comparsion to low water content (LWC) in the dry gel state. Figure 7(c) shows a typical side view image during phase C of the evaporation process. Figure 7(d) depicts reduction in evaporation flux as the solute concentration increases further during the dessication process. Figure 7(e) shows a schematic of the top view of the evaporating drop in phase C () depicting the formation of radial cracks, shrinkage of trace amounts of water and dried blood residue. Figure 8(a) shows the image sequence of the top, side and bottom view of the dessicating drop respectively. Notice the distinct color change in top and bottom view as the drop transforms from wet gel to dry gel. From both the top and bottom view we can observe the evaporation process of the trace amounts of water present at the beginning of phase C. Dessication stresses are developed as the drop undergoes further evaporation leading to the formation of various types of cracks. Radial cracks are observed in the thicker outer rim region whereas mudflat types of cracks are observed in the center and the three phase contact line region. Figure 8(b) denotes the non dimensional geometric parameter evolution as a function of non dimensional time. Figure 8(c) denotes the schematic of the end of state of evaporation process in phase C.
3.4 Generalized Mechanics of Blood drop evaporation
The initial capillary flow initiated due to the non uniform evaporation flux over the drop surface can be modelled using Stokes flow in cylindrical coordinates (refer to figure 2(a)). We follow the analysis of Yuri et al. (Tarasevich et al., 2011) very closely for computing the dynamics of drop evaporation. From the radial component of the Stokes equation with thin film approximation (lubrication approximation) we have
| (1) |
From the axial component of the Stokes equation we have
| (2) |
where is the pressure, is the radial coordinate, is the drop viscosity, is the radial velocity, and is the axial coordinate. Assuming cylindrical symmetry about the vertical axis, the continuity equation can be written as
| (3) |
The boundary condition for pressure field on the drop surface is given by
| (4) |
where is the surface tension and is the curvature of the drop interface given by
| (5) |
Further, at the drop interface we have
| (6) |
owing to the fact that the radial velocity has negligible variation in the axial direction . The no slip and no penetration boundary condition at the surface of the substrate ensures
| (7) |
and
| (8) |
Using equation (3.3) - (3.8) the radial velocity can be written as
| (9) |
The component of fluid velocity is given by
| (10) |
The drop height average radial velocity is given as
| (11) |
Using the continuity equation for the conservation of mass of the volatile component (here solvent majorly is the water content of the blood drop), the average radial velocity from equation (3.11), the dynamical equation for the drop height is given as
| (12) |
where is the evaporation flux and is the density of the droplet. Similarly, using the continuity equation for the non-volatile component, i.e. solute (conservation of mass for the solute; here the major fraction of the ), the dynamics of the height averaged solute concentration is given as
| (13) |
For small drop size where gravity is negligible compared to surface tension effects, the drop shape can be approximated by a spherical cap model. However the spherical cap model leads to singularities in the evaporation flux and flow rate near the contact line. As a result, we replace the initial drop shape by a paraboloid of revolution without the loss of generality as a initial condition. The intial drop shape is therefore given by
| (14) |
where is the drop height at the edge that corresponds to the precursor plasma film.
| (15) |
The sum of and represents the central drop height thickness, i.e., at . Owing to the constant contact radius (CCR) mode of drop evaporation, the three phase contact line of the drop is pinned and hence the radial velocity vanishes. The radial velocity also goes to zero at due to vanishing curvature at the center. Therefore the boundary condition for the height average radial velocity to solve equation (3.12) and (3.13) simultaneously is given by
| (16) |
The symmetry condition for the drop height profile gives
| (17) |
Similarly, the symmetry condition for the height averaged solute concentration is given by
| (18) |
The initial height averaged solute concentration field is given by a known function of radial coordinate
| (19) |
We solve the equations for the drop height, solute concentration and evaporation flux in non-dimensional coordinate space. The drop height is normalized with respect to initial drop height as , i.e., . The radial coordinate is normalized with respect to drop contact radius , i.e., . The height average radial velocity is normalized with respect to the viscous velocity scale , i.e. . Here is the viscosity of the solvent. The time scale is normalized by a reference time scale , i.e., . The vapor flux is normalized by a reference flux , i.e., ; where is the thermal conductivity of the liquid, is the difference between substrate and the saturation temperature and is the latent heat of vaporization. The height averaged solute concentration was normalized by the gelation concentration , i.e, . Using the above normalized variables equation (3.12) and (3.13) can be non-dimensionalized and written as a vector equation with and expressed as a column vector
| (20) |
where
| (21) |
| (22) |
and
| (23) |
Here and represents the evaporation and capillary number respectively, where . The evaporative mass flux is modelled using techniques from heat transfer analysis and also assuming that the vapor density vanishes at the sol-gel propagating front; i.e., the evaporative flux goes to zero as the concentration reaches a critical value of () during sol-gel phase transition at the propagating front. The dimensionless evaporation flux is given as
| (24) |
where is a dimensionless non equilibrium parameter. The range of is such that for non-volatile liquids and for volatile liquids.
The system of differential equation for and given by equation (3.20) is computed using finite difference methods for various values of and corresponding to whole blood droplets used in our experiments. Whole blood drop of L drop volume with contact radius (), drop height () and contact angle () were used for the current experiments. The initial condition for the nondimensional concentration profile required to solve equation (3.20) is given by
| (25) |
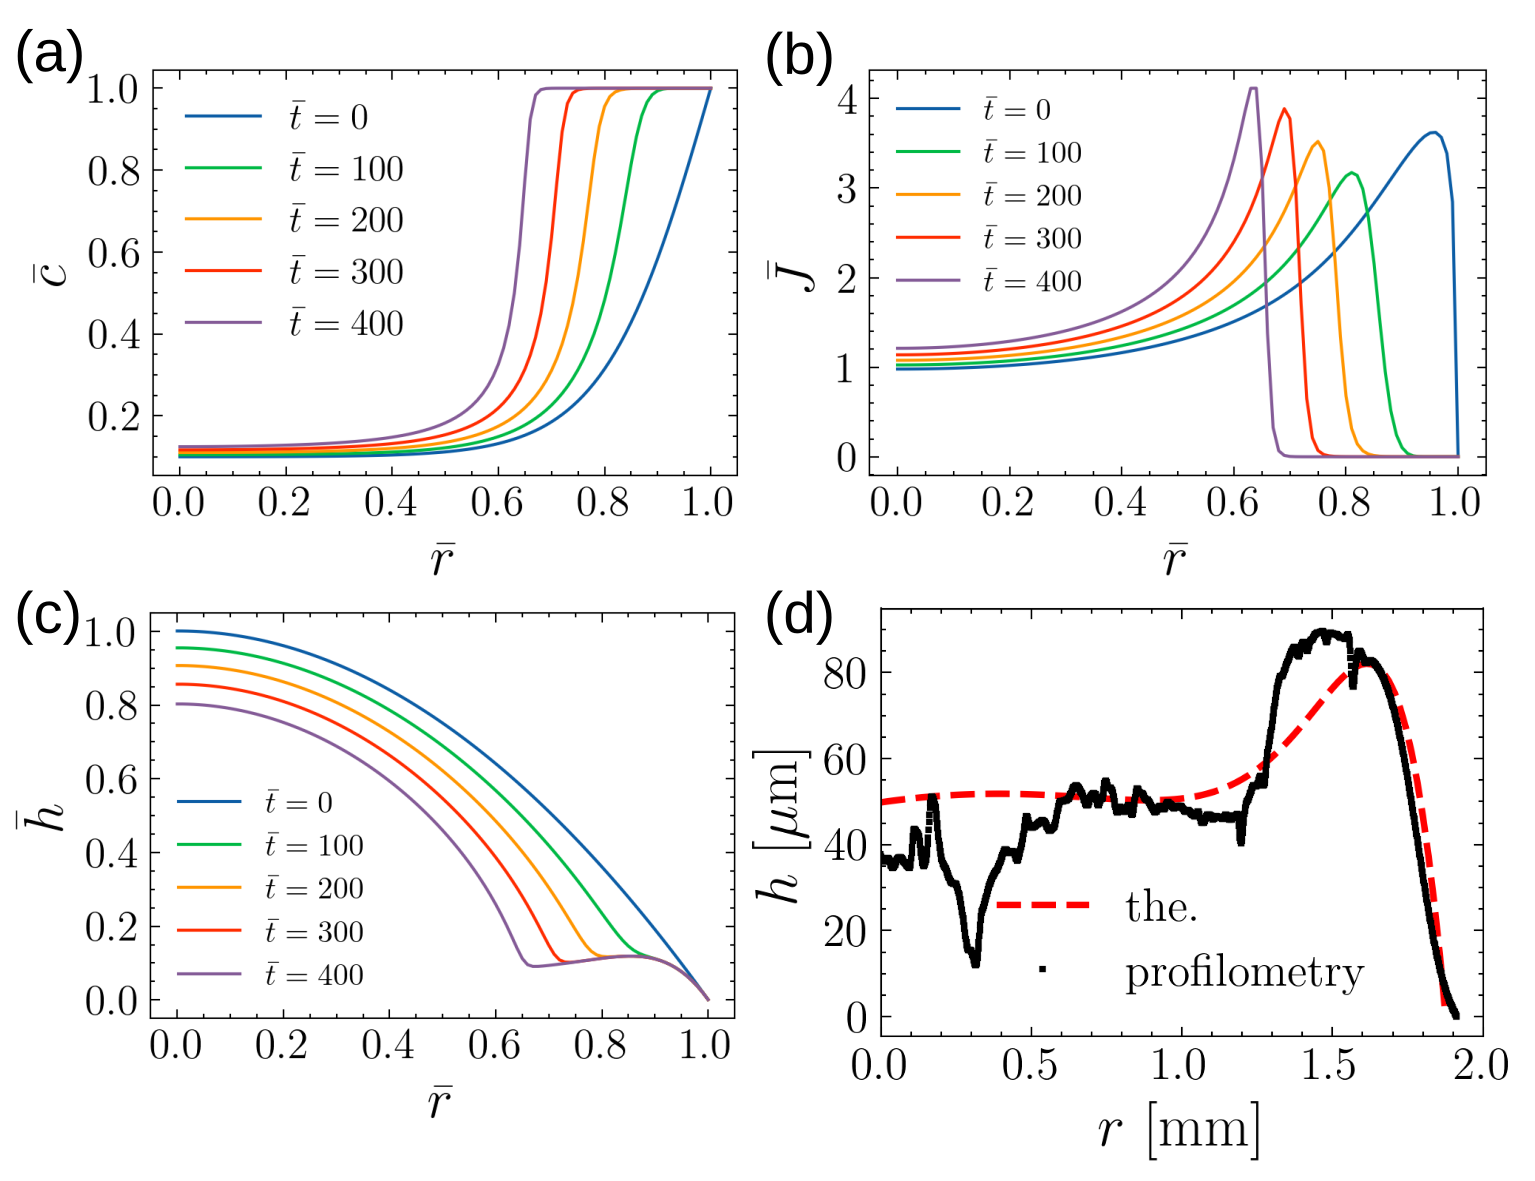
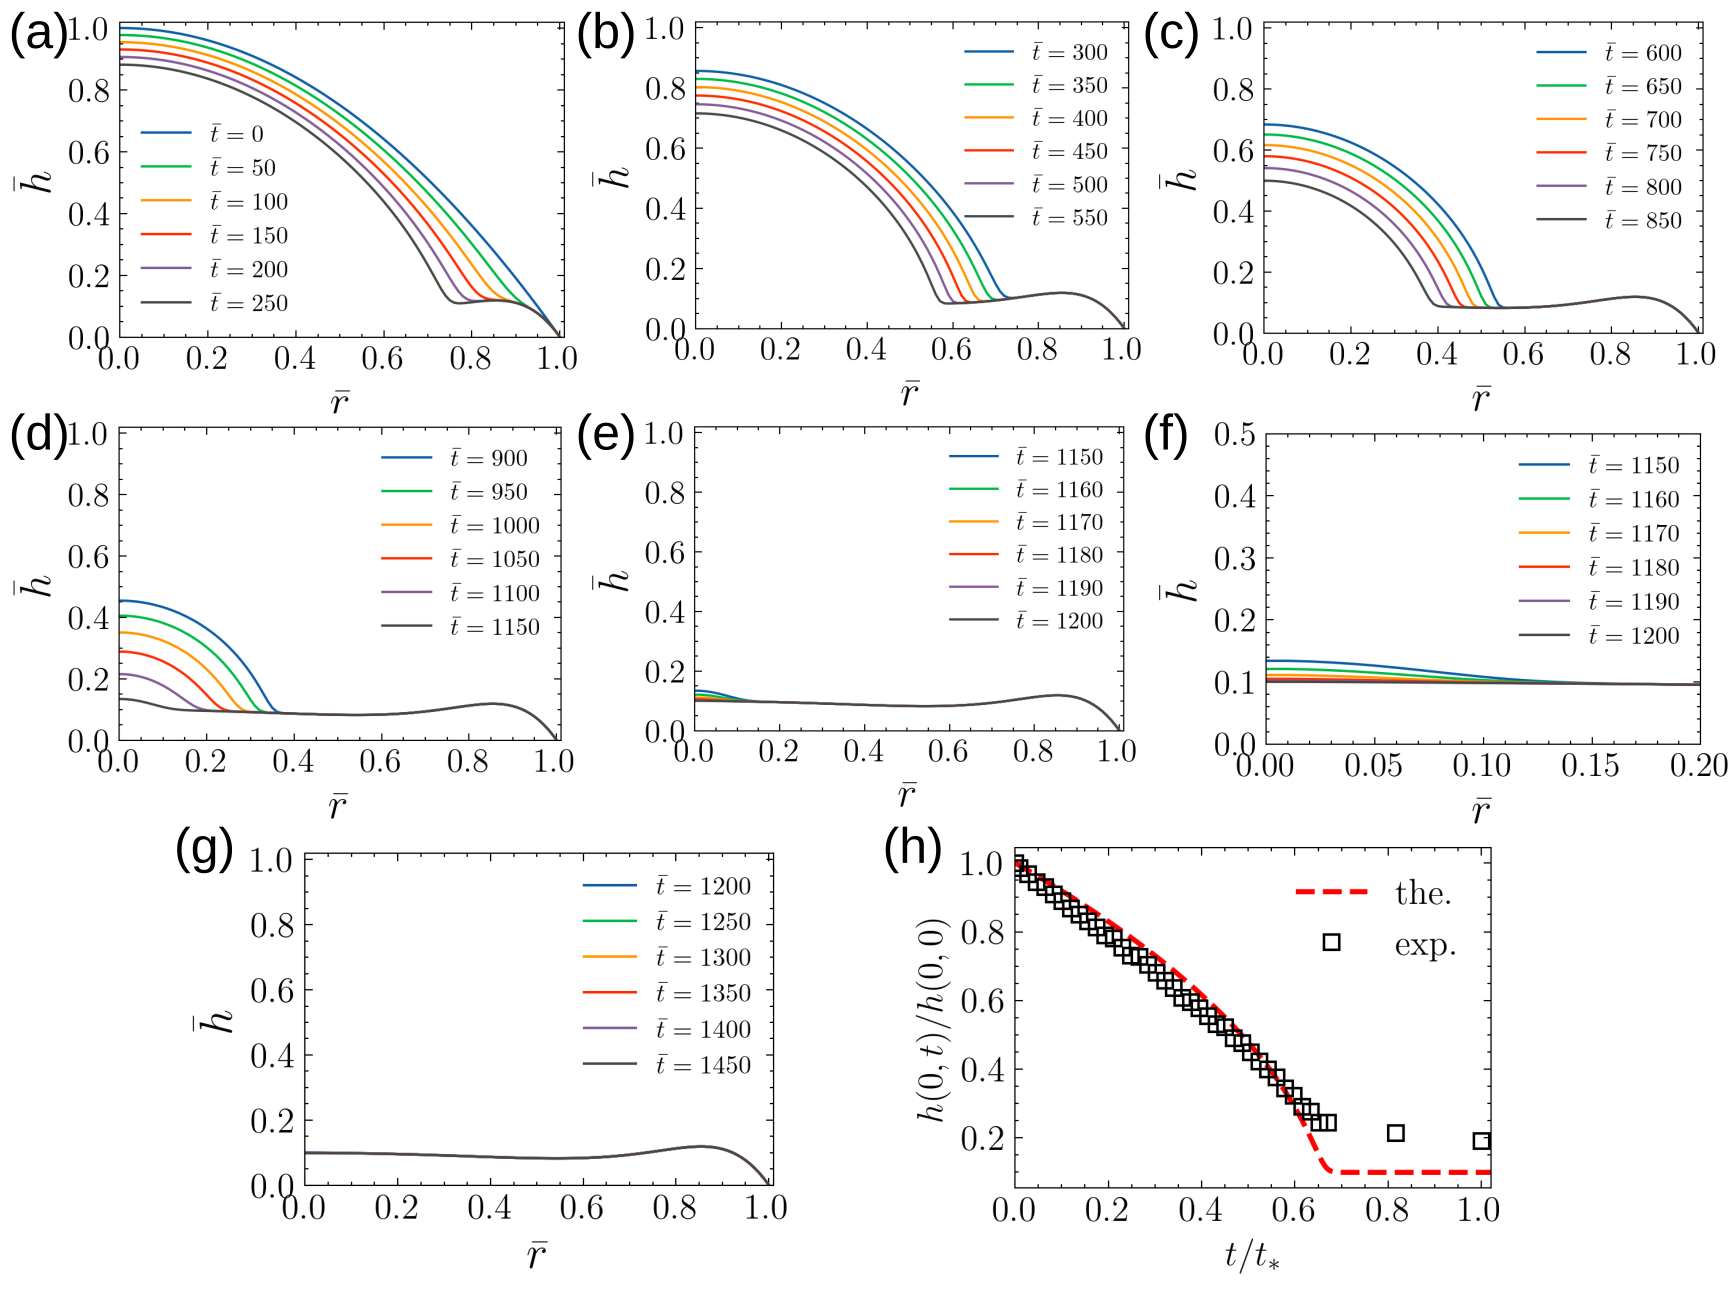
where is a measure of a characteristic length over which the concentration of colloidal particles increases rapidly. From the above distribution it is important to note that and suggesting the initial concentration at the edge of the droplet is equal to the gelation concentration. Figure 9(a) shows the non dimensional average concentration profile for various non dimensonal time instants . Figure 9(b) shows the evolution of the evaporation flux profile along the drop interface for various non dimensonal time instants . Figure 9(c) shows the non dimensional drop height profile as a function of non dimensional radial coordinate with non dimensional time as a parameter. Figure 9(d) compares the final dried residue droplet thickness profile with the steady state theoretical prediction. The theoretical height profile (red dotted line) conforms with the experimental curve obtained from profilometry (black). Figure 10(a)-(g) shows the non dimensional height profile variation as a function of non dimensional radial coordinate with non dimensional time as a parameter in the range . Figure 10(h) shows the droplet center height variation as a function of non dimensional time . The theoretical curve in red (labelled a the.) agrees with the experimental variation (black square).
.
.
3.5 Characterization of dried blood residues
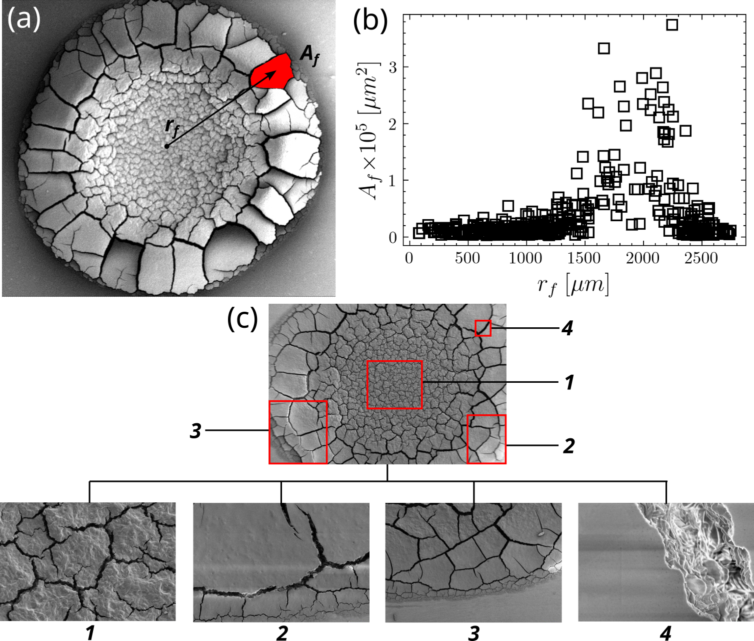
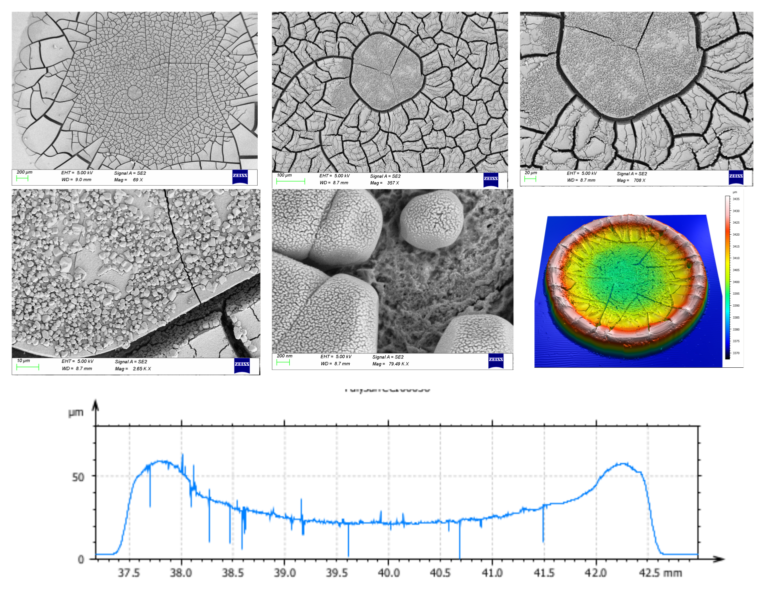
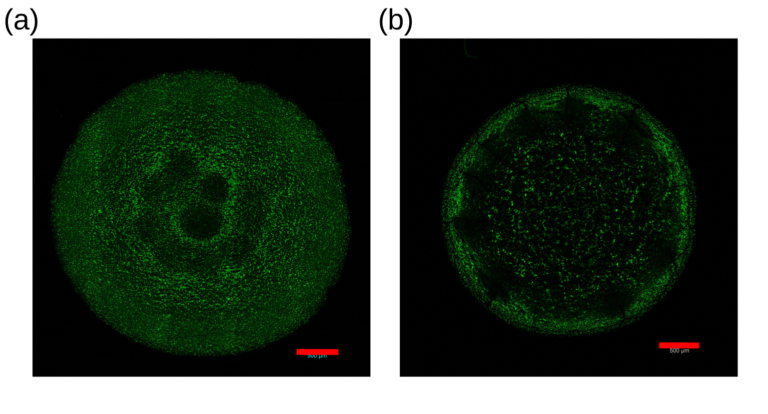
Figure 11 (a) shows the SEM (scanning electron microscope) image of the dried residue of whole blood drop. Various kinds of cracks are observed in general ranging from radial cracks at the thickest portion to mudflat type of cracks at the drop center and close to the droplet outer edge. The cracks are a result of dessication stress that forms during the phase transition from wet gel to dry gel. The cracks in general intersect each other either at right angles or . The various cracks distributes the dried residue into several flakes. Figure 11 (b) shows the radial size distribution of the flakes plotted as an area fraction ratio. Here denotes the area of a particular flake with a radial coordinate . denotes the area of the entire dried residue and denotes the drop contact radius. The flake size is highest between , i.e., in the rim region. The flake size is smaller in the drop center and the outer edge of the droplet. We observe that the crack thickness, flake size are therefore proportional to the thickness of the dried residue. Regions having higher thickness will have larger flake size in general. Figure 11(c) depicts the various kinds of cracks formed as a result of dessication stress while transforming from wet gel to dry gel in phase C of blood drop evaporation. Figure 12 depicts the micro/nano characterization for dried residue of pure plasma. We also observe that bacteria laden blood droplets do not show significant difference in terms of evaporation characteristics from pure whole blood droplets within the concentration range typically found in living organisms CFU/ml. This is due to the fact that the RBCs are approximately one order () bigger in length scale and hence approximately two order () bigger in terms of area ratio. At the maximum bacterial concentration of CFU/ml will give approximately similar number density as RBCs. However, owing to the area ratio, the bacteria will be uniformly distributed throughout the plasma protein matrix with highest fraction embedded and packed between the curvatures of the RBCs. For bacteria to have appreciable effects in the corresponding evaporation physics the packed cell volume has to be affected significantly by the presence of bacteria. This can only occur at significant higher bacterial concentration that can affect the PCV (packed cell volume) of the RBCs significantly. The distribution of bacteria in the dried blood residue can be seen from confocal microscopy and SEM of the dried residue as shown in Figure 13. Figure 13 (a), 13 (b) shows the bacterial deposition in the dried residue of blood plasma and whole blood droplet using confocal microscopy.
4 Conclusion
In conclusion, we study the mechanics of sessile whole blood drop evaporation using direct experimental visualization and theoretical methods like color image time sequence analysis, lubrication analysis and micro/nano characterization. We identified that blood drop evaporation in general can be subdivided into three phases (A,B,C) based on the evaporation rate. Phase A is the fastest and consists of the gelation of the three phase contact line due to the radial transport of RBCs due to the outward capillary flow. The gelation occurs due to sol-gel phase transition. Phase B consists of intermediate evaporation rate in which the gelation front moves radially inward. The radially inward gelation front propagation along with the droplet height reduction causes the phase transition of the entire droplet into wet gel state. The wet gel phase changes to a dry gel phase in Phase C of droplet evaporation. The evaporation flux reduces significantly as the partial pressure of water vapor is reduced significantly due to Raoult’s law. As the wet gel transitions to dry gel phase, the dried residue precipitate undergoes dessication stresses that leads to the formation of different kinds of cracks on the dried precipitate. The crack characteristics depends highly on the local thickness of the precipitate and hence a one to one map exists between precipitate thickness and the corresponding cracks that are formed. We also show that the presence of bacteria does not change the evaporation physics and the corresponding cracks
Declaration of Interests
The authors declare no conflict of interest.
References
- Adachi et al. (1995) Adachi, Eiki, Dimitrov, Antony S & Nagayama, Kuniaki 1995 Stripe patterns formed on a glass surface during droplet evaporation. Langmuir 11 (4), 1057–1060.
- Allain & Limat (1995) Allain, C & Limat, L 1995 Regular patterns of cracks formed by directional drying of a collodial suspension. Physical review letters 74 (15), 2981.
- Bahmani et al. (2017) Bahmani, Leila, Neysari, Mahdi & Maleki, Maniya 2017 The study of drying and pattern formation of whole human blood drops and the effect of thalassaemia and neonatal jaundice on the patterns. Colloids and Surfaces A: Physicochemical and Engineering Aspects 513, 66–75.
- Brutin et al. (2011) Brutin, David, Sobac, Benjamin, Loquet, Boris & Sampol, José 2011 Pattern formation in drying drops of blood. Journal of fluid mechanics 667, 85–95.
- Chen et al. (2016) Chen, Ruoyang, Zhang, Liyuan, Zang, Duyang & Shen, Wei 2016 Blood drop patterns: Formation and applications. Advances in colloid and interface science 231, 1–14.
- Choi et al. (2020) Choi, Junhee, Kim, Wonjung & Kim, Ho-Young 2020 Crack density in bloodstains. Soft Matter 16 (24), 5571–5576.
- Deegan et al. (1997) Deegan, Robert D, Bakajin, Olgica, Dupont, Todd F, Huber, Greb, Nagel, Sidney R & Witten, Thomas A 1997 Capillary flow as the cause of ring stains from dried liquid drops. Nature 389 (6653), 827–829.
- Deegan et al. (2000) Deegan, Robert D, Bakajin, Olgica, Dupont, Todd F, Huber, Greg, Nagel, Sidney R & Witten, Thomas A 2000 Contact line deposits in an evaporating drop. Physical review E 62 (1), 756.
- Denkov et al. (1992) Denkov, N, Velev, O, Kralchevski, P, Ivanov, I, Yoshimura, Hideyuki & Nagayama, Kuniaki 1992 Mechanism of formation of two-dimensional crystals from latex particles on substrates. Langmuir 8 (12), 3183–3190.
- Dufresne et al. (2003) Dufresne, Eric R, Corwin, Eric I, Greenblatt, NA, Ashmore, Jacqueline, Wang, DY, Dinsmore, Anthony D, Cheng, JX, Xie, XS, Hutchinson, John W & Weitz, David A 2003 Flow and fracture in drying nanoparticle suspensions. Physical review letters 91 (22), 224501.
- Esmonde-White et al. (2014) Esmonde-White, Karen A, Esmonde-White, Francis WL, Morris, Michael D & Roessler, Blake J 2014 Characterization of biofluids prepared by sessile drop formation. Analyst 139 (11), 2734–2741.
- Hoffbrand & Steensma (2019) Hoffbrand, Victor & Steensma, David P 2019 Hoffbrand’s essential haematology. John Wiley & Sons.
- Hu & Larson (2002) Hu, Hua & Larson, Ronald G 2002 Evaporation of a sessile droplet on a substrate. The Journal of Physical Chemistry B 106 (6), 1334–1344.
- Iqbal et al. (2020) Iqbal, R, Shen, Amy Q & Sen, AK 2020 Understanding of the role of dilution on evaporative deposition patterns of blood droplets over hydrophilic and hydrophobic substrates. Journal of Colloid and Interface Science 579, 541–550.
- Lanotte et al. (2017) Lanotte, Luca, Laux, Didier, Charlot, Benoît & Abkarian, Manouk 2017 Role of red cells and plasma composition on blood sessile droplet evaporation. Physical Review E 96 (5), 053114.
- Laux et al. (2016) Laux, D, Ferrandis, JY & Brutin, David 2016 Ultrasonic monitoring of droplets’ evaporation: Application to human whole blood. Ultrasonics Sonochemistry 32, 132–136.
- Mukhopadhyay et al. (2020) Mukhopadhyay, Manikuntala, Ray, Rudra, Ayushman, Manish, Sood, Pourush, Bhattacharyya, Maitreyee, Sarkar, Debasish & DasGupta, Sunando 2020 Interfacial energy driven distinctive pattern formation during the drying of blood droplets. Journal of Colloid and Interface Science 573, 307–316.
- Nguyen & Stebe (2002) Nguyen, Van X & Stebe, Kathleen J 2002 Patterning of small particles by a surfactant-enhanced marangoni-bénard instability. Physical Review Letters 88 (16), 164501.
- Shatokhina et al. (2004) Shatokhina, SN, Shabalin, VN, Buzoverya, ME, Punin, VT & others 2004 Bio-liquid morphological analysis. The Scientific World Journal 4, 657–661.
- Smalyukh et al. (2006) Smalyukh, Ivan I, Zribi, Olena V, Butler, John C, Lavrentovich, Oleg D & Wong, Gerard CL 2006 Structure and dynamics of liquid crystalline pattern formation in drying droplets of dna. Physical review letters 96 (17), 177801.
- Sobac & Brutin (2011) Sobac, Benjamin & Brutin, David 2011 Structural and evaporative evolutions in desiccating sessile drops of blood. Physical Review E 84 (1), 011603.
- Tarasevich et al. (2011) Tarasevich, Yuri Yu, Vodolazskaya, Irina V & Isakova, Olga P 2011 Desiccating colloidal sessile drop: dynamics of shape and concentration. Colloid and Polymer Science 289, 1015–1023.
- Traipe-Castro et al. (2014) Traipe-Castro, Leonidas, Salinas-Toro, Daniela, López, Daniela, Zanolli, Mario, Srur, Miguel, Valenzuela, Felipe, Cáceres, Aníbal, Toledo-Araya, Héctor & López-Solís, Remigio 2014 Dynamics of tear fluid desiccation on a glass surface: a contribution to tear quality assessment. Biological Research 47, 1–10.
- Wilking et al. (2013) Wilking, James N, Zaburdaev, Vasily, De Volder, Michael, Losick, Richard, Brenner, Michael P & Weitz, David A 2013 Liquid transport facilitated by channels in bacillus subtilis biofilms. Proceedings of the National Academy of Sciences 110 (3), 848–852.
- Wilson et al. (2013) Wilson, Andrew S, Brown, Emma L, Villa, Chiara, Lynnerup, Niels, Healey, Andrew, Ceruti, Maria Constanza, Reinhard, Johan, Previgliano, Carlos H, Araoz, Facundo Arias, Gonzalez Diez, Josefina & others 2013 Archaeological, radiological, and biological evidence offer insight into inca child sacrifice. Proceedings of the National Academy of Sciences 110 (33), 13322–13327.
- Yakhno et al. (2005) Yakhno, Tatiana A, Sanin, Anatoly G, Yakhno, Vladimir G, Pelyushenko, Artem S, Dowell, Michael B, Vacca, Christina & Goutorova, Valentina A 2005 Drying drops of biological liquids: dynamics of the optical and mechanical properties. application in rapid medical diagnostics. In Advanced Biomedical and Clinical Diagnostic Systems III, , vol. 5692, pp. 188–198. SPIE.