[table]capposition=top \UseRawInputEncoding
Development of a cylindrical mirror analyzer electron spectrometer and associated data acquisition system to study inner shell electron emission following ion-atom collision
Abstract
In this paper we report on the development and performance of a cylindrical mirror analyser electron spectrometer for ion atom collision experiments. A low cost data acquisition system using Arduino microcontroller has also been developed and tested. We have measured the Auger emission spectra for various gaseous targets in collision with 1 MeV proton beams. Relative total Auger emission cross sections have also been measured for N2 molecular target as a function of proton energy.
I Introduction
Electron Spectroscopy involves the study of the energy and angular emission pattern of secondary electrons emitted from atoms, molecules, clusters and solid surfaces upon excitation via charged particles (electrons or heavy ions) and photons. In ion-atom collision, the nature of Coulomb interactions manifests in various ionization processes such as soft electron emission, binary encounter and Auger electron emission etc. Study of these process is useful in atomic and molecular physics, material science, space research, and plasma diagnostics etc. In the last couple of decades, there has been an increase in interest in probing state-selective atomic and molecular phenomena such as Inter-atomic/Intra-molecular Coulombic decay (ICD) and molecular ion dissociation dynamics Murphy1988 using kinematically complete ion-electron yield measurements JUllrich_1997 . To study these processes, an electron energy analyzer is usually combined with a recoil ion momentum spectrometerJUllrich_1997 ; Albert2005i ; Saha2013 .Various designs for an electron spectrometer, for example, hemispherical analyzer, parallel plate analyzer, cylindrical analyzer, magnetic bottle electron spectrometer etc are routinely employed in electron spectroscopy investigations.
Here we present the development of a new electron spectrometer, based on a cylindrical mirror analyzer, for measuring secondary electron emission from gaseous targets induced by fast ion impact. A cylindrical mirror electron analyzer (CMA) has a simple design, excellent sensitivity, and low signal-to-noise ratio. The set-up consists of an ultra high vacuum compatible cylindrical mirror analyzer (CMA), designed and assembled at the 1.7 MV Tandetron accelerator laboratory at IIT Kanpur, to measure electron yields as a function of electron energy for fast ions interacting with atoms/molecules. In the following sections we will discuss the design parameters, simulation and performance of the CMA in detail.
In addition to the CMA, we will also dicuss the implementation of an automated data acquisition and control system, based on Arduino Uno microcontroller.
II Experimental set-up and CMA design
Performance characterization of the CMA was carried out by studying proton collision induced Auger electron emission for various atomic and molecular targets. The experiments were conducted at the 20o beam line of 1.7 MV tandetron accelerator facility HVEE at IIT Kanpur. Intitally a beam of H- ions, produced using a duoplasmatron source, is accelerated to a potential of 10 kV - 15 kV. this beam is mass analyzed using a 90o magnet before entering the tandem accelerator. In the tandem accelerator the H- beam gets accelerated to the terminal potential ( kV MV), where it collides with high pressure nitrogen gas. The collision process strips the H- ions of the electrons, leading to creation of H+ beam which is further accelerated by the same potential in the outgoing channel. In general, for the tandem accelerator, the final energy of the ion beam is given as , where is the ion charge state and is the terminal voltage. The positive ion (proton) beam is further focused using an electrostatic quadrupole triplet and directed toward the 20o beam line using a switching magnet. The 20o beam line is equipped with a set of steering plates for alignment of the ion beam. In addition, the exit end of the beam line is slightly off centered from the beam line and a set of deflector plates are used to deflect the ion beam, thereby filtering out the neutrals in the main ion beam created during its passage though the beam line. The filtered projectile ion beam is collimated to a size of 22 mm2 using a pair of four jaw slits before entering the main scattering chamber. A differential pumping chamber is connected between the four jaw slits to maintain high background vacuum ( mbar) in the main scattering chamber. The CMA is mounted in the scattering chamber with its symmetry axis orthogonal to both, the ion beam and target gas jet as shown in fig 1.
II.1 Cylindrical mirror analyser
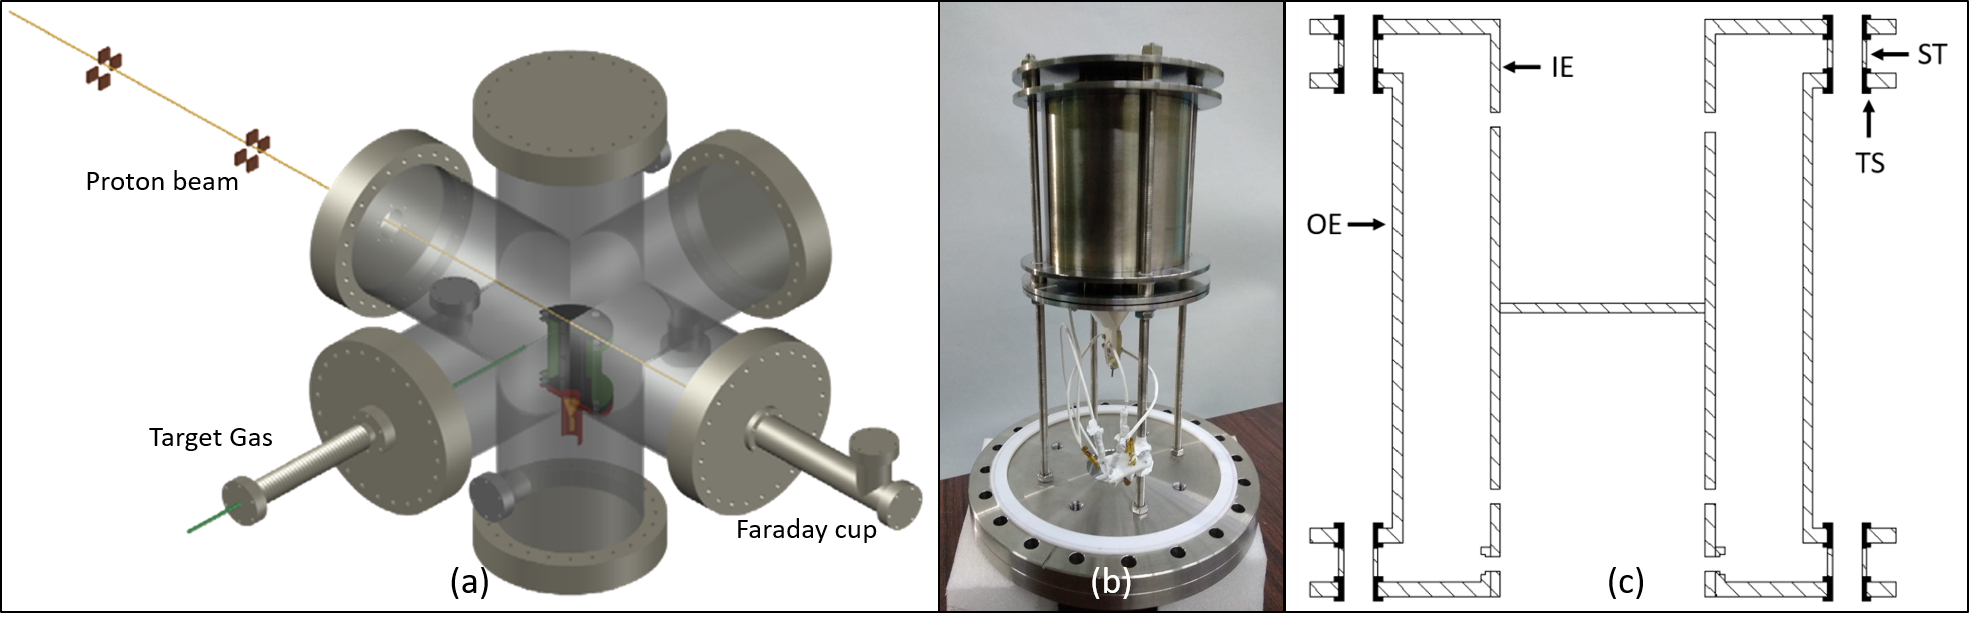
The Cylindrical mirror analyzer (CMA) (see fig 1) consists of two coaxial cylindrical shells made of non-magnetic stainless steel. A conical electron stopper is also connected to the inner cylinder to improve the energy resolution (discussed later). CMAs are widely used as electron energy analyzers and their ideal design parameters are well known. Electrons emitted from the interaction zone, located on the axis of the CMA enter through a slit on the inner cylinder electrode, traverse the electric field region between the inner and outer cylinder and exit through another slit on the inner cylinder. The strength of electric field and distance between the two slits determine the pass energy of the electrons. The optimum location of the electron source (interaction region) on the axis is such that it subtends an entrance angle of 42.3o with respect to the axis of the cylinder Sar‐El1971 . However, due to geometrical constraints, the interaction zone in the present setup is located 30.5 mm away from first slit of the inner electrode. The entrance angle of the electrons, therefore, is 35.5o in our setup. The design parameters of the CMA have been chosen such that it can be coupled later with a recoil ion momentum spectrometer setup Duley2022 for performing combined recoil ion - electron spectroscopy following molecular fragmentation. Using the geometrical parameters of the CMA and classical trajectory calculation for motion of a charged particle in cylindrical capacitor field Moore2009 , we can obtain the value of electrostatic potential on the outer electrode for transmission of electrons with energy (in eV) as:
| (1) |
or,
| (2) |
Here, and are the radii of inner and outer cylinders, respectively, is the distance between the two slits and is the entrance angle.
In order to keep the interaction zone free of any electric field, the inner electrode was kept at ground potential. the outer surfaces of the inner electrode and electron stopper as well as the inner surface of the outer electrode were coated with carbon soot from an ethylene welding torch. the carbon soot coating helps in suppressing the emission of secondary electrons within the CMA due to collision of high energy electrons with the walls of the electrodes. A channel electron multiplier (CEM) detector is placed 24 mm away from the exit slit of inner cylinder (on the axis of CMA) to detect the electrons.
II.2 SIMION Simulation
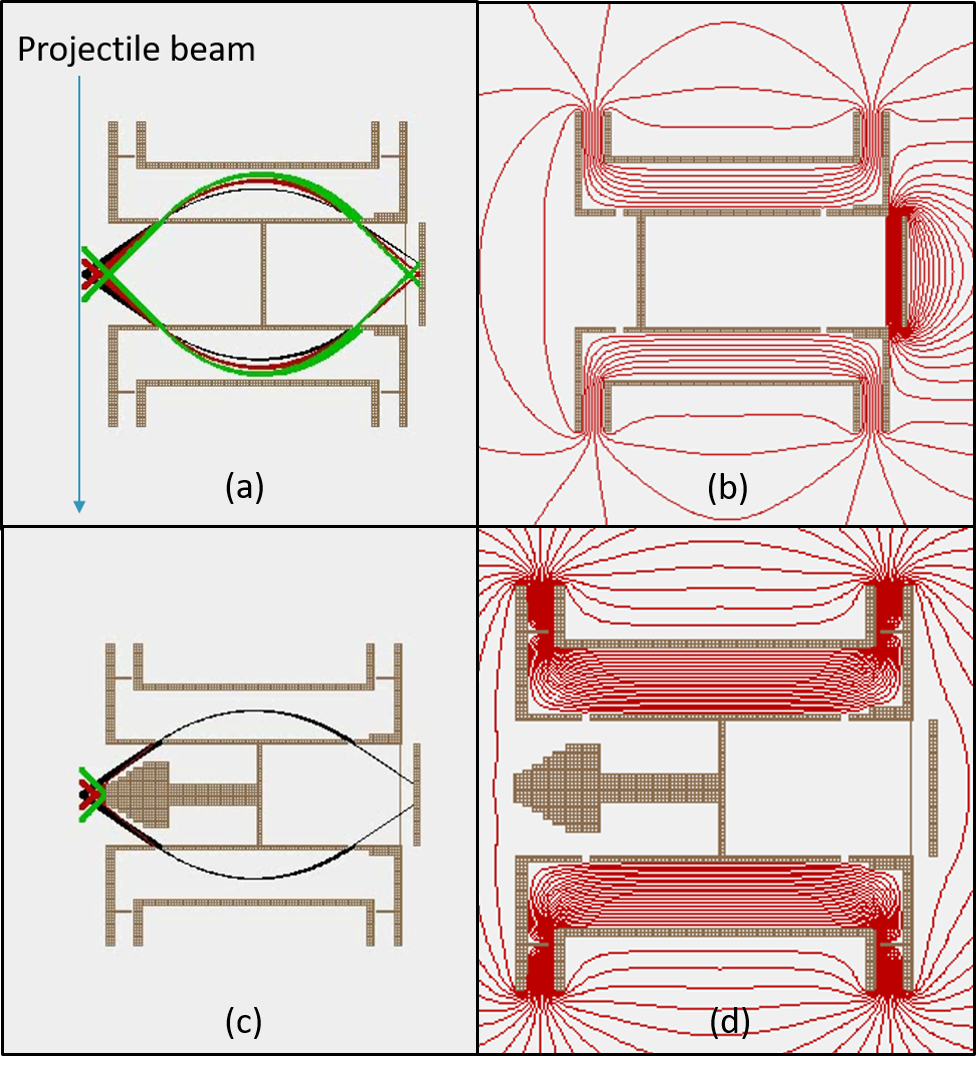
The design of the CMA was optimized by performing particle trajectory simulations using SIMION 8.0 simion . For electron trajectory simulation, the inner electrode was kept at ground potential and a negative potential was applied to the outer electrode. The interaction zone, kept 30.5 mm away from the entrance slit, was simulated as a spherical region of 2 mm radius. Thousands of electrons were generated in this region with a kinetic energy distribution . The particle velocities (direction) were constrained within an emission cone with half angle , where is the geometric acceptance angle of the CMA. This approach aimed to streamline the simulation process and reduce computation time.
In fig 2 we have shown representative electron trajectories though the CMA. In the first design iteration (see fig 2 (a) and (b)) it was observed that for an extended interaction zone, electrons of kinetic energies different from the pass energy of the CMA are also able to transmit though the CMA. this results in very poor energy resolution of the CMA. In the laboratory experiments, the interaction zone is defined as the overlap between the projectile ion beam and the effusive target gas jet, which may extend beyond 2 mm. The background gas density in the scattering chamber would also contribute as extended interaction zone along the path of the projectile ion beam. This poses a major challenge in achieving desired energy resolution of the analyzer. To alleviate this, we modified the design of the CMA by introducing a conical electron stopper (see fig 2 (c and d)). the electron stopper was kept at the same potential as the inner electrode. As evident from the simulated trajectories (see fig 2 c) the electron stopper creates a narrow annular region for electrons to enter the CMA, thereby restricting the acceptance of electrons emitted in a limited interaction volume on the axis of the spectrometer. Introduction of the electron stopper results in improved energy resolution of the CMA and from the simulated trajectories, we obtained the energy resolution of the CMA .
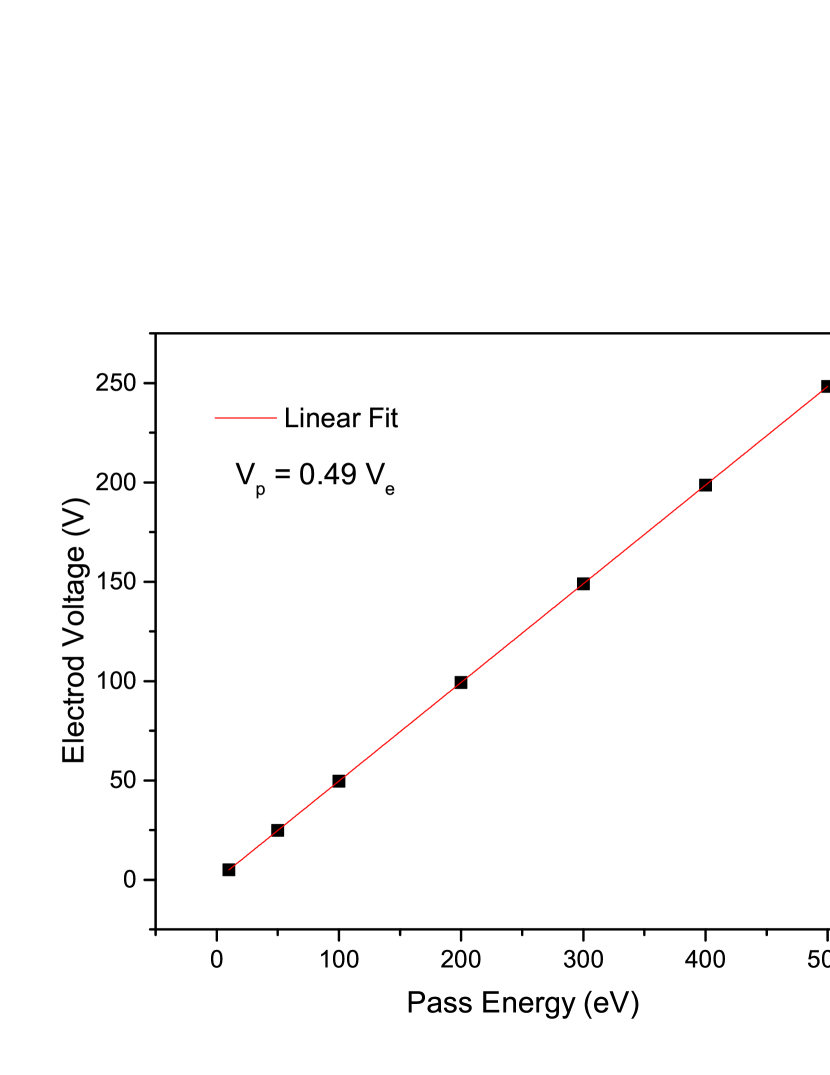
In fig 3 we have plotted the voltage on the outer electrode vs the electron kinetic energy. The voltage varies linearly with the electron kinetic energy, as expected from equation 1 above. A linear fit to the simulated data in fig 3, gives a slope of 0.49, which agrees well with equation 2 for the present CMA geometry.
II.3 Data acquisition system
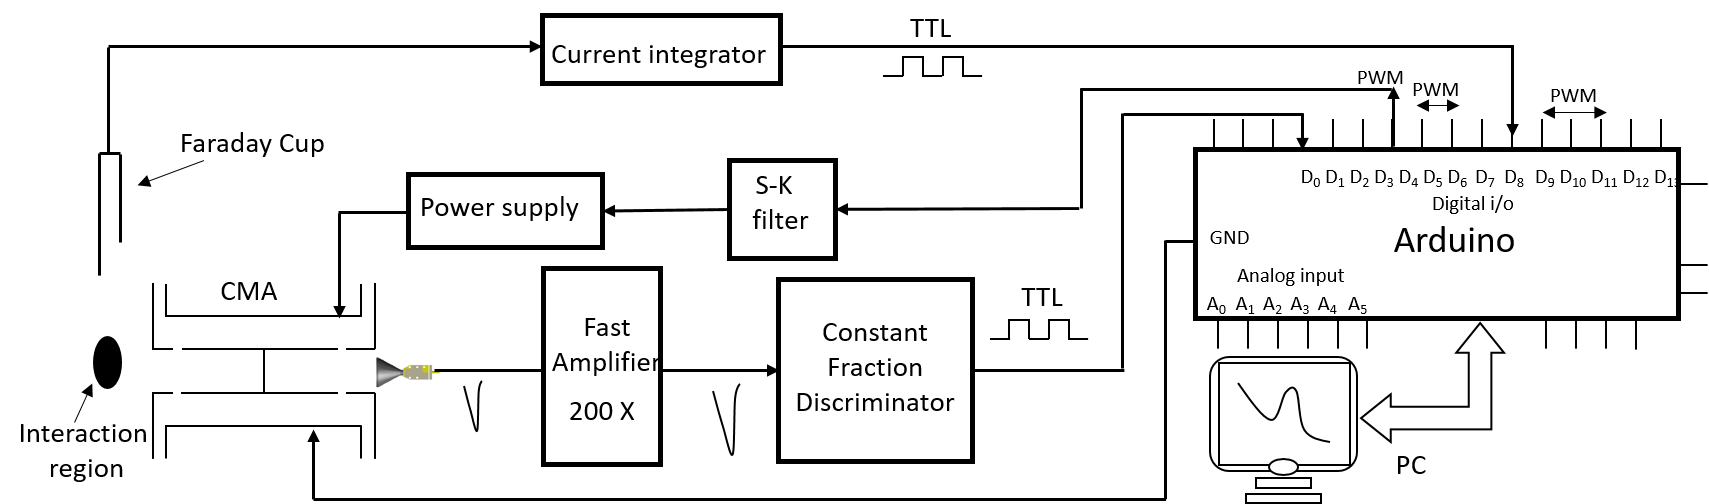
A schematic diagram of the data acquisition system is shown in figure 4. During the experiment, the outer electrode of the CMA is floated at the desired voltage using an externally controlled ortec power supply (). Electrons passing through both slits of the CMA are detected by the CEM detector, which generates a pulse of 10 mV ( 20 ns) for each incident electron. The CEM is operated in saturation mode for maximum detection efficiency. The output signal of the CEM is amplified using a fast amplifier (Ortec ) and fed to a constant fraction discriminator (CFD). The CFD generates a corresponding TTL output which is stored in the PC after digitization. The projectile ion beam current falling on the Faraday cup is measured using a charge integrator module (ortec). The charge integrator also generates TTL pulses which are recorded in the PC after digitization. In order to record the electron spectrum over a given energy range, automatically, the data acquisition system is required to handle three signals. i) Generate an analog control signal for the dc power supply connected to the outer electrode of the CMA, ii) digitize and record the TTL signal corresponding to the CEM detector output and iii) record the TTL output from the charge integrator module. A low cost data acquisition system was designed in-house, to automate the process using off-the-shelf Arduino microcontroller Arduino and Raspberry Pi RaspberryPi personal computer.
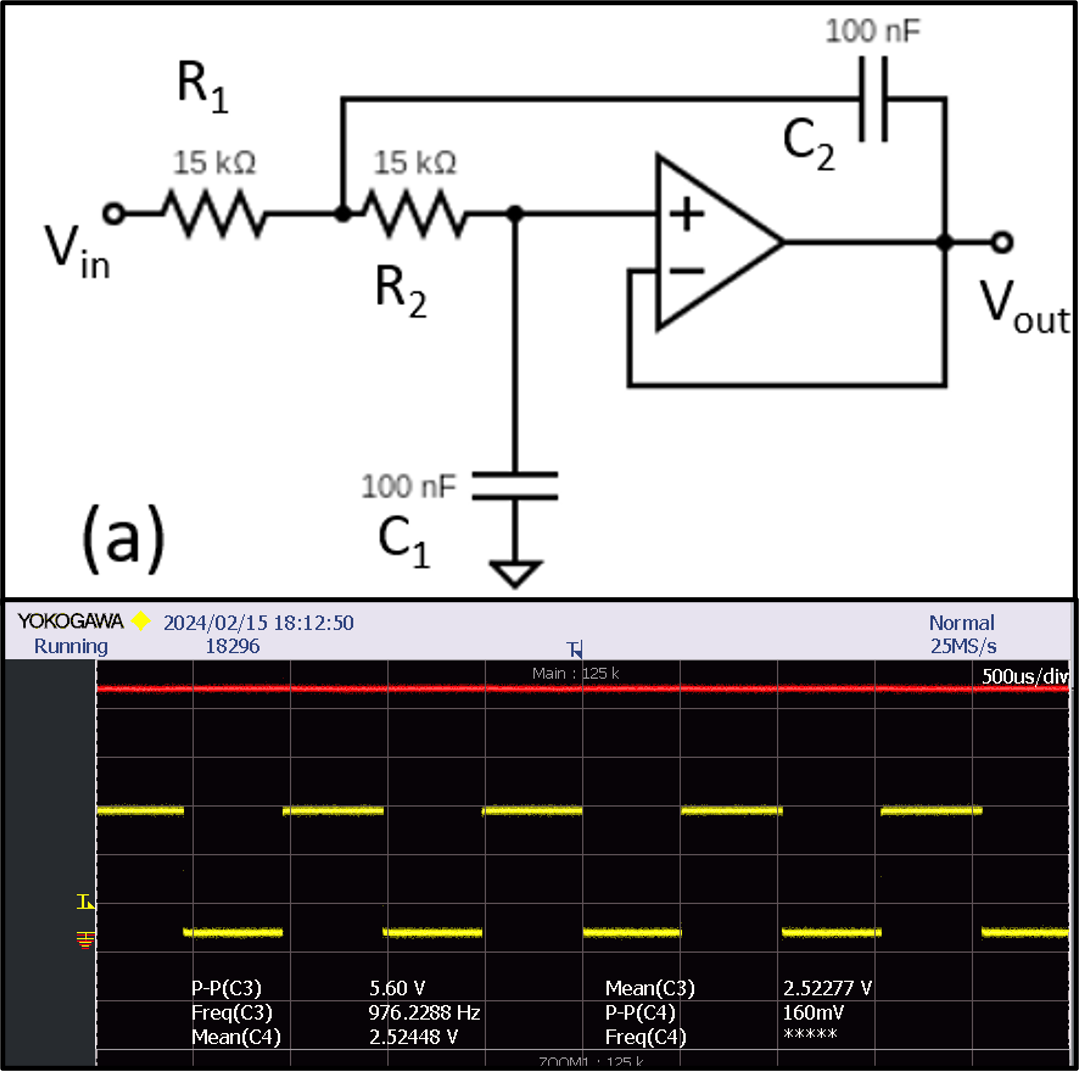
The Arduino microcontroller is a versatile open-source platform designed for electronics projects. It features analog and digital input/output pins, enabling it to interface with sensors, collect data, and communicate with other devices. The programming interface for Arduino Uno is highly user-friendly extensive community support makes it a popular choice for creating customized data acquisition setups. Arduino Uno microcontroller has a digital i/o pins which can be used to record the TTL signals. It also has a 12 bit digital-to-analog converter and analog output pins which generate a corresponding PWM output. The analog remote signal for controlling the outer electrode power supply was generated using the PWM output of the Arduino Uno (Pin 12). The PWM (pulse width modulated) output is a 5 V square wave signal with varying duty cycle, corresponding to each analog value. We designed a second order Sallen-Key low-pass filter Sallen1955 convert the PWM output into a true analog dc signal. This signal is then used to control the ortec power supply connected to the outer electrode of the CMA. The Schematic circuit of the Sallen-Key filter is shown in figure 5a. This circuit incorporate a basic IC 741. The second order nature of the filter ensures a more gradual roll-off of high-frequency components, resulting in a stable and continuous output. The PWM output (50 duty cycle) from Arduino and filtered dc output are shown in figure 5b. The measurements were performed with a 1 GHz Oscilloscope (Yokogawa model no. ). The transfer function H(s) and cutoff frequency of the filter is given as,
| (3) |
| (4) |
where and is attenuation constant.
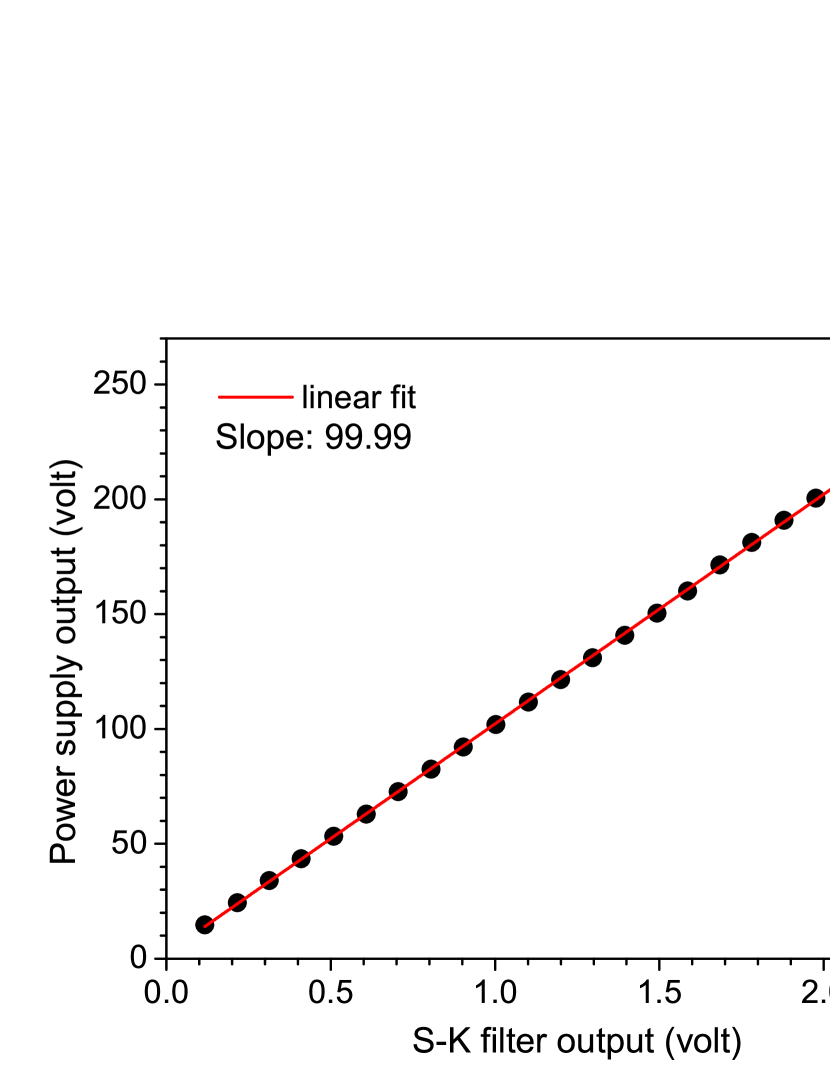
To further verify the dc characteristics of the Sallen-Key output, we measured the output of the outer electrode power supply for a range of control signal amplitudes. The plot in figure 6 shows a perfectly linear response of the power supply controlled using the frequency filtered PWM output of the Arduino microcontroller.
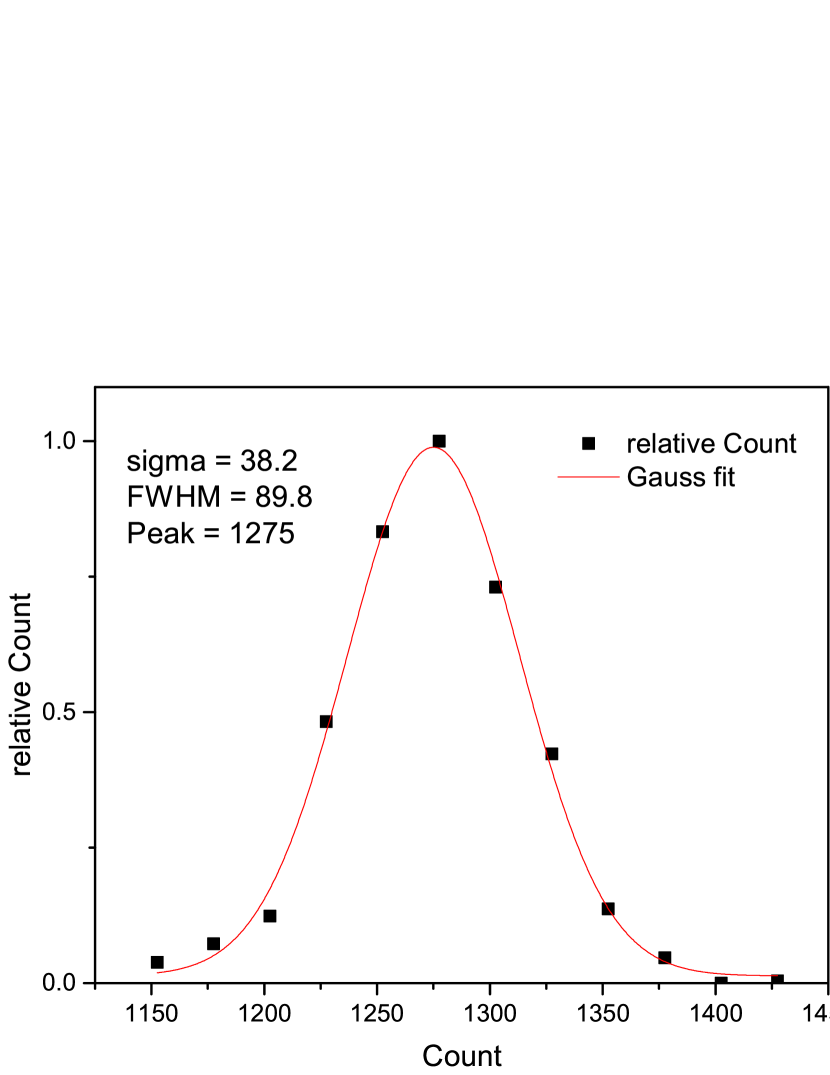
As discussed above, digital i/o pins of Arduino microcontroller were employed to record the TTL pulse outputs from the CFD and Charge integrator. Typical count rate from the CEM detector (and CFD) during the experiments was kept below 1 kHz. The projectile beam current was also 50 nA. This results in TTL output frequency of 500 Hz from the charge integrator. The clock frequency of Arduino Uno microcontroller is 16 MHz, which is high enough for faithful recording of these data at the digital i/o pins. Nevertheless, an experimental validation is useful for assigning confidence in the measured electron energy spectrum. A characteristic feature of ion-atom collision process is the probabilistic nature of electron emission. Therefore, the measured electron count, N, at a fixed energy (CMA voltage) follows Poisson distribution and over multiple measurements the number N has an uncertainty of , under otherwise identical experimental conditions. We have measured this distribution for various pass energies of the CMA. For the measurement, the outer electrode potential was kept at a fixed voltage, and electron count data (the CFD output) was recorded multiple times for a fixed number of pulses received from the charge integrator module. In figure 7, we have shown one such measured histogram for electrode voltage = -50 V. The histogram is fitted well with a Gaussian distribution and the standard deviation () is comparable to , where N is the peak of the Gaussian distribution.
The process of control signal generation as well as simultaneous recording and storage of the CEM detector and charge integrator outputs was automated using a custom written Python python script. To facilitate real-time data communication between the experimental setup and the PC, the pyserial 3.5 pyserial library is employed. The Arduino board was programmed to send the necessary information through the serial port, accessible to the PC through the Python script. The Arduino script continuously sends the relevant data, such as electron detection events from the CFD and the beam current from the charge integrator, through the serial port. The Python script utilizes Matplotlib module in Python to create online electron energy spectrum, therefore enabling visualization of the experimental data in real-time.
II.4 CMA energy resolution
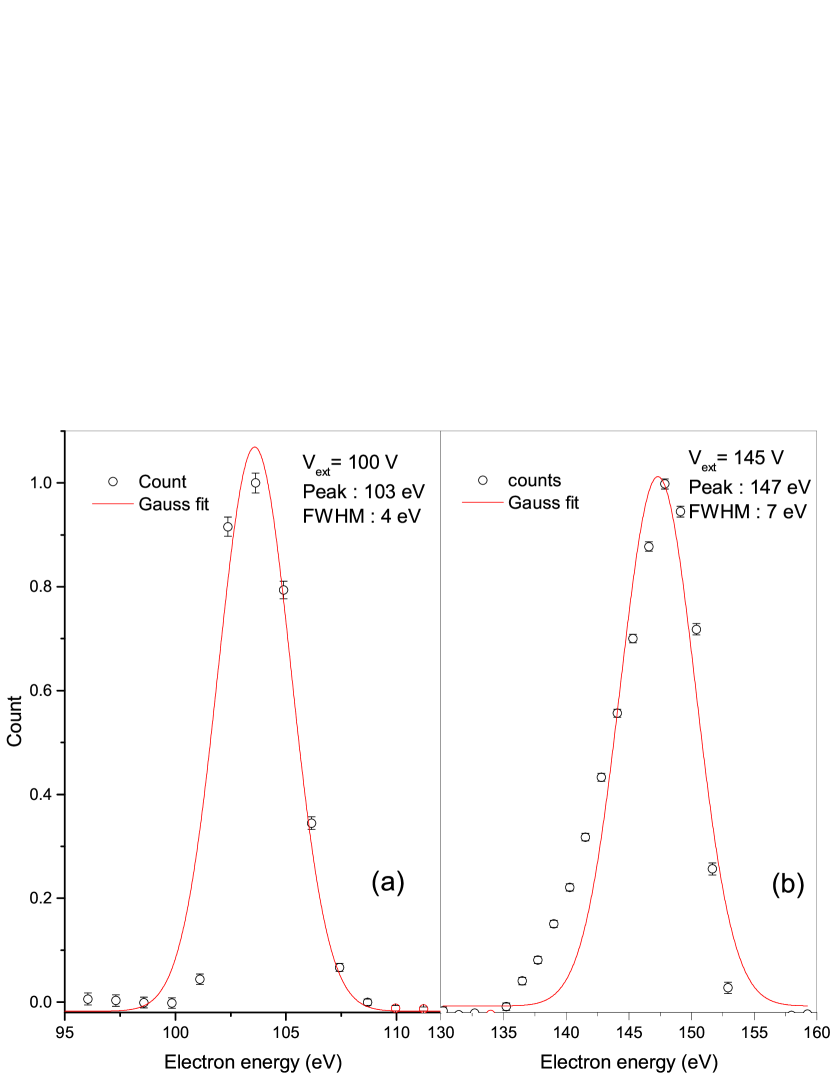
For estimating the resolution of the CMA, we used a diverging beam electron gun in a separate experiment. The electron gun was placed along the axis of the CMA and electron spectra were measured for several energies of the emitted electrons. The emitted electron energy had a spread of . The energy resolution of a CMA spectrometer is given as:
| (5) |
where is the slit width and is the distance between the slits.
The measured electron energy spectra are sown in figure 8 for two electron energies, 100 eV and 145 eV. Using a Gaussian fit to the measured electron spectrum, we have estimated the energy resolution of the CMA . A similar resolution was estimated from SIMION simulation.
III Calibration and measurements
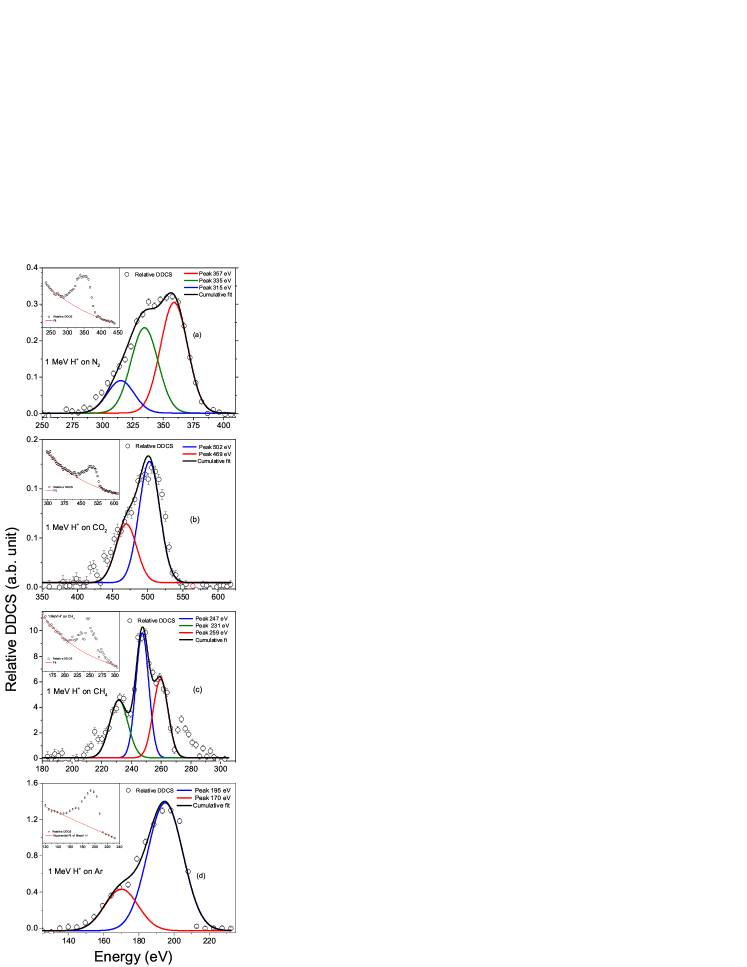
For calibration of the CMA electron spectrometer we measured the Auger spectra for various atomic and molecular targets in collision with 1 MeV proton beam. In figure 10 we have shown the electron spectra corresponding to K-LL Auger emission from CH4, N2, CO2 molecules and L-MM Auger emission from Ar atoms. In each spectrum, the electron counts have been normalized with respect to the projectile beam intensity and target gas pressure. The spectrum represents relative differential cross section for electron emission. Geometry of CMA restricts collection of electrons in a narrow range of angle with respect to the projectile ion direction, however, there is near complete () collection in the azimuthal plane (normal to the spectrometer axis). Therefore, the relative differential cross section is given as:
| (6) |
where, is the number of target electrons (with gas) detected at energy , is the number of background electrons (without gas), is the emitted electron energy, is the number of projectile ions and P is the target gas pressure. An ionization gauge was used to measure the gas pressure and hence absolute number density of target gas molecules/atoms could not be measured in the present experiments.
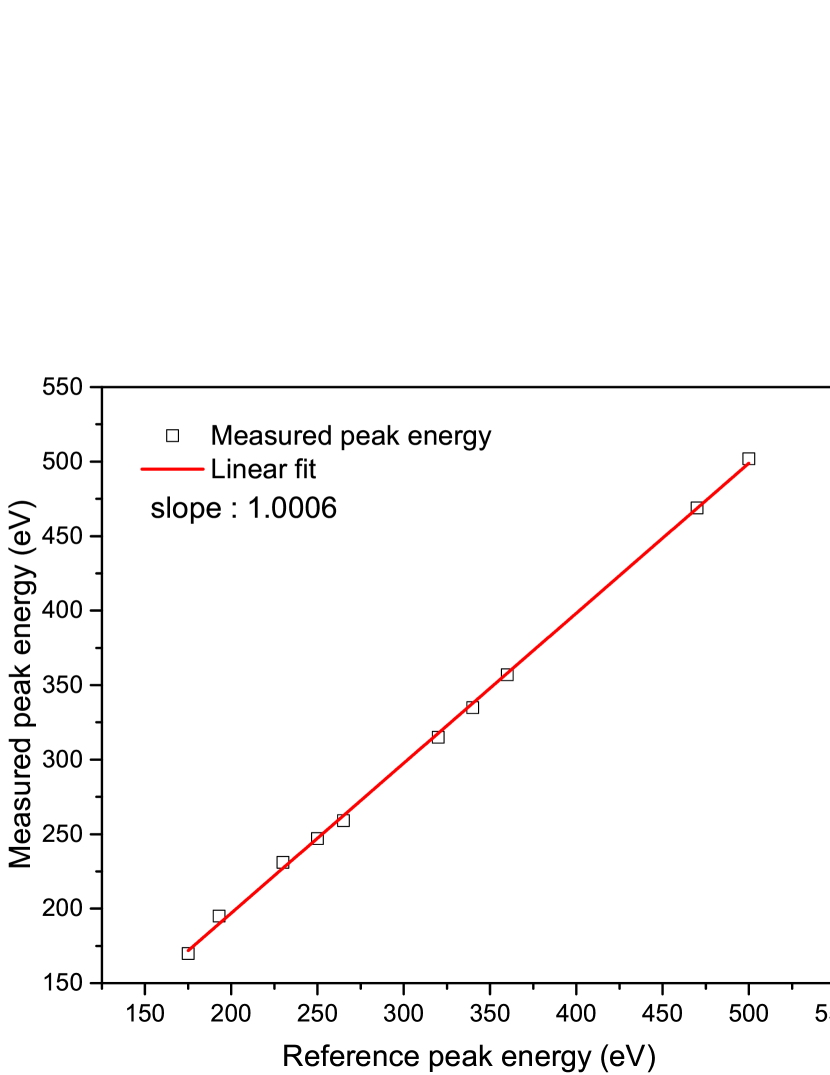
The energy spectra were measured in a limited energy range around the Auger emission energy peak region in all cases. The spectra (see inset in figure 10) show the characteristic features of secondary electron emission following collision with energetic ions MISRA2009 . The electron emission cross section decreases monotonically as a function of electron kinetic energy. This is attributed to the binary collision process. A broad peak corresponding to the Auger process is visible riding over this continuum background. In order to extract the contribution from Auger peaks, one can approximate the continuum background in the peak region by a polynomial function and subtract it from the measured energy spectrum. The interpolated continuum background is shown as solid curve in the inset of figure 10 and the Auger peaks after background subtraction are shown in the main panel. The Auger energy distribution is a broad peak and consists of several Auger lines corresponding to emission from different L and M sub-shells. More than one peak in the Auger spectrum can be identified. However, the resolution of CMA is not high enough to clearly resolve the sub-shell contribution and we have used multiple Gaussian fits to reveal identifiable Auger lines. Additionally, in energetic ion-atom collision the Auger process is also accompanied by multiple ionization of the valance electrons, thereby broadening the Auger region. In table 1, we have reported the measured Auger energy values (using the calibration factor from SIMION simulation) are in excellent agreement with the Auger values reported in literature Kobayashi1976 validating the calibrating factor obtained using the SIMION simulation.
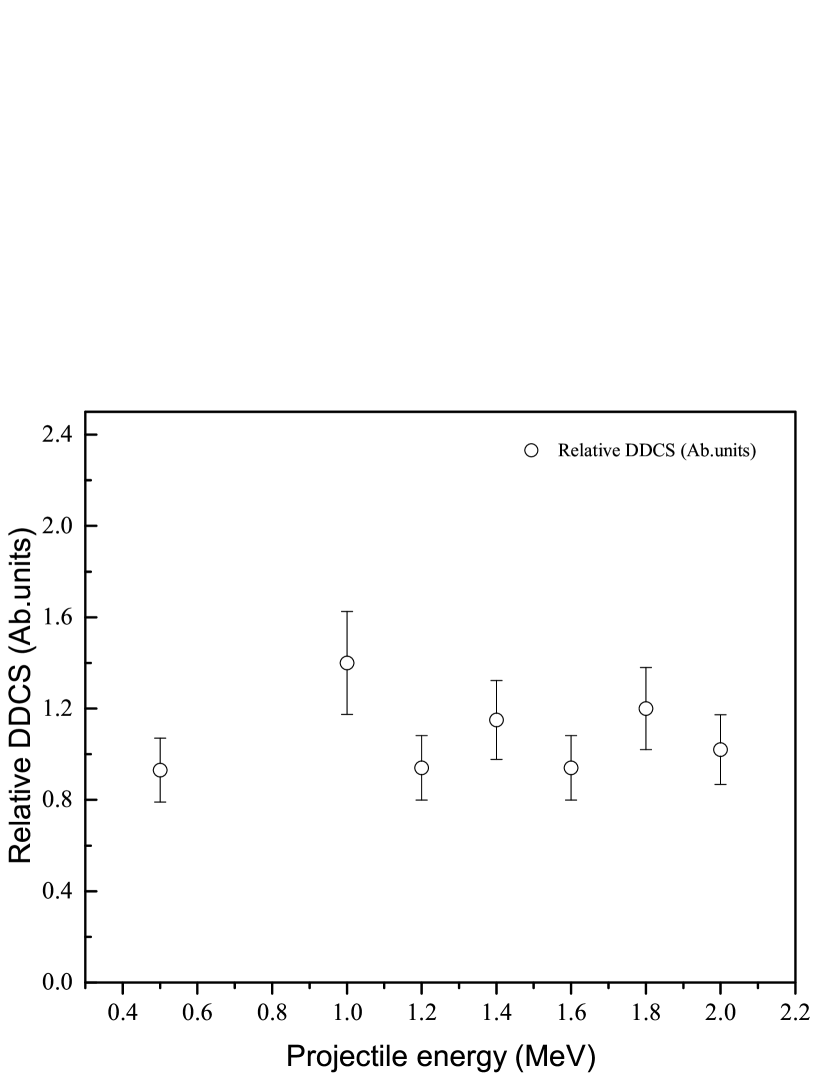
We further studied the projectile energy dependence of K-LL Auger emission yield. The proton beam energy was varied from 0.5 MeV to 2 MeV. Several groups have reported detailed cross section measurements on K-LL auger emission in the later part of last century Stolterfoht1975 ; Kobayashi1976 . For low Z elements, the K-LL Auger cross sections are equivalent to the inner shell ionization cross section due to extremely low fluorescence yield leading to x-ray emission. The K-LL Auger emission cross sections reach a maximum in the present projectile energy range and a variation within 10 has been reported Kobayashi1976 . In figure 11, we have shown the integrated yield (relative cross section) for N2 K-LL Auger emission in ionizing collisions with 0.5 MeV to 2 MeV proton beam. The measured relative cross sections do not vary much with in the experimental uncertainty ( 15). This is in agreement with the reported measurements in this projectile energy range for H+ ions. The uncertainty in the measured cross sections in attributed mainly to the fluctuation in the target gas pressure.
| proton energy (MeV) | Target gas | Auger energy (eV) | Reference Kobayashi1976 |
| 1 | 357,335,315 | 360,340,320 | |
| 1 | 502,469 (O,KLL) | 500,470 | |
| 1 | 247,231,259 (C, KLL) | 250,230,265 | |
| 1 | 195,170 (LMM) | 193,175 |
IV conclusion
We have presented the design, construction, and testing of a cylindrical mirror analyzer electron spectrometer and associated data acquisition system. The spectrometer is capable of measuring electron spectrum with an energy resolution of 4 and nearly 2 collection of electrons in the azimuthal plane. The spectrometer performance was evaluated by measuring electron spectra, following collision with MeV energy proton beam, for in the K-LL (L-MM for Ar) Auger energy range. Energy of Auger peaks measured for different targets match well with the reported values in literature.
V Acknowledgments
Acknowledgements.
The Authors would like to thank Sahan Sykam and Sandeep Bari for smooth operation of the tandetron accelerator facility during the experiments. AHK would also like to acknowledge support from DST-SERB grant no. ECR/2017/002055.References
- (1) R. Murphy and W. Eberhardt, “Site specific fragmentation in molecules: Auger‐electron ion coincidence studies on N2O,” The Journal of Chemical Physics 89 no. 7, (10, 1988) 4054–4057. https://doi.org/10.1063/1.454839.
- (2) J. Ullrich, R. Moshammer, R. Dörner, O. Jagutzki, V. Mergel, H. Schmidt-Böcking, and L. Spielberger, “Recoil-ion momentum spectroscopy,” Journal of Physics B: Atomic, Molecular and Optical Physics 30 no. 13, (Jul, 1997) 2917. https://dx.doi.org/10.1088/0953-4075/30/13/006.
- (3) G. Alberti, E. Fainelli, F. Maracci, M. Mastropietro, R. Platania, and L. Avaldi, “An apparatus to investigate the fragmentation of molecular dications by electron impact,” Review of Scientific Instruments 76 no. 7, (06, 2005) 073101. https://doi.org/10.1063/1.1946988.
- (4) K. Saha, S. B. Banerjee, and B. Bapat, “A combined electron-ion spectrometer for studying complete kinematics of molecular dissociation upon shell selective ionization,” Review of Scientific Instruments 84 no. 7, (07, 2013) 073101. https://doi.org/10.1063/1.4811796.
- (5) www.highvolteng.com. https://www.highvolteng.com/.
- (6) H. Z. Sar‐El, “Cylindrical Mirror Analyzer with Surface Entrance and Exit Slots. I. Nonrelativistic Part,” Review of Scientific Instruments 42 no. 11, (11, 1971) 1601–1606. https://doi.org/10.1063/1.1684948.
- (7) A. Duley, R. Tyagi, S. B. Bari, and A. H. Kelkar, “Design and characterization of a recoil ion momentum spectrometer for investigating molecular fragmentation dynamics upon MeV energy ion impact ionization,” Review of Scientific Instruments 93 no. 11, (11, 2022) 113308. https://doi.org/10.1063/5.0109415.
- (8) J. H. Moore, C. C. Davis, M. A. Coplan, and S. C. Greer, Building Scientific Apparatus. Cambridge University Press, 4 ed., 2009.
- (9) www.simion.com. https://simion.com/.
- (10) www.arduino.cc. https://www.arduino.cc/.
- (11) www.raspberrypi.com. https://www.raspberrypi.com/.
- (12) R. P. Sallen and E. L. Key, “A practical method of designing rc active filters,” IRE Transactions on Circuit Theory 2 no. 1, (1955) 74–85.
- (13) www.python.org/. https://www.python.org/.
- (14) pyserial 3.5. https://pypi.org/project/pyserial/.
- (15) “Double differential distributions of electron emission in ion–atom and electron–atom collisions using an electron spectrometer,” Nuclear Instruments and Methods in Physics Research Section B: Beam Interactions with Materials and Atoms 267 no. 1, (2009) 157–162. https://doi.org/10.1016/j.nimb.2008.10.091.
- (16) N. Kobayashi, N. Maeda, H. Hori, and M. Sakisaka, “K shell ionizations of carbon, nitrogen, oxygen, fluorine and neon by proton and alpha particle bombardments,” Journal of the Physical Society of Japan 40 no. 5, (1976) 1421–1429. https://doi.org/10.1143/JPSJ.40.1421.
- (17) N. Stolterfoht and D. Schneider, “Cross sections for K-shell ionization of CH4, N2, and Ne by 50- to 600-keV H+ and He+ impact,” Phys. Rev. A 11 (Feb, 1975) 721–723. https://link.aps.org/doi/10.1103/PhysRevA.11.721.