Precision mass measurements at the JYFLTRAP double Penning trap
pin down the mass surface across the neutron midshell at
Abstract
Precision mass measurements of 104Y, 106Zr, 104,104m,109Nb, and 111,112Mo have been performed with the JYFLTRAP double Penning trap mass spectrometer at the Ion Guide Isotope Separator On-Line facility. The trend in two-neutron separation energies around the neutron midshell appeared to be steeper with respect to the Atomic Mass Evaluation 2020 extrapolations for the 39Y and 40Zr isotopic chains and less steep for the 41Nb chain, indicating a possible gap opening around . The experimental results were compared to the BSkG2 model calculations performed with and without vibrational and rotational corrections. All of them predict two low-lying minima for 106Zr. While the unaltered BSkG2 model fails to predict the trend in two-neutron separation energies, selecting the more deformed minima in calculations and removing the vibrational correction, the calculations are more in line with experimental data. The same is also true for the excitation energies and differences in charge radii in the Zr isotopes. The results stress the importance of improved treatment of collective corrections in large-scale models and further development of beyond-mean-field techniques.
1 Introduction
The region of neutron-rich refractory nuclei around is known for shape coexistence on one hand and rapid and drastic changes in ground-state deformation on the other. Nuclear spectroscopy studies have indicated coexisting spherical, oblate and prolate shapes in the region (see e.g. Refs. [1, 2]) while laser spectroscopy studies have revealed a sudden increase in the mean-square charge radii at for the isotopic chains from Rb () to Nb () [3, 4, 5, 6, 7, 8]. A sharp drop in the excitation energies of the first states at is an observational signal of a change in deformation. The drop is most pronounced in the Sr () and Zr () chains while being somewhat smoother for the Kr (), Mo () and Ru () chains [2]. Changes in nuclear structure are also reflected in nuclear binding energies with two-neutron separation energies () showing a kink at from Rb to Mo [9]. This behavior correlates with the observed onset of deformation, see e.g. Fig. 15 in Ref. [10].
While the region has been extensively studied for the refractory elements with , not much is known about the structure of these elements around the midshell. In other neutron midshell regions interesting phenomena have been observed with the most striking one present in the neutron-deficient Hg isotopes () where the mean-square charge radii exhibit a unique odd-even staggering at [11, 12]. Other examples include a very large deformation observed for [13], as well as the Cd isotopes () where the low-lying collective states reach their minimum at [14, 2]. While these structural changes have been clearly observed via spectroscopy experiments, they do not necessarily introduce observable effects in the ground-state binding energies.
Laser spectroscopy has not yet reached exotic Zr and Mo isotopes at . However, -ray spectroscopy experiments at the Radioactive Isotope Beam Factory have reported that the excitation energies of the states for the Zr isotopes reach a minimum at and start to increase for [15, 16], similarly to the Mo isotopic chain [17]. This suggests that the maximum quadrupolar deformation is reached at . It is worthwhile to note that also 110Zr at is still strongly deformed, with keV and the excitation energy ratio [16].
Despite the efforts, the mass surface in the midshell region has remained poorly known, in particular for the Y () and Zr isotopic chains. Although the masses of 105Y and 106Zr were reported in Ref. [18], they were deemed anomalous [19]. Consequently, they were removed from the Atomic Mass Evaluation 2020 (AME20) and replaced by extrapolated values. In the lighter isotopic chains of Rb and Sr, the deformation has been found to extend toward larger neutron numbers [20]. No subshell gap or indications of change in deformation in the region have been found in these isotopic chains via mass measurements [21]. In the heavier isotopic chains, our recent mass measurements show that there are no drastic changes in the values of the Ru () [22] and the Rh () [23] isotopic chains up to . However, the first Brussels-Skyrme-on-a-Grid (BSkG1) [24] mass model calculations predicts that the neutron-rich Ru and Rh isotopes at are triaxially deformed and a structural change could affect the trends at higher neutron numbers [23, 22].
For the Zr ground states, axial mean-field approaches have mainly predicted axially-deformed shapes in the region, see e.g. Ref. [25]. Not so many models have taken into account triaxial degrees of freedom. However, they were included in the 5-Dimensional Collective Hamiltonian (5DCH) [26] with the Gogny D1S effective interaction [27, 28], as well as in the projected configuration mixing model (PCM) [29, 30] that uses either the D1S or SLyMR0 force [31, 32]. Within these models, the ground and the states in 110Zr are triaxial and they are built on rather -soft potential energy surfaces, see the supplemental information in Ref. [16]. These predictions are also supported by the large-scale Monte Carlo shell-model calculations which have predicted triaxial excited bands for Zr isotopes with [33]. The strong deformation continuing up to 110Zr has also been experimentally verified [16].
In this Letter, we report on Penning-trap mass measurements in the region and present the first high-precision mass measurement of 104Y (, ) and 106Zr (, ). The theoretical interpretation of the results is carried in the framework of BSkG2 [34]. This new mass model is based on Skyrme energy-density functional similarly to its predecessor BSkG1 [24]. The main improvements in BSkG2 compared to BSkG1 are related to the treatment of time-reversal invariance and incorporation of fission barriers of actinide nuclei [34, 35]. Both models allow for triaxial degrees of freedom relevant for the studied refractory region.
2 Experimental method
Precision mass measurements were performed at the Ion Guide Isotope Separator On-Line (IGISOL) facility [36] utilizing the JYFLTRAP double Penning trap [37]. The measured isotopes were produced in proton-induced fission by impinging 25-MeV proton beam from the K130 cyclotron on a 15 mg/cm2 natU target. The fission products were stopped in a helium gas cell working at around 300 mbar and extracted using a sextupole ion guide [38]. The secondary beam was accelerated to 30 keV and mass separated based on their mass-to-charge ratio by a 55 degree dipole magnet. Then, the ions were transported to the buffer gas-filled radio-frequency quadrupole [39], cooled, bunched and sent to JYFLTRAP.
In the first trap, the ions were cooled, centered and prepared utilizing the mass-selective buffer gas cooling technique [40]. The selected ions were sent into the second trap where their cyclotron frequency was measured. The value is the charge-to-mass ratio of the ion and is the magnetic field strength, which was determined using the reference ions of 133Cs delivered from the offline ion source [41].
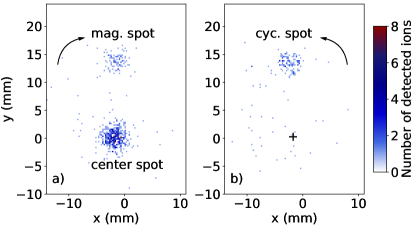
The time-of-flight ion-cyclotron-resonance (TOF-ICR) technique [42, 43] with a ms quadrupolar excitation was used for 109Nb and 112Mo ions while the phase-imaging ion-cyclotron-resonance (PI-ICR) technique [44, 45] was utilized for the other cases. In the TOF-ICR technique, the ions for which the excitation frequency matches with their cyclotron frequency will have the shortest time of flight from the trap to a micro-channel plate (MCP) detector. In the PI-ICR technique, is determined from the angular difference between the projections of the magnetron and cyclotron radial in-trap motion images, measured with respect to the center spot on a position sensitive MCP detector (2D MCP) after a phase accumulation time , see Fig. 1.
The atomic mass of the ion of interest was deduced using the frequency ratio of the measured cyclotron frequencies:
| (1) |
where is the mass of an electron, is the atomic mass of the reference ion while and are charge states of the ion of interest and the reference ion, respectively. The measurements were performed with singly-charged ions, except for the isomeric state of 104Nb for which .
Ion-ion interactions were taken into account by either limiting the number of detected ions per bunch or, in the case of 104Nb, by using a count-rate class analysis [46, 47]. To reduce systematic effects due to magnetic field fluctuations, the ion of interest and the reference ion were measured alternately and an extra uncertainty of , with being the time between the measurements, was added. The mass-dependent uncertainty of and a residual systematic uncertainty of were also taken into account in the analysis. For the PI-ICR measurements the systematic angle error was also accounted for. A detailed description on the systematic uncertainties and measurement patterns at JYFLTRAP can be found in Refs. [45, 47].
3 Results
| Nuclide | (ms) | ME (keV) | MElit. (keV) | Diff. (keV) | |||
|---|---|---|---|---|---|---|---|
| 104Y | ( | 197(4) ms | 30 | #a | # | ||
| 106Zr | 179(6) ms | 50, 54 | #b | # | |||
| 104Nb | 0.98(5) s | 311 | c | ||||
| 104Nbm | 4.9(3) s | 200 | d | ||||
| 109Nb | 106.9(49) ms | 50t | |||||
| 111Mox | 193.6(44) ms | 100 | e | ||||
| 112Mo | 125(5) ms | 50t | #f | # |
-
a
Also = keV in Ref. [49].
- b
-
c
The used accumulation time is not sufficient to resolve the ground state from the isomer, but the production is dominated by the high-spin ground state.
-
d
Measured as ions from the in-trap-decay of 104Zr populating the low-spin isomer in 104Nb.
-
e
Also = keV in Ref. [50].
- f
The determined frequency ratios and mass-excess values () are summarized in Table 1. All mass values are in agreement with AME20 [9]. Our results constitute the first high-precision mass values of 104Y and 106Zr. The mass of 112Mo, keV, is in agreement with the recent MR-TOF-MS measurement, keV, reported in Ref. [50]. The mass of 106Zr was already reported in Ref. [18] ( keV) but rejected in the AME20 evaluation due to a significant deviation from the mass surface trends [19]. Our mass-excess value of keV, which differs by # keV from the AME20 extrapolation and keV from Ref. [18], indicates that the mass surface does not follow a smooth trend.
We note that two studied nuclides have long-lived isomeric states. A decay-spectroscopy study employing the same reaction at the IGISOL facility proposed a low-lying isomer at # keV [48] and a half-life of about 200 ms in 111Mo [51]. However, only a single state was observed in this work. Considering that the phase accumulation time was 100 ms, we estimate the excitation energy to be below 60 keV.
In the case of 104Nb ions produced directly in fission, the 311 ms accumulation time was not sufficient to resolve the 10-keV isomer [48] from the ground state. However, our result, keV, agrees with keV measured at the Canadian Penning Trap (CPT) [52]. A second measurement was performed using 104Nb2+ ions produced via the in-trap-decay of 104Zr, known to populate only the low-spin state in 104Nb [53]. The measured mass-excess value, keV, is consistent with the CPT result for the isomer, keV [52]. Considering that the production of high-spin states is favoured in fission [54, 55], as well as the CPT results [52], we can unambiguously assign the high-spin state as the ground state and the low-spin state as the isomer in 104Nb.
4 Discussion
The accurate reproduction of all known nuclear binding energies remains a challenge for nuclear theory. We seize this opportunity to benchmark the performance of a recent large-scale model based on an energy density functional (EDF) of the Skyrme type by comparing the masses of nuclei in this region to the ones obtained from the BSkG2 model [34, 35]. Our new measurements, combined with the values of AME20, amount to 75 known experimental values for the masses for Sr, Y, Zr, Nb, Mo and Tc isotopes with . The local average and root-mean-square (rms) deviation of the masses of these nuclei amount to MeV§§§We define the deviation as (theory - experiment), such that the sign of indicates the model overbinds these nuclei on average, i.e. produces mass excesses that are too large in absolute size. and MeV, respectively. The rms deviation in this region is somewhat larger than the global accuracy of the model ( MeV), largely because of the non-zero (local) value of . These values do not necessarily point to a specific modelling deficiency with respect to this region of the nuclear chart, but rather reflect the typical currently unavoidable compromise achieved by fitting the model parameters to thousands of known nuclear masses.
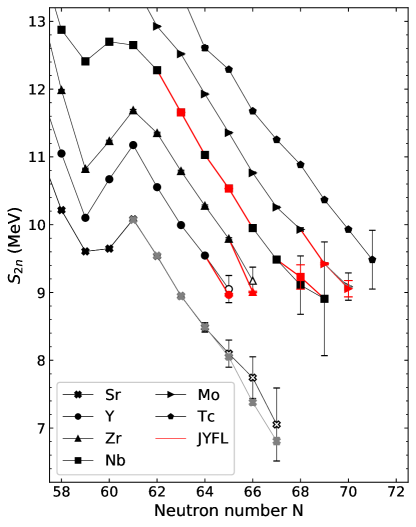
Compared to absolute values, mass differences often indicate more clearly whether a model manages to capture the structural evolution along isotopic or isotonic chains. Two-neutron separation energies are typically used as an indicator for structural changes. Figure 2 shows values for isotopic chains ranging from Sr () to Tc (). While our new experimental data agree with the AME20 values [9], the improved precision obtained in this work pins down the trends in the values in the studied isotopic chains. Two interesting features emerge when crossing the midshell at . First, the new values for 104Y () and 106Zr () fall below a straight linear extrapolation of AME20 in both the Y () and Zr () isotopic chains, similarly to the Sr chain recently studied at TITAN [21]. Second, the new value for 109Nb () is above the linear trend. As a result, the gap between the isotopic chains below and above seems to increase when approaching the neutron midshell region at .
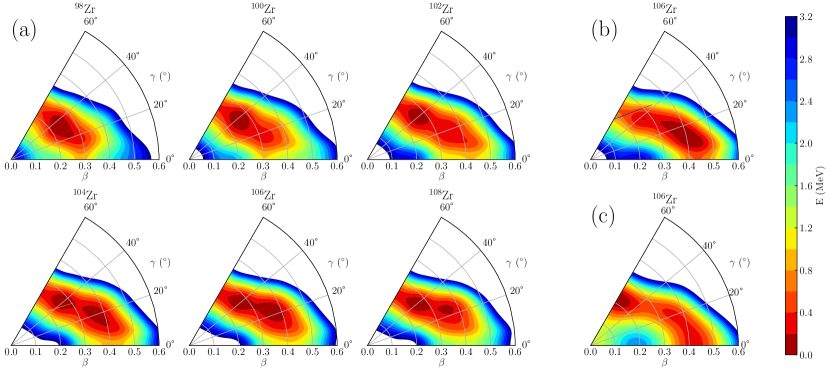
Digging deeper, we show in Fig. 3(a) the potential energy surfaces (PESs) for even-even neutron-rich Zr isotopes as a function of and (see Ref. [24] for precise definitions). For even-even 98-108Zr isotopes, there is always a triaxial minimum (T1) at modest total deformation and at high values of . For 104,106,108Zr, there is a second triaxial minimum (T2) very close in energy ( 150 keV energy difference) that is separated by a very thin barrier from T1. These second triaxial minima have a larger deformation of and smaller .
For even-even nuclei, this type of PESs with two competing minima that are both triaxial is rarely found in mean-field calculations, if at all. This structure appears here because of the inclusion of so-called rotational and vibrational corrections in BSkG2, which aim at eliminating the spurious energy associated with the corresponding type of collective motion that arises from a symmetry-broken mean-field description of the nucleus. For BSkG2, these corrections take the form of simple analytical expressions of the (rotational) moment of inertia of the nucleus and include a handful of parameters in the model optimisation protocol. Both recipes are essentially phenomenological albeit to differing degrees: the rotational correction has a microscopic foundation in many-body theory and is widely used [56, 57, 58], while the ansatz for the vibrational correction is more ad-hoc [35]. Both corrections are strongly deformation dependent, meaning that their inclusion can significantly impact the PES. We illustrate this for 106Zr in the other panels of Figure 3. Without the vibrational correction (see Fig. 3(b)), the T2 minimum becomes the lowest in energy and moves to a somewhat larger deformation. If both collective corrections are removed (see Fig. 3(c)), the PES becomes more traditional: the triaxial minima get replaced by coexisting axially symmetric minima, one oblate and one prolate. This behavior is in qualitative agreement with the available EDF results that use more advanced techniques to include these effects [59] and that also tend to transform axial minima into triaxial ones [16, 60].
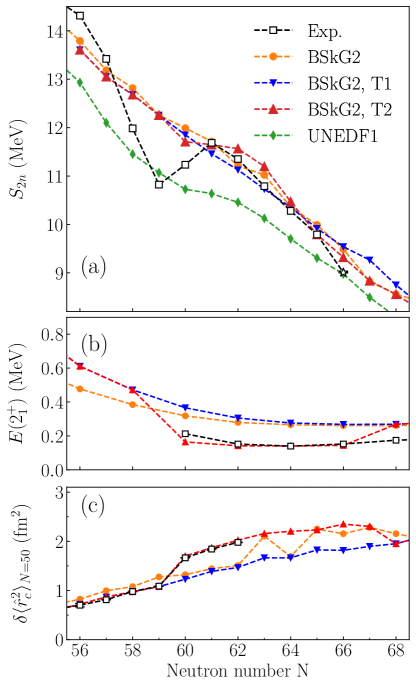
We compare the calculated two-neutron separation energies to the experimental results along the Zr isotopic chain in Fig. 4(a). The trend of the BSkG2 model is very linear near and . It misses the new experimental point at 106Zr and the pronounced “dip” in the experimental values around at . The latter is not reproduced - to the best of our knowledge - by any EDF-based mean-field model, as we illustrate with the Skyrme-type UNEDF1 parameterization and as can be seen for the D1S and D1M Gogny parameterizations in Ref. [25]. Despite these deficiencies, BSkG2 captures the general trend of the values, especially when compared to the UNEDF1 parameterization [61] which was fitted to fewer mass data.
The vibrational correction is arguably the most phenomenological ingredient in our calculations, yet it biases the PES in favor of the minimum with smallest deformation in the Zr isotopic chain. To investigate how the selection of minima impacts the calculated observables we removed the vibrational correction and plotted in Fig. 4(a) the values for both T1 and T2 minima. For the two-neutron separation energies, the general trend is rather similar to the unmodified BSkG2 calculation. However, some differences emerge. First, the T2 minimum without vibrational correction is closer to the new experimental value for 106Zr. Second, the trend of the T1 minima is extremely linear while the T2 curve shows some structure near that vaguely resembles the experimental dip in shape, even if clearly not in amplitude. The reproduction of the experimental feature at is hardly satisfactory but other attempts to fine-tune BSkG2 were even less successful. We take this as an indication that a mean-field description is not rich enough to describe the dip of the two-neutron separation energies, especially in light of similar deficiencies found for virtually all other published mean-field results.
Although the improvement in the description of the values is minor, removing the vibrational correction and selecting the T2 minima does lead to a much improved description of two other properties of the Zr isotopes. The excitation energies of the first states are compared to the available data in Fig. 4(b). The model values are those of a perfect rigid triaxial rotor characterized by the BSkG2 moments of inertia, calculated microscopically and renormalized by the traditional factor 1.32 [64]. The calculations for T2 reproduce the excitation energies for 100-106Zr while the T1 and original results both overestimate this quantity. Note that the first states of Zr isotopes with lie above 1 MeV and are almost surely non-rotational. This is also supported by the strong increase in the ratio of the energies between 98Zr and 100Zr [17]. Thus, these points are not plotted. The second property is the mean-square charge radius relative to , see Fig. 4(c). Without the vibrational correction, the T2 minimum agrees very well with the available experimental data [7, 63] and, in particular, with the sudden increase at . Unmodified BSkG2 calculations fail to match this transition and furthermore produce slightly too large shifts for . For more neutron-rich isotopes, the competition between both minima results in a staggering at .
The mean-square charge radii and excitation energies are directly connected to deformation. For these quantities a simple mean-field modelling quite accurately describes the experimental data, provided one discards the phenomenological vibrational correction that biases the competition between both minima in the wrong direction. These modifications also appear as a limited step in the right direction for the two-neutron separation energies. Although other modifications of the model could theoretically be used to change the balance between the minima, our discussion illustrates that phenomenological corrections for collective motion can locally bias models in regions of the nuclear chart where multiple shapes compete. A study of the impact of the collective corrections on different observables in different areas of the nuclear chart would be welcome, as would be improved ways to include collective motion in large-scale models. Ideally, the ongoing development of beyond-mean-field techniques [59] should be pushed to the point where their use at the scale of the nuclear chart becomes feasible for nuclei with even and odd numbers for protons and neutrons.
5 Conclusions
In this Letter, we reported on precision mass measurements of neutron-rich refractory isotopes that pin down the trends of the mass surface in the midshell region. The two-neutron separation energies in both the Y and Zr isotopic chains decrease more steeply than a linear extrapolation of previously known values toward . The recent BSkG2 model reproduces the absolute masses in the region within about 900 keV, compatible with a typical accuracy of today’s large-scale models. However, it entirely misses the interesting feature of the two-neutron separation energies near . Focusing on the Zr isotopic chain, BSkG2 predicts a competition between two close-lying minima that are both triaxial. Which minimum is preferred by a large-scale model that is restricted to the mean-field level depends sensitively on several factors. We have shown in particular that it depends on the correction for spurious collective motion. Manually selecting the more deformed of the minima in calculations and removing the vibrational correction, the calculations are more in line with experimental data on mean-square charge radii and energies and result in a non-linear trend of the two-neutron separation energies trend near that carries some resemblance to experimental feature.
We conclude that the simple recipes used to account for spurious motion in large-scale models are too crude to accurately capture all details of the mass surface in regions of the nuclear chart where multiple configurations compete. Nevertheless, such recipes are crucial for the globally accurate reproduction of masses and other observables. This work highlights that such global success comes at the cost of local failure and that there is a need for an improved treatment of collective motion in large-scale models, ideally through beyond-mean-field techniques.
Acknowledgments
The present research benefited from computational resources made available on the Tier-1 supercomputer of the Fédération Wallonie-Bruxelles, infrastructure funded by the Walloon Region under the grant agreement No. 1117545. This project has received funding from the European Union’s Horizon 2020 research and innovation programme under grant agreements No. 771036 (ERC CoG MAIDEN) and No. 861198–LISA–H2020-MSCA-ITN-2019 and the Academy of Finland projects No. 295207, 306980, 327629, 354968 and 354589. W.R. is a Research associate of the F.R.S.-FNRS (Belgium). Work by M.B. has been supported by the Agence Nationale de la Recherche, France, Grant No. 19-CE31-0015-01 (NEWFUN). We are grateful for the mobility support from Projet International de Coopération Scientifique Manipulation of Ions in Traps and Ion sourCes for Atomic and Nuclear Spectroscopy (MITICANS) of CNRS.
References
-
[1]
K. Heyde, J. L. Wood,
Shape coexistence
in atomic nuclei, Rev. Mod. Phys. 83 (2011) 1467–1521.
doi:10.1103/RevModPhys.83.1467.
URL https://link.aps.org/doi/10.1103/RevModPhys.83.1467 -
[2]
P. E. Garrett, M. Zielińska, E. Clément,
An
experimental view on shape coexistence in nuclei, Progress in Particle and
Nuclear Physics 124 (2022) 103931.
doi:10.1016/j.ppnp.2021.103931.
URL https://www.sciencedirect.com/science/article/pii/S0146641021000922 -
[3]
C. Thibault, F. Touchard, S. Büttgenbach, R. Klapisch, M. de Saint Simon,
H. T. Duong, P. Jacquinot, P. Juncar, S. Liberman, P. Pillet, J. Pinard,
J. L. Vialle, A. Pesnelle, G. Huber,
Hyperfine structure
and isotope shift of the line of
and some of their isomers, Phys. Rev. C 23 (1981) 2720–2729.
doi:10.1103/PhysRevC.23.2720.
URL https://link.aps.org/doi/10.1103/PhysRevC.23.2720 -
[4]
T. J. Procter, J. A. Behr, J. Billowes, F. Buchinger, B. Cheal, J. E. Crawford,
J. Dilling, A. B. Garnsworthy, A. Leary, C. D. P. Levy, E. Mané, M. R.
Pearson, O. Shelbaya, M. Stolz, W. Al Tamimi, A. Voss,
Direct observation of an
isomeric state in 98Rb and nuclear properties of exotic rubidium
isotopes measured by laser spectroscopy, The European Physical Journal A
51 (2) (2015) 23.
doi:10.1140/epja/i2015-15023-2.
URL https://doi.org/10.1140/epja/i2015-15023-2 -
[5]
R. E. Silverans, P. Lievens, L. Vermeeren, E. Arnold, W. Neu, R. Neugart,
K. Wendt, F. Buchinger, E. B. Ramsay, G. Ulm,
Nuclear charge
radii of by nonoptical detection in
fast-beam laser spectroscopy, Phys. Rev. Lett. 60 (1988) 2607–2610.
doi:10.1103/PhysRevLett.60.2607.
URL https://link.aps.org/doi/10.1103/PhysRevLett.60.2607 -
[6]
B. Cheal, M. Gardner, M. Avgoulea, J. Billowes, M. Bissell, P. Campbell,
T. Eronen, K. Flanagan, D. Forest, J. Huikari, A. Jokinen, B. Marsh,
I. Moore, A. Nieminen, H. Penttilä, S. Rinta-Antila, B. Tordoff, G. Tungate,
J. Äystö,
The
shape transition in the neutron-rich yttrium isotopes and isomers, Phys.
Lett. B 645 (2) (2007) 133–137.
doi:10.1016/j.physletb.2006.12.053.
URL https://www.sciencedirect.com/science/article/pii/S037026930601608X -
[7]
P. Campbell, H. L. Thayer, J. Billowes, P. Dendooven, K. T. Flanagan, D. H.
Forest, J. A. R. Griffith, J. Huikari, A. Jokinen, R. Moore, A. Nieminen,
G. Tungate, S. Zemlyanoi, J. Äystö,
Laser
spectroscopy of cooled zirconium fission fragments, Phys. Rev. Lett. 89
(2002) 082501.
doi:10.1103/PhysRevLett.89.082501.
URL https://link.aps.org/doi/10.1103/PhysRevLett.89.082501 -
[8]
B. Cheal, K. Baczynska, J. Billowes, P. Campbell, F. C. Charlwood, T. Eronen,
D. H. Forest, A. Jokinen, T. Kessler, I. D. Moore, M. Reponen, S. Rothe,
M. Rüffer, A. Saastamoinen, G. Tungate, J. Äystö,
Laser
spectroscopy of niobium fission fragments: First use of optical pumping in an
ion beam cooler buncher, Phys. Rev. Lett. 102 (2009) 222501.
doi:10.1103/PhysRevLett.102.222501.
URL https://link.aps.org/doi/10.1103/PhysRevLett.102.222501 -
[9]
M. Wang, W. Huang, F. Kondev, G. Audi, S. Naimi,
The AME 2020 atomic mass
evaluation (II). Tables, graphs and references, Chinese Physics C 45 (3)
(2021) 030003.
doi:10.1088/1674-1137/abddaf.
URL https://doi.org/10.1088/1674-1137/abddaf -
[10]
A. Kankainen, J. Äystö, A. Jokinen,
High-accuracy mass
spectrometry of fission products with penning traps, Journal of Physics G:
Nuclear and Particle Physics 39 (9) (2012) 093101.
doi:10.1088/0954-3899/39/9/093101.
URL https://doi.org/10.1088/0954-3899/39/9/093101 -
[11]
T. Kühl, P. Dabkiewicz, C. Duke, H. Fischer, H. J. Kluge, H. Kremmling, E. W.
Otten, Nuclear
shape staggering in very neutron-deficient hg isotopes detected by laser
spectroscopy, Phys. Rev. Lett. 39 (1977) 180–183.
doi:10.1103/PhysRevLett.39.180.
URL https://link.aps.org/doi/10.1103/PhysRevLett.39.180 -
[12]
B. A. Marsh, T. Day Goodacre, S. Sels, Y. Tsunoda, B. Andel, A. N. Andreyev,
N. A. Althubiti, D. Atanasov, A. E. Barzakh, J. Billowes, K. Blaum, T. E.
Cocolios, J. G. Cubiss, J. Dobaczewski, G. J. Farooq-Smith, D. V. Fedorov,
V. N. Fedosseev, K. T. Flanagan, L. P. Gaffney, L. Ghys, M. Huyse, S. Kreim,
D. Lunney, K. M. Lynch, V. Manea, Y. Martinez Palenzuela, P. L. Molkanov,
T. Otsuka, A. Pastore, M. Rosenbusch, R. E. Rossel, S. Rothe, L. Schweikhard,
M. D. Seliverstov, P. Spagnoletti, C. Van Beveren, P. Van Duppen,
M. Veinhard, E. Verstraelen, A. Welker, K. Wendt, F. Wienholtz, R. N. Wolf,
A. Zadvornaya, K. Zuber,
Characterization of the
shape-staggering effect in mercury nuclei, Nature Physics 14 (2018)
1163–1167.
doi:10.1038/s41567-018-0292-8.
URL https://doi.org/10.1038/s41567-018-0292-8 -
[13]
R. D. O. Llewellyn, M. A. Bentley, R. Wadsworth, H. Iwasaki, J. Dobaczewski,
G. de Angelis, J. Ash, D. Bazin, P. C. Bender, B. Cederwall, B. P. Crider,
M. Doncel, R. Elder, B. Elman, A. Gade, M. Grinder, T. Haylett, D. G.
Jenkins, I. Y. Lee, B. Longfellow, E. Lunderberg,
T. Mijatović, S. A. Milne, D. Muir,
A. Pastore, D. Rhodes, D. Weisshaar,
Establishing
the Maximum Collectivity in Highly Deformed Nuclei, Phys. Rev. Lett.
124 (2020) 152501.
doi:10.1103/PhysRevLett.124.152501.
URL https://link.aps.org/doi/10.1103/PhysRevLett.124.152501 -
[14]
S. Juutinen, R. Julin, P. Jones, A. Lampinen, G. Lhersonneau, E. Mäkelä,
M. Piiparinen, A. Savelius, S. Törmänen,
Band
structures in 114Cd and 116Cd from heavy-ion collisions, Phys.
Lett. B 386 (1) (1996) 80–84.
doi:10.1016/0370-2693(96)00967-7.
URL https://www.sciencedirect.com/science/article/pii/0370269396009677 -
[15]
T. Sumikama, K. Yoshinaga, H. Watanabe, S. Nishimura, Y. Miyashita,
K. Yamaguchi, K. Sugimoto, J. Chiba, Z. Li, H. Baba, J. S. Berryman,
N. Blasi, A. Bracco, F. Camera, P. Doornenbal, S. Go, T. Hashimoto,
S. Hayakawa, C. Hinke, E. Ideguchi, T. Isobe, Y. Ito, D. G. Jenkins,
Y. Kawada, N. Kobayashi, Y. Kondo, R. Krücken, S. Kubono, G. Lorusso,
T. Nakano, M. Kurata-Nishimura, A. Odahara, H. J. Ong, S. Ota, Z. Podolyák,
H. Sakurai, H. Scheit, K. Steiger, D. Steppenbeck, S. Takano, A. Takashima,
K. Tajiri, T. Teranishi, Y. Wakabayashi, P. M. Walker, O. Wieland,
H. Yamaguchi,
Structural
Evolution in the Neutron-Rich Nuclei and
, Phys. Rev. Lett. 106 (2011) 202501.
doi:10.1103/PhysRevLett.106.202501.
URL https://link.aps.org/doi/10.1103/PhysRevLett.106.202501 -
[16]
N. Paul, A. Corsi, A. Obertelli, P. Doornenbal, G. Authelet, H. Baba, B. Bally,
M. Bender, D. Calvet, F. Château, S. Chen, J.-P. Delaroche, A. Delbart,
J.-M. Gheller, A. Giganon, A. Gillibert, M. Girod, P.-H. Heenen, V. Lapoux,
J. Libert, T. Motobayashi, M. Niikura, T. Otsuka, T. R. Rodríguez, J.-Y.
Roussé, H. Sakurai, C. Santamaria, N. Shimizu, D. Steppenbeck, R. Taniuchi,
T. Togashi, Y. Tsunoda, T. Uesaka, T. Ando, T. Arici, A. Blazhev, F. Browne,
A. M. Bruce, R. Carroll, L. X. Chung, M. L. Cortés, M. Dewald, B. Ding,
F. Flavigny, S. Franchoo, M. Górska, A. Gottardo, A. Jungclaus, J. Lee,
M. Lettmann, B. D. Linh, J. Liu, Z. Liu, C. Lizarazo, S. Momiyama,
K. Moschner, S. Nagamine, N. Nakatsuka, C. Nita, C. R. Nobs, L. Olivier,
Z. Patel, Z. Podolyák, M. Rudigier, T. Saito, C. Shand, P.-A.
Söderström, I. Stefan, R. Orlandi, V. Vaquero, V. Werner, K. Wimmer,
Z. Xu, Are
there signatures of harmonic oscillator shells far from stability? first
spectroscopy of , Phys. Rev. Lett. 118 (2017) 032501.
doi:10.1103/PhysRevLett.118.032501.
URL https://link.aps.org/doi/10.1103/PhysRevLett.118.032501 - [17] From ENSDF database as of 20 Feb 2024. Version available at http://www.nndc.bnl.gov/ensarchivals/.
-
[18]
R. Knöbel, M. Diwisch, H. Geissel, Y. A. Litvinov, Z. Patyk, W. R.
Plaß, C. Scheidenberger, B. Sun, H. Weick, F. Bosch, D. Boutin, L. Chen,
C. Dimopoulou, A. Dolinskii, B. Franczak, B. Franzke, M. Hausmann,
C. Kozhuharov, J. Kurcewicz, S. A. Litvinov, M. Matoš, M. Mazzocco,
G. Münzenberg, S. Nakajima, C. Nociforo, F. Nolden, T. Ohtsubo, A. Ozawa,
J. Stadlmann, M. Steck, T. Suzuki, P. M. Walker, M. Winkler, T. Yamaguchi,
New results from
isochronous mass measurements of neutron-rich uranium fission fragments with
the FRS-ESR-facility at GSI, The European Physical Journal A 52 (5) (2016)
138.
doi:10.1140/epja/i2016-16138-6.
URL https://doi.org/10.1140/epja/i2016-16138-6 -
[19]
W. Huang, M. Wang, F. Kondev, G. Audi, S. Naimi,
The AME 2020 atomic mass
evaluation (I). Evaluation of input data, and adjustment procedures,
Chinese Physics C 45 (3) (2021) 030002.
doi:10.1088/1674-1137/abddb0.
URL https://doi.org/10.1088/1674-1137/abddb0 -
[20]
A. de Roubin, D. Atanasov, K. Blaum, S. George, F. Herfurth, D. Kisler,
M. Kowalska, S. Kreim, D. Lunney, V. Manea, E. Minaya Ramirez, M. Mougeot,
D. Neidherr, M. Rosenbusch, L. Schweikhard, A. Welker, F. Wienholtz, R. N.
Wolf, K. Zuber,
Nuclear
deformation in the region: Comparison between new
masses and mean-field predictions, Phys. Rev. C 96 (2017) 014310.
doi:10.1103/PhysRevC.96.014310.
URL https://link.aps.org/doi/10.1103/PhysRevC.96.014310 -
[21]
I. Mukul, C. Andreoiu, J. Bergmann, M. Brodeur, T. Brunner, K. A. Dietrich,
T. Dickel, I. Dillmann, E. Dunling, D. Fusco, G. Gwinner, C. Izzo, A. Jacobs,
B. Kootte, Y. Lan, E. Leistenschneider, E. M. Lykiardopoulou, S. F. Paul,
M. P. Reiter, J. L. Tracy, J. Dilling, A. A. Kwiatkowski,
Examining the
nuclear mass surface of Rb and Sr isotopes in the
region via precision mass measurements, Phys. Rev. C 103 (2021) 044320.
doi:10.1103/PhysRevC.103.044320.
URL https://link.aps.org/doi/10.1103/PhysRevC.103.044320 -
[22]
M. Hukkanen, W. Ryssens, P. Ascher, M. Bender, T. Eronen, S. Grévy,
A. Kankainen, M. Stryjczyk, L. Al Ayoubi, S. Ayet, O. Beliuskina,
C. Delafosse, Z. Ge, M. Gerbaux, W. Gins, A. Husson, A. Jaries,
S. Kujanpää, M. Mougeot, D. A. Nesterenko, S. Nikas, H. Penttilä,
I. Pohjalainen, A. Raggio, M. Reponen, S. Rinta-Antila, A. de Roubin,
J. Ruotsalainen, V. Virtanen, A. P. Weaver,
Binding energies
of ground and isomeric states in neutron-rich ruthenium isotopes:
Measurements at JYFLTRAP and comparison to theory, Phys. Rev. C 108 (2023)
064315.
doi:10.1103/PhysRevC.108.064315.
URL https://link.aps.org/doi/10.1103/PhysRevC.108.064315 -
[23]
M. Hukkanen, W. Ryssens, P. Ascher, M. Bender, T. Eronen, S. Grévy,
A. Kankainen, M. Stryjczyk, L. Al Ayoubi, S. Ayet, O. Beliuskina,
C. Delafosse, W. Gins, M. Gerbaux, A. Husson, A. Jokinen, D. A. Nesterenko,
I. Pohjalainen, M. Reponen, S. Rinta-Antila, A. de Roubin, A. P. Weaver,
Odd-odd
neutron-rich rhodium isotopes studied with the double Penning trap
JYFLTRAP, Phys. Rev. C 107 (2023) 014306.
doi:10.1103/PhysRevC.107.014306.
URL https://link.aps.org/doi/10.1103/PhysRevC.107.014306 -
[24]
G. Scamps, S. Goriely, E. Olsen, M. Bender, W. Ryssens,
Skyrme-Hartree-Fock-Bogoliubov
mass models on a 3D mesh: effect of triaxial shape, Eur. Phys. J. A 57
(2021) 333.
doi:10.1140/epja/s10050-021-00642-1.
URL https://doi.org/10.1140/epja/s10050-021-00642-1 -
[25]
E. V. Chimanski, E. J. In, J. E. Escher, S. Péru, W. Younes,
Addressing nuclear structure
challenges in the Zr isotopes with self-consistent Gogny-Force HFB
and QRPA predictionsArXiv:2308.13374 [nucl-th] (Aug. 2023).
doi:10.48550/arXiv.2308.13374.
URL http://arxiv.org/abs/2308.13374 -
[26]
J. P. Delaroche, M. Girod, J. Libert, H. Goutte, S. Hilaire, S. Péru,
N. Pillet, G. F. Bertsch,
Structure of
even-even nuclei using a mapped collective hamiltonian and the d1s gogny
interaction, Phys. Rev. C 81 (2010) 014303.
doi:10.1103/PhysRevC.81.014303.
URL https://link.aps.org/doi/10.1103/PhysRevC.81.014303 -
[27]
J. Dechargé, D. Gogny,
Hartree-Fock-Bogolyubov
calculations with the effective interaction on spherical nuclei, Phys.
Rev. C 21 (1980) 1568–1593.
doi:10.1103/PhysRevC.21.1568.
URL https://link.aps.org/doi/10.1103/PhysRevC.21.1568 -
[28]
J. Berger, M. Girod, D. Gogny,
Time-dependent
quantum collective dynamics applied to nuclear fission, Computer Physics
Communications 63 (1) (1991) 365–374.
doi:10.1016/0010-4655(91)90263-K.
URL https://www.sciencedirect.com/science/article/pii/001046559190263K -
[29]
M. Bender, P.-H. Heenen,
Configuration
mixing of angular-momentum and particle-number projected triaxial
Hartree-Fock-Bogoliubov states using the Skyrme energy density functional,
Phys. Rev. C 78 (2008) 024309.
doi:10.1103/PhysRevC.78.024309.
URL https://link.aps.org/doi/10.1103/PhysRevC.78.024309 -
[30]
M. Borrajo, T. R. Rodríguez, J. Luis Egido,
Symmetry
conserving configuration mixing method with cranked states, Phys. Lett. B
746 (2015) 341–346.
doi:10.1016/j.physletb.2015.05.030.
URL https://www.sciencedirect.com/science/article/pii/S0370269315003676 -
[31]
B. Bally, B. Avez, M. Bender, P.-H. Heenen,
Beyond
Mean-Field Calculations for Odd-Mass Nuclei, Phys. Rev. Lett. 113 (2014)
162501.
doi:10.1103/PhysRevLett.113.162501.
URL https://link.aps.org/doi/10.1103/PhysRevLett.113.162501 -
[32]
J. Sadoudi, M. Bender, K. Bennaceur, D. Davesne, R. Jodon, T. Duguet,
Skyrme
pseudo-potential-based EDF parametrization for spuriousity-free MR EDF
calculations, Physica Scripta 2013 (T154) (2013) 014013.
doi:10.1088/0031-8949/2013/T154/014013.
URL https://doi.org/10.1088/0031-8949/2013/T154/014013 -
[33]
T. Togashi, Y. Tsunoda, T. Otsuka, N. Shimizu,
Quantum Phase
Transition in the Shape of Zr isotopes, Phys. Rev. Lett. 117 (2016) 172502.
doi:10.1103/PhysRevLett.117.172502.
URL https://link.aps.org/doi/10.1103/PhysRevLett.117.172502 -
[34]
W. Ryssens, G. Scamps, S. Goriely, M. Bender,
Skyrme–Hartree–Fock–Bogoliubov
mass models on a 3D mesh: II. Time-reversal symmetry breaking, The European
Physical Journal A 58 (12) (2022) 246.
doi:10.1140/epja/s10050-022-00894-5.
URL https://doi.org/10.1140/epja/s10050-022-00894-5 -
[35]
W. Ryssens, G. Scamps, S. Goriely, M. Bender,
Skyrme–Hartree–Fock–Bogoliubov
mass models on a 3D mesh: IIb. Fission properties of BSkG2, Eur.
Phys. J. A 59 (5) (2023) 96.
doi:10.1140/epja/s10050-023-01002-x.
URL https://doi.org/10.1140/epja/s10050-023-01002-x -
[36]
I. D. Moore, T. Eronen, D. Gorelov, J. Hakala, A. Jokinen, A. Kankainen,
V. Kolhinen, J. Koponen, H. Penttilä, I. Pohjalainen, M. Reponen,
J. Rissanen, A. Saastamoinen, S. Rinta-Antila, V. Sonnenschein, J. Äystö,
Towards commissioning the
new IGISOL-4 facility, Nuc. Inst. and Meth. in Physics Research Section B:
Beam Interactions with Materials and Atoms 317 (2013) 208–213.
doi:10.1016/j.nimb.2013.06.036.
URL https://doi.org/10.1016/j.nimb.2013.06.036 -
[37]
T. Eronen, V. Kolhinen, V.-V. Elomaa, D. Gorelov, U. Hager, J. Hakala,
A. Jokinen, A. Kankainen, P. Karvonen, S. Kopecky, I. D. Moore, H. Penttilä,
S. Rahaman, S. Rinta-Antila, J. Rissanen, A. Saastamoinen, J. Szerypo,
C. Weber, J. Äystö,
JYFLTRAP: a Penning trap
for precision mass spectroscopy and isobaric purification, Eur. Phys. J. A
48 (2012) 46.
doi:10.1140/epja/i2012-12046-1.
URL https://doi.org/10.1140/epja/i2012-12046-1 -
[38]
P. Karvonen, I. D. Moore, T. Sonoda, T. Kessler, H. Penttilä, K. Peräjärvi,
P. Ronkanen, J. Äystö, A
sextupole ion beam guide to improve the efficiency and beam quality at
IGISOL, Nucl. Instrum. Meth. Phys. Res. B 266 (2008) 4794–4807.
doi:10.1016/j.nimb.2008.07.022.
URL https://doi.org/10.1016/j.nimb.2008.07.022 -
[39]
A. Nieminen, J. Huikari, A. Jokinen, J. Äystö, P. Campbell, E. C. A.
Cochrane, Beam cooler
for low-energy radioactive ions, Nucl. Instrum. Meth. Phys. Res. A 469
(2001) 244–253.
doi:10.1016/S0168-9002(00)00750-6.
URL https://doi.org/10.1016/S0168-9002(00)00750-6 -
[40]
G. Savard, S. Becker, G. Bollen, H.-J. Kluge, R. B. Moore, T. Otto,
L. Schweikhard, H. Stolzenberg, U. Wiess,
A new cooling technique
for heavy ions in a Penning trap, Phys. Lett. A 158 (1991) 247–252.
doi:10.1016/0375-9601(91)91008-2.
URL https://doi.org/10.1016/0375-9601(91)91008-2 -
[41]
M. Vilén, L. Canete, B. Cheal, A. Giatzoglou, R. de Groote, A. de Roubin,
T. Eronen, S. Geldhof, A. Jokinen, A. Kankainen, I. Moore, D. Nesterenko,
H. Penttilä, I. Pohjalainen, M. Reponen, S. Rinta-Antila,
A
new off-line ion source facility at IGISOL, Nuclear Instruments and Methods
in Physics Research Section B: Beam Interactions with Materials and Atoms 463
(2020) 382–383.
doi:10.1016/j.nimb.2019.04.051.
URL https://www.sciencedirect.com/science/article/pii/S0168583X19302344 -
[42]
G. Gräff, H. Kalinowsky, J. Traut,
A direct determination of the
proton electron mass ratio, Z Physik A 297 (1980) 35–39.
doi:10.1007/BF01414243.
URL https://doi.org/10.1007/BF01414243 -
[43]
M. König, G. Bollen, H.-J. Kluge, T. Otto, J. Szerypo,
Quadrupole excitation
of stored ion motion at the true cyclotron frequency, Int. J. Mass
Spectrom. Ion Process 142 (1995) 95.
doi:10.1016/0168-1176(95)04146-C.
URL https://doi.org/10.1016/0168-1176(95)04146-C. -
[44]
S. Eliseev, K. Blaum, M. Block, A. Dörr, C. Droese, T. Eronen, M. Goncharov,
M. Höcker, J. Ketter, E. Minaya Ramirez, D. Nesterenko, Y. N. Novikov,
L. Schweikhard, A
phase-imaging technique for cyclotron-frequency measurements, Appl. Phys. B
114 (2014) 107–128.
doi:10.1007/s00340-013-5621-0.
URL https://doi.org/10.1007/s00340-013-5621-0 -
[45]
D. A. Nesterenko, T. Eronen, A. Kankainen, L. Canete, A. Jokinen, I. D. Moore,
H. Penttilä, S. Rinta-Antila, A. de Roubin, M. Vilen,
Phase-Imaging
Ion-Cyclotron-Resonance technique at the JYFLTRAP double Penning trap mass
spectrometer, Eur. Phys. J. A. 54 (2018) 154.
doi:10.1140/epja/i2018-12589-y.
URL https://doi.org/10.1140/epja/i2018-12589-y -
[46]
A. Kellerbauer, K. Blaum, G. Bollen, F. Herfurth, H.-J. Kluge, M. Kuckein,
E. Sauvan, C. Scheidenberger, L. Schweikhard,
From direct to absolute
mass measurements: A study of the accuracy of ISOLTRAP, Eur. Phys. J. D 22
(2003) 53–64.
doi:10.1140/epjd/e2002-00222-0.
URL https://doi.org/10.1140/epjd/e2002-00222-0 -
[47]
D. Nesterenko, T. Eronen, Z. Ge, A. Kankainen, M. Vilen,
Study of radial
motion phase advance during motion excitations in a Penning trap and accuracy
of JYFLTRAP mass spectrometer, Eur. Phys. Jour. A 57 (2021) 302.
doi:10.1140/epja/s10050-021-00608-3.
URL https://doi.org/10.1140/epja/s10050-021-00608-3 -
[48]
F. Kondev, M. Wang, W. Huang, S. Naimi, G. Audi,
The NUBASE2020 evaluation
of nuclear physics properties, Chinese Physics C 45 (3) (2021) 030001.
doi:10.1088/1674-1137/abddae.
URL https://doi.org/10.1088/1674-1137/abddae -
[49]
K.-L. Wang, A. Estrade, M. Famiano, H. Schatz, M. Barber, T. Baumann, D. Bazin,
K. Bhatt, T. Chapman, J. Dopfer, B. Famiano, S. George, M. Giles, T. Ginter,
J. Jenkins, S. Jin, L. Klankowski, S. Liddick, Z. Meisel, N. Nepal,
J. Pereira, N. Rijal, A. M. Rogers, O. B. Tarasov, G. Zimba,
Mass
measurements of neutron-rich nuclei near , Phys. Rev. C, Accepted for
publication (2024).
URL https://journals.aps.org/prc/accepted/cf07dPc9Y8c12000a8b40c3212686033228f3ea27 -
[50]
D. S. Hou, A. Takamine, M. Rosenbusch, W. D. Xian, S. Iimura, S. D. Chen,
M. Wada, H. Ishiyama, P. Schury, Z. M. Niu, H. Z. Liang, S. X. Yan,
P. Doornenbal, Y. Hirayama, Y. Ito, S. Kimura, T. M. Kojima, W. Korten,
J. Lee, J. J. Liu, Z. Liu, S. Michimasa, H. Miyatake, J. Y. Moon, S. Naimi,
S. Nishimura, T. Niwase, T. Sonoda, D. Suzuki, Y. X. Watanabe, K. Wimmer,
H. Wollnik,
First direct
mass measurement for neutron-rich with the new ZD-MRTOF
mass spectrograph system, Phys. Rev. C 108 (2023) 054312.
doi:10.1103/PhysRevC.108.054312.
URL https://link.aps.org/doi/10.1103/PhysRevC.108.054312 -
[51]
J. Kurpeta, W. Urban, A. Płochocki, J. Rissanen, J. A. Pinston, V.-V.
Elomaa, T. Eronen, J. Hakala, A. Jokinen, A. Kankainen, P. Karvonen, I. D.
Moore, H. Penttilä, A. Saastamoinen, C. Weber, J. Äystö,
Signatures of
oblate deformation in the 111Tc nucleus, Phys. Rev. C 84 (2011)
044304.
doi:10.1103/PhysRevC.84.044304.
URL https://link.aps.org/doi/10.1103/PhysRevC.84.044304 -
[52]
R. Orford, A
phase-imaging technique for precision mass measurements of neutron-rich
nuclei with the Canadian Penning Trap mass spectrometer, Ph.D.
thesis, McGill University (2018).
URL https://escholarship.mcgill.ca/concern/theses/6h440v95x -
[53]
S. Rinta-Antila, T. Eronen, V. V. Elomaa, U. Hager, J. Hakala, A. Jokinen,
P. Karvonen, H. Penttilä, J. Rissanen, T. Sonoda, A. Saastamoinen,
J. Äystö, Decay
study of neutron-rich zirconium isotopes employing a Penning trap as a
spectroscopy tool, The European Physical Journal A 31 (1) (2007) 1–7.
doi:10.1140/epja/i2006-10158-9.
URL https://doi.org/10.1140/epja/i2006-10158-9 -
[54]
V. Rakopoulos, M. Lantz, S. Pomp, A. Solders, A. Al-Adili, L. Canete,
T. Eronen, A. Jokinen, A. Kankainen, A. Mattera, I. D. Moore, D. A.
Nesterenko, M. Reponen, S. Rinta-Antila, A. de Roubin, M. Vilén,
M. Österlund, H. Penttilä,
Isomeric fission
yield ratios for odd-mass Cd and In isotopes using the phase-imaging
ion-cyclotron-resonance technique, Phys. Rev. C 99 (2019) 014617.
doi:10.1103/PhysRevC.99.014617.
URL https://link.aps.org/doi/10.1103/PhysRevC.99.014617 -
[55]
Z. Gao, A. Solders, A. Al-Adili, S. Cannarozzo, M. Lantz, S. Pomp,
O. Beliuskina, T. Eronen, S. Geldhof, A. Kankainen, I. D. Moore,
D. Nesterenko, H. Penttilä,
Isomeric yield
ratios in proton-induced fission of , Phys. Rev. C 108
(2023) 054613.
doi:10.1103/PhysRevC.108.054613.
URL https://link.aps.org/doi/10.1103/PhysRevC.108.054613 -
[56]
F. Tondeur, S. Goriely, J. M. Pearson, M. Onsi,
Towards a
Hartree-Fock mass formula, Phys. Rev. C 62 (2000) 024308.
doi:10.1103/PhysRevC.62.024308.
URL https://link.aps.org/doi/10.1103/PhysRevC.62.024308 -
[57]
M. Bender, P.-H. Heenen, P. Bonche,
Microscopic study
of : Mean field and beyond, Phys. Rev. C 70 (2004)
054304.
doi:10.1103/PhysRevC.70.054304.
URL https://link.aps.org/doi/10.1103/PhysRevC.70.054304 -
[58]
S. Goriely, N. Chamel, J. M. Pearson,
Further
explorations of Skyrme-Hartree-Fock-Bogoliubov mass formulas. XIII. The 2012
atomic mass evaluation and the symmetry coefficient, Phys. Rev. C 88 (2013)
024308.
doi:10.1103/PhysRevC.88.024308.
URL https://link.aps.org/doi/10.1103/PhysRevC.88.024308 -
[59]
N. Schunck (Ed.), Energy
Density Functional Methods for Atomic Nuclei, 2053-2563, IOP Publishing,
2019.
doi:10.1088/2053-2563/aae0ed.
URL https://doi.org/10.1088/2053-2563/aae0ed -
[60]
T. R. Rodríguez, J. L. Egido,
Multiple
shape coexistence in the nucleus zr80, Physics Letters B 705 (3) (2011)
255–259.
doi:https://doi.org/10.1016/j.physletb.2011.10.003.
URL https://www.sciencedirect.com/science/article/pii/S0370269311012354 -
[61]
M. Kortelainen, J. McDonnell, W. Nazarewicz, P.-G. Reinhard, J. Sarich,
N. Schunck, M. V. Stoitsov, S. M. Wild,
Nuclear energy
density optimization: Large deformations, Phys. Rev. C 85 (2012) 024304.
doi:10.1103/PhysRevC.85.024304.
URL https://link.aps.org/doi/10.1103/PhysRevC.85.024304 -
[62]
J. Erler, N. Birge, M. Kortelainen, W. Nazarewicz, E. Olsen, A. M.
Perhac, M. Stoitsov,
The limits of the nuclear
landscape, Nature 486 (7404) (2012) 509–512, Values downloaded from the
Massexplorer website http://massexplorer.frib.msu.edu.
doi:10.1038/nature11188.
URL https://www.nature.com/articles/nature11188 -
[63]
I. Angeli, K. Marinova,
Table
of experimental nuclear ground state charge radii: An update, Atomic Data
and Nuclear Data Tables 99 (1) (2013) 69–95.
doi:10.1016/j.adt.2011.12.006.
URL https://linkinghub.elsevier.com/retrieve/pii/S0092640X12000265 -
[64]
J. Libert, M. Girod, J.-P. Delaroche,
Microscopic
descriptions of superdeformed bands with the Gogny force: Configuration
mixing calculations in the 190 mass region, Phys. Rev.
C 60 (1999) 054301.
doi:10.1103/PhysRevC.60.054301.
URL https://link.aps.org/doi/10.1103/PhysRevC.60.054301