Author Umesh Srinivasan was supported in part by the Department of Science & Technology, Ministry of Science & Technology, India under project SR/S3/EECE/0008/2006-SERC-Engg.
On the relationship between speech and hearing
Abstract
We present a framework for experimentally linking speech production and hearing. Using this approach, we describe experimental results, that lead to the concept that sounds made by different individuals and perceived to be the same can be transformed into each other by a “speech scale”. The speech scale is empirically determined using only speech data. We show the similarity of the speech scale to the MEL scale of Stevens and Volkmann, which was derived only from hearing experiments. We thus experimentally link speech production and hearing.
1 Introduction
For speech communication, nature has provided both a speech “transmitter” and “receiver”; therefore, speech production and hearing must be highly coupled systems. While a particular individual has only one receiver (the ear), one has to understand and classify sounds from many different transmitters (speakers). This is because, when different individuals enunciate sounds which are perceived to be the same, the actual acoustical waveforms are different, the corresponding spectra are different, and the location and separation of the formants are different. However, since they are perceived to be the same, the enunciations must have a commonalty that the ear extracts in recognizing the similarity of the sounds. We call this the speech-hearing connection and the understanding of this issue the speech-hearing problem.
In 1940, Stevens and Volkmann established the fundamental psychoacoustic response of the ear, known as the MEL scale [3]. It relates perceived frequency, , and the actual physical frequency, , of the sound wave. The MEL scale is solely based on psychoacoustic hearing experiments. We have performed speech experiments aimed at showing the common attributes of speech signals of perceptually similar sounds. Our experiments establish a “speech scale”, which is based solely on speech production and has led us to the following view of the speech-hearing connection. The spectra of sounds made by different individuals and perceived to be phonologically identical can be transformed into each other by a universal frequency-warping function. The transformation results in identical spectra, except for a speaker dependent translation factor. We call the universal frequency-warping function the speech-scale. We show that the experimentally obtained “speech scale” is similar to the MEL scale and, therefore, we argue that we have experimentally linked speech and hearing. We emphasize that our speech scale was obtained solely from speech experiments and in no way used any results of the psychoacoustic MEL scale or any other hearing data.
The organization of the paper is as follows. In the next section we give an simplified overview of our approach and the basic concepts we have used to establish a ”speech scale”. In section 3 we describe the mathematical issues and the details of the method used to estimate speech-scale. In Section 4 we discuss the similarity between speech-scale and mel-scale. Discussion and conclusions are made in Section 5.
2 An overview of the approach
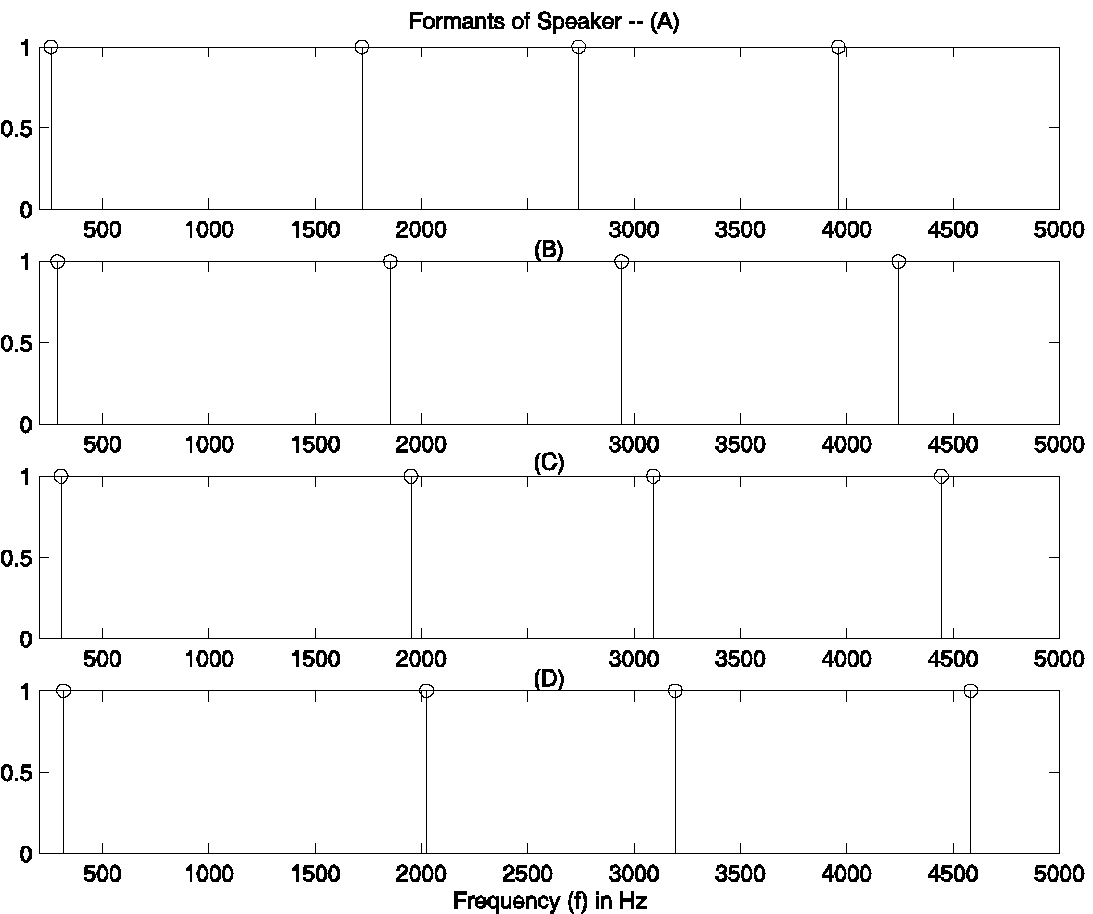
We first explain the basis and motivation of our approach with a simple idealized example. Suppose, hypothetically, that we have the utterances of four persons enunciating a particular vowel, say /aa/. We may say that the vowel is the same in each instance if critical listeners agree that they hear the same sound for each of the utterances. Now suppose we take the spectra, that is Fourier transform, of each person’s utterances and plot them as in Fig. 1, where for simplicity, we only plot the formants (resonant frequencies). For the case of illustration here we have generated these formants for /aa/ by using the two-tube model for speech production [9]. 111In a two-tube model represents the length and area of the “pharyngeal” cavity or the part starting from the vocal cords at the back of the mouth and represents the length and area of the “oral” cavity, the part ending at the lips or the front part of mouth. The ratio of the pharyngeal cavity to the oral-cavity lengths, that is is largest for men, intermediate for women and smallest for children. Usually only changes significantly from speaker to speaker, while is similar among different speakers. Therefore, in our example, we have maintained and the ratio of areas constant, while changing the lengths of . The lengths of have been appropriately varied so that the corresponding formants correspond to that of different speakers.
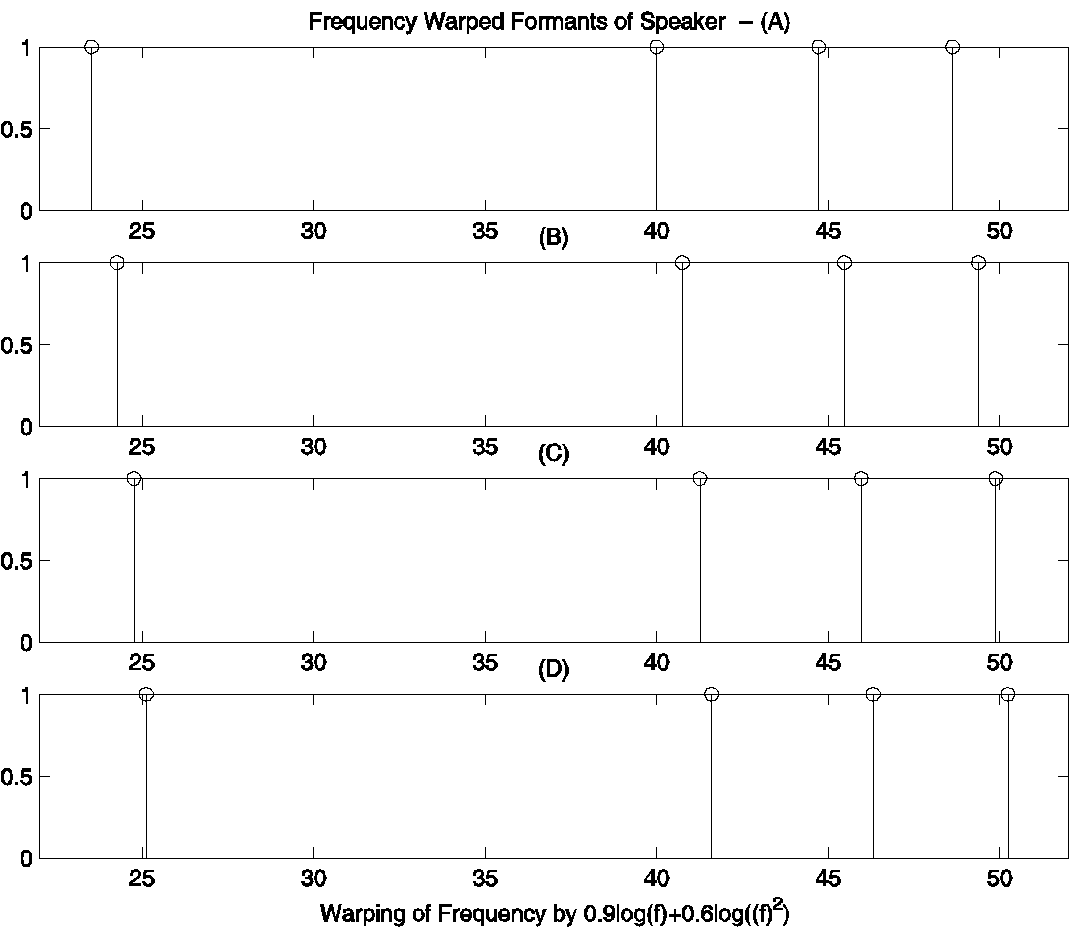
Now, as can be seen in Fig. 1, the spectra, that is, the formant frequency locations are different, but, since the utterances are perceived to be the same, they must have something in common. What is this communality? In other words, what do these spectra have in common? We emphasize that the spectra are not merely translated versions of each other as that would make the issue trivial. Indeed if they were translated versions of each other that could be readily determined in a variety of ways. If they are not translated versions of each other, then one may ask whether there exists a transformation of each spectra that would indeed make them identical or possibly translated versions of each other. Such a transformation would be non-linear. Such transformations are often called warping functions because one can think of a non-linear transformation as a warping of the axis. What is important here is to emphasize that, if there exists such a transformation, then it must be universal to be of any significance. By universal we mean that the same transformation is used for each speaker and it must not be adjusted for different speakers. For illustration purposes we now do precisely that for the above formant example and take each spectrum and warp the frequency-axis by a function which we call the “universal warping function”. We denote the frequency-warping function as , and for this illustrative example we have used the function . The result of applying this function to each of the spectra is illustrated in Fig. 2. We again note that we use the term “universal warping function” to emphasize the fact that the spectra are transformed by the same warping function irrespective of the speaker. In the next section, we will discuss how one arrives at such warping functions for idealized cases and more importantly in Section 4 we will describe how one can empirically obtain such a function for real speech. We also emphasize here that whether such a universal function exists or not is an empirical question and can only be ascertained by the real data.
Now examine Fig. 2. It can be seen that:
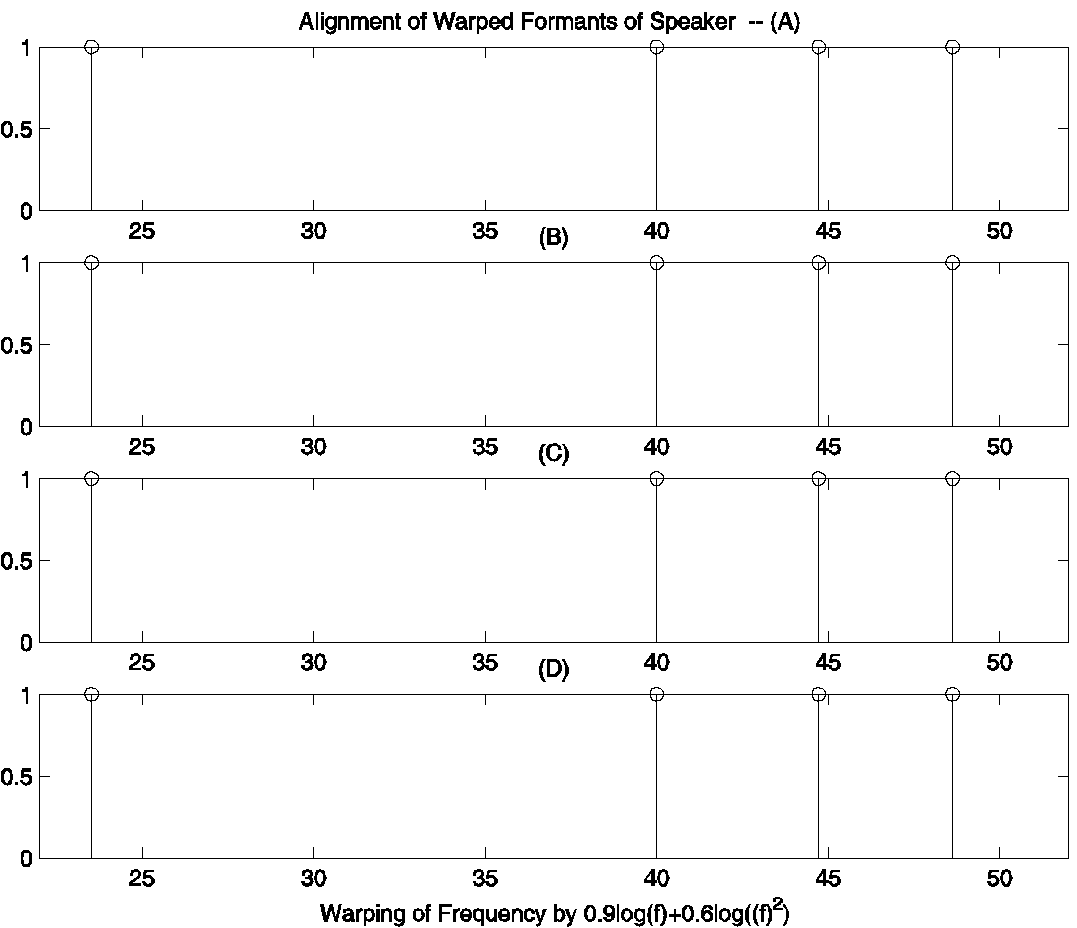
a) the transformed spectra are merely shifted versions of one and another and hence we have exposed the commonalty of the original spectra of Fig. 1. To emphasize this, we align the spectra with the first line, as illustrated in Fig. 3. Now one clearly sees that indeed they are identical. (We note that in general there are many ways to determine whether spectra are shifted versions of each other, the most fundamental way is to note that the absolute value of the Fourier transform of a function and a translated version of a function are equal.)
b) the shift is different for each transformed spectrum, and, hence, the shift is speaker dependent.
We again emphasize that although Fig.1 looks similar to Fig.2, it can be easily verified that simple shifting (or scaling) will not align the spectra of Fig.1. It is only after the application of the “universal warping function” that the spectra appear as shifted versions of each other. Of course, for real speech, we do not know whether such a “universal-warping function” exists, and, if it does exists, we do not know the form of the universal warping function. The purpose of this article is to describe experimental evidence indicating that, indeed, such a universal warping function exists and to develop the numerical procedures to obtain it from real speech.
3 Mathematical and Experimental issues
Our basic idea is that the spectra of sounds made by different individuals and perceived to be the same can be transformed into each other by a universal warping function and that the transformation results in identical warped spectra except for a translation factor. We denote the transformation from physical frequency, , to an alternate domain as the speech-scale, and write
| (1) | ||||
| (2) |
Suppose we have two enunciations by different speakers, and , with corresponding spectra and . We warp each spectrum with the universal function, , to obtain two new spectra and defined by the following procedure:
| (3) | ||||
| (4) |
then we claim that, for enunciations which are perceived to be the same, the warped spectra are related by
| (5) |
where is a constant. In general, we use the notation that spectra in physical frequency are represented as and spectra in the warped domain are represented as . If the claim is correct, the question arises how can one show it and how can one determine the universal transformation that we call the speech scale. Before describing our approach, we must emphasize two things. First, even though we have used two speakers in the above formulation, it is crucial to understand that this must be true for all speakers. That is, it is crucial that the same universal-warping function is applicable to all speakers and all phonemes or speech sounds. Secondly, whether this view and mathematical relationship are true, or not, can only be determined experimentally using actual speech data.
We have been motivated by Fant’s seminal work [1, 2] where he considers relationship between formants of different speakers. First, we discuss a very simplified model where we model the vocal tract as a uniform tube. For a uniform tube the spectra (or formant frequencies) are inversely proportional to the length of the tube. Hence for different speakers having different tube-lengths, the spectra are related by
| (6) |
where is the ratio of the lengths of the tubes for the two speakers. Recalling that multiplication becomes addition after the application of log operation, the universal warping function for this simplified model is . This can be easily verified since
| (7) |
Fant [1, 2] pointed out that Eq. 6 is a very crude model and has observed that the scaling factor changes for different formant frequencies for any two speakers. Motivated by Fant’s observation we model the relationship between spectra of two speakers by the following piece-wise linear model
| (8) |
where are lower and higher frequencies of a frequency region. The parameter depends only on the pair of speakers and not on frequency. is a constant that is independent of speakers and depends on only the frequency region . We have estimated the frequency-dependent parameter by doing least-squares fit on actual speech data. In all of the experiments in this paper, we have used the Hillenbrand speech (vowel) database[5]. The piece-wise linear approximation to universal-warping function , is then given by
| (9) |
The use of this universal-warping function helps separate the speaker-dependent term as a translation factor and show the commonality in the speech spectra from different speakers. We refer to this universal-warping function as the speech-scale
4 Relationship between MEL scale and the speech scale.
Stevens and Volkmann [3] experimentally obtained a non-linear mapping between perceived and physical frequency of a tone and referred to it as the mel-scale. We have obtained a speech scale which has been purely estimated only from speech data with the primary purpose to show the commonality speakers for the same utterance. In Fig. 4 we plot both the speech scale and Stevens and Volkmann [3] data, that is, the MEL scale. (In addition we have also plotted the von Békésy basilar membrane data but this issue will be discussed in the conclusion.) From the figure, it can be seen that the two curves are remarkably similar. We reiterate, that one has obtained from psychoacoustic experiments and the other only from speech data. The fact that the two curves are remarkably similar experimental shows the connection between speech and hearing.

![[Uncaptioned image]](/html/2402.12094/assets/x2.png)
To further show the similarities between the the speech scale and MEL scale, we point out that the widely accepted closed-form approximations to mel-scale have the functional form
| (10) |
where is in Hz and is in Mels. Here we have used the mel-formula which is most commonly used in speech and defined with and , i.e.
| (11) |
We now take our speech scale and fit it to Eq. (10 (with fitting accuracy of ) to obtain continuous warping function . The warping function is given by
| (12) |
Thus we see that indeed is approximately equal to
As further evidence of the ability of the speech scale to extract the commonality among different speakers enunciating the same sound, we apply it to study the formants of different speakers for the vowel /AW/. In Fig. 4a, we show the natural frequencies of three formants of /AW/ for each of the 139 different speakers in the Hillenbrand database. For each speaker, the three formant frequencies have been marked by different symbols along the axis. As seen, there is considerable variability in the formant frequencies among different speakers. We now apply the speech scale to the data of Fig. 4a and translate each of the resulting spectra to obtain the best overall alignment [12]. The results of this process are shown Fig. 4b. As seen, after the application of the speech scale, the formants are aligned remarkably well showing the commonality among speakers for the vowel /AW/. In a future paper we will present results for all the vowels.
5 Discussion and Conclusion
As we have noted, speech and hearing must be a highly coupled. If one could demonstrate a relationship between the results of hearing experiments and the results of speech experiments, a fundamental experimental link would be established. We believe that we have done that. Using real speech data and only speech we have experimentally obtained a “speech scale”, which is a warping of the speech spectrum that exposes the communality of sounds which are perceived to be the same. Our experiments are analogous to the basic psychoacoustic scale obtained by Stevens and Volkmann [3] which was obtained solely on hearing data. The fact that they are almost the same and derived totally independently, one from speech and the other from hearing shows the coupling or communality between speech and hearing and experimentally establishes the speech-hearing connection. In addition there is another scale that is of relevance which we now discuss. It is the frequency to physical place mapping on the basilar membrane which is based entirely on physical aspects of the basilar membrane. This place map, representing the behavior of the basilar membrane as a function of frequency was discovered by von Békésy [7] in his studies, for which he won a Nobel prize. In his experiments the stapes was vibrated with a constant amplitude sinusoid, and the frequency response at various points along the basilar membrane was examined under the microscope. The mapping relating the frequency of the stimulation to the position of maximum response on the basilar membrane was thus established. Is there a relationship between the Mel scale and the place map of von Békésy? This question was addressed by von Békésy, himself, who noticed the fundamental significance of the fact that they are similar and noted “If we plot the distance from the stapes of the point of maximum displacement versus frequency, the curve obtained has the general form of the curves inferred from psycho-physiological data”.
We now compare the speech scale, the Mel scale and the place map of von Békésy. The results are shown in Fig. 4. The fact that the three, independent, experimentally derived scales, namely the place map, the MEL scale and the speech scale, are so similar is an indication that they may be the basic fundamental experimental linking of the speech-hearing connection.
References
- [1] C. G. M. Fant, “Acoustic description and classification of phonetic un its,” in Ericcson Technics, no. 1, 1959, reprinted in Speech So end and Features, MIT Press, Cambridge, 1973.
- [2] G. Fant, “A Non-Uniform Vowel Normalization,” STL-QPSR , no. 2-3, pp. 1–19, 1975.
- [3] S. S. Stevens and J. Volkman, “The relation of pitch to frequency,” American Journal of Psychology, vol. 53, p. 329, 1940.
- [4] G. E. Peterson and H. L. Barney, “Control Methods Used in a Study of the Vowels,” J. Acoust. Soc. America, vol. 24, pp. 175–184, M arch 1952.
- [5] J. Hillenbrand, L. Getty, M. Clark, and K. Wheeler, “Acoustic Characteristics of American English Vowels,” J. Acoust. Soc. Am., vol. 97, pp. 3099–3111, May 1995.
- [6] S. Umesh, L. Cohen, and D. Nelson, “Fitting the Mel Scale”, in Proc. IEEE ICASSP ’99, pages217–220, (1999).
- [7] G. v. Békésy and W. A. Rosenblith in Handbook of Experimental Psychology (S. S. Stevens, ed.), (New York), pp. 985–1039, John Wiley, 1951.
- [8] Georg von Békésy, Experiments in Hearing, McGraw-Hill, New York, 1960
- [9] J. L. Flanagan, Speech Analysis and Perception, Springer-Verlag, New York, 1972
- [10] L. Cohen, “The Scale Representation,” IEEE Trans. Signal Proc., pp. 3275–3292, Dec. 1993.
- [11] S. Umesh, L. Cohen, N. Marinovic, and D. Nelson, “Scale Transform In Speech Analysis,” IEEE Transactions on Speech and Audio Processing, January 1999.
- [12] D.J. Nelson, D.C. Smith, S. Umesh and L. Cohen, “Estimating Speaker Scale Factors From Vowels,” Proc. SPIE Wavelet Conf., pp. 794-800, San Diego, 4-8 Aug., 2003.