Revision of the GeV -ray Emission in the Region of HESS J1813-178 with Fermi-LAT
Abstract
HESS J1813-178 is one of the brightest and most compact TeV -ray sources, and whether its -ray emission is associated with supernova remnant (SNR), pulsar wind nebula (PWN) or young stellar cluster (YSC) is still under debate. By analysing the GeV -ray data in the field of HESS J1813-178 using 14 years of PASS 8 data recorded by the Fermi Large Area Telescope (Fermi-LAT), we report the discovery of three different sources with different spectra in this region. The hard source with a power law spectral index of 2.11 0.08 has a small size extension, which is spatially and spectrally coincident with the TeV -ray emission from HESS J1813-178. CO observations display the dense molecular clouds surrounding HESS J1813-178 in the velocity range of 45-60 km s-1. The possible origins of the -ray emission from HESS J1813-178 are discussed, including SNR G12.82-0.02, the PWN driven by the energetic X-ray pulsar PSR J1813-1749, and YSC Cl 1813-178. However, none of them can be ruled out clearly. Note that the maximum energy of protons in the hadronic model should exceed a few hundred TeV, which makes HESS J1813-178 to be a promising PeVatron. The detailed LHAASO data analysis about the morphology and spectrum would be helpful to investigate the origin of the -ray emission in this region and test its PeVatron nature.
1 Introduction
Very high energy (VHE; 100 GeV) surveys of our Galaxy with the ground based -ray detectors, like H.E.S.S., MAGIC, HAWC and LHAASO, have uncovered a population of -ray sources in the TeV regime and revealed the very energetic cosmic accelerators in our Galaxy. More than two hundred of VHE -ray sources have been detected(H. E. S. S. Collaboration et al., 2018a; Albert et al., 2020; Cao et al., 2023), most of which have been identified to be PWNe, SNRs, binaries, TeV halos and so on. However, a large fraction of the sources still remain without firm association, and the multi-wavelength observations of these sources are crucial for revealing their nature and elucidate the origin of cosmic rays (CRs) around the knee energy range.
As one of the brightest and most compact objects detected by the H.E.S.S. Galactic Plane Survey (HGPS) observations, HESS J1813-178 was detected to be nearly point-like with an extension of (Aharonian et al., 2005, 2006). The TeV -ray emission from HESS J1813-178 shows a power-law spectrum with a rather hard photon index of 2.090.08, and the following MAGIC observations give the similar spectrum with an index of 2.10.2 in the energy range of 0.4-10 TeV (Albert et al., 2006). In H. E. S. S. Collaboration et al. (2018a), the extension of HESS J1813-178 was updated to be , and the spectrum above 1 TeV follows a power law with an exponential cutoff of 7 TeV.
In the First LHAASO Catalog of Gamma-Ray Sources, both the Water Cherenkov Detector Array (WCDA) and Kilometer Squared Array (KM2A) of LHAASO detected a -ray source in the region of HESS J1813-178, 1LHAASO J1814-1719u, in the energy range of 1-25 TeV and above 25 TeV, respectively (Cao et al., 2023). The spatial template of 1LHAASO J1814-1719u for WCDA is described by a two dimensional (2D) Gaussian with , and its -ray spectrum in 1-25 TeV is modeled by a power law with an index of 2.83 0.06. KM2A gives an upper limit of the extension of 1LHAASO J1814-1719u with , together with the power law spectral index of 3.49 0.31 above 25 TeV (Cao et al., 2023).
HESS J1813-178 is positionally coincident with a shell-type SNR G12.82-0.02, which lies in the vicinity of a bright star forming region (SFR) W33 (Brogan et al., 2005). And non-thermal X-ray emission was also detected in this region (Brogan et al., 2005; Landi et al., 2006). Deep X-ray observations from XMM-Newton and Chandra revealed a PWN embedded near the center of SNR G12.82-0.02, which makes G12.82-0.02 to be a composite system (Funk et al., 2007; Helfand et al., 2007; Gotthelf & Halpern, 2009). The PWN component is powered by an energetic pulsar, PSR J1813-1749, and its spin-down luminosity and characteristic age are and , respectively (Halpern et al., 2012; Ho et al., 2020). A young stellar cluster at a kinematic distance of 4.8 kpc, Cl 1813-178, was discovered in the TeV -ray emission region of HESS J1813-178 (Messineo et al., 2008, 2011). PSR J1813-1749/SNR G12.82-0.02 was first suggested to be associated with Cl 1813-178 at the same distance (Messineo et al., 2011). While the newest radio observation from Green Bank Telescope shows a large dispersion measure for PSR J1813-1749, which indicates a far distance of either 6.2 or 12 kpc according to the different models of the electron density distribution (Camilo et al., 2021).
The origin of the -ray emission from HESS J1813-178 is still not identified. The scenarios of PWN, SNR and stellar cluster are discussed in previous works. Using the NANTEN 12CO(=1-0) observations, Funk et al. (2007) detected a giant molecular cloud (MC) in the south of HESS J1813-178, which is suggest to be associated with SFR W33. With the X-ray and molecular observations, the scenarios in which the -rays of HESS J1813-178 are emitted from the shell of the SNR and one in which they are emitted from the central PWN are modeled. None of them can be clearly ruled out. Fang & Zhang (2010) also predicted that the TeV -ray emission is mainly originated from the PWN associated with PSR J1813-1749, although the contribution from the SNR shell could be enhanced with a denser medium. With the Fermi-LAT data, Araya (2018) found extended GeV -ray emission around HESS J1813-178 with a radius of 0.6∘. Such size is much larger than that of the TeV -ray emission of HESS J1813-178. The global GeV spectrum in the energy range of 0.5-500 GeV was fitted by a power-law with an index of 2.140.04, which is not consistent with the inverse Compton scattering (ICS) emission characteristic from leptons in a PWN. Araya (2018) argued that the extended GeV emission may be related to the SFRs around HESS J1813-178, like W33.
Considering the uncertain origin and the complexity of HESS J1813-178, the detailed analysis with more GeV observational data and the multi-wavelength observations would be helpful to investigate the origin of the -ray emission in this region, we re-analysed the Fermi-LAT PASS 8 data around HESS J1813-178 in this work. The data analysis procedure and results, including the spatial and spectral analysis, are shown in Section 2. In Section 3, the observation of the molecular clouds around HESS J1813-178 is introduced. We discuss the origin of the -ray emission from HESS J1813-178 based on the multi-wavelength observations in Section 4. The conclusion of this work is presented in Section 5.
2 Fermi-LAT Data Analysis
2.1 Data Reduction
In the following analysis, the latest Pass 8 data with “Source” event class are selected from 2008 August 4 (MET 239557418) to 2022 August 4 (MET 681264005). The energies of events are cut between 500 MeV and 1 TeV to avoid a too large point spread function (PSF) in the lower energy band. Meanwhile, the maximum zenith angle is adopted to be 90∘ to minimize the contamination from the Earth Limb. The analysis is performed in a 14 square region of interest (ROI) with the standard LAT analysis software ScienceTools. The binned likelihood analysis method with gtlike is adopted, together with the instrumental response function of “P8R3_SOURCE_V3”. The Galactic and isotropic diffuse backgrounds are modeled by gll_iem_v07.fits and iso_P8R3_SOURCE_V3_v1.txt, respectively. All sources listed in the incremental version of the fourth Fermi-LAT source catalog (4FGL-DR4; Abdollahi et al., 2022; Ballet et al., 2023) within a radius of 20∘ from the ROI center, together with the two diffuse backgrounds, are included in the model, which is generated with the user-contributed script make4FGLxml.py.
2.2 Spatial Analysis
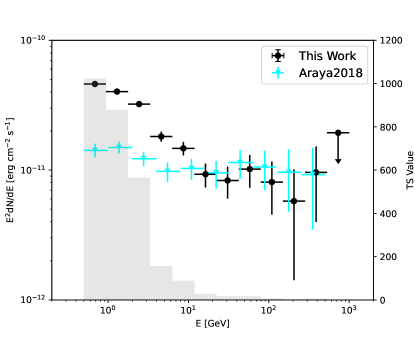
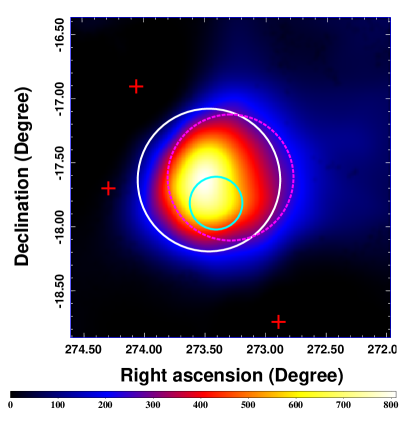
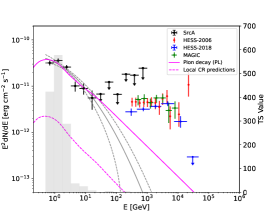
In 4FGL-DR4 catalog, there is an extended GeV -ray source (4FGL J1813.1-1737e) described by an uniform disk with a radius of 0.6∘, which is regarded as the potential GeV counterpart of HESS J1813-178 (Araya, 2018; Abdollahi et al., 2022). However, the size of 4FGL J1813.1-1737e is much larger than that of TeV -ray emission from HESS J1813-178 (; H. E. S. S. Collaboration et al., 2018a). To investigate the GeV -ray emission around HESS J1813-178, we first refit the centroid and size of the uniform disk for 4FGL J1813.1-1737e with Fermipy, a PYTHON package that automates analyses with ScienceTools (Wood et al., 2017). The best-fit centroid position and 68% containment radius (R68) are fitted to be R.A. = , decl. = , and , respectively. With the refit spatial model (Model 1), we get its GeV spectrum by dividing the data into 12 equal logarithmic energy bins from 500 MeV to 1 TeV. The likelihood fitting analysis is done for each energy bin and the 95% upper limits are calculated for the energy bins with Test Statistic (TS; Lande et al., 2012) values smaller than 5.0. The resulting spectral energy distribution (SED) of 4FGL J1813.1-1737e is shown in Figure 1, and an obvious spectral upturn is shown below an energy of about 10 GeV compared with the results from Araya (2018).
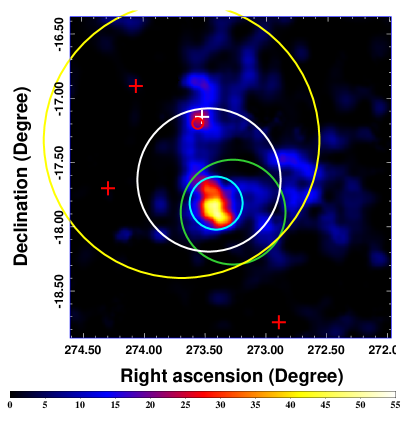
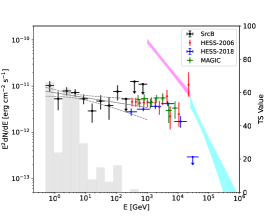
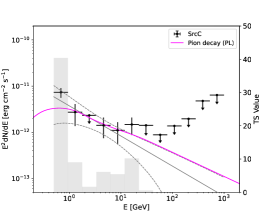
To test whether the upturn spectrum is intrinsic or is due to two overlapping components, we do the same likelihood fitting using the events with energies of 500 MeV - 10 GeV (low energy) and 10 GeV - 1 TeV (high energy), respectively. In the low energy range, we only select the “PSF3” events with the best quality of the reconstructed direction to reduce the uncertainties caused by large PSF. In the high energy range, all events are collected in order to have sufficient counts for the detailed analysis. For each analysis, we first create a TS map with all sources (except 4FGL J1813.1-1737e) included in the best-fit model (hence subtracted from the map), which are shown in Figure 2. The TS maps in the low and high energy bands show a clear difference of the centroids and sizes of the -ray emission. We thus expect two different -ray components in this region, which are labeled as SrcA for the low energy band and SrcB for the high energy band. To determine the morphology of the -ray emission from SrcA/SrcB, we used Fermipy to test the size of the uniform disk with the events of 500 MeV - 10 GeV (“PSF3”) and 10 GeV - 1 TeV (“Source”), respectively. The spectrum of SrcA or SrcB are first assumed to be a power-law (PL; dN/dE E-α) model. In the low energy band, the centroid position and R68 of SrcA are fitted to be R.A. = , decl. = , and , respectively. The -ray spectrum of SrcA in the low energy band is soft with an index of 2.55 0.04. While in the high energy band, the best-fit centroid position and R68 of SrcB are R.A. = , decl. = , and , respectively. The spatial extension of SrcB is more compact than that of SrcA, and the GeV -ray emission of SrcB concentrates in the TeV -ray emission region of HESS J1813-178 (Aharonian et al., 2006), while the fitted -ray spectrum of SrcB in the high energy band is hard with an index of 1.97 0.17. In addition, the TS map in the high energy range shows an additional point source in the north region of SrcB, which is not included in 4FGL-DR4 catalog, but is in 4FGL-DR2 catalog (4FGL J1814.1-1710; Ballet et al., 2020). The point source (hereafter labeled as SrcC) is suggested to be associated with SNR G13.5+0.2 in 4FGL-DR2 catalog. Then we use the updated model including the two extended spatial templates of SrcA and SrcB (Model 2) and the additional SrcC (Model 3) to fit the data in the energy range of 500 MeV - 1 TeV. Meanwhile, the models for 4FGL J1813.1-1737e and SrcA/B with two dimensional Gaussian template (Model 4-6) are also tested, and the overall maximum likelihood values of the different models are listed in Table 1. We adopt the Akaike information criterion (AIC; Akaike, 1974)111AIC = -2ln+2k, where is the value of maximum likelihood and k is the parameter numbers of model. to compare the different models by calculating AIC, the difference between Model 1 and Model 2-6. It is evident from Table 1 that the model including the two uniform disks for SrcA and SrcB and the additional point source SrcC provides the minimum AIC value, which is adopted as the spatial model in the following spectral analysis.
| Spatial Template | R.A., Decl. | R68 | Degrees of Freedom | -log(Likelihood) | AIC |
| Single uniform disk (Model 1) | , | 5 | -6277434.8 | 0 | |
| Two uniform disks (Model 2) | SrcA: , SrcB: , | SrcA: SrcB: | 10 | -6277459.5 | -39.4 |
| Two uniform disks + Point Source (Model 3) | SrcC: , | – | 14 | -6277473.7 | -59.8 |
| Single Gaussian Template (Model 4) | , | 5 | -6277450.0 | -30.4 | |
| Two Gaussian Templates (Model 5) | SrcA: , SrcB: , | SrcA: SrcB: | 10 | -6277456.0 | -42.4 |
| Two Gaussian Templates + Point Source (Model 6) | SrcC: , | – | 14 | -6277467.5 | -47.4 |
2.3 Spectral Analysis
With the best-fit spatial model including SrcA/B/C in this region, we compared fits using power-law and log-parabola (LogPb; dN/dE E) spectral functions to find the best model among the two for SrcA/B in the energy range of 500 MeV - 1 TeV. SrcC is spatially coincident with SNR G13.5+0.2, not with HESS J1813-178, and its spectrum is fixed to be a power-law model. The spectral index of SrcC is fitted to be , with the integrated photon flux of photon cm-2 s-1. The fitting results with the different spectral models for SrcA/B are listed in Table 2. We compared the overall likelihood values with the PL models for SrcA/B, and the variation suggests an evidence of spectral curvature for the -ray spectrum of SrcA with TScurve=2(-) = 9.0, which corresponds to a significance of 3.0 with one additional degree of freedom. The fitting of the LogPb model for SrcA gives the spectral parameters of and . The integrated photon flux of SrcA is calculated to be photon cm-2 s-1 with the TS value of 1358.9. For SrcB, a power-law spectrum is enough to describe its -ray emission with the spectral index of . The corresponding integrated photon flux is calculated to be photon cm-2 s-1 with the TS value of 270.6.
| SrcA | SrcB | Degrees of Freedom | -log(Likelihood) | TScurve |
| PL | PL | 4 | -6277473.7 | 0.0 |
| LogPb | PL | 5 | -6277478.2 | 9.0 |
| PL | LogPb | 5 | -6277473.7 | 0.0 |
| LogPb | LogPb | 6 | -6277476.4 | 5.4 |
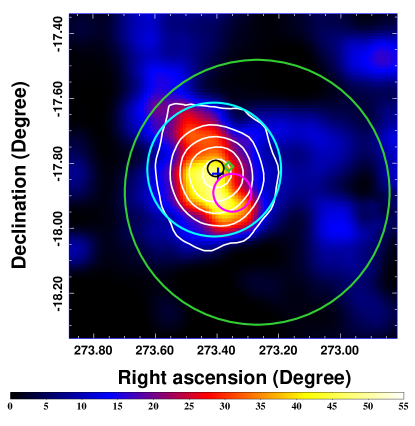
To obtain the SED of SrcA/B/C, we divide the data from 500 MeV to 1 TeV into 12 bins in energy equally-spaced logarithmically, and perform the same likelihood fitting analysis for each energy bin. For the energy bin with TS value of SrcA/B/C lower than 5.0, an upper limit with 95% confidence level is calculated. The results of the SED are shown in Figure 4, and the global fitting with the PL or LogPb models are also overplotted. The SED of SrcA shows a soft GeV -ray spectrum, which is not consistent with the TeV -ray SED of HESS J1813-178. While the hard GeV -ray spectrum of SrcB smoothly connects with the TeV spectrum of HESS J1813-178. Also considering the spatial coincidence and compact -ray emission region between SrcB and HESS J1813-178 shown in Figure 3, we suggest that SrcB is the GeV counterpart of HESS J1813-178.
3 CO observations
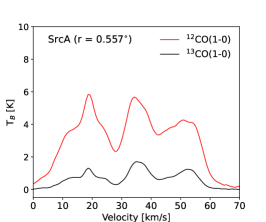
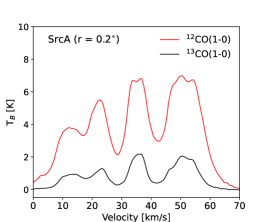
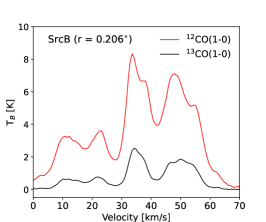
To search for molecular clouds, spatially and morphologically coincident with the -ray emission around HESS J1813-178, we analyzed the 12CO(=1-0) and 13CO(=1-0) line data observed by the FOREST Unbiased Galactic plane Imaging survey with the Nobeyama 45 m telescope (FUGIN; Umemoto et al., 2017). The Nobeyama telescope has a beam size of 14” at 115 GHz, which results in a postreduction 12CO(=1-0) angular resolution of 20” and a 13CO(=1-0) angular resolution of 21” for FUGIN survey data with the velocity resolution of 1.3 km s-1.
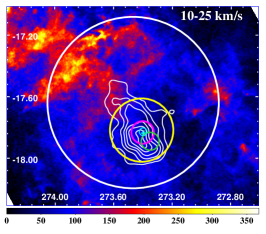
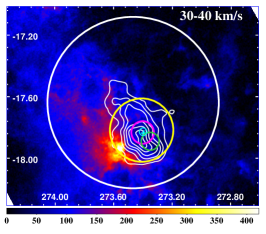
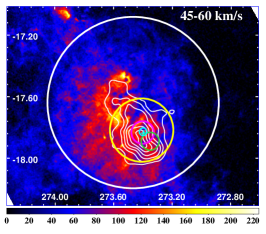
The spectra of 12CO(=1-0) and 13CO(=1-0) emission are extracted toward SrcA within a radius of and , and HESS J1813-178 within a radius of , which are shown in the top panels of Figure 5. The spectra display three distinctive peaks in the velocity intervals of 10-25, 30-40, and 45-60 km s-1, and the 12CO( = 1–0) intensity maps in the corresponding ranges are shown in the bottom panels of Figure 5. Note that the molecular cloud at 30-40 km s-1 has been studied by Funk et al. (2007) with the NANTEN 12CO(=1-0) observations, which is suggested to be related with the star-forming region W33. Although the molecular gas in the velocity ranges of 10-25 and 30-40 km s-1 are partly overlapping with the -ray emission, the wide distribution of molecular gas in the range of 45-60 km/s in the -ray emission region makes the correlation more likely for the scenario in which the -rays are produced by interactions of cosmic rays with the gas.
Adopting the standard Galactic rotation model in Reid et al. (2014), we calculated the possible kinematic distances associated with the velocity range of 45-60 km s-1. It should be noted that the velocity of each MC could indicate two candidate kinematic distances, the near-side one and the far-side one. The near and far distances of the MC in 45-60 km s-1 are calculated to be 3.9-4.6 kpc and 11.5-12.1 kpc, which are in accord with the values of 4.8 0.3 kpc for the young stellar cluster, Cl 1813-178, and the higher value of 12 kpc for PSR J1813-1749/SNR G12.82-0.02.
Adopting the CO-to-H2 conversion factor cm-2 (K km s (Bolatto et al., 2013), we calculated the total mass of molecular gas within the 68% containment radius of extended GeV -ray emission for SrcA (r = ) and HESS J1813-178 (r = ) with the different distances. For the distance of 4.8 kpc, the total masses of gas within SrcA and HESS J1813-178 are estimated to be and , respectively. The corresponding average gas number densities are about = 170 cm-3 and 720 cm-3 by assuming a spherical geometry of the gas distribution. For the distance of 12 kpc, the calculated total masses of gas within SrcA and HESS J1813-178 are and with the corresponding average gas number densities of 70 cm-3 and 300 cm-3.
4 Discussion
The spatial and spectral data analyses with the different energy ranges reveal that the diffuse GeV -ray emission around HESS J1813-178 can be distinguished into three separate components. SrcA with an extension of has a soft GeV -ray spectrum, which has no identified associated counterpart, and a point source in the north of HESS J1813-178, SrcC, is spatially associated with the SNR G13.5+0.2. For SrcB, the GeV -ray emission region is more compact than SrcA, which is spatially coincident with the TeV -rays of HESS J183-178. The GeV -ray spectrum of SrcB is hard with an index of 2.11, which also smoothly connects with the TeV spectrum of HESS J1813-178. Both the spatial morphology of the -ray emission and the GeV-TeV -ray spectrum suggest that SrcB could be the GeV counterpart of HESS J1813-178. Moreover, the CO observations display that the intensity of the -ray emission from SrcA and HESS J1813-178 spatially correlate with the molecular gas distribution in the velocity range of 45-60 km s-1. Such velocity range indicates two candidate kinematic distances, and the near one is in accord with the distance of the young stellar cluster, Cl 1813-178, of 4.8 kpc. The far one with 12 kpc is in accord with the distance of PSR J1813-1749/SNR G12.82-0.02 system.
4.1 The possible -ray origin of HESS J1813-178
Considering the association between HESS J1813-178 and PSR J1813-1749/SNR G12.82-0.02 or Cl 1813-178 at the different distances, here we discuss these two possibilities as the origin of HESS J1813-178. The -ray emission can be produced by the decay of neutral pions due to the inelastic nuclei-nuclei collisions, which is the hadronic process. In addition, the leptonic process, that is the inverse Compton scattering or the bremsstrahlung (Brem) process of relativistic electrons, can also produce the intense -ray emission. For the model fitting, the TeV observations of HESS J1813-178 from H.E.S.S. (Aharonian et al., 2006; H. E. S. S. Collaboration et al., 2018a) and MAGIC (Albert et al., 2006) are adopted. The observations by LHAASO-WCDA show a larger extension and a higher flux of the -ray emission around HESS J1813-178 in the energy range of 1-25 TeV (Cao et al., 2023), which are not consistent with the results of H.E.S.S. and MAGIC. Such results could be due to the contributions from the unresolved -ray sources in the more extended -ray region of LHAASO-WCDA. LHAASO-KM2A gives an upper limit of the extension of the -ray emission above 25 TeV, and its spectrum also could connect with that of H.E.S.S. and MAGIC. Therefore, only LHAASO-KM2A data are used in the following model fitting.
4.1.1 PWN or SNR scenario at the distance of 12 kpc
| Model | Ee,break(GeV) | Ee,cut(TeV) | We(erg) | B(G) | ||||
| ICS-dominated (one-zone) | 1.0 | 110.80/45=2.46 | ||||||
| Brem-dominated (one-zone) | 300.0 | 141.07/45=3.13 | ||||||
| ICS-dominated (zone 1) | – | – | 1.0 | 85.14/43=1.98 | ||||
| ICS-dominated (zone 2) | – | – | 1.0 |
The PWN component associated with PSR J1813-1749 was first resolved by Helfand et al. (2007) using the observations of Chandra. The spectrum of the PWN follows a power law with an index of 1.3, and an absorbed flux of 5.6 10-12 erg cm-2 s-1 is obtained in the energy range of 2-10 keV. Following XMM-Newton observations also resolved the PWN with an spectral index of 1.8 and an absorbed flux of 7 10-12 erg cm-2 s-1 from 2 to 10 keV (Funk et al., 2007). In the high energy band of 20-100 keV, INTEGRAL discovered a soft -ray source with an index of 1.8, which is spatially consistent with the PWN component (Brogan et al., 2005). The newest X-ray data analysis combining Chandra and NICER data by Ho et al. (2020) modeled the PWN with an spectral index of 1.5 0.1, which is slight harder than the results of previous works. And an absorbed 2-10 keV flux of 7.6 10-12 erg cm-2 s-1 is calculated.
We first considered the PWN scenario for the -ray emission of HESS J1813-178. The spin-down luminosity of PSR J1813-1749 is with its characteristic age of (Halpern et al., 2012; Ho et al., 2020), which is similar to that of PSR J1513-5908 associated with the -ray PWN MSH 15-52 ( and ; Seward & Harnden, 1982; Abdo et al., 2010). The GeV -ray luminosity of HESS J1813-178 in the energy range of 1 GeV - 1 TeV is calculated to be , and the radius of GeV extension is about 43 pc by adopting the distance of 12 kpc. Such values are about two times higher than that of MSH 15-52, whose GeV -ray luminosity and the radius of GeV extension are calculated to be and 19 pc (Abdo et al., 2010). While their corresponding -ray efficiencies are =/ and , which are also comparable with the typical PWNe efficiencies observed at GeV energies (Acero et al., 2013). In addition, the -rays of HESS J1813-178 show an energy-dependent morphology with its extension decreasing from GeV to TeV energies, which is typical for PWNe (Principe et al., 2020; Guo et al., 2024).
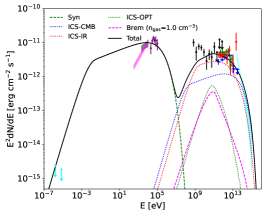
Adopting the updated -ray spectrum and the new X-ray observations for PWN, we first used a one-zone leptonic model to fit the multi-wavelength data of HESS J1813-178. The radio upper limits toward the PWN region by VLA was also considered (Funk et al., 2007). For the ICS process in the leptonic model, the radiation field includes the cosmic microwave background (CMB), the infrared (IR) component from interstellar dust and gas with the typical values of T = 30K & u = 1 eV , and the optical (OPT) component from stellar sources with T = 3000K & u = 1 eV (Porter et al., 2006, 2008). For the leptonic model, the spectra of electrons was assumed to be a broken power-law model with an exponential cutoff (BPL) for typical PWNe (Bucciantini et al., 2011), which follows:
| (1) |
Here, and are the spectral indices below and above the break energy of . The cutoff energy of electrons is denoted by . The distance of HESS J1813-178 as a PWN is adopted to be 12.0 kpc (Camilo et al., 2021). The CO observations in Section 3 give an average gas density of 300 cm-3 toward HESS J1813-178. Such density value would produce a quite high flux of bremsstrahlung component, which is much higher than that of ICS component considering the same electronic distribution. Therefore, to reduce the contribution from bremsstrahlung process, we also adopted a low density value of 1.0 cm-3 by assuming that the similarity of the pulsar distance to the molecular distance from the observer is a coincidence. The naima package was used to fit the multi-wavelength data with the Markov Chain Monte Carlo (MCMC) algorithm (Zabalza, 2015).
The best-fit parameters of one-zone leptonic models for PWN are shown in Table 3, and the corresponding modeled SEDs are given in the left panel of Figure 6. For the ICS-dominated model with the gas density of 1.0 cm-3, the break energy of electrons is fitted to be 140 GeV. The spectral indices below and above it are 1.12 and 2.78, respectively. The cutoff energy of 700 TeV is obtained, with the total energy of electrons above 1 GeV of 1049 erg. A magnetic field strength of about 7.3 G is needed to explain the flux in the X-ray band. Nonetheless, the hard X-ray spectrum given by Ho et al. (2020) suggests a harder electronic spectrum above the break energy, which can not be in accord with the flat -ray spectrum.
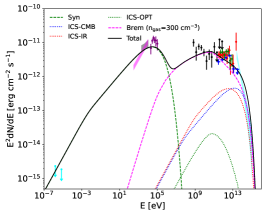
With the gas density of 300 cm-3, the -ray spectrum of HESS J1813-178 is dominated by the bremsstrahlung process, as shown in the middle panel of Figure 6. And the spectral indices of electrons below and above the break energy of 125 GeV are fitted to be 1.98 and 2.33, together with the cutoff energy of 400 TeV. The magnetic field strength is similar to that of the one-zone ICS-dominated model, while the total energy of electrons is about one magnitude lower than that. Although the synchrotron component of the Brem-dominated model could better accord with the radio upper limits and the hard X-ray spectrum without a low-energy cutoff of electrons, the curved -ray spectrum produced by the bremsstrahlung process can not match the -ray observations well, particularly at the lowest energies.
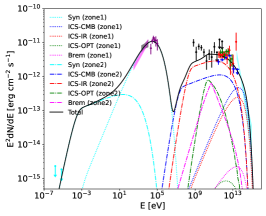
Given the hard X-ray spectrum and the flat GeV -ray spectrum, we also considered a two-zone leptonic model: one zone (zone 1) contains the newly accelerated electrons with the highest energies, which produces the X-ray emission. Another zone (zone 2) contains the old electrons accumulated in the region of GeV -ray emission. Such two-zone leptonic model could also explain the smaller extension of X-ray emission compared with the GeV or TeV -ray emission. For the electronic distribution of each zone, a single power-law with an exponential cutoff (PL) model is adopted in the form of
| (2) |
where and (i = 1 or 2) are the spectral index and the cutoff energy of electrons for each zone. The low density value of 1.0 cm-3 is adopted for this model. The best-fit parameters of two-zone leptonic models for PWN are shown in Table 3, with the modeled SED shown in the right panel of Figure 6. For zone 1, the spectral index and cutoff energy of electrons are fitted to be 1.64 and 200 TeV to explain the hard X-ray and TeV -ray spectra. A high magnetic field strength of 8.5 G is needed. And the total energy of electrons for zone 1 is about 7.851046 erg. The GeV -ray emission could be explained by the electrons in zone 2 with an index of 2.77. The fitted cutoff energy of electrons of 90 TeV is lower than that of zone 1, while total energy of electrons of 2.971050 erg in zone 2 is much higher than that of zone 1. The magnetic field strength in zone 2 is much lower with 1.5 G. And the much lower upper limits in the radio band need a low-energy cutoff of 50 GeV for the electronic spectrum in zone 2.
The soft GeV spectrum of SrcA suggests that its -ray emission could be related to the escaped electrons from the PWN associated with PSR J1813-1749, like Vela X (Hinton et al., 2011; Grondin et al., 2013). The steep GeV spectrum of SrcA indicates an absence of 100 GeV energy particles from the extended -ray emission region. Considering a typical magnitude of magnetic field with G, the synchrotron cooling time-scale for particles emitting in the GeV range is up to yr, which makes the synchrotron cooling effect to be implausible for the steep GeV spectrum of SrcA. And the possible scenario is that the bulk of the 100 GeV particles have escaped from the GeV emission region into the interstellar medium (Hinton et al., 2011). The required diffusion coefficient is calculated to be D = r2/4t 21029 , where the radius of GeV -ray emission region of SrcA is estimated to be r120pc, and the diffusion time is adopted to be the characteristic age of PSR J1813-1749 with t 5600 yr. This value is similar to the Galactic diffusion coefficient, but much faster than Bohm diffusion for the magnetic field of G in the -ray emission region of SrcA.
| Component | Ep,cut(TeV) | Wp(erg) | |||
| HESS J1813-178 | 0.5 | 79.57/37=2.15 | |||
| 1.0 | 66.30/37=1.79 | ||||
| 2.0 | 66.20/37=1.79 | ||||
| SrcA | – | – | 10.09/4=2.52 | ||
| SNR G13.5+0.2 | – | – | 4.59/3=1.53 |
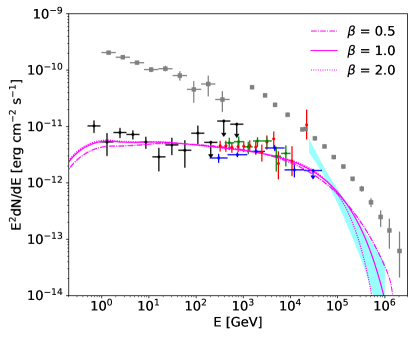
Now, the scenario that the -ray emission of HESS J1813-178 is associated with SNR G12.82-0.02 is considered. The -ray SNRs could be roughly divided into two classes with different spectra (Funk, 2015; Zeng et al., 2019): the young-aged SNRs, including RX J1713.7-3946 (H. E. S. S. Collaboration et al., 2018b) and RX J0852.0-4622 (H. E. S. S. Collaboration et al., 2018c), have relatively harder GeV -ray spectra, which are suggested to be from the leptonic process. The old-aged SNRs interacting with molecular clouds, like IC 443 and W44 (Ackermann et al., 2013), have softer -ray spectra with a break at GeV, whose -ray emission are suggested to be from the hadronic process. Considering the spatial association between the -ray emission from HESS J1813-178 and the molecular gas distribution, the hadronic model is adopted. The spectrum of protons is assumed to be a single power-law with an exponential cutoff in the form of
| (3) |
where and are the spectral index and the cutoff energy of protons, respectively. describes the sharpness of the cutoff, and the typical values of 0.5, 1.0, and 2.0 are adopted to constrain the parameters in the model. The best-fit parameters of hadronic models for HESS J1813-178 are shown in Table 4, and the corresponding modeled -ray spectrum is given in Figure 7. The hadronic models with the three different values of can reproduce the -ray spectrum with little differences. The spectral indices of protons are fitted to be about 2.1, while the cutoff energy varies from 261 TeV for =0.5 to 737 TeV for =1.0. The total energy of protons above 1 GeV, Wp, is estimated to be about (1.26-1.51) 1049 (ngas/300 cm-3)-1 (d/12.0 kpc)2 erg, corresponding to 1% particle acceleration efficiency for the explosion energy of a typical supernova (SN; ESN erg).
Brogan et al. (2005) limited the age of SNR G12.82-0.02 from 285 to 2520 yrs with the assumptions of the distance of 4 kpc and the ambient density of 1.0 cm-3. Considering the far distance of 12 kpc and the high density associated with the molecular cloud around the remnant, the age of G12.82-0.02 should be much older. Such old-aged SNR would not expect to accelerate the needed protons with energy of hundreds of TeV (Reynolds, 2008). However, considering the much larger extension of the GeV -ray emission and the clouds compared with the radio size of SNR G12.82-0.02, cosmic rays that escaped from the SNR in earlier evolutional epochs would be the possible explanation. Such scenario is similar to a proposed origin of the -ray emission around SNR DA 530 (Xin & Guo, 2023) and the SNR associated with PSR J0837-2454 (Zhang & Xin, 2023). Given the typical value of Galactic diffusion coefficient, ( = 1/3 or 1/2 for Kolmogorve or Kraichnan turbulence; Blasi, 2013), and the radius of the GeV -ray emission region of , the diffusion time for protons with energy of 100 GeV is calculated to be 500-2000 yr for different values of . Such time is still lower than the age of SNR G12.82-0.02, which is reasonable for such explanation. And the molecular clouds can accumulate those cosmic rays in the past since the diffusion coefficient is expected to be low in dense environments (Aharonian & Atoyan, 1996).
4.1.2 Young Stellar Cluster scenario at the distance of 4.8 kpc
Over the last decade, more and more observations support the young stellar clusters associated with star forming regions to be an important class of factories of Galactic cosmic rays (Aharonian et al., 2019). Cosmic rays could be efficiently accelerated by strong fast winds of young massive stars and shocks caused by the core-collapse SNs in clusters. The acceleration efficiency and maximum energy of particles are expected to be enhanced with respect to the standard values derived for single SNR shock, considering the fact that the SN blast wave could interact with fast stellar winds (Bykov et al., 2020). Meanwhile, YSCs typically host the dense molecular gas to drive the strong star formation, which makes the hadronic interaction of accelerated CRs with the surrounding dense gas a natural explanation for their -ray emission. So far, several such systems, e.g. Cygnus cocoon associated with the compact cluster Cygnus OB2 (Ackermann et al., 2011; Aharonian et al., 2019), Westerlund 1 (Abramowski et al., 2012), Westerlund 2 (Yang et al., 2018), NGC 3603 (Yang & Aharonian, 2017; Saha et al., 2020), and 30 Dor C (H. E. S. S. Collaboration et al., 2015), have been detected with the extended -ray structures from GeV to TeV bands. Especially, LHAASO recently detected the ultra high energy (UHE; 100TeV) -ray emission toward Cygnus cocoon in the energy range extending to few PeV (LHAASO Collaboration, 2023). The -ray spectra of YSCs are relatively hard with the typical index of 2.1-2.3 (Aharonian et al., 2019).
The association between the -ray emission from HESS J1813-178 and YSC Cl 1813-178 has been discussed in the previous works (Messineo et al., 2011; Araya, 2018). With the updated GeV -ray spectrum, the YSC scenario with the hadronic model is also considered here. The fitting results shown in Figure 7 is same to that of the SNR scenario. However, for the YSC scenario, the total energy of protons above 1 GeV, Wp, is calculated to be (0.84-1.01) 1048 (ngas/720 cm-3)-1 (d/4.8 kpc)2 erg. Here, the gas density of 720 cm-3 calculated with the distance of 4.8 kpc for Cl 1813-178 is adopted. The spectral index of proton distribution is similar to that of the typical YSCs, while the total energy for HESS J1813-178/Cl 1813-178 is about one order of magnitude lower than that of other YSCs (Aharonian et al., 2019).
The near-infrared spectroscopic survey in the direction of Cl 1813-178 cluster confirmed 25 massive stars, including 2 Wolf-Rayet (WR) stars, a candidate luminous blue variable (cLBV) and 21 OB stars (Messineo et al., 2011). Different from the other known LBVs in clusters, which are typically among the most luminous members, the cLBV in Cl 1813-178 appears to be rather faint and has a mass smaller than that of the two detected WR stars. Given the typical wind powers expected for a 35 M⊙ star on and off the main sequence and in the WR stage (Parizot et al., 2004) and ignoring the contribution from the cLBV, we get the total kinetic wind power of Cl 1813-178 with . The kinetic power is similar to that of Cygnus Cocoon with 21038 (Ackermann et al., 2011), but much lower than that of Westerlund 1 with 11039 (Aharonian et al., 2019) and Westerlund 2 with 21040 (Rauw et al., 2007). With the distance of 4.8 kpc, the GeV -ray luminosity of HESS J1813-178 is calculated to be about 9.61034 (d/4.8 kpc)2 , which represents 0.1% of the stellar wind power in Cl 1813-178. The conversion efficiency is slightly higher than that of Cygnus Cocoon with 0.03% (Ackermann et al., 2011), Westerlund 1 with 0.002-0.02% (Härer et al., 2023) and Westerlund 2 with 0.005% (Yang et al., 2018). However, the GeV extension of HESS J1813-178 with r = 17 pc for d = 4.8 kpc is much smaller that that of other YSCs (e.g. r = 50 pc for Cygnus Cocoon, r = 60 pc for Westerlund 1, and r = 210 pc for Westerlund 2; Aharonian et al., 2019; Yang et al., 2018). If the GeV extension of r = 17 pc reflects the propagation depth of CRs, the diffusion coefficient is calculated to be D = r2/4T 5.51024 , where the age of Cl 1813-178 cluster is adopted to be T = 4106 yr (Messineo et al., 2011). While for the interstellar magnetic field B 10 G, the Bohm diffusion coefficient is = . And for the 1 TeV protons responsible for 100 GeV -rays, the diffusion coefficient in HESS J1813-178 is close to Bohm limit, which seems unrealistic. Such result implies that the radius of the CR halo around Cl 1813-178 is most likely significantly larger than that of the -ray emission region, like Westerlund 1 (Aharonian et al., 2019).
Considering the molecular gas around SrcA, we also used the hadronic model to fit the -ray spectrum of SrcA, by assuming a power-law distribution for protons. The modeled spectrum is shown in Figure 1, together with the predicted -ray emission assuming that the CR spectra therein are the same as those measured locally by AMS-02 (Aguilar et al., 2015). The best-fit parameters of hadronic models are listed in Table 4. For SrcA, the spectral of protons with an index of 2.71 is need to explain its soft -ray spectrum detected. With the different values of gas density derived from the different distances for SrcA, the total energy of protons above 1 GeV is estimated to be erg or erg. The extended -ray morphology and the association with the molecular gas for SrcA suggest that the high energy protons could be accelerated and escaped from YSC Cl 1813-178 associated with HESS J1813-178. Because of the energy-dependence of the diffusion coefficient, the initial particle spectrum of would be modified to be for the escaped particle spectrum with the continuous injection (Aharonian et al., 2019). With the values of and , the escaped proton spectrum follows , which is close to the fitted proton spectrum above. The radius of the -ray emission region for SrcA is about 47 pc with the distance of 4.8 kpc. If the escaping scenario between SrcA and YSC Cl 1813-178 is real, the diffusion length of 47 pc constrains that the diffusion coefficient should be as low as 1025 by equating the diffusion time to be the age of cluster, which is also close to Bohm limit.
SrcC is spatially coincident with SNR G13.5+0.2. And the hadronic model is also used to fit its -ray spectrum. By adopting the distance of 13.0 kpc (Lee et al., 2020) and assuming the gas density of 10 cm-3, the total energy of protons for SNR G13.5+0.2 is calculated to be erg, which means that 26% of the SN kinetic energy of 1051 erg is transferred to the energy of particles.
5 Conclusions
In this work, we analyzed the GeV -ray emission in the field of HESS J1813-178, using 14 years of Fermi-LAT data, and found that the GeV emission around HESS J1813-178 is composed of three -ray components: SrcA, SrcB and SrcC. SrcC is spatially coincident with SNR G13.5+0.2. SrcB has a small extension, which is spatially coincident with HESS J1813-178. The GeV -ray spectrum follows a power-law model with an index of , which can connect with the TeV SED of HESS J1813-178 smoothly. The spatial and spectral associations indicate that SrcB could be the GeV counterpart of HESS J1813-178. SrcA with a large size extension has a soft GeV -ray spectrum described by a log-parabola model. No clear identified counterparts in other wavelengths are found in the region of SrcA. While the CO observations display that the intensity of the -ray emission from SrcA and HESS J1813-178 spatially correlate with the molecular gas distribution in the velocity range of 45-60 km s-1. The velocity range indicates two candidate kinematic distances: the near one is in accord with the distance of the young stellar cluster, Cl 1813-178, of 4.8 kpc, and the far one is in accord with the distance to the PSR J1813-1749/SNR G12.82-0.02 system, of 12 kpc.
We then discussed the possible -ray origin of HESS J1813-178 with three scenarios: the PWN associated with PSR J1813-1749, SNR G12.82-0.02 or YSC Cl 1813-178. For the one-zone leptonic scenario with PWN, the electron distribution is adopted to be a broken power-law model with an exponential cutoff. The one-zone ICS-dominated and bremsstrahlung-dominated models with the different values of gas density are considered. However, none of them can well describe the multi-wavelength data from radio, X-ray to -ray bands. The one-zone ICS-dominated model expects a flat X-ray spectrum, which can not match the observed one with an spectral index of 1.5 0.1 in the energy range of 2-10 keV. With the high density around HESS J1813-178, the one-zone bremsstrahlung-dominated model could better accord with the hard X-ray spectrum. While it predicts a curved -ray spectrum dominated by the bremsstrahlung process, which can not well match the -ray observations. A two-zone leptonic model for PWN could explain the multi-wavelength data. The electron distribution of each zone is adopted to be a single power-law with an exponential cutoff. In one zone, an electron distribution with an index of 1.64 could explain the hard X-ray and TeV -ray spectra, with a high magnetic field strength of 8.5G. In another zone, an electron distribution with an index of 2.77 and a low-energy cutoff of 50 GeV is use to explain the radio upper limits and the GeV -ray emission, with a low magnetic field strength of 1.5G.
For the SNR scenario, only the hadronic model is discussed, considering the association between the -ray emission of HESS J1813-178 and the surrounding molecular gas. The spectra of protons was assumed to be a single power-law with an exponential cutoff, and the different values of the sharpness of the cutoff, , are also adopted. The hadronic models with the different values of can reproduce the -ray spectra with little differences, and the proton distribution needs to be hard with an index of 2.1. The cutoff energy varies between 261 TeV and 737 TeV for the different values of . The large extension of the GeV -ray emission and the clouds compared with the size of SNR G12.82-0.02 suggests that these protons contributed to the -ray emission could escape from the SNR in earlier evolutional epochs. The calculated diffusion time is lower than the age of SNR G12.82-0.02, which is reasonable for such explanation.
Although the flat -ray spectrum of HESS J1813-178 is similar to that of YSCs with the typical spectral index of 2.1-2.3, the GeV extension of HESS J1813-178 is much smaller than that of other YSCs. Considering the GeV -ray size as the propagation depth of CRs, the calculated diffusion coefficient needs to be close to Bohm limit, which is not very reasonable.
The soft -ray spectrum of SrcA can be explained by the fast diffusion of electrons from the PWN associated with PSR J1813-1749, like Vela X, or the hadronic process due to the inelastic collisions between the molecular cloud and the high energy protons, which can be accelerated in and escaped from YSC Cl 1813-178.
It should be noted that the hadronic models show that the highest energy of protons should exceed a few hundred TeV, which makes HESS J1813-178 to be a promising PeV CR accelerator (PeVatron). LHAASO has detected the UHE -ray around HESS J1813-178, and more detailed analysis based on more LHAASO data, especially the morphological analysis, would be helpful to investigate the origin of the -ray emission in this region and test its PeVatron nature. Moreover, the sensitivity of LHAASO above 10 TeV could help to study in detail the shape of the particle spectrum cutoff, that encodes information about the particle acceleration and transport mechanisms (Zirakashvili & Aharonian, 2007; Romoli et al., 2017).
We would like to thank the anonymous referee for very helpful comments, which help to improve the paper. This work is based on observations made with NASA’s Fermi Gamma-Ray Space Telescope, and it also makes use of molecular line data from FOREST Unbiased Galactic plane Imaging survey with the Nobeyama 45 m telescope (FUGIN). This work is supported by the National Natural Science Foundation of China under the grants 12103040.
References
- Abdo et al. (2010) Abdo, A. A., Ackermann, M., Ajello, M., et al. 2010, ApJ, 714, 927, doi: 10.1088/0004-637X/714/1/927
- Abdollahi et al. (2022) Abdollahi, S., Acero, F., Baldini, L., et al. 2022, ApJS, 260, 53, doi: 10.3847/1538-4365/ac6751
- Abramowski et al. (2012) Abramowski, A., Acero, F., Aharonian, F., et al. 2012, A&A, 537, A114, doi: 10.1051/0004-6361/201117928
- Acero et al. (2013) Acero, F., Ackermann, M., Ajello, M., et al. 2013, ApJ, 773, 77, doi: 10.1088/0004-637X/773/1/77
- Ackermann et al. (2011) Ackermann, M., Ajello, M., Allafort, A., et al. 2011, Science, 334, 1103, doi: 10.1126/science.1210311
- Ackermann et al. (2013) —. 2013, Science, 339, 807, doi: 10.1126/science.1231160
- Aguilar et al. (2015) Aguilar, M., Aisa, D., Alpat, B., et al. 2015, Phys. Rev. Lett., 114, 171103, doi: 10.1103/PhysRevLett.114.171103
- Aharonian et al. (2019) Aharonian, F., Yang, R., & de Oña Wilhelmi, E. 2019, Nature Astronomy, 3, 561, doi: 10.1038/s41550-019-0724-0
- Aharonian et al. (2005) Aharonian, F., Akhperjanian, A. G., Aye, K. M., et al. 2005, Science, 307, 1938, doi: 10.1126/science.1108643
- Aharonian et al. (2006) Aharonian, F., Akhperjanian, A. G., Bazer-Bachi, A. R., et al. 2006, ApJ, 636, 777, doi: 10.1086/498013
- Aharonian & Atoyan (1996) Aharonian, F. A., & Atoyan, A. M. 1996, A&A, 309, 917
- Akaike (1974) Akaike, H. 1974, IEEE Transactions on Automatic Control, 19, 716
- Albert et al. (2020) Albert, A., Alfaro, R., Alvarez, C., et al. 2020, ApJ, 905, 76, doi: 10.3847/1538-4357/abc2d8
- Albert et al. (2006) Albert, J., Aliu, E., Anderhub, H., et al. 2006, ApJ, 637, L41, doi: 10.1086/500364
- Araya (2018) Araya, M. 2018, ApJ, 859, 69, doi: 10.3847/1538-4357/aabd7e
- Ballet et al. (2023) Ballet, J., Bruel, P., Burnett, T. H., Lott, B., & The Fermi-LAT collaboration. 2023, arXiv e-prints, arXiv:2307.12546, doi: 10.48550/arXiv.2307.12546
- Ballet et al. (2020) Ballet, J., Burnett, T. H., Digel, S. W., & Lott, B. 2020, arXiv e-prints, arXiv:2005.11208. https://arxiv.org/abs/2005.11208
- Blasi (2013) Blasi, P. 2013, A&A Rev., 21, 70, doi: 10.1007/s00159-013-0070-7
- Bolatto et al. (2013) Bolatto, A. D., Wolfire, M., & Leroy, A. K. 2013, ARA&A, 51, 207, doi: 10.1146/annurev-astro-082812-140944
- Brogan et al. (2005) Brogan, C. L., Gaensler, B. M., Gelfand, J. D., et al. 2005, ApJ, 629, L105, doi: 10.1086/491471
- Bucciantini et al. (2011) Bucciantini, N., Arons, J., & Amato, E. 2011, MNRAS, 410, 381, doi: 10.1111/j.1365-2966.2010.17449.x
- Bykov et al. (2020) Bykov, A. M., Marcowith, A., Amato, E., et al. 2020, Space Sci. Rev., 216, 42, doi: 10.1007/s11214-020-00663-0
- Camilo et al. (2021) Camilo, F., Ransom, S. M., Halpern, J. P., & Roshi, D. A. 2021, ApJ, 917, 67, doi: 10.3847/1538-4357/ac0720
- Cao et al. (2023) Cao, Z., Aharonian, F., An, Q., et al. 2023, arXiv e-prints, arXiv:2305.17030, doi: 10.48550/arXiv.2305.17030
- Fang & Zhang (2010) Fang, J., & Zhang, L. 2010, ApJ, 718, 467, doi: 10.1088/0004-637X/718/1/467
- Funk (2015) Funk, S. 2015, Annual Review of Nuclear and Particle Science, 65, 245, doi: 10.1146/annurev-nucl-102014-022036
- Funk et al. (2007) Funk, S., Hinton, J. A., Moriguchi, Y., et al. 2007, A&A, 470, 249, doi: 10.1051/0004-6361:20066779
- Gotthelf & Halpern (2009) Gotthelf, E. V., & Halpern, J. P. 2009, ApJ, 700, L158, doi: 10.1088/0004-637X/700/2/L158
- Grondin et al. (2013) Grondin, M. H., Romani, R. W., Lemoine-Goumard, M., et al. 2013, ApJ, 774, 110, doi: 10.1088/0004-637X/774/2/110
- Guo et al. (2024) Guo, X., Liu, X., & Xin, Y. 2024, ApJ, 961, 213, doi: 10.3847/1538-4357/ad168f
- H. E. S. S. Collaboration et al. (2015) H. E. S. S. Collaboration, Abramowski, A., Aharonian, F., et al. 2015, Science, 347, 406, doi: 10.1126/science.1261313
- H. E. S. S. Collaboration et al. (2018a) H. E. S. S. Collaboration, Abdalla, H., Abramowski, A., et al. 2018a, A&A, 612, A1, doi: 10.1051/0004-6361/201732098
- H. E. S. S. Collaboration et al. (2018b) —. 2018b, A&A, 612, A6, doi: 10.1051/0004-6361/201629790
- H. E. S. S. Collaboration et al. (2018c) —. 2018c, A&A, 612, A7, doi: 10.1051/0004-6361/201630002
- Halpern et al. (2012) Halpern, J. P., Gotthelf, E. V., & Camilo, F. 2012, ApJ, 753, L14, doi: 10.1088/2041-8205/753/1/L14
- Härer et al. (2023) Härer, L. K., Reville, B., Hinton, J., Mohrmann, L., & Vieu, T. 2023, A&A, 671, A4, doi: 10.1051/0004-6361/202245444
- Helfand et al. (2007) Helfand, D. J., Gotthelf, E. V., Halpern, J. P., et al. 2007, ApJ, 665, 1297, doi: 10.1086/519734
- Hinton et al. (2011) Hinton, J. A., Funk, S., Parsons, R. D., & Ohm, S. 2011, ApJ, 743, L7, doi: 10.1088/2041-8205/743/1/L7
- Ho et al. (2020) Ho, W. C. G., Guillot, S., Saz Parkinson, P. M., et al. 2020, MNRAS, 498, 4396, doi: 10.1093/mnras/staa2653
- Lande et al. (2012) Lande, J., Ackermann, M., Allafort, A., et al. 2012, ApJ, 756, 5, doi: 10.1088/0004-637X/756/1/5
- Landi et al. (2006) Landi, R., Bassani, L., Malizia, A., et al. 2006, ApJ, 651, 190, doi: 10.1086/507671
- Lee et al. (2020) Lee, Y.-H., Koo, B.-C., & Lee, J.-J. 2020, AJ, 160, 263, doi: 10.3847/1538-3881/abc00e
- LHAASO Collaboration (2023) LHAASO Collaboration. 2023, arXiv e-prints, arXiv:2310.10100, doi: 10.48550/arXiv.2310.10100
- Messineo et al. (2011) Messineo, M., Davies, B., Figer, D. F., et al. 2011, ApJ, 733, 41, doi: 10.1088/0004-637X/733/1/41
- Messineo et al. (2008) Messineo, M., Figer, D. F., Davies, B., et al. 2008, ApJ, 683, L155, doi: 10.1086/591673
- Parizot et al. (2004) Parizot, E., Marcowith, A., van der Swaluw, E., Bykov, A. M., & Tatischeff, V. 2004, A&A, 424, 747, doi: 10.1051/0004-6361:20041269
- Porter et al. (2006) Porter, T. A., Moskalenko, I. V., & Strong, A. W. 2006, ApJ, 648, L29, doi: 10.1086/507770
- Porter et al. (2008) Porter, T. A., Moskalenko, I. V., Strong, A. W., Orlando, E., & Bouchet, L. 2008, ApJ, 682, 400, doi: 10.1086/589615
- Principe et al. (2020) Principe, G., Mitchell, A. M. W., Caroff, S., et al. 2020, A&A, 640, A76, doi: 10.1051/0004-6361/202038375
- Rauw et al. (2007) Rauw, G., Manfroid, J., Gosset, E., et al. 2007, A&A, 463, 981, doi: 10.1051/0004-6361:20066495
- Reid et al. (2014) Reid, M. J., Menten, K. M., Brunthaler, A., et al. 2014, ApJ, 783, 130, doi: 10.1088/0004-637X/783/2/130
- Reynolds (2008) Reynolds, S. P. 2008, ARA&A, 46, 89, doi: 10.1146/annurev.astro.46.060407.145237
- Romoli et al. (2017) Romoli, C., Taylor, A. M., & Aharonian, F. 2017, Astroparticle Physics, 88, 38, doi: 10.1016/j.astropartphys.2016.12.007
- Saha et al. (2020) Saha, L., Domínguez, A., Tibaldo, L., et al. 2020, ApJ, 897, 131, doi: 10.3847/1538-4357/ab9ac2
- Seward & Harnden (1982) Seward, F. D., & Harnden, F. R., J. 1982, ApJ, 256, L45, doi: 10.1086/183793
- Umemoto et al. (2017) Umemoto, T., Minamidani, T., Kuno, N., et al. 2017, PASJ, 69, 78, doi: 10.1093/pasj/psx061
- Wood et al. (2017) Wood, M., Caputo, R., Charles, E., et al. 2017, in International Cosmic Ray Conference, Vol. 301, 35th International Cosmic Ray Conference (ICRC2017), 824. https://arxiv.org/abs/1707.09551
- Xin & Guo (2023) Xin, Y., & Guo, X. 2023, ApJ, 955, 84, doi: 10.3847/1538-4357/acf455
- Yang & Aharonian (2017) Yang, R.-z., & Aharonian, F. 2017, A&A, 600, A107, doi: 10.1051/0004-6361/201630213
- Yang et al. (2018) Yang, R.-z., de Oña Wilhelmi, E., & Aharonian, F. 2018, A&A, 611, A77, doi: 10.1051/0004-6361/201732045
- Zabalza (2015) Zabalza, V. 2015, in International Cosmic Ray Conference, Vol. 34, 34th International Cosmic Ray Conference (ICRC2015), 922. https://arxiv.org/abs/1509.03319
- Zeng et al. (2019) Zeng, H., Xin, Y., & Liu, S. 2019, ApJ, 874, 50, doi: 10.3847/1538-4357/aaf392
- Zhang & Xin (2023) Zhang, P., & Xin, Y. 2023, ApJ, 951, 142, doi: 10.3847/1538-4357/acdaca
- Zirakashvili & Aharonian (2007) Zirakashvili, V. N., & Aharonian, F. 2007, A&A, 465, 695, doi: 10.1051/0004-6361:20066494