First detection of X-ray polarization in Galactic ULX pulsar Swift J0243.66124 with IXPE
Abstract
We report the results of first ever spectro-polarimetric analyses of the Galactic ultra-luminous X-ray pulsar Swift J0243.6 during the 2023 outburst using quasi-simultaneous IXPE, NICER and NuSTAR observations. A pulsation of period s is detected in IXPE and NuSTAR observations with pulse fractions (PFs) ( keV) and ( keV), respectively. Energy-dependent study of the pulse profiles with NuSTAR indicates an increase in PF from ( keV) to ( keV). Further, epoch-dependent polarimetric measurements during decay phase of the outburst confirm the detection of significant polarization degree (PD) varying as with polarization angle in keV energy range. We also observe that PD increases up to at higher energies ( keV) with dominating bbodyrad flux contribution () in IXPE spectra. The phase-resolved polarimetric study yields PD as suggesting a marginal correlation with the pulse profiles. Moreover, the broad-band ( keV) energy spectrum of combined NICER and NuSTAR observations is well described by the combination of bbodyrad and cutoffpl components with seed photon temperature () keV and photon index () . With the above findings, we infer that the observed ‘low’ PD in Swift J0243.6 is resulted possibly due to ‘vacuum resonance’ effect occurred between the overheated and relatively cooler regions of the neutron star boundary layer.
1 Introduction
Ultra-luminous X-ray sources (ULXs) are bright point-like off-nuclear objects with isotropic luminosity ( erg ) exceeding the Eddington limit (Feng & Soria, 2011; King et al., 2023, for review). Alongside the black hole candidates Atapin et al. (2019); Majumder et al. (2023), the detection of s X-ray pulsation in M82 X (Bachetti et al., 2014) opened up a completely new window to understand the characteristics of ULXs. Interestingly, nine confirmed ULX pulsar sources (ULXPs) are reported with the detection of X-ray pulsation (King et al., 2023, and references therein) till date.
Admittedly, the accretion onto the X-ray pulsars (XRPs) is regulated by the strong magnetic fields ( G). In reality, matter channels along the magnetic field lines at magnetospheric radius and generates hotspots near magnetic poles of the neutron star (NS) that radiates pulsed emissions in X-rays being misaligned with the spin axis (see Mushtukov & Tsygankov 2022, for a recent review). It is believed that at higher mass accretion rate, the hotspots turn into vertically extended accretion columns above the NS surface (Basko & Sunyaev, 1976; Mushtukov et al., 2015). However, relative contribution in total emission from the accretion column, depending on the disc truncation radius, is found to play viable role for the irregular pulsations detected in most of the known ULXPs (Walton et al., 2018). Indeed, the ULXPs spectra are empirically well described by blackbody-like emissions and power-law profile with high energy cut-off.
The Imaging X-ray Polarimetry Explorer (IXPE; Weisskopf et al., 2022) provides an unique opportunity to probe the X-ray polarization of XRPs in keV. So far, the detection of phase-averaged/resolved polarized emisison in a handful of XRPs such as Her X (, Doroshenko et al. 2022), Cen X (, Tsygankov et al. 2022), 4U (, Marshall et al. 2022), Vela X (, Forsblom et al. 2023), GRO J (, Tsygankov et al. 2023), EXO (, Malacaria et al. 2023), X Persei (, Mushtukov et al. 2023) and GX (, Suleimanov et al. 2023) is confirmed with IXPE. If not all, most of the sources show ‘low’ polarization degree (PD) compared to the predictions from the existing models (Meszaros et al., 1988; Caiazzo & Heyl, 2021a, b), the cause of which remains an open question till date.
In this work, we study the polarization properties of the transient XRP Swift J using IXPE observations for the first time to the best of our knowledge. The source having a Be-star binary companion (Reig et al., 2020) was discovered (Kennea et al., 2017) during its giant outburst in 2017 by Swift/BAT with a peak flux Crab and pulse period of s (Kennea et al., 2017). With the measured source distance of kpc (Bailer-Jones et al., 2018), the peak luminosity of the source exceeding the Eddington limit of a neutron star system identifies Swift J as the first Galactic ULXP.
In this Letter, we present the results of in-depth phase-averaged/resolved spectro-polarimetric analysis of Swift J0243.6 with IXPE in keV energy range. In addition, we also use quasi-simultaneous NICER and NuSTAR observations to study the broad-band spectral distribution of the source in keV energy range.
The Letter is organized as follows: In §2, we mention the observation details along with the data reduction procedures of each instruments. In §3, we present the results obtained from the spectro-polarimetric studies. Finally, we summarize our findings and conclude in §4.
| Epoch | MJD Start | Pulse Period | Parameters | |||||
|---|---|---|---|---|---|---|---|---|
| (Exposure) | (s) | (keV) | (keV) | (keV) | (keV) | (keV) | ||
| IX1 | PD(%) | |||||||
| ( ks) | PA (∘) | |||||||
| QI (%) | ||||||||
| UI (%) | ||||||||
| (%) | ||||||||
| SIGNIF () | ||||||||
| IX2 | PD(%) | |||||||
| ( ks) | PA (∘) | |||||||
| QI (%) | ||||||||
| UI (%) | ||||||||
| (%) | ||||||||
| SIGNIF () | ||||||||
| IX3 | PD(%) | |||||||
| ( ks) | PA (∘) | |||||||
| QI (%) | ||||||||
| UI (%) | ||||||||
| (%) | ||||||||
| SIGNIF () |
2 Observation and Data Reduction
IXPE observed Swift J0243.6 three times between July 20, 2023 to August 25, 2023 for a total exposure of about ks during the decay phase of the 2023 outburst. The entire observation is segmented into three epochs of ks (IX1, MJD 60145.63), ks (IX2, MJD 60165.99) and ks (IX3, MJD 60179.42) exposures, respectively. We make use of the cleaned and calibrated level-2 event files from the three detector units (DUs) of IXPE in keV energy range. The data analysis is carried out using the IXPEOBSSIMv30.5.0 software (Baldini et al., 2022) following the standard procedures mentioned in Chatterjee et al. 2023; Kushwaha et al. 2023; Majumder et al. 2024. The source and background regions are considered as the circular region at the source coordinate and the annular region between and radii with the same center, respectively (see also Jayasurya et al., 2023; Majumder et al., 2024). Further, the task XPSELECT is used to extract the source and background events from the selected regions. We use the task XPBIN with various algorithms such as PCUBE, PHA1, PHA1Q and PHA1U to generate the necessary data products for model-independent and spectro-polarimetric studies, respectively. The latest response files (v12) provided by the software team is used during the fitting of Stokes spectra. Finally, the XPPHASE task is used to assign phase to the barycorr111https://heasarc.gsfc.nasa.gov/ftools/caldb/help/barycorr.html corrected IXPE events lists for phase-resolved polarimetric studies.
Swift J0243.6 is also observed by NICER and NuSTAR during the 2023 outburst. In this work, we analyze quasi-simultaneous NICER ( ks) and NuSTAR ( ks) observation (hereafter NI1 and NU1) carried out on June, 27, 2023. Additionally, we consider multiple NICER observations (hereafter NI2, NI3, NI4) which are quasi-simultaneous with the three IXPE epochs (IX1, IX2, IX3), respectively. The data is processed using the standard analysis software NICERDASv11a and nupipelinev0.4.9 for NICER and NuSTAR, respectively, integrated in HEASOFT V6.32.1222https://heasarc.gsfc.nasa.gov/docs/software/heasoft. We use appropriate calibration database while analysing data following standard methods (see (Kushwaha et al., 2023; Majumder et al., 2024, for details)). Note that the NICER observations may be affected by onboard light leak issues which are addressed following the standard procedures333https://heasarc.gsfc.nasa.gov/docs/nicer/analysis_threads/light-leak-analysis, suggested by the instrument team.
3 Analysis and Results
3.1 Ourburst Profile
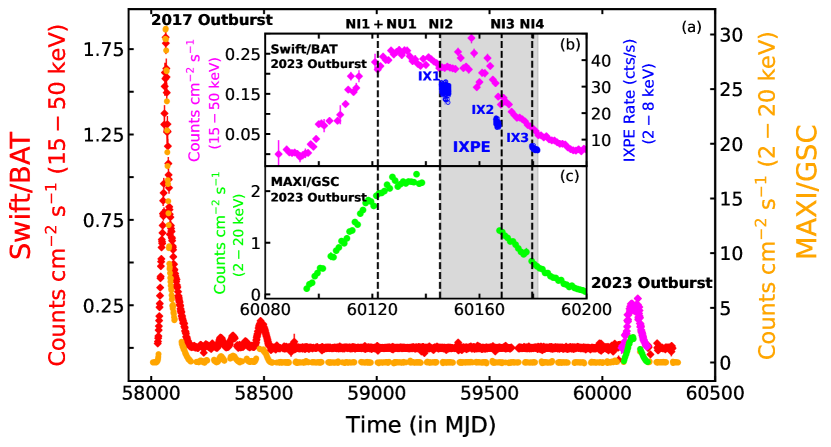
Swift J0243.6 is monitored by MAXI/GSC ( keV) and Swift/BAT ( keV) almost on a daily basis since its giant outburst triggered in . We present the complete coverage of the source with different instruments since its detection in panel (a) of Fig. 1. The recent outburst in covered by both Swift/BAT and MAXI/GSC is shown in panel (b) and (c) of Fig. 1, respectively. We observe almost similar profile of rise and decay phase of the outburst with peak MAXI/GSC and Swift/BAT flux of about counts ( mCrab) and counts ( Crab) in keV and keV energy ranges, respectively. The background-subtracted IXPE light curves of 1000 s bin combining all three DUs in keV during epochs IX1 ( mCrab), IX2 ( mCrab) and IX3 ( mCrab) are shown in panel (b) using blue open circles along with the entire observation period in grey shade. The quasi-simultaneous NICER and NuSTAR observations over different epochs are marked with vertical dashed lines. We observe that the average IXPE count rate falls gradually as cts/s (IX1), cts/s (IX2) and cts/s (IX3) during the decay phase of the outburst.
3.2 Phase-averaged Polarimetric Measurememts
We study the phase-averaged polarimetric properties of Swift J0243.6 using IXPE observation. In doing so, we consider both model-independent measurement techniques with PCUBE algorithm and model-dependent spectro-polarimetric approach to carry out the analyses.
3.2.1 Model-independent PCUBE Results
In model-independent analysis, we use PCUBE algorithm to estimate the normalized Stokes parameters, polarization angle (PA), polarization degree (PD) and minimum detectable polarization at confidence () following the standard methods (see Majumder et al. 2024, and references therein). Considering all events from the three detector units (DUs) of IXPE, we measure the polarization parameters during epoch IX1 as PD (), PA () with in keV energy band. We also detect significant polarization (, ) during epochs IX2 and IX3, respectively. We observe that PD is increased to () in epoch IX2, which is subsequently decreased to () for epoch IX3. Note that the constrained PA remains statistically insignificant in epoch IX2 and it is decreased to in epoch IX3.
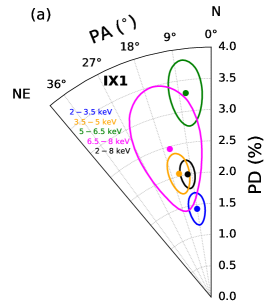
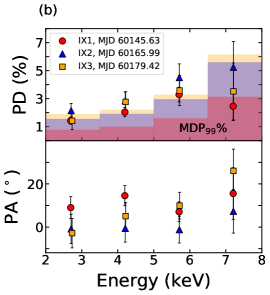
Further, to infer the energy-dependent polarimetric properties, we estimate the polarization parameters in different energy bands, namely keV, keV, keV and keV, respectively. We observe an increase of PD from ( keV) to a maximum of ( keV) with a non-detection in keV energy band during epoch IX1. Similar moderate energy variation of PD is also observed in epochs IX2 and IX3. However, the energy dependence of PA is found to be insignificant as it remains unconstrained in some energy bands. In Fig. 2a, we present confidence contours of PD and PA in different energy ranges for epoch IX1. The obtained energy dependent behavior of PD and PA in different epochs are shown in Fig. 2b. The estimated parameters are listed in Table 1.
3.2.2 Model-dependent Spectro-polarimetric Results
We simultaneously fit the I, Q and U Stokes spectra from all the DUs in keV energy range within XPSEC to examine the spectro-polarimetric properties of Swift J0243.6. For that we consider a standard model combination constTbabspolconst(gaussian+bbodyrad+cutoffpl), for the spectro-polarimetric modeling. Here, polconst represents the constant polarization model with PD and PA as the model parameters. We obtain the best fit with resulting PD and PA in epoch IX1. Further, the seed photon temperature () and photon index () are obtained as keV and , respectively, during epoch IX1.
Next, we replace polconst by the energy dependent polarization model polpow that fits the Q and U Stokes spectra considering PD() (in fraction) and PA() (in ∘). The best fitted Stokes spectra of epoch IX1 with reveal and . We freeze to zero as it remains unconstrained and the best fit yields . Integrating PD() and PA() with the best-fitted model parameters, we obtain PD and PA as and , respectively. We continue to use similar model combinations for spectro-polarimetric modeling in all the epochs and the best-fitted parameters are tabulated in Table 2 of the Appendix. Notably, the linear polarization model pollin fails to constrain PD and PA.
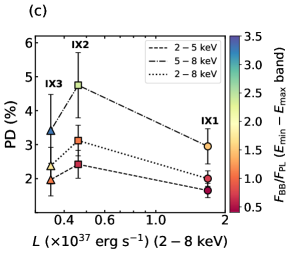
Further, we attempt to deduce correlation between the spectro-polarimetric parameters, namely PD (model-independent), luminosity and the ratio of bbodyrad to cutoffpl fluxes () obtained with cflux from the modeling of IXPE spectra in keV energy range. In Fig. 2c, we present the variation of PD ( keV, keV and keV) with luminosity in keV energy range for all epochs. The color code denotes the flux ratio () computed using polpow component in respective energy bands. We observe that PD increases during the transition from epoch IX1 to epoch IX2 and subsequently drops in epoch IX3 as luminosity decreases erg (Fig. 2c) and increases in the respective energy bands. Note that bbodyrad dominates () in keV band, whereas cutoffpl becomes prominent () in keV energy range. We observe that PD reaches up to in keV for which bbodyrad flux becomes twice of cutoffpl. This findings indicate that the thermal emissions towards higher energy seem to contribute significantly in the polarization fraction.
3.3 Phase-resolved Polarimetric Properties
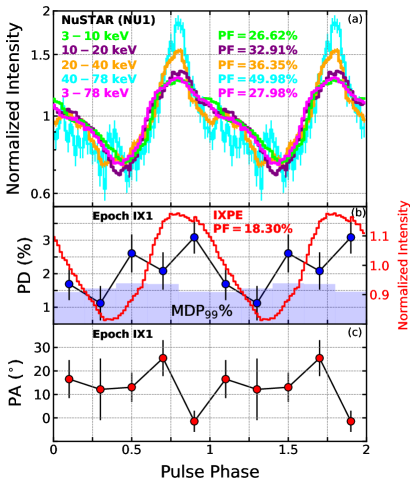
The spin period evolution of Swift J0243.6 during both 2017 and 2023 outburst phases show both spin-up and spin-down behavior across different epochs (see Serim et al. 2023; Chhotaray et al. 2024). We search for pulsation using epoch-folding (Leahy et al., 1983) in the keV IXPE band, as well as in different energy bands ( keV, keV, keV and keV) of NuSTAR data. The pulse profiles are normalized by dividing with the average intensity of respective energy bands. The uncertainties in the pulse periods were determined by producing simulated light curves at each epoch, and computing the RMS variation in their determined periods (Leahy 1987; see also Chatterjee et al. 2021).
The source exhibits strong pulsations in all NuSTAR energy bands as well as in the entire energy band with P = 9.79909(4) s. The pulse profiles and pulse fractions (PFs) are found to be strongly energy-dependent as PF increases from to with the increase in energy (see also Beri et al., 2021). The pulse profiles are dominated by emission from a single peak at lower energies and changes to a double-peaked profile at higher energies (Chatterjee et al. 2024, in preparation). Pulsations are also detected in each IXPE epochs (see Table 1) during the declining phase of the outburst in keV with pulse profiles of single-peaked (IX1, ), double-peaked (IX2, fundamental ) and triple-peaked (IX3, fundamental ) nature, respectively, with decreasing luminosity. The pulse profiles obtained with NuSTAR and IXPE are shown in panel (a) and (b) of Fig. 3, respectively.
The polarimetric properties of XRPs with IXPE show a strong phase-dependence (Tsygankov et al., 2022, 2023; Forsblom et al., 2023) as seen by the observer at different phases of its rotation. To investigate the same for Swift J0243.6, we divide the epoch IX1 observations into 5 equal phase-bins of width each and compute PD and PA in each bin which are depicted in panel (b) and (c) of Fig. 3, respectively. We find a significant variation of PD with phase within , indicating a hint of correlation with the intensity (see Fig. 3b). However, PA shows marginal variation within over the initial four phase bins before it drops down close to zero.
3.4 Broad-band Spectral Distribution
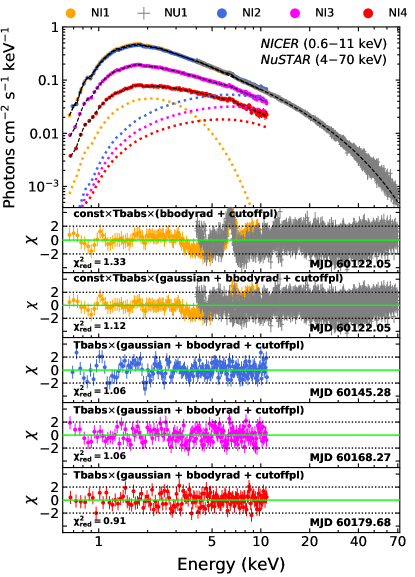
We examine the broad-band ( keV) energy spectral distribution of Swift J0243.6 using quasi-simultaneous NICER (NI1) and NuSTAR (NU1) observations. In general, the accretion-powered pulsars exhibit emissions over a wide range of energies including soft X-ray peaks and hard tails at higher energies. We adopt the model combination constTbabs(gaussian+bbodyrad+cutoffpl) comprising of a bbodyrad component for thermal emission along with a cutoffpl, accounted for the higher energy cut-off, to model the broad-band continuum. The gaussian is used to model the strong iron line emission observed at keV and Tbabs (Wilms et al., 2000) takes care of the inter-galactic absorption. We find the best fit with above model combination for a of . Further, we model the NICER spectra during epochs NI2, NI3 and NI4 in keV energy range. Note that a similar model combination provides an acceptable fit for all the NICER spectra with in the range of .
The best fitted broad-band spectrum during NI1NU1 results in seed photon temperature, keV with . We find the photon index () of cutoffpl as with a high energy cut-off () at keV. The hydrogen column density () is found as cm-2. We detect the iron line emission at keV of line width keV in NI1NU1. Iron line signatures are also found in the spectra of all other NICER epochs. The best fitted model parameters for all epochs are tabulated in Table 3. Note that remains unconstrained in NICER spectra of NI2-NI4 and hence, we freeze it at keV.
We also compute the bolometric flux in keV energy range using cflux and obtain as erg in NI1NU1, which sharply decreases in the range erg during NI2 to NI4. Considering the source distance of kpc (Bailer-Jones et al., 2018), we find the bolometric luminosity as erg for NI1NU1 and it drops in the range erg during NICER epochs. The obtained luminosity exceeds the Eddington limit of XRPs confirming its ultra-luminous nature. In Fig. 4, we show the best-fitted broad-band ( keV) energy spectrum of combined NI1 and NU1 observations along with NICER spectra ( keV) during NI2-NI4 epochs. The best-fitted and estimated spectral parameters for all the observations are tabulated in Table 3 of the Appendix.
4 Discussion
In this Letter, we report the results of spectro-polarimetric studies of the Galactic ULXP Swift J0243.6 from the first ever IXPE observations in keV energy range during the 2023 outburst. We carry out epoch-dependent spectro-polarimetric study with IXPE over three epochs (IX1, IX2 and IX3) of integrated exposure of ks. In addition, quasi-simultaneous NICER and NuSTAR observations are used to infer the broad-band spectral distribution in keV energy range.
Indeed, the most astonishing result we obtain in this work is the detection of significant polarized emission of PD () and PA () in keV energy range during epoch IX1. This finding confirms the source under consideration (Swift J0243.6) as the first ULXP that exhibited the signature of polarized emissions. We find that PD increases up to in epoch IX2 and eventually decreases to during epoch IX3. However, moderate variation of PD with energy reaching up to (IX1), (IX2) and (IX3) at keV (see Fig. 2b and Table 1) are observed. Notably, no significant variation of PA is seen in different energy ranges for all the epochs. Needless to mention that the observed PD appears much lower compared to the theoretical model predictions (up to ) for XRPs (Meszaros et al., 1988; Caiazzo & Heyl, 2021a, b). Owing to that the polarization results of Swift J0243.6 are in agreement with the reported ‘low’ PDs in other XRPs, namely Cen X ( Tsygankov et al. 2022), 4U 1626 (, Marshall et al. 2022) and Vela X (, Forsblom et al. 2023).
We also find that PD increases with the decrease of luminosity in between epoch IX1 and IX2 (Fig. 2c) and it subsequently decreases at epoch IX3. Intriguingly, we observe an overall increase of PD as in presence of a dominant bbodyrad emission () at higher energies ( keV) of IXPE spectra. Notwithstanding, PD remains within in cutoffpl dominated spectral domain () below keV (see Fig. 2c). In addition, the spectra of quasi-simultaneous NICER epochs (NI2, NI3 and NI4) also show the dominance of bbodyrad component beyond keV. Based on these findings, we infer that bbodyrad emission contributes to the observed high polarization degree up to keV and cutoffpl component (dominated in keV) results depolarization in keV energy band with PD .
We detect strong pulsation in Swift J0243.6 with a spin period s during epoch IX1 of IXPE observation in keV energy range having pulse fraction (PF) of (see Fig. 3b). In addition, NuSTAR also detects pulsation of period s in keV with PF . Further, a monotonic increase in PF from ( keV) to ( keV) is obtained from the energy dependent pulsation study with NuSTAR. We note that similar energy dependent pulsation with PF varying within up to keV is observed with AstroSat during its 2017 outburst (Beri et al., 2021). The phase-resolved polarimetric study reveals the variation of PD and PA within and with pulse phases, respectively. Interestingly, we observe a marginal correlation between PD and the pulse intensity with a minimal variation of PA (see Fig. 3c). However, an anti-correlation between PD and source intensity is reported for several XRPs including Cen X (Tsygankov et al., 2022) and GRO J1008 (Tsygankov et al., 2023).
Meanwhile, in explaining ‘low’ PDs of XRPs, it has been proposed that ‘vacuum resonance’ at the transition point between the overheated upper NS surface and relatively cooler underlying layer could play a viable role (Doroshenko et al., 2022). In particular, ordinary and extraordinary modes of polarization start to convert into each other while passing through the vacuum resonance, where the polarization contribution from plasma and vacuum birefringence becomes equal (Lai & Ho, 2002). In other words, these two contributions acting against each other that results a depolarization of the radiation. It is noteworthy that the model predictions are superior at critical luminosities of the XRPs (Tsygankov et al., 2022). The XRP Swift J0243.6 having surface magnetic field of G (Kong et al., 2022) offers a critical luminosity erg (Mushtukov et al., 2015) which is close to the obtained luminosities during IXPE campaign. We speculate that the observed low PD in Swift J0243.6 could be resulted due to the effects of vaccum resonance similar to the prediction for Her X (Doroshenko et al., 2022) and Cen X (Tsygankov et al., 2022).
The broad-band energy spectrum with NICER and NuSTAR during NI1NU1 in keV, described by bbodyrad and cutoffpl components indicates bolometric luminosity ( keV) as erg . This luminosity exceeds the Eddington limit of XRPs, and hence confirms the ultra-luminous nature of the source. However, the luminosity ( keV) is seen to decrease as erg in the NICER epochs (NI2, NI3 and NI4) during the decay phase of the outburst. Note that a peak luminosity ( keV) of (Wilson-Hodge et al., 2018) and erg (Chhotaray et al., 2024) is reported with NICER during its giant outburst in 2017 and the recent one in 2023, respectively.
In conclusion, we report the first detection of phase-averaged as well as resolved polarization in the Galactic X-ray pulsar Swift J0243.6 during the decaying phase of the 2023 outburst.
5 Acknowledgments
SM and SD thank the Department of Physics, IIT Guwahati, India for providing the facilities to complete this work. RC, KJ and AN thank GH, SAG; DD, PDMSA, and Director, URSC for encouragement and continuous support to carry out this research. This publication uses data from the IXPE, NICER, NuSTAR, MAXI/GSC and Swift/BAT missions. We thank each instrument team for processing the data and providing necessary software tools for the analysis.
6 Data Availability
Data used for this publication are currently available at the HEASARC browse website (https://heasarc.gsfc.nasa.gov/db-perl/W3Browse/w3browse.pl).
| Component | Epoch | ( keV) | ( keV) | |||||||||
|---|---|---|---|---|---|---|---|---|---|---|---|---|
| (∘) | (keV) | () | (∘) | ( keV) | ( erg s-1) | ( erg s-1) | ||||||
| polconst | IX1 | |||||||||||
| IX2 | ||||||||||||
| IX3 | ||||||||||||
| polpow | IX1 | |||||||||||
| IX2 | ||||||||||||
| IX3 |
References
- Atapin et al. (2019) Atapin, K., Fabrika, S., & Caballero-García, M. D. 2019, MNRAS, 486, 2766, doi: 10.1093/mnras/stz1027
- Bachetti et al. (2014) Bachetti, M., Harrison, F. A., Walton, D. J., et al. 2014, Nature, 514, 202, doi: 10.1038/nature13791
- Bailer-Jones et al. (2018) Bailer-Jones, C. A. L., Rybizki, J., Fouesneau, M., Mantelet, G., & Andrae, R. 2018, The Astronomical Journal, 156, 58, doi: 10.3847/1538-3881/aacb21
- Baldini et al. (2022) Baldini, L., Bucciantini, N., Lalla, N. D., et al. 2022, SoftwareX, 19, 101194, doi: 10.1016/j.softx.2022.101194
- Basko & Sunyaev (1976) Basko, M. M., & Sunyaev, R. A. 1976, MNRAS, 175, 395, doi: 10.1093/mnras/175.2.395
- Beri et al. (2021) Beri, A., Naik, S., Singh, K. P., et al. 2021, MNRAS, 500, 565, doi: 10.1093/mnras/staa3254
- Caiazzo & Heyl (2021a) Caiazzo, I., & Heyl, J. 2021a, MNRAS, 501, 129, doi: 10.1093/mnras/staa3429
- Caiazzo & Heyl (2021b) —. 2021b, MNRAS, 501, 109, doi: 10.1093/mnras/staa3428
- Chatterjee et al. (2023) Chatterjee, R., Agrawal, V. K., Jayasurya, K. M., & Katoch, T. 2023, MNRAS, 521, L74, doi: 10.1093/mnrasl/slad026
- Chatterjee et al. (2021) Chatterjee, R., Agrawal, V. K., & Nandi, A. 2021, MNRAS, 505, 3785, doi: 10.1093/mnras/stab1499
- Chhotaray et al. (2024) Chhotaray, B., Jaisawal, G. K., Nandi, P., et al. 2024, arXiv e-prints, arXiv:2401.15058, doi: 10.48550/arXiv.2401.15058
- Doroshenko et al. (2022) Doroshenko, V., Poutanen, J., Tsygankov, S. S., et al. 2022, Nature Astronomy, 6, 1433, doi: 10.1038/s41550-022-01799-5
- Feng & Soria (2011) Feng, H., & Soria, R. 2011, New A Rev., 55, 166, doi: 10.1016/j.newar.2011.08.002
- Forsblom et al. (2023) Forsblom, S. V., Poutanen, J., Tsygankov, S. S., et al. 2023, ApJ, 947, L20, doi: 10.3847/2041-8213/acc391
- Jayasurya et al. (2023) Jayasurya, K. M., Agrawal, V. K., & Chatterjee, R. 2023, MNRAS, 525, 4657, doi: 10.1093/mnras/stad2601
- Kennea et al. (2017) Kennea, J. A., Lien, A. Y., Krimm, H. A., Cenko, S. B., & Siegel, M. H. 2017, The Astronomer’s Telegram, 10809, 1
- King et al. (2023) King, A., Lasota, J.-P., & Middleton, M. 2023, New A Rev., 96, 101672, doi: 10.1016/j.newar.2022.101672
- Kong et al. (2022) Kong, L.-D., Zhang, S., Zhang, S.-N., et al. 2022, The Astrophysical Journal Letters, 933, L3, doi: 10.3847/2041-8213/ac7711
- Kushwaha et al. (2023) Kushwaha, A., Jayasurya, K. M., Agrawal, V. K., & Nandi, A. 2023, MNRAS, 524, L15, doi: 10.1093/mnrasl/slad070
- Lai & Ho (2002) Lai, D., & Ho, W. C. G. 2002, ApJ, 566, 373, doi: 10.1086/338074
- Leahy (1987) Leahy, D. A. 1987, A&A, 180, 275
- Leahy et al. (1983) Leahy, D. A., Darbro, W., Elsner, R. F., et al. 1983, ApJ, 266, 160, doi: 10.1086/160766
- Majumder et al. (2023) Majumder, S., Das, S., Agrawal, V. K., & Nandi, A. 2023, MNRAS, 526, 2086, doi: 10.1093/mnras/stad2889
- Majumder et al. (2024) Majumder, S., Kushwaha, A., Das, S., & Nandi, A. 2024, MNRAS, 527, L76, doi: 10.1093/mnrasl/slad148
- Malacaria et al. (2023) Malacaria, C., Heyl, J., Doroshenko, V., et al. 2023, A&A, 675, A29, doi: 10.1051/0004-6361/202346581
- Marshall et al. (2022) Marshall, H. L., Ng, M., Rogantini, D., et al. 2022, ApJ, 940, 70, doi: 10.3847/1538-4357/ac98c2
- Meszaros et al. (1988) Meszaros, P., Novick, R., Szentgyorgyi, A., Chanan, G. A., & Weisskopf, M. C. 1988, ApJ, 324, 1056, doi: 10.1086/165962
- Mushtukov & Tsygankov (2022) Mushtukov, A., & Tsygankov, S. 2022, arXiv e-prints, arXiv:2204.14185, doi: 10.48550/arXiv.2204.14185
- Mushtukov et al. (2015) Mushtukov, A. A., Suleimanov, V. F., Tsygankov, S. S., & Poutanen, J. 2015, MNRAS, 447, 1847, doi: 10.1093/mnras/stu2484
- Mushtukov et al. (2023) Mushtukov, A. A., Tsygankov, S. S., Poutanen, J., et al. 2023, MNRAS, 524, 2004, doi: 10.1093/mnras/stad1961
- Reig et al. (2020) Reig, P., Fabregat, J., & Alfonso-Garzón, J. 2020, A&A, 640, A35, doi: 10.1051/0004-6361/202038333
- Serim et al. (2023) Serim, M. M., Dönmez, Ç. K., Serim, D., et al. 2023, MNRAS, 522, 6115, doi: 10.1093/mnras/stad1407
- Suleimanov et al. (2023) Suleimanov, V. F., Forsblom, S. V., Tsygankov, S. S., et al. 2023, A&A, 678, A119, doi: 10.1051/0004-6361/202346994
- Tsygankov et al. (2022) Tsygankov, S. S., Doroshenko, V., Poutanen, J., et al. 2022, ApJ, 941, L14, doi: 10.3847/2041-8213/aca486
- Tsygankov et al. (2023) Tsygankov, S. S., Doroshenko, V., Mushtukov, A. A., et al. 2023, A&A, 675, A48, doi: 10.1051/0004-6361/202346134
- Walton et al. (2018) Walton, D. J., Fürst, F., Heida, M., et al. 2018, ApJ, 856, 128, doi: 10.3847/1538-4357/aab610
- Weisskopf et al. (2022) Weisskopf, M. C., Soffitta, P., Baldini, L., et al. 2022, Journal of Astronomical Telescopes, Instruments, and Systems, 8, 026002, doi: 10.1117/1.JATIS.8.2.026002
- Wilms et al. (2000) Wilms, J., Allen, A., & McCray, R. 2000, ApJ, 542, 914, doi: 10.1086/317016
- Wilson-Hodge et al. (2018) Wilson-Hodge, C. A., Malacaria, C., Jenke, P. A., et al. 2018, The Astrophysical Journal, 863, 9, doi: 10.3847/1538-4357/aace60
| Components | Parameters | NI1NU1 | NI2 | NI3 | NI4 |
|---|---|---|---|---|---|
| Tbabs | |||||
| bbodyrad | (keV) | ||||
| cutoffpl | |||||
| (keV) | |||||
| gaussian | (keV) | ||||
| (keV) | |||||
| ( erg ) | |||||
| ( erg ) | |||||
| /d.o.f () | () | () | () | () |
-
∗Frozen. †Calculated in keV.