\ul
Pattern-wise Transparent Sequential Recommendation
Abstract.
A transparent decision-making process is essential for developing reliable and trustworthy recommender systems. For sequential recommendation, it means that the model can identify critical items as the justifications for its recommendation results. However, achieving both model transparency and recommendation performance simultaneously is challenging, especially for models that take the entire sequence of items as input without screening. In this paper, we propose an interpretable framework (named PTSR) that enables a pattern-wise transparent decision-making process. It breaks the sequence of items into multi-level patterns that serve as atomic units for the entire recommendation process. The contribution of each pattern to the outcome is quantified in the probability space. With a carefully designed pattern weighting correction, the pattern contribution can be learned in the absence of ground-truth critical patterns. The final recommended items are those items that most critical patterns strongly endorse. Extensive experiments on four public datasets demonstrate remarkable recommendation performance, while case studies validate the model transparency. Our code is available at https://anonymous.4open.science/r/PTSR-2237.
1. Introduction
Recommender systems have been engineered to expedite the process of identifying items that align with users’ interests and to do so with a high degree of precision. In the contemporary landscape, there is an emergent requirement for a transparent decision-making process for recommender systems, that is becoming increasingly vital in domains such as education (Conati et al., 2018), finance (Lin and Gao, 2022), and news (Guo et al., 2023). The model efficacy is not solely quantified by the precision of recommendation results but also by its capacity to furnish cogent and comprehensible justifications for its recommendations — how the input (i.e., interacted items) affects output (i.e., candidate items to be recommended). This attribute is not only desirable but also forms the foundation for burgeoning research themes, including the pursuit of diversity (Adomavicius and Kwon, 2012) and controllability (Tsai and Brusilovsky, 2021).
In the literature of sequential recommendation (Cen et al., 2020; Du et al., 2023; Tan et al., 2021; Chen et al., 2021), most of the studies share the same spirit that models the change of behavior sequences to characterize the dynamic user interests and learn the corresponding user representations for performance maximization. Introducing sophisticated modules boosts recommendation accuracy but at the cost of model transparency. Although certain attention-based models (Tal et al., 2021; Gholami et al., 2022) are capable of providing a degree of rationalization regarding the significance of items, reliance on attention scores in isolation is inconsistent and potentially deceptive. The aforementioned literature reflects an issue, namely, recommendation performance and model transparency are hard to be achieved simultaneously. How to efficiently clarify the contribution of sequence terms to the target term while maintaining superior sequence modeling capabilities is the main challenge addressed in this paper.
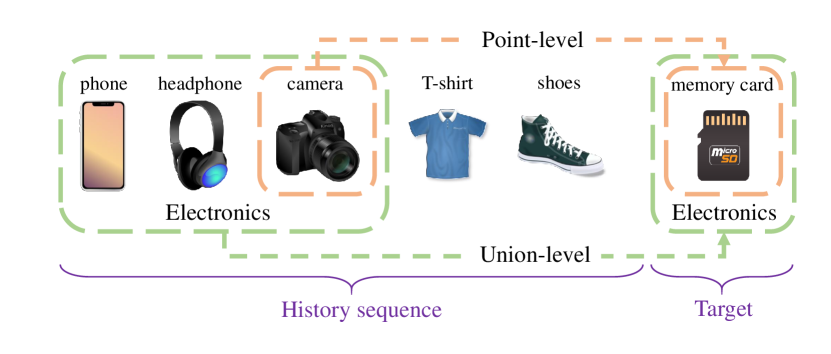
To this end, we propose PTSR, a novel Pattern-wise Transparent Sequential Recommendation model, to bridge the gap between transparency and performance. The model learns the evolution of user interests by building diverse patterns reflecting the varied granularity of interests. In general, the patterns could be divided into two types: point-level and union-level patterns. The former refers to individual items providing straightforward clues in terms of user intention. The latter consists of a group of items sequentially interacted by the user, that captures coarse-grained interests at particular moments. As illustrated in Figure 1, the camera itself provides convincing evidence for the purchase of a memory card since it is a must-have accessory for a camera. Additionally, the co-occurrence of ’phone’, ’headphone’, and ’camera’ collectively implies the user’s interest in electronics, which contributes to a union-level explanation.
Fusing the items belonging to the same pattern poses another challenge. It is important to capture the common item characteristics within the pattern to accurately represent the underlying user interests. The normal vector representation equipped with the dot product, however, violates the triangle inequality (Zheng et al., 2019; Fan et al., 2022; Ma et al., 2020), thereby leading to suboptimal results. Therefore, we turn to probabilistic embedding, which models each item as a collection of distributions. Recently, Gaussian embedding for uncertainty modeling (Zheng et al., 2019; Fan et al., 2022; Ma et al., 2020) and Gamma/Beta embedding for logical reasoning (Ren and Leskovec, 2020; Yang et al., 2022; Yuan et al., 2023) have exhibited promising results. Within this context, the utilization of Gamma or Beta distributions is favored owing to their inherent closure property. This characteristic guarantees that the fused pattern representation remains within the identical probability space as the candidate item, thereby preserving the mathematical integrity of the model. Subsequently, the Kullback-Leibler (KL) divergence, as opposed to the Euclidean distance, may be employed as a metric to assess contribution to candidate items. A pattern is deemed to have a greater influence on the recommendation of a candidate item if there is a reduced KL divergence observed between their respective distributions.
However, it is infeasible to directly conduct supervised pattern contribution learning as the sequences are not labeled with critical patterns. Minimizing the total distance to the positive samples while simultaneously maximizing the total distance to the negative samples is a feasible but problematic solution. In this vein, the optimization will skew towards non-critical patterns rather than critical patterns due to the overwhelming number of non-critical patterns. To address this problem, we propose a correction method that combines a distance-based weight with a sequence-aware bias. The former assigns higher weights to current ‘critical’ patterns, while the latter injects more user-specific information.
Our contributions can be summarized as follows:
-
•
Previous sequential models have difficulties in accurately identifying critical items. PTSR explicitly extracts fine-grained patterns by applying a multi-level sliding window to the item sequence. They form the atomic units for modeling point-level and union-level contributions.
-
•
To accurately learn the interrelationships, we employ probabilistic embedding instead of normal vector representation. This allows us to model the inherent uncertainties and dependencies in the data more effectively. Then, a pattern is considered to be more critical to the recommendation decision if its KL-divergence to the recommended item is lower.
-
•
Supervised pattern contribution learning is infeasible in practice due to the absence of labeled critical patterns. A carefully designed pattern weighting correlation is developed to make it learnable.
-
•
Extensive experiments have been conducted to demonstrate the superior recommendation performance of PTSR compared to eight baseline methods. Additionally, a case study further verifies the transparency of PTSR in providing explanations for its recommendation results.
2. Related Work
In this section, we discuss related work from the two aspects: (1) representative methods for sequential recommendation we studied; (2) novel embeddings for recommendation that partially inspire our proposed method.
2.1. Sequential Recommendation
Recommender systems are developed to retrieve items of interest to the user, among which sequential models (Kang and McAuley, 2018; Li et al., 2020) have gained particular attention in the research community because of their potential in dynamic interest modeling. As early efforts, FPMC (Rendle et al., 2010) and the follow-up works (He and McAuley, 2016) explore the sequence information based on Markov chains. Then, the resurgence of deep learning is revolutionizing the field of recommendation. GRU4Rec (Hidasi et al., 2016) and Caser (Tang and Wang, 2018) respectively employ the GRU (Cho et al., 2014) and convolutional filters for sequence modeling. SASRec (Kang and McAuley, 2018) and BERT4Rec (Sun et al., 2019) are two Transformer-based models that differ in their utilization of self-attention mechanisms (Vaswani et al., 2017).
Apart from the recommendation performance, there is a growing demand for transparent decision-making processes. However, the pursuit of model transparency encounters more difficulties in the design of architectures that preserve superior recommendation performance. Attention-based sequence models (Tal et al., 2021; Gholami et al., 2022) claim to have an advantage in this regard because their intrinsic attention scores can be used to identify key items. However, many recent studies (Serrano and Smith, 2019; Jain and Wallace, 2019; Wiegreffe and Pinter, 2019). have questioned the true interpretability of this approach. In contrast, the pattern contribution proposed in this paper is decision-transparent at the model architecture level while preserving satisfactory recommendation performance.
2.2. Novel Embedding for Recommendation
Recently, novel types of embedding, such as distribution-based and geometry-based etc., have begun to demonstrate remarkable performance. These embeddings differ fundamentally from traditional embedding by not confining users or items to a single point in vector space. Several studies have sought to integrate these advancements into recommendation systems to enhance model performance and cognitive capabilities. For instance, DDN (Zheng et al., 2019), PMLAM (Ma et al., 2020), DT4SR (Fan et al., 2021), and STOSA (Fan et al., 2022) have challenged the efficacy of the dot product, which they argue violates the triangular inequality, leading to suboptimal results. To address this, they propose modeling users and items as Gaussian distributions. Apart from those representations, other studies have explored Beta (Ren and Leskovec, 2020) and Gamma (Yang et al., 2022) distribution-based representations, introducing logical operators customized for closures that operate upon these distributions, thereby laying the groundwork for subsequent methodologies. For example, SRPLR (Yuan et al., 2023) employs Beta embedding as foundational representations and merges its logical operators with neural networks to amplify the efficacy of traditional models. Beyond distribution types, geometry-based embedding gains popularity as well. Zhang et al. (Zhang et al., 2021) propose the use of hypercuboids to explicitly represent and model user interests. CBox4CR (Liang et al., 2023) seeks to refine model cognition through Box embedding, enabling logical operations on their closures.
Harnessing the strong representational powers of these novel embedding and the logical operators established upon them, which are adept at capturing item relationships, we integrate probability distribution-based embeddings (e.g., Beta and Gamma embeddings) into our model, which facilitate modeling the pattern representations introduced later.
3. Methodology
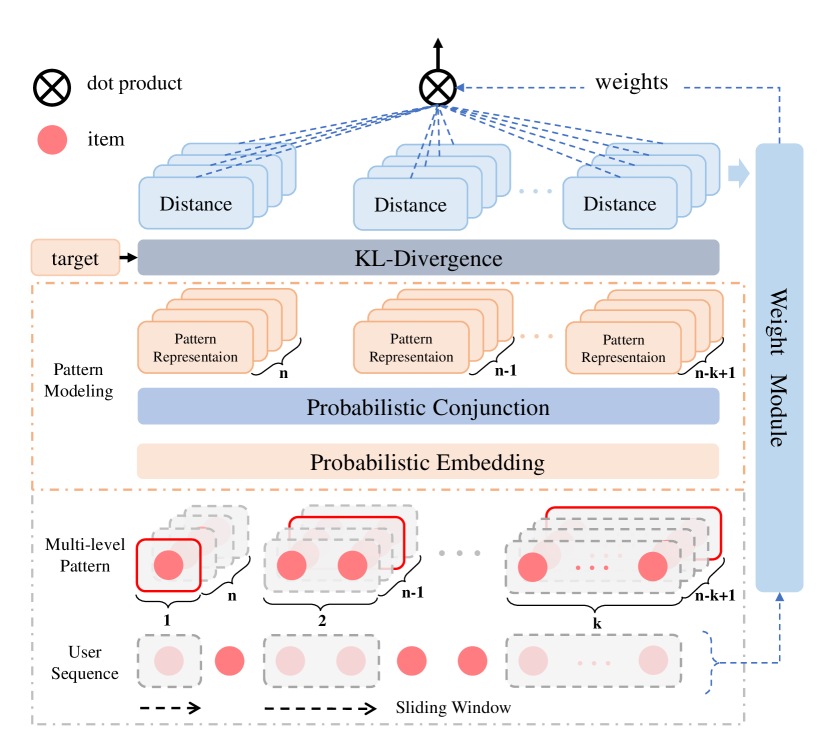
In this section, we introduce an interpretable sequential recommendation model with a transparent decision-making process. As the overview of PTSR in Figure 2 shows, the model transparency starts with a multi-level sliding window technique for fine-grained patterns, each of which carries specific characteristics the user may be interested in. To further refine the common characteristics within the pattern, we resort to probabilistic embedding instead of normal vector representations for efficacy consideration. However, supervised pattern contribution learning is infeasible in practice due to the absence of ground-truth critical patterns. We therefore elaborate a novel pattern correction weight so that implicit pattern contribution learning is possible.
3.1. Multi-level Pattern Extraction
Previous works typically take as input the entire item sequence for subsequent prediction or interpretability tasks. On the contrary, we begin by extracting multi-level patterns from the item sequence, which form the atomic units for a transparent decision-making process. To be specific, it explicitly splits the sequence by a sliding window of size , and the -th slice is defined as
Notably, patterns of different levels are capable of being interpreted from different perspectives:
-
•
represents an individual item. Such point-level pattern appears simple but is capable of providing the most straightforward and human-friendly explanation. For example, the purchase of a camera rather than a T-shirt contributes more to the purchase of a memory card. A reliable sequence model should accurately learn these similarities across items.
-
•
Beyond point-level pattern, a sliding window of size leads to union-level patterns, which consists of a group items interacted by the user sequentially. As such, these union-level patterns are valuable for capturing the user intention at a deeper level. For example, the co-occurrence of ‘phone’, ‘headphone’, and ‘camera’ implies a clear interest in electronics, making it reasonable to recommend ‘memory card’. The capability of union-level pattern contribution modeling is essential for competitive recommendation performance.
Since both point-level and union-level patterns are essential for a transparent decision-making process, we collect all patterns with levels ranging from 1 to . The remaining challenge is how to effectively integrate the items for pattern-wise representations.
3.2. Item Fusion via Probabilistic Embedding
Item fusion is straightforward for point-level patterns but not so for union-level patterns. Previous researches typically embed each item into a learnable vector , and then the item embeddings belonging to the same pattern are fused in a (weighted) average manner, denoted by
where is the weight associated with . However, this representation method equipped with the dot product violates the triangle inequality (Zheng et al., 2019; Fan et al., 2022; Ma et al., 2020), thereby leading to suboptimal results.
To address this issue, we resort to probabilistic embedding based on Gamma or Beta distributions, in which case the elements of are considered as shape/rate parameters. Specifically, the Gamma distribution is jointly described by a shape parameter and a rate parameter , while the Beta distribution is defined by two shape parameters . Both of them lead to the probabilistic embedding
| (1) |
The distributions can be understood as the descriptions of diverse item characteristics, and the differences along the dimensions can be separately measured by probabilistic metrics such as Kullback-Leibler (KL) divergence instead of Euclidean distance.
It is worth remarking that other distributions such as Gaussian distribution are also widely used, but Gamma or Beta distributions are preferable here for their closure property: denoted by the probability density function (PDF) of a Gamma or Beta distribution, we have
| (2) |
Therefore, Gamma (Beta) distributions after a ‘weighted average’ remain a Gamma (Beta) distribution. This property ensures that the yielded pattern representations lie in the identical probability space as the candidate items, so subsequent contribution quantification is mathematically meaningful.
With the aid of the probabilistic embedding, we are now prepared to extract common characteristics within a pattern. Given a -length pattern , we separately apply the fusion operation along the embedding dimension, yielding a vectorized extension of Eq. (2):
| (3) |
where denotes the element-wise product, and a self-attentive mechanism is used to boost the model’s expressive power,
where denotes the vector concatenation. Due to the operation, we have .
3.3. Pattern Contribution Learning
For a pattern and a candidate item , the extent to which supports being recommended can be quantified as the (negative) KL divergence between their respective distributions:
| (4) |
Intuitively, the smaller the is, the more the pattern contributes to the recommendation of .
Therefore, the primary principle of pattern contribution learning is to keep the critical patterns close to the target item. However, due to the unavailability of ground-truth critical patterns, supervised pattern contribution learning is infeasible in practice. One might expect that minimizing the sum of distances from the target item and simultaneously maximizing the distances from the negative item would produce satisfactory results, but it is not the case for some reasons below.
-
•
The distance (i.e., the KL-divergence) between critical patterns and the target item may decrease rapidly at the beginning of training. Soon it becomes easier to reduce the distance of non-critical patterns, eventually leading to marginal contribution differences across various patterns.
-
•
Summing the distances is too naïve to achieve competitive recommendation performance. Two different candidate items may be considered equally good in this vein despite the large difference in distance from the critical pattern. For instance, consider a pattern whose distance to the candidate is 0.1 and to the candidate is 0.8. In contrast, another pattern has a distance of 4.9 to and 4.2 to . Compared to , is arguably the critical pattern for both candidate items, and thus should be recommended as it receives more support from . But they are of the same value according to the summing distance.
Hence, it is necessary to correct the total distance for next-item recommendation in order to highlight the critical patterns that have low distances from the target item. The pattern correction weight is consequently developed as an alternative to summation. It constitutes a distance-based weight and a sequence-aware bias introduced next.
Distance-based weight. Patterns deemed important will exhibit smaller distances from the target item and thus require larger weights to emphasize their contribution. Conversely, patterns far from the target item are of lower importance and should be assigned smaller weights. In order to maintain a proportional correspondence between the distance values and the weight values, the distance-based weights are normalized through a softmax function over the negative distances. The weight of -th pattern at level can be expressed as:
| (5) |
where is the pattern set of -th level.
Please be aware that the distance-based weights are independently calculated for each level. In this vein, patterns at the same level will compete with each other, and eventually, the most important patterns will stand out. Besides, patterns at different levels will collaborate to improve recommendation performance.
Sequence-aware bias. The distance-based weight can not only discern the importance of patterns but also detect alterations in the sequence of items, a crucial attribute in sequence recommendation. However, there is one exception to the incapacity to perceive changes in the sequence’s order — when the entire sequence is reversed. The primary reason for this exception is that, in cases where only some items change their order, there must exist a pair of items that were not adjacent before but are now adjacent. In such instances, a sliding window of size 2 can capture this change. Nevertheless, when the entire sequence is reversed, there is no alteration in the adjacency between items.
We opt to introduce a sequence-aware bias to the distance-based weight, allowing it to adapt as the overall sequence order changes. Its practical significance lies in its interpretability as an evolutionary direction of user interest. Specifically, we employ an to derive the sequence-aware weight, leveraging the sensitivity of to input order (Li et al., 2022). Concerning the input for the , for each item in the sequence, we initially combine the and in their Gamma embedding using . The updated representation of the -th item can be expressed as . This operation directly reduces the number of parameters in the MLP by half while preserving information compared to directly concatenating and . Subsequently, we concatenate these updated representations of all items to form the input for . For ’s output, we also use softmax for normalization. The sequence-aware bias of -th pattern at level is expressed as
| (6) |
where is the sequence length. Since each level has a different number of patterns, we set the bias for each level individually.
Combining the distance-based weight and sequence-aware bias, we can get the final pattern correction weight:
| (7) | ||||
where is a hyperparameter used to control the effect of bias.
3.4. Prediction and Training Objective
With the pattern correction weight across levels and patterns, the eventually corrected distance is defined as
| (8) |
The smaller this corrected distance is, the more the corresponding candidate item should be recommended.
The training objective of PTSR is then designed to to minimize the corrected distance to positive sample , while simultaneously to maximize the corrected distance to negative samples ; that is,
| (9) | ||||
where is a hyper-parameter to specify a margin.
| Dataset | #Users | #Items | #Interactions | Avg.Len | Sparsity |
|---|---|---|---|---|---|
| Beauty | 22363 | 12101 | 198502 | 8.87 | 99.93% |
| Toys | 19412 | 11924 | 167597 | 8.63 | 99.93% |
| Tools | 16638 | 10217 | 134476 | 8.08 | 99.92% |
| Yelp | 30431 | 20033 | 316354 | 10.39 | 99.95% |
4. Experiments
In this section, we focus on the following questions, with related experiments demonstrating the performance and interpretability of our model in several ways:
-
•
RQ1: How is the recommendation performance of our model compared to other models?
-
•
RQ2: How much do the key components of the model, namely multi-level pattern, Gamma embedding, and pattern weight, contribute to the effectiveness of the model?
-
•
RQ3: What effect does the parameter of sequence-aware bias have on the model’s effectiveness?
-
•
RQ4: How is the interpretability of the model represented?
| Methods | Beauty | Toys | Tools | Yelp | ||||||||||||
| N@5 | N@10 | HR@5 | HR@10 | N@5 | N@10 | HR@5 | HR@10 | N@5 | N@10 | HR@5 | HR@10 | N@5 | N@10 | HR@5 | HR@10 | |
| GRU4Rec | 0.2511 | 0.2836 | 0.3402 | 0.4410 | 0.2392 | 0.2734 | 0.3308 | 0.4367 | 0.1618 | 0.1961 | 0.2350 | 0.3414 | 0.3998 | 0.4537 | 0.5661 | 0.7322 |
| Caser | 0.2303 | 0.2641 | 0.3206 | 0.4252 | 0.2179 | 0.2500 | 0.3014 | 0.4009 | 0.1520 | 0.1824 | 0.2188 | 0.3135 | 0.3772 | 0.4301 | 0.5357 | 0.6988 |
| SASRec | 0.2963 | 0.3270 | 0.3882 | 0.4832 | 0.2866 | 0.3208 | 0.3867 | 0.4925 | 0.2107 | 0.2427 | 0.2891 | 0.3885 | 0.4339 | 0.4875 | 0.5986 | 0.7639 |
| Bert4Rec | 0.3039 | 0.3361 | 0.3989 | 0.4987 | 0.2799 | 0.3139 | 0.3734 | 0.4786 | \ul0.2185 | \ul0.2523 | \ul0.3017 | \ul0.4067 | 0.4567 | 0.5032 | 0.6167 | 0.7599 |
| STOSA | 0.2737 | 0.3075 | 0.3725 | 0.4772 | 0.2898 | 0.3214 | 0.3816 | 0.4795 | 0.2120 | 0.2440 | 0.2905 | 0.3897 | 0.4117 | 0.4646 | 0.5695 | 0.7329 |
| CBox4CR | 0.2959 | 0.3297 | 0.3997 | \ul0.5044 | 0.2775 | 0.3116 | 0.3791 | 0.4848 | 0.1943 | 0.2289 | 0.2758 | 0.3832 | \ul0.4622 | \ul0.5156 | \ul0.6383 | \ul0.8026 |
| SPRLR | \ul0.3219 | \ul0.3517 | \ul0.4100 | 0.5024 | \ul0.3176 | \ul0.3485 | \ul0.4075 | \ul0.5035 | 0.2094 | 0.2408 | 0.2836 | 0.3813 | 0.4609 | 0.5113 | 0.6247 | 0.7797 |
| PTSR-General | 0.1983 | 0.2309 | 0.2791 | 0.3804 | 0.1531 | 0.1864 | 0.2189 | 0.3227 | 0.1734 | 0.2048 | 0.2432 | 0.3404 | 0.3464 | 0.4037 | 0.4888 | 0.6660 |
| PTSR-Beta | 0.3345* | 0.3677* | 0.4428* | 0.5455* | 0.3209* | 0.3542* | 0.4227* | 0.5257* | 0.2404* | 0.2756* | 0.3311* | 0.4401* | 0.4964* | 0.5441* | 0.6626* | 0.8094* |
| Improv. | 3.91% | 4.55% | 8.00% | 8.15% | 1.04% | 1.64% | 3.73% | 4.41% | 10.02% | 9.24% | 8.88% | 8.21% | 7.40% | 5.53% | 3.81% | 0.85% |
| PTSR-Gamma | 0.3355* | 0.3689* | 0.4449* | 0.5484* | 0.3233* | 0.3572* | 0.4261* | 0.5308* | 0.2425* | 0.2776* | 0.3342* | 0.4433* | 0.4949* | 0.5433* | 0.6618* | 0.8105* |
| Improv. | 4.21% | 4.91% | 8.51% | 8.72% | 1.81% | 2.47% | 4.57% | 5.43% | 10.96% | 10.02% | 10.79% | 9.00% | 7.07% | 5.37% | 3.68% | 0.98% |
4.1. Experimental Setup
Datasets. We evaluate our model on four publicly available datasets from two different sources:
-
•
Amazon which records user reviews of the site’s products, is widely used for validation. The data is divided into multiple datasets according to the category of items. We select Beauty, Toys, Tools that are known for high data sparsity.
-
•
Yelp is a famous merchant review website, by which the dataset released contains data on user ratings of merchants on the site.
Following (Kang and McAuley, 2018; He et al., 2017), we filter out the users and items with fewer than 5 interactions, and split the dataset in a leave-one-out fashion. The penultimate item is used for validation and the last item serves for testing. The statistics of the processed datasets are summarized in Table 1.
Evaluation metrics. We employ two commonly used metrics for model evaluation, including Normalized Discounted Cumulative Gain (NDCG) and Hit Ratio (HR). NDCG is a metric assessing the efficiency of a ranking system by considering the placement of relevant items within the ranked list. HR is the accuracy of ground-truth items that appear in top recommendation list. To enhance the evaluation’s effectiveness, we employ the real-plus-N (Said and Bellogín, 2014) to calculate the metrics. More specifically, we randomly choose 100 items that users have not interacted with as negative samples. These are then combined with the ground truth to create a candidate set for ranking. NDCG@5, NDCG@10, HR@5, HR@10 are reported.
4.2. Baselines
In order to fully demonstrate the effect of our model, we choose three different groups of recommendation baselines. The models in the first group utilize recurrent neural networks and classical convolution operations to model user interests:
The methods in the second group leverage the self-attention mechanism to model long-term behavioral patterns:
The third group of baselines applies novel embedding (such as probabilistic embedding, box embedding) to recommendation task, which improves the modeling and representation capabilities:
-
•
STOSA (Fan et al., 2022): This approach involves embedding items as stochastic Gaussian distributions and introducing a novel Wasserstein Self-Attention module to characterize item-item relationships.
-
•
CBox4CR (Liang et al., 2023): It uses box embedding to represent items, so it can model user and item in a closed manner and introduce logical operators based on box embedding.
-
•
SRPLR (Yuan et al., 2023): A newer framework proposing to combine deep learning with symbolic learning, which utilizes Beta embedding to model logical relationships. We set its backbone to SASRec.
Implementation details. We implement PTSR using PyTorch and employ the Adam optimizer (Kingma and Ba, 2015) with a learning rate of 0.001, and a weight decay coefficient searched within {1e-9, 1e-8, 1e-7, 1e-6}. Across all the datasets, setting the pattern levels to 2 yields the optimal recommendation performance. Following previous studies (Yuan et al., 2023; Liang et al., 2023), the embedding size of either or is fixed to 64. The hyper-parameter for enhancing the sequence-aware bias is discussed in Section 4.5.
We reproduce the results of CBox4CR, STOSA, and SRPLR according to their official code, and the implementation for other models mainly due to RecBole (Zhao et al., 2022). We employ a grid search strategy to meticulously explore optimal hyper-parameters for all baselines. For fair comparisons, only implicit feedback interactions are available for all methods during training. The maximum sequence length is set to 20 as the average sequence length is around 10 for all the datasets. All the methods are trained from scratch on a single NVIDIA GeForce RTX 2080 Ti GPU with a batch size of 512.
4.3. Overall Performance (RQ1)
The effects of all methods are shown in Table 2, and by looking at the experiment result, we can draw several conclusions.
Firstly, Caser, which utilizes convolution kernels, and GRU4Rec, employing a recurrent neural network, demonstrate some effectiveness but are comparatively less desirable when compared to other models. The reason for this could be attributed to the relative simplicity of Caser’s structure and the potential loss of information during its max pooling operation following convolution. GRU4Rec also struggles with complex item interactions due to modeling capabilities. In contrast, our method uses probabilistic conjunction to fuse items inside a pattern, which can better capture the relationship between items and obtain accurate pattern representation.
Secondly, self-attention based approaches achieve comparable results, thanks to the powerful attention mechanism that can capture items at any position in the sequence. However, our approach still exhibits a significant improvement over them. This improvement is mainly attributed to the fact that, while attention weights can be employed to differentiate the contributions of different items, the assignment of these weights may be inaccurate, capturing some spurious item relationships, which in turn affects the prediction results. That’s why the studies (Serrano and Smith, 2019; Jain and Wallace, 2019; Wiegreffe and Pinter, 2019) debate the interpretability of attention mechanism. In contrast, our model directly exploits the distance of each pattern in combination with its weight to determine the final prediction without nonlinear transformation. This not only enhances experimental results but also improves the transparency of the recommendation process w.r.t. input and output.
Thirdly, all methods based on novel embeddings achieve comparable results. STOSA shows a similar effect to SASRec, while CBox4CR outperforms other baselines on the Yelp dataset with the addition of box embedding. SRPLR, compared to other models, achieves the best results on the Beauty and Toys datasets, which indicates that its backbone SASRec, with the support of logical representation, can further enhance the expressive ability of sequence representation, thereby yielding improved prediction results. As a conclusion, the novel embeddings bring about a certain improvement compared to ordinary embeddings, possibly because the logical operators built upon it can enhance the model’s cognitive ability.
Finally, among our three different versions of PTSR, the general embedding based approach achieves the worst results, as expected due to the simplicity of our model structure compared to other approaches using the same embeddings. However, when we incorporate Beta embedding or Gamma embedding, the combination of their conjunction operation and multi-level patterns can fully demonstrate the superiority of our model. As evidenced by the experimental results, our method outperforms SRPLR with SASRec as the backbone or CBox4CR with a complex model structure. This outstanding performance can be attributed to several factors: (1) The extraction of multi-level patterns through a sliding window provides fine-grained inputs to the model. (2) Probabilistic conjunction on patterns allows for more accurately capturing the joint relationships between items compared to a standard pooling operation. (3) The weights of patterns play a dual role in differentiating the importance of various patterns and perceiving sequential information.
Note that in the rest of this section, all the reported results of our method correspond to PTSR-Gamma if not otherwise specified.
| Architecture | Beauty | Toys | Tools | Yelp |
|---|---|---|---|---|
| Default | 0.3689 | 0.3572 | 0.2776 | 0.5433 |
| w/o Distance-based weight | 0.3397 | 0.3357 | 0.2284 | 0.4809 |
| w/o Sequence-aware bias | 0.3530 | 0.3291 | 0.2717 | 0.5351 |
| w/o Both | 0.2797 | 0.2546 | 0.2336 | 0.4619 |
4.4. Ablation Study (RQ2)
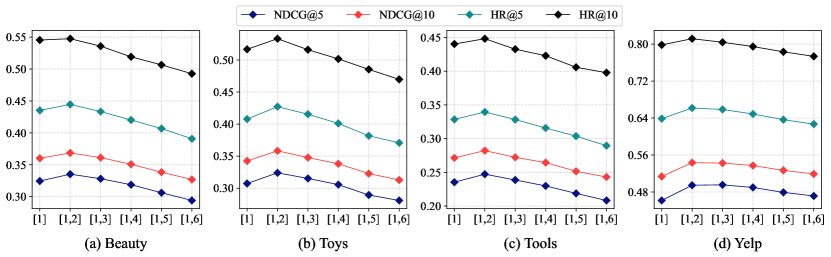
In this section, we analyze the contribution of each component to the model’s performance, which are multi-level patterns and the pattern correction weight consisting of two parts, namely distance-based weight and sequence-aware bias. We perform experiments by removing each component separately and the results are displayed in Figure 3 and Table 3.
Multi-level pattern extraction. It can be seen from Figure 3 that the recommendation performance of PTSR achieves the best consistently at . On the one hand, the case of yields superior results compared to point-level pattern () because of the positive impact of multi-level patterns for capturing combination relationships. On the other hand, the performance degrades when more levels (i.e., ) are involved. The possible reason for this is that larger patterns tend to contain different types of combinations, instead blurring the representation of the pattern. As the level continues to increase, the probability of getting an invalid pattern becomes larger, leading to a further decrease in effectiveness.

Pattern correction weight. As shown in Table 3, removing different weight sub-modules results in different performance, but there is no doubt that the performance decreases to varying degrees, which proves the necessity of each of our designs. First of all, when we remove distance-based weight and sequence-aware bias simultaneously, the model’s performance decreases the most, because at this time, the model directly sums up the distances between patterns and targets, which will lead to key patterns not being able to play a dominant role. Next, removing distance-based weight leads to a more substantial performance decline compared to sequence-aware bias removal (except for Toys). This is likely due to poor alignment of weights with distances when only sequence-aware bias is retained, resulting in inaccurate scoring because patterns with large weights may also have large distances.” In contrast, the decrease in performance is relatively small when sequence-aware bias is removed, since at this point the model may only lose part of the sequence order perception ability. However, the opposite performance on the Toys dataset may be due to the greater sequence-to-order correlation in it.
4.5. Impact of Hyper-Parameter (RQ3)
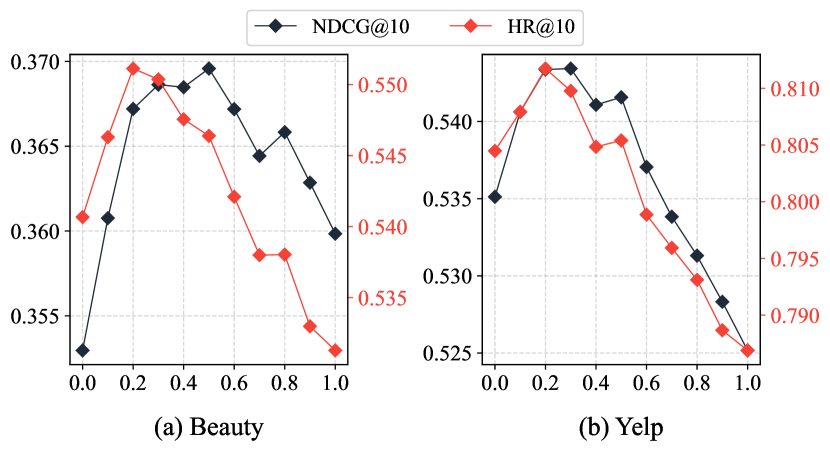
The parameter is utilized to control the proportion of sequence-aware bias in the overall weight. And the role of bias is to assist the model in compensating for its inability to discern order information, particularly in scenarios involving the reversal of the entire sequence. When is set to 0, it implies the complete removal of the bias. From Figure 3, it is apparent that has varying effects on the model across the two datasets. Firstly, on the left, on the Beauty dataset, there are notable differences in the trends of NDCG and HR. HR initially reaches its peak when is 0.2 relative to NDCG, indicating a significant recall of ground truth at this point. However, the model may have ranked them relatively low. NDCG reaches its peak at a NDCG of 0.5 and then begins to decline. When is set to 1, HR experiences a decline in effectiveness relative to the state that is 0, whereas NDCG improves. At this moment, the bias may influence the proportionality between distance-based weight and distance. This effect reduces the number of ground truths recalled by the model but can effectively prioritize those recalled items, ensuring their higher ranking positions. On the Yelp dataset on the right, both metrics exhibit relatively consistent behavior; they almost peak at a of 0.2 simultaneously, and both metrics decline relative to a of 0 when is set to 1.0. This underscores the importance of considering the distinct sequence patterns present in different datasets when designing models.
4.6. Interpretability Analysis (RQ4)
In this section, we delve into the interpretability of our approach using the Beauty dataset as a case study. Given that our interpretability aims to demonstrate the significance of each pattern within the sequence for various candidate items, we opt to compare with attention-based model SASRec. Its interpretability is characterized by the magnitude of the attention weights, a feature closely resembling ours. Since we do not know the exact meaning of deep attention, we extract here only the first level of attention, which represents the relative relationship between items. Statistical results as well as case-specific analysis are shown in Figure 5 and 6, respectively.
Statistical Analysis. Figure 5 illustrates the performance comparison between our model and SASRec across three item relationships: ”also bought”, ”also viewed”, and ”bought together”, all of which are present on the Beauty dataset. According to (McAuley et al., 2015), these relationships are compiled by Amazon through extensive data analysis. They do not represent ground truth but rather an estimation of item relationships. Hence, we utilize them solely as relative measures rather than as definitive model characterizations. It is worth noting that all the methods in this paper do not use such additional information to ensure generalizability and fair comparisons.
For each user sequence, there corresponds to a specific target item. Within each relationship category, we identify items from the sequence that share this relationship with the target item. Subsequently, we examine the magnitude of weights assigned by both models to these related items within the sequence. To enhance clarity, we convert the weight of the item into its position within the sequence after sorting it in descending order of weight; thus, the item with the highest weight occupies the first position after sorting, and so forth. For presentation purposes, we conducted separate experiments for the case study and modified the sequence length to 10. Hence, the x-axis is scaled from 1 to 10, representing 10 levels of importance. Following this procedure, we calculate the percentage of overall importance attributed to these related items in the prediction process across all dataset entries. As depicted in Figure 5, during the prediction process of SASRec, items more closely related to the target exhibit varying weights, indicating their respective importance. In contrast, our method demonstrates a distinct trend where these relevant items are notably emphasized in the prediction process of the model. Given that these relationships are derived from Amazon’s analysis of extensive user data, it is reasonable to infer that they reflect the actual purchasing behavior patterns of users. Consequently, relying on these highly relevant items when recommending products to users appears justified. As our model better captures the relationship between items, two key advantages emerge: (1) improved performance is achievable since our recommendations align more closely with the user’s behavioral patterns, and (2) our interpretability tends to be more accessible as it is rooted in the user’s purchasing tendencies.
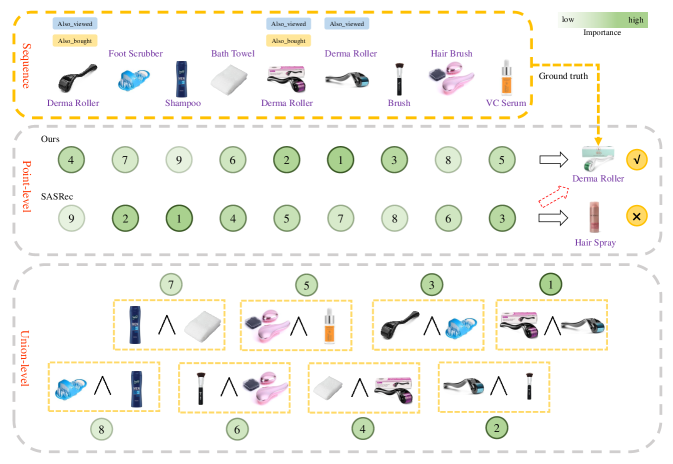
Case-specific Analysis. As can be seen in Figure 6, We randomly find a concrete example to get a figurative interpretive comparison. At the top of the display is the user interaction sequence, showcasing both the item’s title and an accompanying image. The label ”also viewed” positioned above an item signifies the presence of a relationship between it and the target item. Conversely, the absence of such a label indicates that no specific relationship between them is provided in the dataset. The item titles are proprietary names of beauty tools, including examples like ”Derma Roller”, which is utilized to stimulate skin regeneration and facilitate repair processes. Looking initially at the point-level comparison, we depict the significance of weights (translated into importance) assigned to each item in the prediction process by our method and SASRec. Our method emphasizes ”Derma Roller,” which appears at various positions within the sequence. Conversely, Hair-related products such as ”Shampoo” and ”Hair brush” are less important. Subsequently, our model generates predictions based on the importance attributed to the Derma Roller, which stands as the most pivotal item in the sequence and aligns with the ground truth of the current sequence.
Furthermore, upon examining the attention mechanism of SASRec, a lack of discernible pattern becomes apparent. For instance, items like ”Shampoo”, associated with hair care, and ”Foot Scrubber”, linked to foot washing, occupy the first and second positions of importance, respectively. However, the ”Derma Roller”, which holds greater relevance to the ground truth, is assigned lower importance. Consequently, the final recommendation ends up being ”Hair Spray”, which bears minimal relevance to the actual label. This discrepancy can be attributed to excessive attention given to ”Shampoo” within the sequence.
Note that although there is a partial relationship between the attention weights given by SASRec and the predicted target, for all candidate items it uses the same attention weights to obtain the final representation. While our method assigns varying degrees of importance to items within the sequence for different targets. Although interpretability is more subjective and not strictly measured, case-specific analysis reveals that our model gives an explanation that may be more acceptable and relatively more reasonable, which is very important for building users’ trust in recommendation results.
At the union level, we showcase certain scenarios when the level is 2. It’s evident that the probabilistic conjunction connection of two ”Derma roller” holds the utmost importance compared to other combinations of items. Additionally, combinations featuring one ”Derma Roller” also exhibit higher importance, thereby elucidating to the user why our model recommends the ”Derma Roller”- due to its robust correlation with the majority of patterns in sequence. Moreover, these explanations can serve as valuable references for merchants. By selling combinations of products, they can circumvent the need for users to search for related items individually, ultimately enhancing user experience while concurrently boosting profits.
5. Conclusion
In this study, we merge fine-grained patterns with probabilistic embedding to create a transparent and interpretable model for sequential recommendation, named PTSR. PTSR initially captures continuous patterns from sequences using sliding windows of varying sizes, employs probabilistic conjunction to fuse items for precise pattern representations, calculates the correlation between patterns and candidates using KL-divergence, and aggregates pattern weights to derive prediction scores for candidate items. This approach ensures accurate and reliable explanations for different candidates. Extensive experiments validate the efficacy of our model. In the future, we aim to refine our pattern extraction process, allowing the model to effortlessly identify correlations among more intricately interconnected items within the whole sequence.
References
- (1)
- Adomavicius and Kwon (2012) Gediminas Adomavicius and YoungOk Kwon. 2012. Improving Aggregate Recommendation Diversity Using Ranking-Based Techniques. IEEE Trans. Knowl. Data Eng. 24, 5 (2012), 896–911. https://doi.org/10.1109/TKDE.2011.15
- Cen et al. (2020) Yukuo Cen, Jianwei Zhang, Xu Zou, Chang Zhou, Hongxia Yang, and Jie Tang. 2020. Controllable Multi-Interest Framework for Recommendation. In KDD ’20: The 26th ACM SIGKDD Conference on Knowledge Discovery and Data Mining, Virtual Event, CA, USA, August 23-27, 2020. ACM, 2942–2951. https://doi.org/10.1145/3394486.3403344
- Chen et al. (2021) Zeyuan Chen, Wei Zhang, Junchi Yan, Gang Wang, and Jianyong Wang. 2021. Learning dual dynamic representations on time-sliced user-item interaction graphs for sequential recommendation. In Proceedings of the 30th ACM international conference on information & knowledge management. 231–240.
- Cho et al. (2014) Kyunghyun Cho, Bart van Merrienboer, Dzmitry Bahdanau, and Yoshua Bengio. 2014. On the Properties of Neural Machine Translation: Encoder-Decoder Approaches. In Proceedings of SSST@EMNLP 2014, Eighth Workshop on Syntax, Semantics and Structure in Statistical Translation, Doha, Qatar, 25 October 2014. Association for Computational Linguistics, 103–111. https://doi.org/10.3115/V1/W14-4012
- Conati et al. (2018) Cristina Conati, Kaska Porayska-Pomsta, and Manolis Mavrikis. 2018. AI in Education needs interpretable machine learning: Lessons from Open Learner Modelling. CoRR abs/1807.00154 (2018). arXiv:1807.00154 http://arxiv.org/abs/1807.00154
- Du et al. (2023) Jing Du, Zesheng Ye, Bin Guo, Zhiwen Yu, and Lina Yao. 2023. IDNP: Interest Dynamics Modeling Using Generative Neural Processes for Sequential Recommendation. In Proceedings of the Sixteenth ACM International Conference on Web Search and Data Mining, WSDM 2023, Singapore, 27 February 2023 - 3 March 2023. ACM, 481–489. https://doi.org/10.1145/3539597.3570373
- Fan et al. (2021) Ziwei Fan, Zhiwei Liu, Shen Wang, Lei Zheng, and Philip S. Yu. 2021. Modeling Sequences as Distributions with Uncertainty for Sequential Recommendation. In CIKM ’21: The 30th ACM International Conference on Information and Knowledge Management, Virtual Event, Queensland, Australia, November 1 - 5, 2021. ACM, 3019–3023. https://doi.org/10.1145/3459637.3482145
- Fan et al. (2022) Ziwei Fan, Zhiwei Liu, Yu Wang, Alice Wang, Zahra Nazari, Lei Zheng, Hao Peng, and Philip S. Yu. 2022. Sequential Recommendation via Stochastic Self-Attention. In WWW ’22: The ACM Web Conference 2022, Virtual Event, Lyon, France, April 25 - 29, 2022. ACM, 2036–2047. https://doi.org/10.1145/3485447.3512077
- Gholami et al. (2022) Ehsan Gholami, Mohammad Motamedi, and Ashwin Aravindakshan. 2022. PARSRec: Explainable Personalized Attention-fused Recurrent Sequential Recommendation Using Session Partial Actions. In KDD ’22: The 28th ACM SIGKDD Conference on Knowledge Discovery and Data Mining, Washington, DC, USA, August 14 - 18, 2022. ACM, 454–464. https://doi.org/10.1145/3534678.3539432
- Guo et al. (2023) Hao Guo, Weixin Zeng, Jiuyang Tang, and Xiang Zhao. 2023. Interpretable Fake News Detection with Graph Evidence. In Proceedings of the 32nd ACM International Conference on Information and Knowledge Management, CIKM 2023, Birmingham, United Kingdom, October 21-25, 2023. ACM, 659–668. https://doi.org/10.1145/3583780.3614936
- He et al. (2017) Ruining He, Wang-Cheng Kang, and Julian J. McAuley. 2017. Translation-based Recommendation. In Proceedings of the Eleventh ACM Conference on Recommender Systems, RecSys 2017, Como, Italy, August 27-31, 2017. ACM, 161–169. https://doi.org/10.1145/3109859.3109882
- He and McAuley (2016) Ruining He and Julian J. McAuley. 2016. Fusing Similarity Models with Markov Chains for Sparse Sequential Recommendation. In IEEE 16th International Conference on Data Mining, ICDM 2016, December 12-15, 2016, Barcelona, Spain. IEEE Computer Society, 191–200. https://doi.org/10.1109/ICDM.2016.0030
- Hidasi et al. (2016) Balázs Hidasi, Alexandros Karatzoglou, Linas Baltrunas, and Domonkos Tikk. 2016. Session-based Recommendations with Recurrent Neural Networks. In 4th International Conference on Learning Representations, ICLR 2016, San Juan, Puerto Rico, May 2-4, 2016, Conference Track Proceedings. http://arxiv.org/abs/1511.06939
- Jain and Wallace (2019) Sarthak Jain and Byron C. Wallace. 2019. Attention is not Explanation. In Proceedings of the 2019 Conference of the North American Chapter of the Association for Computational Linguistics: Human Language Technologies, NAACL-HLT 2019, Minneapolis, MN, USA, June 2-7, 2019, Volume 1 (Long and Short Papers). Association for Computational Linguistics, 3543–3556. https://doi.org/10.18653/V1/N19-1357
- Kang and McAuley (2018) Wang-Cheng Kang and Julian J. McAuley. 2018. Self-Attentive Sequential Recommendation. In IEEE International Conference on Data Mining, ICDM 2018, Singapore, November 17-20, 2018. IEEE Computer Society, 197–206. https://doi.org/10.1109/ICDM.2018.00035
- Kingma and Ba (2015) Diederik P. Kingma and Jimmy Ba. 2015. Adam: A Method for Stochastic Optimization. In 3rd International Conference on Learning Representations, ICLR 2015, San Diego, CA, USA, May 7-9, 2015, Conference Track Proceedings. http://arxiv.org/abs/1412.6980
- Li et al. (2020) Jiacheng Li, Yujie Wang, and Julian J. McAuley. 2020. Time Interval Aware Self-Attention for Sequential Recommendation. In WSDM ’20: The Thirteenth ACM International Conference on Web Search and Data Mining, Houston, TX, USA, February 3-7, 2020. ACM, 322–330. https://doi.org/10.1145/3336191.3371786
- Li et al. (2022) Muyang Li, Xiangyu Zhao, Chuan Lyu, Minghao Zhao, Runze Wu, and Ruocheng Guo. 2022. MLP4Rec: A Pure MLP Architecture for Sequential Recommendations. In Proceedings of the Thirty-First International Joint Conference on Artificial Intelligence, IJCAI 2022, Vienna, Austria, 23-29 July 2022. ijcai.org, 2138–2144. https://doi.org/10.24963/IJCAI.2022/297
- Liang et al. (2023) Tingting Liang, Yuanqing Zhang, Qianhui Di, Congying Xia, Youhuizi Li, and Yuyu Yin. 2023. Contrastive Box Embedding for Collaborative Reasoning. In Proceedings of the 46th International ACM SIGIR Conference on Research and Development in Information Retrieval, SIGIR 2023, Taipei, Taiwan, July 23-27, 2023. ACM, 38–47. https://doi.org/10.1145/3539618.3591654
- Lin and Gao (2022) Kang Lin and Yuzhuo Gao. 2022. Model interpretability of financial fraud detection by group SHAP. Expert Syst. Appl. 210 (2022), 118354. https://doi.org/10.1016/J.ESWA.2022.118354
- Ma et al. (2020) Chen Ma, Liheng Ma, Yingxue Zhang, Ruiming Tang, Xue Liu, and Mark Coates. 2020. Probabilistic Metric Learning with Adaptive Margin for Top-K Recommendation. In KDD ’20: The 26th ACM SIGKDD Conference on Knowledge Discovery and Data Mining, Virtual Event, CA, USA, August 23-27, 2020. ACM, 1036–1044. https://doi.org/10.1145/3394486.3403147
- McAuley et al. (2015) Julian J. McAuley, Christopher Targett, Qinfeng Shi, and Anton van den Hengel. 2015. Image-Based Recommendations on Styles and Substitutes. In Proceedings of the 38th International ACM SIGIR Conference on Research and Development in Information Retrieval, Santiago, Chile, August 9-13, 2015. ACM, 43–52. https://doi.org/10.1145/2766462.2767755
- Ren and Leskovec (2020) Hongyu Ren and Jure Leskovec. 2020. Beta Embeddings for Multi-Hop Logical Reasoning in Knowledge Graphs. In Advances in Neural Information Processing Systems 33: Annual Conference on Neural Information Processing Systems 2020, NeurIPS 2020, December 6-12, 2020, virtual. https://proceedings.neurips.cc/paper/2020/hash/e43739bba7cdb577e9e3e4e42447f5a5-Abstract.html
- Rendle et al. (2010) Steffen Rendle, Christoph Freudenthaler, and Lars Schmidt-Thieme. 2010. Factorizing personalized Markov chains for next-basket recommendation. In Proceedings of the 19th International Conference on World Wide Web, WWW 2010, Raleigh, North Carolina, USA, April 26-30, 2010. ACM, 811–820. https://doi.org/10.1145/1772690.1772773
- Said and Bellogín (2014) Alan Said and Alejandro Bellogín. 2014. Comparative recommender system evaluation: benchmarking recommendation frameworks. In Eighth ACM Conference on Recommender Systems, RecSys ’14, Foster City, Silicon Valley, CA, USA - October 06 - 10, 2014. ACM, 129–136. https://doi.org/10.1145/2645710.2645746
- Serrano and Smith (2019) Sofia Serrano and Noah A. Smith. 2019. Is Attention Interpretable?. In Proceedings of the 57th Conference of the Association for Computational Linguistics, ACL 2019, Florence, Italy, July 28- August 2, 2019, Volume 1: Long Papers. Association for Computational Linguistics, 2931–2951. https://doi.org/10.18653/V1/P19-1282
- Sun et al. (2019) Fei Sun, Jun Liu, Jian Wu, Changhua Pei, Xiao Lin, Wenwu Ou, and Peng Jiang. 2019. BERT4Rec: Sequential Recommendation with Bidirectional Encoder Representations from Transformer. In Proceedings of the 28th ACM International Conference on Information and Knowledge Management, CIKM 2019, Beijing, China, November 3-7, 2019. ACM, 1441–1450. https://doi.org/10.1145/3357384.3357895
- Tal et al. (2021) Omer Tal, Yang Liu, Jimmy X. Huang, Xiaohui Yu, and Bushra Aljbawi. 2021. Neural Attention Frameworks for Explainable Recommendation. IEEE Trans. Knowl. Data Eng. 33, 5 (2021), 2137–2150. https://doi.org/10.1109/TKDE.2019.2953157
- Tan et al. (2021) Qiaoyu Tan, Jianwei Zhang, Jiangchao Yao, Ninghao Liu, Jingren Zhou, Hongxia Yang, and Xia Hu. 2021. Sparse-Interest Network for Sequential Recommendation. In WSDM ’21, The Fourteenth ACM International Conference on Web Search and Data Mining, Virtual Event, Israel, March 8-12, 2021. ACM, 598–606. https://doi.org/10.1145/3437963.3441811
- Tang and Wang (2018) Jiaxi Tang and Ke Wang. 2018. Personalized Top-N Sequential Recommendation via Convolutional Sequence Embedding. In Proceedings of the Eleventh ACM International Conference on Web Search and Data Mining, WSDM 2018, Marina Del Rey, CA, USA, February 5-9, 2018. ACM, 565–573. https://doi.org/10.1145/3159652.3159656
- Tsai and Brusilovsky (2021) Chun-Hua Tsai and Peter Brusilovsky. 2021. The effects of controllability and explainability in a social recommender system. User Model. User Adapt. Interact. 31, 3 (2021), 591–627. https://doi.org/10.1007/S11257-020-09281-5
- Vaswani et al. (2017) Ashish Vaswani, Noam Shazeer, Niki Parmar, Jakob Uszkoreit, Llion Jones, Aidan N. Gomez, Lukasz Kaiser, and Illia Polosukhin. 2017. Attention is All you Need. In NIPS. 5998–6008.
- Wiegreffe and Pinter (2019) Sarah Wiegreffe and Yuval Pinter. 2019. Attention is not not Explanation. In Proceedings of the 2019 Conference on Empirical Methods in Natural Language Processing and the 9th International Joint Conference on Natural Language Processing, EMNLP-IJCNLP 2019, Hong Kong, China, November 3-7, 2019. Association for Computational Linguistics, 11–20. https://doi.org/10.18653/V1/D19-1002
- Yang et al. (2022) Dong Yang, Peijun Qing, Yang Li, Haonan Lu, and Xiaodong Lin. 2022. GammaE: Gamma Embeddings for Logical Queries on Knowledge Graphs. In Proceedings of the 2022 Conference on Empirical Methods in Natural Language Processing, EMNLP 2022, Abu Dhabi, United Arab Emirates, December 7-11, 2022. Association for Computational Linguistics, 745–760. https://doi.org/10.18653/V1/2022.EMNLP-MAIN.47
- Yuan et al. (2023) Huanhuan Yuan, Pengpeng Zhao, Xuefeng Xian, Guanfeng Liu, Yanchi Liu, Victor S. Sheng, and Lei Zhao. 2023. Sequential Recommendation with Probabilistic Logical Reasoning. In Proceedings of the Thirty-Second International Joint Conference on Artificial Intelligence, IJCAI 2023, 19th-25th August 2023, Macao, SAR, China. ijcai.org, 2432–2440. https://doi.org/10.24963/IJCAI.2023/270
- Zhang et al. (2021) Shuai Zhang, Huoyu Liu, Aston Zhang, Yue Hu, Ce Zhang, Yumeng Li, Tanchao Zhu, Shaojian He, and Wenwu Ou. 2021. Learning User Representations with Hypercuboids for Recommender Systems. In WSDM ’21, The Fourteenth ACM International Conference on Web Search and Data Mining, Virtual Event, Israel, March 8-12, 2021. ACM, 716–724. https://doi.org/10.1145/3437963.3441768
- Zhao et al. (2022) Wayne Xin Zhao, Yupeng Hou, Xingyu Pan, Chen Yang, Zeyu Zhang, Zihan Lin, Jingsen Zhang, Shuqing Bian, Jiakai Tang, Wenqi Sun, Yushuo Chen, Lanling Xu, Gaowei Zhang, Zhen Tian, Changxin Tian, Shanlei Mu, Xinyan Fan, Xu Chen, and Ji-Rong Wen. 2022. RecBole 2.0: Towards a More Up-to-Date Recommendation Library. In Proceedings of the 31st ACM International Conference on Information & Knowledge Management, Atlanta, GA, USA, October 17-21, 2022, Mohammad Al Hasan and Li Xiong (Eds.). ACM, 4722–4726. https://doi.org/10.1145/3511808.3557680
- Zheng et al. (2019) Lei Zheng, Chaozhuo Li, Chun-Ta Lu, Jiawei Zhang, and Philip S. Yu. 2019. Deep Distribution Network: Addressing the Data Sparsity Issue for Top-N Recommendation. In Proceedings of the 42nd International ACM SIGIR Conference on Research and Development in Information Retrieval, SIGIR 2019, Paris, France, July 21-25, 2019. ACM, 1081–1084. https://doi.org/10.1145/3331184.3331330