Stressed and sliding ice surfaces liquefy without much heating
Abstract
The low kinetic friction observed between ice or snow and numerous counterbodies is commonly attributed to a thin interfacial water layer [1, 2, 3], which is believed to exist because of pressure melting [4], surface melting [5, 6], or friction-induced heating [7]. However, even the currently leading theory of frictional melting keeps being challenged, for example, due to the lack of detectable warming of snow surfaces under a rotating slider at C temperature and m/s sliding velocity despite high temporospatial resolution [8]. Here we present molecular simulations of ice interfaces that reveal that ice surfaces liquefy readily without melting thermally but rather by displacement-driven amorphization, normal-stress gradients, and tensile in-plane stress. Yet, friction coefficients below 0.01, as observed during the sliding of hydrophobic solids over ice [9], appear possible only when the counterfaces are smooth and allow water to slip past them. Our findings provide fundamental guidelines on how to optimize ice friction and challenge experimentalists to measure the surface temperature of ice and snow at minute scales and with unprecedented speed.
Skidding on ice or snow is a well-known phenomenon, often dreaded, sometimes loved. Several mechanisms leading to low ice and snow friction have been proposed and become popular [1, 2, 3, 4, 5, 7]. They are all based on the assumption of self-lubrication through the melting of surface ice. However, no single theory is conclusive [8]. Pressure melting would require the true contact between a ski and the ice below it to be unreasonably small to explain skiing at C [7]. Although the molecular mobility of sub-0∘C surface water correlates with ice friction [10], the variation in friction coefficients with different counterbodies remains unexplained. Melting by frictional heating must also be questioned given that neither snow surfaces while being rubbed [6] nor a contact-induced water film on ice produced at high sliding velocities of m/s [11] exceeded 0∘C. Thus, either the main reason for the presence of water in sliding ice interfaces varies from case to case, or some crucial ice-liquefaction mechanism has not been accounted for hitherto. One candidate mechanism could be related to Moras et al.’s hypothesis [12] that sliding ice undergoes layer-by-layer amorphization as do diamond as well as silicon in incommensurate, self-mated contacts. Their conjecture is supported by simulations of sliding grain boundaries at C [13], which revealed substantial disordering at small velocity. Furthermore, ice surfaces would lose their load-bearing ability and highly dissipative plowing would set in if the interface was heated to 0∘C [14].
Determining the applicability of different mechanisms that produce interfacial water requires simultaneous analysis of interfacial stresses, temperature, and structure for diverse initial and boundary conditions in moving, buried interfaces. This can be achieved by means of molecular dynamics (MD) simulations when using force fields that accurately reproduce the relevant thermodynamic, dynamic, and mechanical properties, as the TIP4P/Ice potential does for water [15, 16, 17, 18, 19, 20]. It allows us to model sliding ice interfaces effectively and to investigate how sliding induces or maintains sub-0∘C interfacial water. We start by simulating flat, incommensurate ice-ice interfaces. Such calculations provide a lower bound for the friction between ice crystals as they disregard roughness-induced plasticity, ploughing, snow compression, capillaries, and other phenomena that enhance energy dissipation, though grain-size distribution and macroscopic roughness have been shown to scarcely affect kinetic ice-ice friction [21]. To ascertain its load-bearing ability and the role of hydrophobicity, we also study ice sliding past corrugated counterfaces of different hydrophobicity.
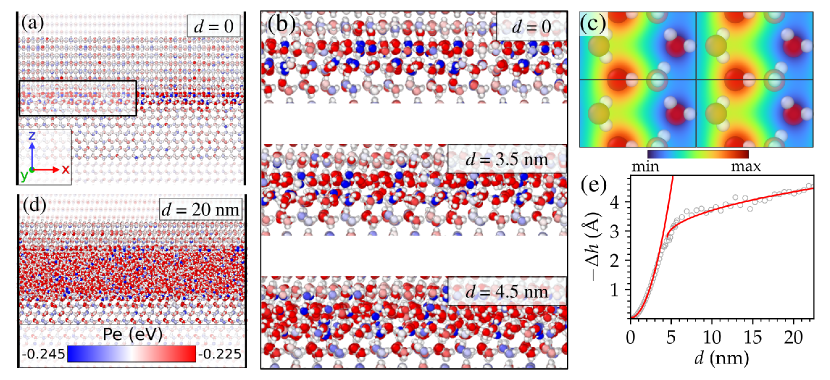
In the first set of simulations, two ice crystals are brought into contact at a temperature of K with a small approach velocity until the normal force between their misaligned [0001] surfaces vanishes. Localized zones of roughening, a few Angstroms wide, appear where the potential energy per molecule is lower than in the crystal, as evidenced in Fig. 1 (a,b). The low-energy zones arise when the dipoles of surface molecules are aligned with and thus attracted by the counterbody’s electrostatic field, which is shown in Fig. 1(c).
Once sliding starts, these low-energy zones act like cold-welded spots causing plastic deformation in their vicinity, strengthening these surrounding areas but weakening the originally cold-welded site. In this way, old low-energy zones disappear, while new ones arise as sliding progresses. Due to the open structure and low packing of hexagonal ice, dislocations are not needed for plastic deformation to occur during this process. The instabilities, which destroy crystalline order, are local, whereby energy releases and associated temperature bursts are small. Similar dynamics were observed for other interfaces and another popular water potential, namely SPC/E [22] (see examples shown in Fig. S1). Since the [0001] surface is the most densely packed ice surface and the maximum misorientation of provides the best possible condition for structural lubricity (SL), we can conclude that SL will also not occur at other ice-ice interfaces. SL [23, 24, 25] refers to a state of small, Stokes-like friction, which is caused by the systematic cancellation of lateral forces when two atomically flat, incommensurate crystal surfaces slide past each other without invoking instabilities.
Due to the impossibility of structurally lubric ice-ice contacts, the shear stress can only be small given the presence of sufficiently thick pre-existing or stress-disordered layers, whose structure (see e.g., Fig. 1(d)) resembles that of sheared supercooled bulk water. The claim of resemblance is supported by comparisons of the pair distribution function (Fig. S2), a three-body, mixed radial, angular distribution function [26] (Fig. S3), and the concentration of five-coordinated water molecules (Fig. S4). The disordered zone has many five-coordinated molecules as regular and supercooled water, causing the liquid to be denser than the crystal. Thus, reductions in the separation between the two outermost layers allow the thickness or width of the amorphized zone to be determined.
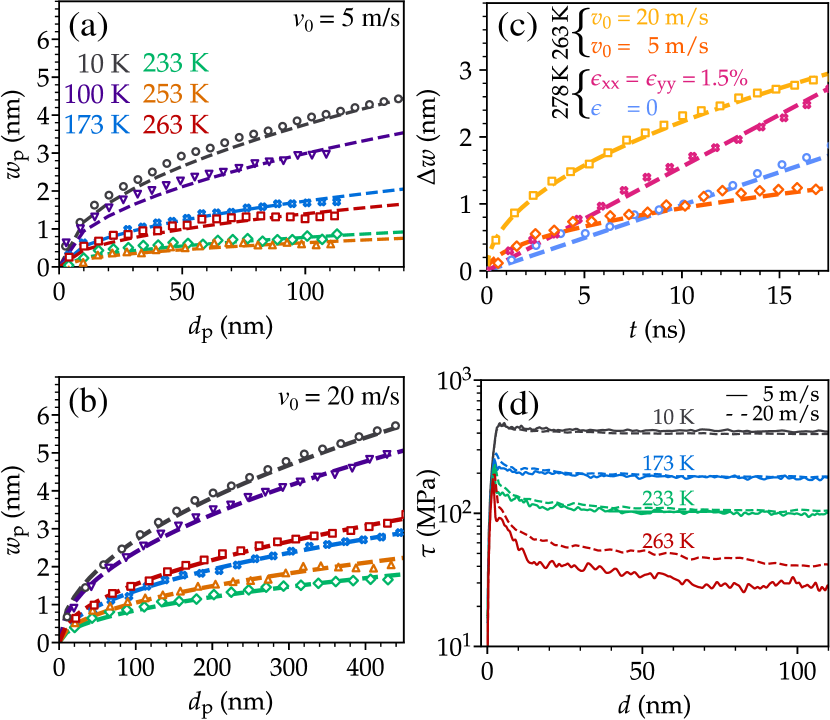
Ice turns out to have the same proportionality of , see Fig. 1(e), or , see Fig. 2(a,b) and movie M1, to the square-root of the slid distance as diamond and silicon [27, 12]. Here, the subscript p indicates that quantities are given relative to the point at which (substantial) amorphization sets in, which is also where the stiction peak is located, e.g., at nm in Fig. 1(e). The relation indicates that the probability for a surface molecule to abandon its crystallographic position is linear in a distance increment but inversely proportional to and thus that amorphization is displacement-driven. Further evidence against thermal melting is provided in Fig. 2(c), which shows that shear-disordering the first nanometer of thickness of C cold ice with m/s takes roughly as long as it would take at rest to melt the same amount of ice of a fully thermostatted crystal superheated to C. Yet, temperature in the sliding system only rose to at most C, as shown in Fig. S4(b). Tensile strains, which tend to be high at the trailing edge of sliding contacts [28], can be more important than heating since a 1.5% isotropic, in-plane strain at C almost doubles the melting rate compared to the unstrained case, see again Fig. 2(c).
While the amorphization coefficient changes non-monotonically with temperature—a relative minimum occurs near K, i.e., slightly above the temperature separating the low- and high-density regimes of supercooled water [29]—the shear stress decreases continuously with increasing temperature, as revealed in Fig. 2(c). This is because the effective viscosity, which is defined as the ratio of shear stress to shear rate, has a strong temperature dependence [3, 19] as opposed to . Thus, the reduction in viscosity due to frictional heating appears to be the primary reason why Bowden and Hughes [7] observed insulating skis to have lower friction than heat-conducting skis.
In order to relate our results to experiments, shear stresses must be converted into friction coefficients , defined as the ratio of shear force to normal load. This requires local water-film heights and normal contact pressures to be estimated, which is a non-trivial task, because they depend on contact-patch geometries, the squeeze-out dynamics of water, and on the rate- and potentially scale-dependent ice plasticity or creep [30, 31, 32]. However, once exceeds mm/s locally, normal pressures much greater than the quasi-static penetration hardness can occur, which has a value close to 10 MPa at temperatures where skiing and skating are most readily possible [14], that is, close but not too close to melting, e.g., at C, which is the temperature we focus on in the following.
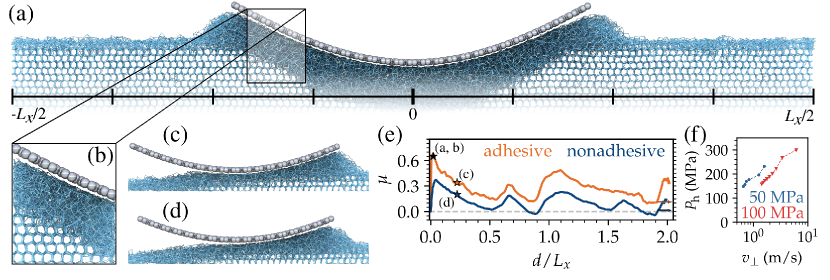
To generate realistic local stresses occurring during ice-asperity interactions without relying on rough continuum-mechanics calculations, we simulate a rigid, single-sinusoidal corrugated plate that first indents and then scratches over an initially flat ice surface at C. Parts of the final configuration of an indentation process with an adhesive, rigid tip are depicted in Fig. 3(a,b). It was produced by first applying a nominal normal pressure of MPa for 0.6 ns, which was followed by a 40 ps relaxation at MPa. The high initial pressure creates an indentation mark of similar depth to that obtained with lower pressure over a time span far beyond the scope of molecular simulations.
Corrugated indenters will sink into ice while amorphizing it even when the contact pressure has fallen below 200 MPa, which is where ice undergoes a phase transition to form water at C. Nonetheless, simulated ice withstands indentation pressures of up to 300 MPa over extended time periods, when the counterface is flat, i.e., its radius of curvature is formally infinite. This indicates that stress gradients accelerate amorphization and explains why Fig. 3(f) reveals a similar -dependent as that observed experimentally [14], albeit shifted to much larger . The experimental were more than four orders of magnitude larger than that of our corrugated counterface, nm. While a diminished ability to withstand stress at smaller scales echoes the inverse Hall-Petch effect, it cannot be attributed to grain-boundary sliding as the simulated ice is single crystalline. Instead, it could be due to the enhancement of non-affine deformations when the scale over which stress varies is shortened. Further evidence for a scale-dependent comes from atomic-force microscopy. Using tips with nm, Butt et al. [33] found to be 10% of the macroscopic indentation hardness, that is, before they reinterpreted their data and potential errors to reduce the gap between results and expectations to a factor of 2.5.
When sliding at m/s under MPa, see Fig. 3(e) and movie M3, friction is lowest shortly before the tip sinks into the indentation mark and highest when reaching its bottom, where , similar to values obtained with an atomic-force microscope and a tip radius of 200 nm [34]. The time dependence is a consequence of capillary rather than mechanical effects: even a thin water layer attempts to reduce its surface energy when rough solids slide past each other. Things repeat on the second stroke (periodic-boundary conditions mimic pin-on-disk tribometers). However, spatial variations in the friction decrease.
A hydrophobic counterface behaves like the hydrophilic one, albeit both the stiction peak and the kinetic friction are halved. The friction now assumes the small values that would usually be associated with slippery ice, i.e., well below 0.1 at a safe distance from the indentation mark. Just before the downhill motion even becomes formally negative.
The smaller friction of curved, hydrophobic surfaces not only originates from the finite slip length of water [3], but also because the temporospatial stress fluctuations, and thus dissipation, are diminished. The reduction is substantial although the structural differences between hydrophilic and hydrophobic setups are subtle, see Fig. 3 (c,d). In the given case, the increase of the mean friction coefficient from a flat to a curved hydrophilic counterbody is 0.175 (from 0.103 to 0.278) versus 0.088 (from 0.015 to 0.103) in the hydrophobic case. This leaves a missing 50% difference of 0.175-0.088 = 0.087, which can only originate from the adhesion-enhanced viscoelastic dissipation caused by the hydrophilic surface near the leading and the trailing contact edges. Thus, in addition to interfacial water, counterbodies must be smooth and hydrophobic for ice to have very low friction coefficients, i.e., capillary effects have to be small.
In conclusion, our simulation results reveal novel explanations for the (thermo-)dynamics of sliding ice. Firstly, thin, pre-molten ice layers reduce shear stresses noticeably only during the first few nanometers of sliding, because sliding-induced amorphous zones quickly become substantially thicker than pre-existing equilibrium layers. Their indisputable friction-reducing effect established at high humidity even for solids as hard as steel [35], could be indirect in the case of ice, possibly by mitigating maximum stresses of nano-scale asperities so that fewer apserities break off and turn into abrasives [8]. Secondly, disordering during sliding is primarily driven by displacement. Thermally assisted liquefaction may become relevant very close to the melting point. Thirdly, pressure-induced melting, though frequently dismissed as irrelevant outside of glaciology, matters whenever local roughness induces large stress gradients, which enhances amorphization. Fourthly, friction coefficients well below 0.01, which can arise in speed skating or car tires on black-ice at say C seem implausible without substantial water slip, as on carbonaceous surfaces [36] or without excess water. This is because squeeze-out and recrystallization [37] will eventually counterbalance shear-induced amorphization, which is estimated to happen near MPa at C in the supplementay materials (SM). This would yield , assuming a high, normal stress of 200 MPa and contact patches whose linear size exceeds 1 m. Characteristic patch sizes are estimated in the SM using prior experimental [38, 39], theoretical [40], and numerical [41, 42, 43] work. However, the large normal stress rests on the paradoxical assumption that surfaces must be simultaneously rough and smooth; rough to yield large required for a large at sliding velocities of the order of 1 m/s and smooth to avoid stress gradients inducing amorphization and dissipation. Thus, when ordinary stick conditions apply, should clearly exceed the lower bound of .
One shortcoming of prior models lies in equating frictional and thermal heating. In contrast, rubbing ice produces more defects but fewer vibrations than thermal random collisions doing the same amount of work. This and other insights gained from this work enable more reliable predictions of ice friction than previously feasible and may aid in understanding processes in related systems, such as the “purely mechanical wear of diamond by considerably softer lubricated metal cones” [44], through a potentially overlooked extreme scale dependence of penetration hardness of loosely packed crystals.
This scale dependence also implies that (hydrophobic) counterfaces that are locally smooth but mesoscopically rough should have particularly small kinetic friction. Such a design avoids small-scale plasticity while allowing for sufficiently large normal velocities during sliding to boost the rate-dependent hardness.
I Methods
The TIP4P/Ice potential [15] is used. It accurately reproduces the properties relevant to our study, including the pressure dependence of the melting point [17], water’s density anomaly [16], the pressure and temperature dependence [19] of the viscosity, the thickness of the water surface layer [18], and, most important for our purposes, the structure of ball-milled ice [20].
The starting configurations consist of two crystals facing each other with perfectly parallel [0001] surfaces. They are misaligned by , which is realized through a rotation. To approximate the ratio of and lattice constants while using a square simulation cell and periodic boundary conditions, fourteen unit cells are used in the and ten unit cells in the direction (before rotation) and stretched in the -direction by approximately 0.5%, while compressing the -direction by a similar amount. This makes one water layer, which contains water molecules, have an area of nm2. Each crystal is made up of unit cells containing two planes and a rigid outer plane yielding a total number of 77,952 H2O molecules in the system. A unit cell has the height Å, which results in a total initial height of nm, which includes a separation region of Å .
When sliding ice against sinusoidal indenters, we use unit cells, resulting in initial system dimensions of nm3 at C, and a total number of 287,040 H2O molecules. The counterbody has a height profile of ), where nm is the length of the simulation cell parallel to the sliding direction and nm. Lennard-Jones interaction sites assigned to the surface of the indenter are placed in a hexagonal lattice with a nearest-neighbor spacing of Å. Interactions only take place with the oxygen atoms with a length of Å and kcal/mol. Hydrophobicity was modeled by cutting off the interaction at the minimum of the potential at and at for the hydrophilic surfaces, which results in the surface energy gained upon making contact be similar to that of ice-ice interfaces.
Sliding is imposed by moving the two (rigid) outermost layers at , resulting in a relative in-plane velocity of , chosen within a 1–50 m/s range, which is relevant for many situations, in particular winter sports. In the ice-ice simulations, normal stresses are usually set to zero and sometimes to 20 MPa, which is close to a recent estimate for the quasi-static penetration hardness of ice at -10∘C [14], though differences between these two sets of simulations turn out to be minor. To be minimally invasive, only the second-outermost layers are thermostatted, which is done relative to the respective outermost, rigid layer. Simulations are conducted with LAMMPS [45], the visualization with OVITO [46], and the post-analysis with in-house codes.
The amorphization width is determined as the average of an upper and a lower bound. Both are estimated from the number density of amorphous and hexagonal-ice molecules as identified using the Chill+ algorithm [47] with a cutoff of Å. The upper bound is located when positioning the interface between ice and water at the value of where the number density of “amorphous molecules” is 0.08 Å-3. As the sample was cut into slices along -axis with a bin size of Å, the error in the upper bound of should not exceed Å. The lower bound is located in the same fashion, however, using “hexagonal-ice molecules” instead of “amorphous molecules.” At low temperature, this method gives close results as when correlating the height difference of the two outermost layers with the width . However, the latter method gives poor results at high temperature and fails to locate a crystal surface in the absence of a counterbody.
Data and materials availability:
All data are available in the main text or the supplementary materials
References
- [1] R. Rosenberg. Why is ice slippery? Phys. Today, 58:50–54, 2005.
- [2] J. G. Dash, A. W. Rempel, and J. S. Wettlaufer. The physics of premelted ice and its geophysical consequences. Rev. Mod. Phys., 78:695–741, 2006.
- [3] Ł. Baran, P. Llombart, W. R., and L. G. MacDowell. Ice friction at the nanoscale. Proc. Natl. Acad. Sci. U.S.A., 119:e2209545119, 2022.
- [4] J. Thompson. I. on recent theories and experiments regarding ice at or near its melting-point. Proc. R. Soc. Lond., 10:151–160, 1860.
- [5] Faraday. XXIV. on regelation, and on the conservation of force. Lond. Edinb. Dublin Philos. Mag., 17:162–169, 1859.
- [6] B. Slater and A. Michaelides. Surface premelting of water ice. Nat. Rev. Chem., 3:172–188, 2019.
- [7] F. P. Bowden and T. P. Hughes. The mechanism of sliding on ice and snow. Proc. R. Soc. A: Math. Phys. Sci., 172:280–298, 1939.
- [8] J. H. Lever, S. Taylor, A. J. Song, Z. R. Courville, R. Lieblappen, and J. C. Weale. The mechanics of snow friction as revealed by micro-scale interface observations. J. of Glaciol., 64:27–36, 2017.
- [9] Markus Ovaska and Ari J. Tuononen. Multiscale imaging of wear tracks in ice skate friction. Tribol. Int., 121:280–286, 2018.
- [10] B. Weber, Y. Nagata, S. Ketzetzi, F. Tang, W. J. Smit, H. J. Bakker, E. H. G. Backus, M. Bonn, and D. Bonn. Molecular insight into the slipperiness of ice. J. Phys. Chem. Lett., 9:2838–2842, 2018.
- [11] L Bäurle, D Szabó, M Fauve, H Rhyner, and N D Spencer. Sliding friction of polyethylene on ice: tribometer measurements. Tribol. Lett., 24:77–84, 2006.
- [12] G. Moras, A. Klemenz, T. Reichenbach, A. Gola, H. Uetsuka, M. Moseler, and L. Pastewka. Shear melting of silicon and diamond and the disappearance of the polyamorphic transition under shear. Phys. Rev. Mater., 2:083601, 2018.
- [13] I. de Almeida Ribeiro and M. de Koning. Grain-boundary sliding in ice i: tribology and rheology at the nanoscale. J. Phys. Chem. C, 125:627–634, 2021.
- [14] R. W. Liefferink, F.-C. Hsia, B. Weber, and D. Bonn. Friction on ice: How temperature, pressure, and speed control the slipperiness of ice. Phys. Rev. X, 11:011025, 2021.
- [15] J. L. F. Abascal, E. Sanz, R. García Fernández, and C. Vega. A potential model for the study of ices and amorphous water: TIP4P/Ice. J. Chem. Phys., 122:234511, 2005.
- [16] C. Vega and J. L. F. Abascal. Relation between the melting temperature and the temperature of maximum density for the most common models of water. J. Chem. Phys., 123:2056539, 2005.
- [17] E. G. Noya, C. Menduiña, J. L. Aragones, and C. Vega. Equation of state, thermal expansion coefficient, and isothermal compressibility for ices ih, II, III, v, and VI, as obtained from computer simulation. J. Phys. Chem. C, 111:15877–15888, 2007.
- [18] M. M. Conde, C. Vega, and A. Patrykiejew. The thickness of a liquid layer on the free surface of ice as obtained from computer simulation. J. Chem. Phys., 129:014702, 2008.
- [19] Ł. Baran, W. Rżysko, and L. G. MacDowell. Self-diffusion and shear viscosity for the TIP4p/ice water model. J. Chem. Phys., 158:0134932, 2023.
- [20] A. Rosu-Finsen, M. B. Davies, A. Amon, H. Wu, A. Sella, A. Michaelides, and C. G. Salzmann. Medium-density amorphous ice. Science, 379:474–478, 2023.
- [21] E. M. Schulson and A. L. Fortt. Friction of ice on ice. J. Geophys. Res. Solid Earth, 117:B12204, 2012.
- [22] H. J. C. Berendsen, J. R. Grigera, and T. P. Straatsma. The missing term in effective pair potentials. J. Phys. Chem., 91:6269–6271, 1987.
- [23] M. Hirano and K. Shinjo. Atomistic locking and friction. Phys. Rev. B, 41:11837–11851, 1990.
- [24] M. H Müser. Structural lubricity: Role of dimension and symmetry. Europhys. Lett., 66:97–103, 2004.
- [25] D. Dietzel, M. Feldmann, U. D. Schwarz, H. Fuchs, and A. Schirmeisen. Scaling laws of structural lubricity. Phys. Rev. Lett., 111:235502, 2013.
- [26] S. V. Sukhomlinov and M. H. Müser. A mixed radial, angular, three-body distribution function as a tool for local structure characterization: Application to single-component structures. J. Chem. Phys., 152:0007964, 2020.
- [27] L. Pastewka, S. Moser, P. Gumbsch, and M. Moseler. Anisotropic mechanical amorphization drives wear in diamond. Nat. Mater., 10:34–38, 2010.
- [28] C. Müller, M. H. Müser, G. Carbone, and N. Menga. Significance of elastic coupling for stresses and leakage in frictional contacts. Phys. Rev. Lett., 131:156201, 2023.
- [29] P. Gallo, K. Amann-Winkel, C. A. Angell, M. A. Anisimov, F. Caupin, C. Chakravarty, E. Lascaris, T. Loerting, A. Z. Panagiotopoulos, J. Russo, J. A. Sellberg, H. E. Stanley, H. Tanaka, C. Vega, L. Xu, and L. G. M. Pettersson. Water: A tale of two liquids. Chem. Rev., 116:7463–7500, 2016.
- [30] O. Lahayne, B. Pichler, R. Reihsner, J. Eberhardsteiner, J. Suh, D. Kim, S. Nam, H. Paek, B. Lorenz, and B. N. J. Persson. Rubber friction on ice: Experiments and modeling. Tribol. Lett., 62, 2016.
- [31] T. Tada, S. Kawasaki, R. Shimizu, and B. N. J. Persson. Rubber-ice friction. Friction, 11:1534–1543, 2023.
- [32] B. N. J. Persson and E. C. Tyrode. Ice breakloose friction. J. Chem. Phys., 158:0155545, 2023.
- [33] H.-J. Butt, A. Döppenschmidt, G. Hüttl, E. Müller, and O. I. Vinogradova. Analysis of plastic deformation in atomic force microscopy: Application to ice. J. Chem. Phys., 113:1194–1203, 2000.
- [34] H. Bluhm, D. F. Ogletree, C. S. Fadley, Z. Hussain, and M. Salmeron. The premelting of ice studied with photoelectron spectroscopy. J. Phys.: Cond. Matt., 14:L227–L233, 2002.
- [35] W. C. Hong, K. Fukuda, and S. Liza. Influences of atmospheric humidity on sliding speed characteristics of dry sliding phenomena. Tribol. Online, 18(6):339–352, 2023.
- [36] E. Secchi, S. Marbach, A. Niguès, D. Stein, A. Siria, and L. Bocquet. Massive radius-dependent flow slippage in carbon nanotubes. Nature, 537(7619):210–213, 2016.
- [37] Y. Xu, N. G. Petrik, R. S. Smith, B. D. Kay, and G. A Kimmel. Growth rate of crystalline ice and the diffusivity of supercooled water from 126 to 262 K. Proc. Natl. Acad. Sci. U. S. A., 113:14921–14925, 2016.
- [38] J. H. Dieterich and B. D. Kilgore. Direct observation of frictional contacts: New insights for state-dependent properties. Pure Appl. Geophys., 143:283–302, 1994.
- [39] L. Bäurle, Th.U. Kaempfer, D. Szabó, and N.D. Spencer. Sliding friction of polyethylene on snow and ice: Contact area and modeling. Cold Reg. Sci. Technol., 47:276–289, 2007.
- [40] B. N. J. Persson. Elastoplastic contact between randomly rough surfaces. Phys. Rev. Lett., 87:116101, 2001.
- [41] L. Pei, S. Hyun, J. Molinari, and M. O. Robbins. Finite element modeling of elasto-plastic contact between rough surfaces. J. Mech. Phys. Sol., 53:2385–2409, 2005.
- [42] M. Müser and A. Wang. Contact-patch-size distribution and limits of self-affinity in contacts between randomly rough surfaces. Lubricants, 6:85, 2018.
- [43] J. M. Monti, L. Pastewka, and M. O. Robbins. Fractal geometry of contacting patches in rough elastic contacts. J. Mech. and Phys. Sol., 160:104797, 2022.
- [44] C. A. Brookes, M. P. Shaw, and P. E. Tanner. Non-metallic crystals undergoing cumulative work-hardening and wear due to softer lubricated metal sliding surfaces. Proc. Math. Phys. Eng. Sci., 409:141–159, 1987.
- [45] A. P. Thompson, H. M. Aktulga, R. Berger, D. S. Bolintineanu, W. M. Brown, P. S. Crozier, P. J. in 't Veld, A. Kohlmeyer, S. G. Moore, T. D. Nguyen, R. Shan, M. J. Stevens, J. Tranchida, C. Trott, and S. J. Plimpton. LAMMPS - a flexible simulation tool for particle-based materials modeling at the atomic, meso, and continuum scales. Comput. Phys. Commun., 271:108171, 2022.
- [46] A. Stukowski. Visualization and analysis of atomistic simulation data with OVITO–the open visualization tool. Model. Simul. Mat. Sci. Eng., 18:015012, 2009.
- [47] Andrew H. Nguyen and Valeria Molinero. Identification of clathrate hydrates, hexagonal ice, cubic ice, and liquid water in simulations: the chill+ algorithm. J. Phys. Chem. B, 119(29):9369–9376, 2014.
Acknowledgement
The authors gratefully acknowledge the Gauss Centre for Supercomputing e.V. (www.gauss-centre.eu) for funding this project by providing computing time through the John von Neumann Institute for Computing (NIC) on the GCS Supercomputer JUWELS at Jülich Supercomputing Centre (JSC).
MHM acknowledges helpful discussions with Lars Pastewka, Bo Persson, and Chris May.
Funding: This work was supported by the DFG through grant MU 1694/5-2.
Author contributions:
Conceptualization: M.M.
Methodology: A.A, M.M, S.S.
Theory: M.M.
Data curation: A.A, S.S.
Visualization: A.A, M.M, S.S.
Computing-time acquisition: A.A, M.M, S.S.
Funding acquisition: M.M.
Writing – original draft: M.M.
Writing – review & editing: A.A, M.M, S.S.
Competing interests:
The authors declare that they have no competing interests.
.