Understanding inner-shell excitations in molecules through spectroscopy of the 4f hole states of YbF
Abstract
Molecules containing a lanthanide atom have sets of electronic states arising from excitation of an inner-shell electron. These states have received little attention, but are thought to play an important role in laser cooling of such molecules and may be a useful resource for testing fundamental physics. We study a series of inner-shell excited states in YbF using resonance-enhanced multi-photon ionisation spectroscopy. We investigate the excited states of lowest energy, 8474, 9013 and 9090 cm-1 above the ground state, all corresponding to the configuration 4f136s2 of the Yb+ ion. They are metastable, since they have no electric dipole allowed transitions to the ground state. We also characterize a state at 31050 cm-1 that is easily excited from both the ground and metastable states, which makes it especially useful for this spectroscopic study. Finally, we study a state at 48729 cm-1, which is above the ionization limit and features strong auto-ionizing resonances that prove useful for efficient detection of the molecules and for identifying the rotational quantum number of each line in the spectrum. We resolve the rotational structures of all these states and find that they can all be described by a very simple model based on Hund’s case (c). Our study provides information necessary for laser slowing and magneto-optical trapping of YbF, which is an important species for testing fundamental physics. The metastable states may themselves be important for this application. They are long-lived states in a laser-coolable molecule featuring closely-spaced levels of opposite parity, all of which are desirable properties for measuring the electric dipole moments of electrons and protons, investigating parity violation, and developing molecular lattice clocks as frequency standards and probes of varying fundamental constants.
I Introduction
Atoms and ions in the lanthanide family have a rich spectrum of excited energy levels, one set arising from excitation of a 6s electron and another set due to excitation of a 4f electron. The two sets of levels are almost decoupled because transitions between them are strongly forbidden. These forbidden transitions are important because they serve as clock transitions and as excellent testing grounds for physics beyond the Standard Model. Consider the Yb+ ion for example. The ground state is 4f146s while the lowest-lying excited state is 4f136s2 . The electric-octupole transition between these states is the basis of an outstanding optical clock [1] and is being used to search for new physics via isotope shift measurements [2], tests of local Lorentz invariance [3], and searches for variations of the fundamental constants [4]. Inner-shell transitions have also been studied in neutral Er, Dy and Tm [5, 6, 7].
Similar sets of inner-shell excited states must exist in molecules that contain atoms from the lanthanide family, but very little is known about these states which have not received much attention so far. They may be of interest for fundamental physics as molecules frequently offer higher sensitivity to new physics than atoms, especially for exploring variations of fundamental constants [8, 9], and for measuring electric dipole moments (EDMs) of electrons and protons [10, 11, 12, 13] or magnetic quadrupole moments (MQMs) of nuclei [14] that are highly sensitive probes of physics beyond the Standard Model [15, 16]. Excellent examples are the YbF and YbOH molecules which are great systems for searching for new physics and have been laser cooled [17, 18, 19]. A new generation of ultra-precise measurements based on such ultracold molecules are currently being prepared [20, 21, 22].
In YbF, the ground state, , correlates to the 4f146s configuration of Yb+, and the series of excited states , etc. arise from excitation of the 6s electron. However, the lowest-lying electronically excited state correlates to the 4f136s2 configuration of Yb+ and is the first of a series of such states that we call the “4f hole” states. They are important in laser cooling because the laser cooling cycle has a leak to the low-lying 4f-hole states. The branching ratio for this leak is predicted to be about [23] which is too large for effective radiation pressure slowing or magneto-optical trapping of YbF. To make progress, it is necessary to address this leak, so a good understanding of the 4f hole states is needed. Recent theoretical studies [23, 24] have shed some light on these states, and their approximate energies have been determined by studying the fluorescence from high-lying states into the 4f hole states using a grating spectrometer [25], but there has been no previous laser spectroscopy of these states.
Here, we present rotationally-resolved spectroscopy of a series of electronic states in YbF that have 4f hole character. Despite the complexity of the electronic structure, we find that these states can be understood using a simple physical model - a 4f hole state of the Yb+ ion has a Stark splitting due to the electric field from the nearby F- ion, producing a set of states characterized by the projection of the atomic angular momentum onto the electric field axis. Each of these states has a simple rovibrational structure. The atomic spin-orbit splitting is large, the Stark splitting much smaller and similar to the vibrational splitting, and the rotational splitting much smaller again. This hierarchy conforms to a Hund’s case (c) description [26], which is rarely used in molecular spectroscopy but is simpler and more intuitive than the usual descriptions of molecular states. In the rotational structure of the 4f hole states we find near degeneracies between rotational levels of the same parity and between rotational levels of opposite parity. The existence of these closely-spaced levels in long-lived states of a laser-coolable diatomic molecule is of interest for measuring fundamental electric dipole moments [11, 12, 13] and for studying parity violation [27]. We also observe a remarkable set of very strong resonances above the ionization limit of the molecule, corresponding to auto-ionizing states that have unusually long lifetimes. We attribute the long lifetime to the states being 4f hole states that are only weakly coupled to the ground state of the YbF+ cation, which has a filled 4f shell. These strong auto-ionizing states are themselves an interesting topic for study. They provide an efficient route for state-selective detection of the molecule. Since they are narrow and strongly resonant, each rotational state has a unique ionization spectrum which we use as a fingerprint to assign rotational quantum numbers to our spectra.
II Experiment
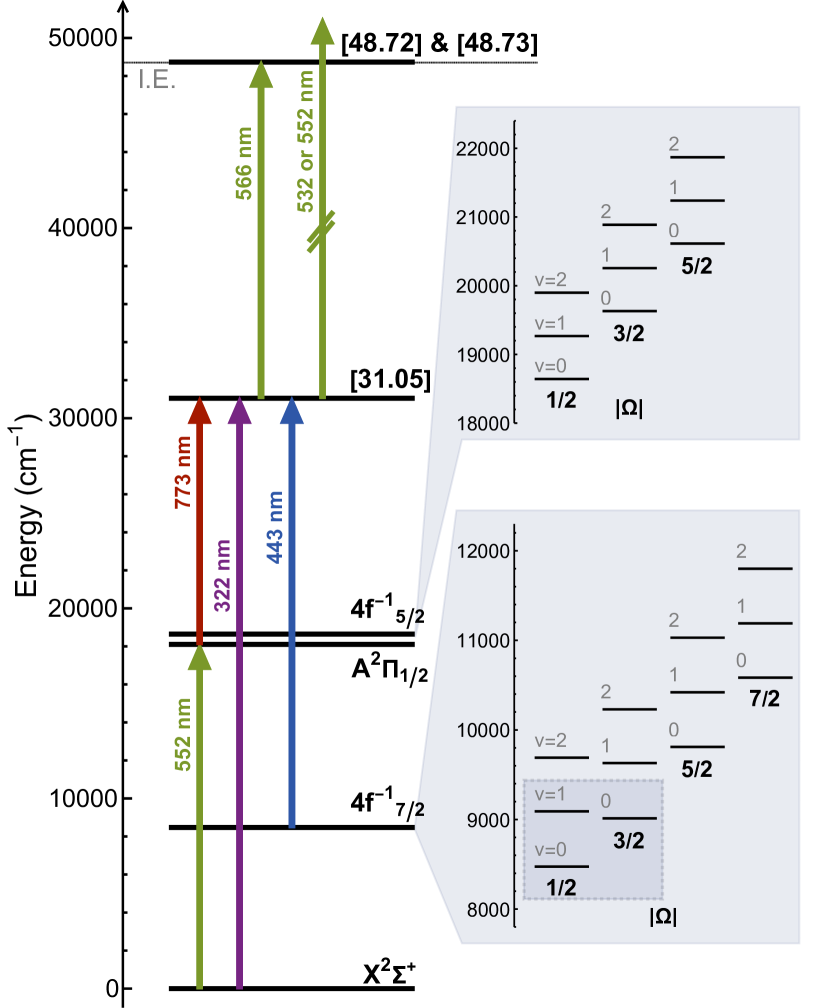
Figure 1 presents the energy levels and transitions relevant to this work. The main optical cycling transition in YbF is between and . The lowest energy 4f hole states correlate to the 4f136s2 configuration of Yb+, which has orbital angular momentum and spin . There is a very large spin-orbit interaction that splits this configuration into a pair of states with total atomic angular momentum and , with having lower energy. Each of these states is further split by the electric field of the F- ion into a set labelled by the projection of the total angular momentum onto the internuclear axis, . We use the notation to label these states, omitting when we want to refer to the entire manifold of states. The manifold lies about half way between and . The manifold lies close to . Indeed, is so close in energy to that the pair mix almost completely [23].
We also use three higher-lying states of the molecule. The first was identified by Persinger et al. [25] who called it [31.05], where the label is the term energy in thousands of cm-1. We will continue to use this notation. This state is convenient because it has strong transitions from both the ground state (at 322 nm) and from the states (near 443 nm). The remaining high-lying states are newly identified states at 48720 cm-1 and 48729 cm-1, both less than 30 cm-1 above the ionisation energy. Continuing with the same notation, we label these as [48.72] and [48.73].
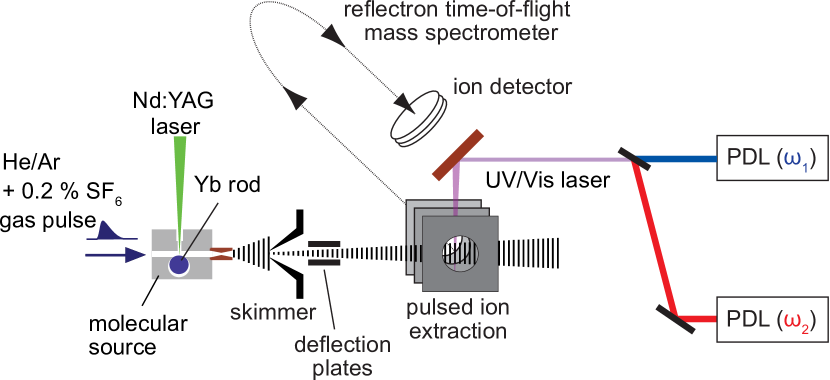
Figure 2 illustrates the experiment [28]. We produce a supersonic beam of YbF and characterize the states of interest using resonance enhanced multi-photon ionisation (REMPI) spectroscopy. The molecules are generated by pulsed laser ablation of a solid Yb rod (natural isotopic abundance) in the presence of diluted in either a He or Ar carrier gas. The gas mixture is released into the source using a pulsed valve (R.M. Jordan Co., Inc.) operating at 10 Hz. The resulting supersonic beam first passes through a skimmer, then between a pair of plates where an applied electric field deflects away any ions generated by ablation that remain in the beam, and finally into the REMPI detection region. We find that the beam has significant population in the first 18 rotational levels of , corresponding to a rotational temperature of 40 K. We also find that there is substantial population in the states.
Two pulsed dye lasers are used during this study: a Sirah PrecisionScan laser with a linewidth of 0.04 cm-1 and a Radiant Dyes NarrowScan laser with a linewidth of 0.05 cm-1. Their frequencies are measured with a wavemeter (HighFinesse WS6-600, absolute accuracy 600 MHz). In addition, a 532 nm pulsed Nd:YAG laser can be used for ionisation. The lasers interact with the molecules in a field-free environment. In most cases the excitation laser pulse energy was such that there was little or no spectral broadening and transition widths were limited by the laser linewidths. The ionisation laser pulse energy was set low enough that no one-colour multi-photon ionisation was observed. After the laser pulses, a field is turned on to extract the ions. The cations are detected in a Wiley-McLaren type time-of-flight mass spectrometer whose resolution is sufficient to resolve the different YbF isotopologues. Although data for the various isotopologues has been obtained, we limit our discussion to the most abundant species and that most relevant for laser cooling, 174YbF.
III Spectroscopic model
| Label | State composition | (cm-1) | (cm-1) | |
| 8474.390(9) | 0.26737(6) | 3.8760(24) | ||
| 9012.541(6) | 0.26597(8) | – | ||
| 9090.675(7) | 0.2656(1) | 3.8756(24) | ||
| and | 18580.574(2) | 0.25466(6) | 1.7699(10) | |
| and | 18705.007(2) | 0.25687(6) | 1.9608(10) | |
| 31049.541(5) | 0.24921(3) | 3.5220(12) | ||
| 48720.277(3) | 0.25162(3) | – | ||
| 48729.01(4) | 0.2568(6) | 2.016(12) |
The states studied in this paper conform well to a Hund’s case (c) model, as described by Veseth [26]. We introduce the angular momenta and where is the electronic orbital angular momentum, is the electronic spin, and is the rotational angular momentum. The projection of (and also ) onto the internuclear axis is , and the basis states are . We may think of as the angular momentum of the underlying atomic state, which in this case is the state of the Yb+ ion. The state is split by the electrostatic interactions of the molecule into components labelled by . We think of this as the Stark splitting of the atomic state, which in this model is small compared to the spin-orbit interaction. In addition to the electronic structure, each of these states is split into smaller vibrational structure and even smaller rotational structure. The rotational structure is our main concern.
The rotational Hamiltonian is
| (1) |
The matrix elements of in the basis are
| (2) |
where
| (3) |
We introduce the basis set of symmetric and anti-symmetric combinations of , denoted by :
| (4) |
The diagonal elements of in the basis give energies
| (5) |
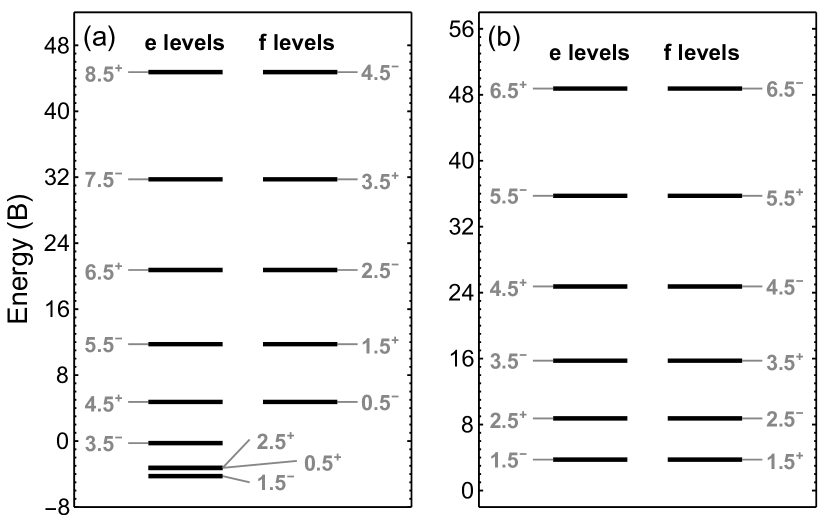
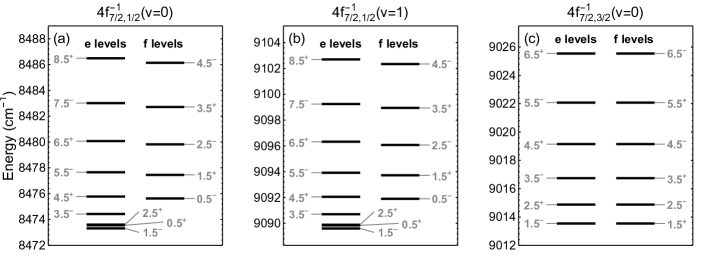
The terms, and are constants for each electronic state and do not contribute to the rotational structure. We incorporate these terms into the term energy, . The final term in Eq. (5), which depends on the e/f symmetry and is only non-zero for , comes from the off-diagonal matrix element in Eq. (2) which connects and . We see that, for , rotational level of the f manifold is degenerate with level of the e manifold, while for levels of the same are degenerate in the two manifolds. There can also be degeneracy within the e manifold when : levels and are degenerate if they satisfy . Figure 3(a) shows the energy level structure described by Eq. (5) for the case where and . We see the degeneracy between level of the f manifold and level of the e manifold. We also note the unusual behaviour of the e manifold at low – the lowest level is , while and are degenerate. Figure 3(b) shows the case where , where the rotational energies are simply for both manifolds. All the states studied in this work have a rotational structure similar to the ideal case illustrated here, so we use this Hund’s case (c) picture to describe them all.
Next, we consider two corrections that go beyond this simple model. The first is a small correction to the energy due to the off-diagonal matrix elements in Eq. (2) that couple states of different , differing by . This correction can be obtained using second order perturbation theory. For an state, the correction is
| (6) |
The first term becomes a small correction to the coefficient of in Eq. (5), while the second term is a constant that we absorb into the term energy . The correction is small because , the energy difference between the and states, is large compared to . Although is identical for the e and f manifolds, it depends on , so slightly lifts the degeneracy for (but not for ). The equivalent correction for is
| (7) |
Our second correction accounts for the fact that the molecular electric field responsible for the splitting by can also mix configurations of different , resulting in eigenstates of the form
| (8) |
where the sum runs over the possible values of , and . Since does not couple states of different , the only modification needed is to replace by in the last term of Eq. (5).
Combining all of the above into a single expression, the energy of an state can be written as
| (9) |
The last term in Eq. (9) lifts the degeneracy between the e and f manifold noted above and illustrated in Fig. 3(a). It is equivalent to a lambda-type doubling term familiar from case (a) states, but here it is fully characterised by the rotational constant and the wavefunction amplitudes . Fitting to this model will return an optimal value of , but the combination of factors that give a certain will, in general, not be unique.
IV [31.05]
We begin by analyzing the rotational structure of [31.05]. This is a state of mixed character which provides a convenient pathway between the ground state and the 4f hole states [25]. Later, we use the structure of [31.05] in our analysis of the strong transition .
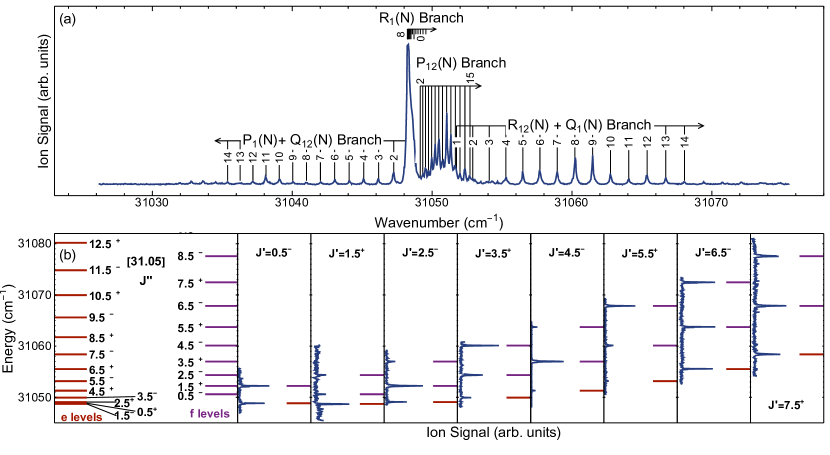
Figure 4(a) presents the spectrum of the band obtained by scanning a laser at 322 nm. The laser is a RadiantDyes NarrowScan with DCM dye producing 644 nm light which is then frequency doubled. A second pulsed dye laser at 552 nm is used to ionise from [31.05]. There is a 10 ns delay between the two laser pulses. Each point in the scan is comprised of the ion intensity extracted from the average of 30 consecutive mass-spectra traces.
Assignment of the spectral lines proved challenging because of the congestion of lines in the central region of the spectrum together with the irregular intensities observed. Instead, assignment of the rotational lines was made by excitation via a well characterised intermediate state. The first step is to excite molecules to a known rotational level of . We do this using a pulsed dye laser tuned to a selected rotational line in either the or branches of the transition at 552 nm (branch notation is the same as described in the caption of Fig. 4). The rotational structure of these branches is well resolved and well characterized, so we can be sure to populate only one rotational state, . Then, we use a second pulsed dye laser at 773 nm to drive transitions. There are, at most, 3 possible transitions, due to the angular momentum selection rule, so the spectrum is hugely simplified. We use a 532 nm pulsed Nd:YAG laser to ionise from [31.05], and then detect these ions. There is a 10 ns time delay between each of the laser pulses.
Figure 4(b) shows scans of the transition for various values of . In each case, we add together the measured energy of the 773 nm photon with the known energy of the excitation and the known energy of the initial rotational level of , so that the vertical axis is the absolute energy. As expected, the method produces very simple and unambiguous spectra. For example, excitation of the P12(2) line prepares the negative parity component with of . From here the only levels of [31.05] that can be excited are positive parity components with and 1.5. We see only these two lines in the spectrum. The line (but not ) is observed again when we excite from the negative parity component of , providing an unambiguous assignment. Continuing in this way, all lines can be assigned. Our method effectively measures the rotational energy levels directly, rather than the usual method of extracting the level structure from a fit to a spectrum.
The rotational energy levels determined this way are shown on the left of Fig. 4(b). We immediately see the similarity to the structure illustrated in Fig. 3(a), clearly identifying that [31.05] is a state with . We see that level of the f manifold lies between levels and of the e manifold. A preliminary fit of these energy levels is used in order to assign the observed transitions in Fig. 4(a). We then fit a Lorentzian model to individual rotational lines in the spectrum where these do not overlap significantly. Finally, a non-weighted, non-linear fit of 43 lines from this spectrum is used to determine the spectroscopic constants. The result of this fit is shown in Table 1. The standard deviation of the residuals is 0.02 cm-1. We assign this transition as a 0-0 vibrational band since we do not observe isotope shifts between the rotational spectra of the five dominant isotopes. The value of corresponds to the case where the state is a 52:48 mixture of two electronic states with and .
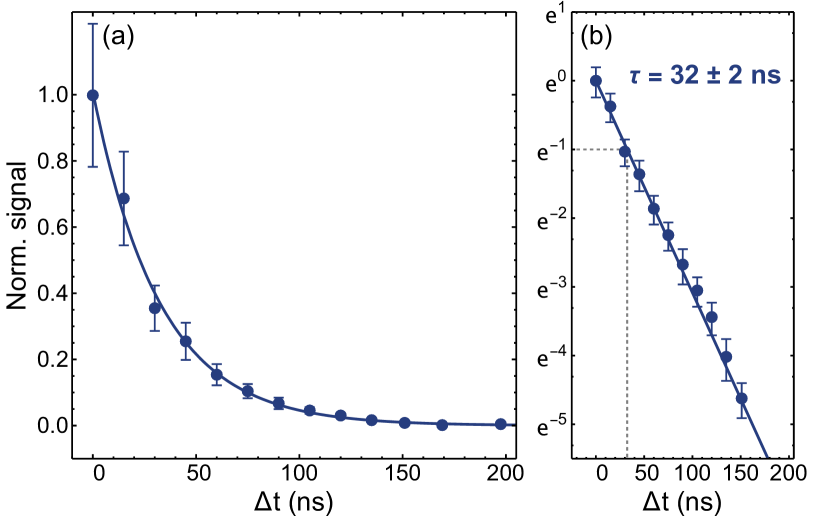
The lifetime of [31.05] is determined by time-resolved photo ionisation using the same REMPI scheme as used to obtain the data in Fig. 4(b). The ion signal is recorded as a function of the time delay between the 773 nm excitation and 532 nm ionisation laser pulses. We made this measurement for six different rotational states of [31.05] and saw no significant difference between them. Figure 5 shows the mean of these six measurements, along with a fit to a single exponential model. The lifetime is 32(2) ns.
V [48.72] and [48.73]
The relative intensities of rotational lines can be a great help in assigning quantum numbers in a spectrum, particularly when rotational lines overlap. In the present study, however, the observed intensities do not follow a thermal distribution or the expected Hönl-London factors. Instead, the observed intensity pattern is skewed because we reach auto-ionizing resonances above the ionisation energy of the molecule. These resonances prove to be both interesting and useful.
The ionization energy of YbF is at [25]. Figure 6 shows scans above this ionisation energy. The excitation sequence is illustrated in the inset. First, a single rotational state () of [31.05] is populated by driving a single line of either the or branches of the transition (see Fig. 4(a)). Then, a second laser at around 566 nm is scanned, resulting in ionization of the molecule. The horizontal axis in Fig. 6 is the total energy relative to the lowest level of . We determine this for each spectrum by adding together the known energy of the initial level of X, the fitted energy of and the energy of the 566 nm photon. The spectra in Fig. 6 contain a sequence of narrow resonances with Lorentzian widths limited by the laser linewidth, corresponding to states with remarkably long lifetimes of over 100 ps, and a series of broader resonances with Lorentzian widths (FWHM) of 1.4 cm-1, corresponding to a lifetime of 3.7 ps. We first focus on these broad resonances and find that they correspond to the rotational structure of a state that we call [48.73] because its term energy is close to 48730 cm-1. The uppermost spectrum in the figure corresponds to excitation from the negative parity, level in [31.05]. This was excited by driving the line of the transition. The three allowed transitions to the positive parity levels are marked by vertical lines. The positive parity level is measured again in the spectrum where the selected lower level is the negative parity level, confirming its assignment. The energy level structure of [48.73] is discerned by repeating this process for all the values of shown in the figure. The resulting level structure is shown at the bottom of Fig. 6. Within our uncertainties, we find that level of the f manifold is degenerate with level of the e manifold, which tells us that [48.73] has and , and that it conforms exactly to the simple Hund’s case (c) model described in Sec. III. Fitting the energy levels to Eq. (9)111We set the term proportional to to zero in this fit gives the parameters summarised in Table 1. The standard deviation of the residuals from this fit is 0.1 cm-1, which is commensurate with the increased uncertainty due to the width of the transitions. There is no obvious structure in the residuals. By comparing our measured spectra for the various isotopologues of YbF, we find that the rotational lines of show a significant isotope-dependent shift. This isotope shift is consistent with [48.73] having about 1000 cm-1 more vibrational energy than [31.05]. Since [31.05] has and vibrational constants in YbF are typically around 500 cm-1, we suggest that [48.73] has .
The structure of the narrow transitions can be discerned in much the same way. In keeping with the nomenclature above, we label the series of narrow peaks near 48720 cm-1 as [48.72]. Two key observation can be made in the structure of this state. First, we see that there are no excitations , i.e. is the first rotational state. Second, we find that levels with the same in the e and f manifolds are degenerate. In our Hund’s case (c) model, this conforms well to a state of . The term energy, , and rotational constant, , obtained by a weighted fit to Eq. (9) are presented in Table 1. For an state there is no parameter, so only these two constants are relevant11footnotemark: 1. The residuals from this fit all fall within their uncertainties. Transitions show a large isotope shift consistent with [48.72] having almost 2000 cm-1 more vibrational energy than [31.05]. Such an isotope shift would be consistent with . We note that excitations to [48.72] via R12 transitions are not as visible in Fig. 6 as those obtained via excitation on P1 transitions.
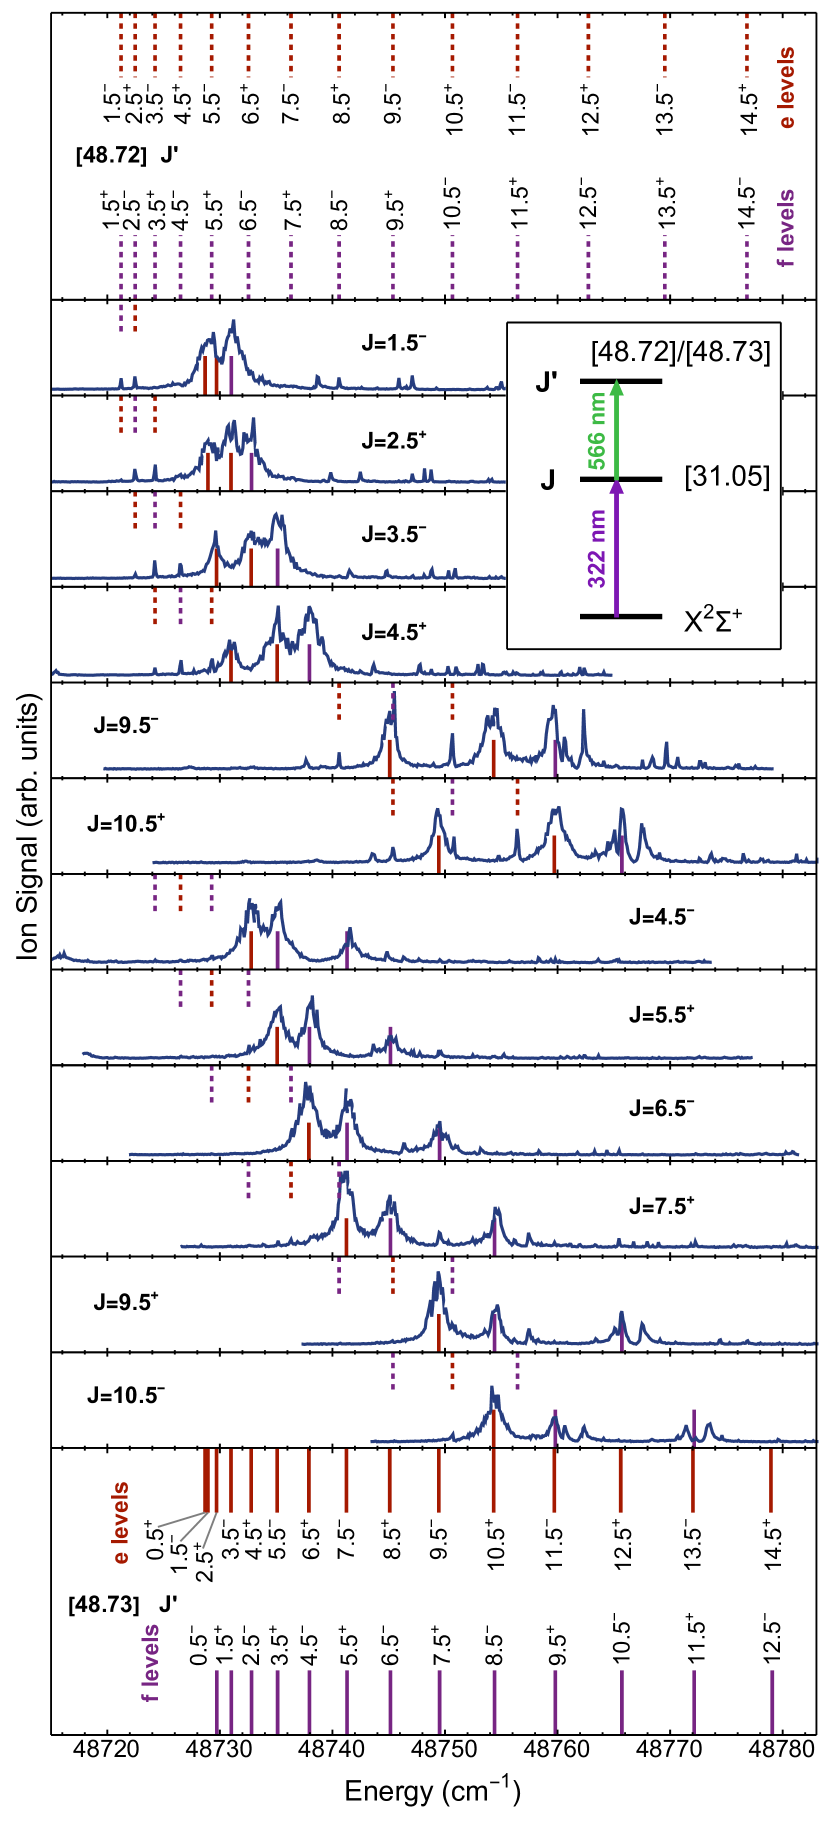
Each ionisation spectrum in Fig. 6 is a unique ‘fingerprint’ of the rotational level prepared in [31.05]. We now use these fingerprints to help us characterize the states.
VI states
In this section we present rotationally resolved spectra of the transitions measured using two colour (1+1′) REMPI. The supersonic source produces sufficient population in the states to do this spectroscopy directly.
Figure 7 shows the observed spectrum of . The excitation scheme used to obtain the spectrum is shaded in blue. A first excitation laser driving the transition is scanned. A second ‘ionisation’ laser drives the transition, producing ions which are then extracted and detected in the time-of-flight mass spectrometer. There is a 10 ns delay between the two laser pulses. The ion signal is much stronger when detected resonantly via [48.73], than when ionizing with 532 nm light. Since the auto-ionising states are broad, a single ionisation laser frequency is sufficient to observe many rotational lines in the spectrum. Note that the intensity of any given rotational line in the spectrum will depend on the strengths of the two excitation steps and also on the detuning of the ionization laser from the resonance relevant to that rotational line. The intensity pattern can be very different if a different frequency is chosen for the ionisation laser, which makes it challenging to extract useful information from the intensities.
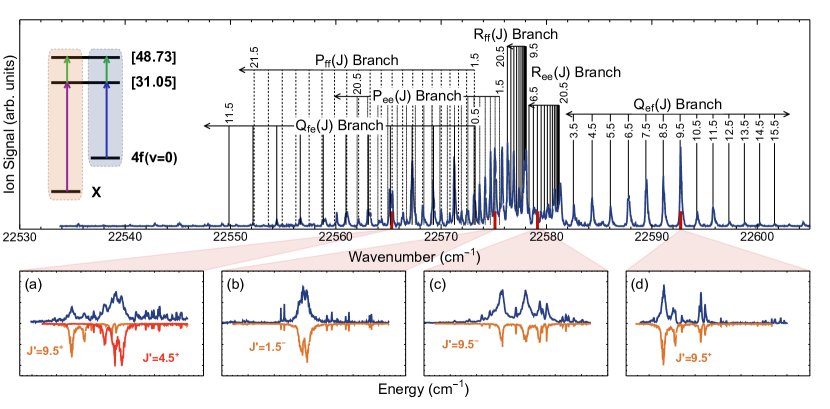
Assignment of the rotational lines was achieved with the help of the reference ionization spectra (or ‘fingerprints’) noted above. We choose a particular line in the spectrum and fix the frequency of the excitation laser to the frequency of that line. This excites some particular rotational level of [31.05]. To determine , we now scan the ionization laser across the [48.73] state. The resulting ionization spectrum is unique for each and can be compared to the ‘reference’ ionisation spectra in Fig. 6. Figure 7(a-d) shows four examples of this procedure, corresponding to the four positions marked by red lines in the upper panel. The blue lines are the ionisation spectra obtained after excitation from , while the orange lines are the reference spectra from Fig. 6. As an example, consider Fig. 7(d) where the excitation frequency is 22592.73 cm-1. The ionisation spectrum matches that of the positive parity level in [31.05]. This identifies the upper level for this line in the spectrum, but not yet the lower level which could have or 10.5. The same level of [31.05] is reached again when we excite at 22565.30 cm-1, as shown in Fig. 7(a). Here, the ionization spectrum is more complicated, corresponding to the sum of two fingerprints, namely the positive parity components of (orange) and (red), meaning that two distinct lines are excited at this frequency. Following this procedure, each rotational level of can in principle be observed three times, corresponding to the P, Q and R lines going to , and of [31.05]. For each rotational line observed in the spectrum the absolute energy of the lower level can be calculated by subtracting the excitation frequency from the known energy of the [31.05] rotational level we are exciting to. A unique assignment of the rotational quantum number can be made once a P and a Q line coming from the same (identified by having the same lower energy) have been measured. The energy level structure we determine this way is summarized in Fig. 9(a). The similarity to the level structure for the ideal state is evident by comparison to Fig. 3(a).
The rotational bands in Fig. 7 are labelled using the notation where and are either or and denote the symmetry of the and [31.05] rotational states, respectively. We observe two bandheads in the Rff and branches occurring at and respectively. We fit Lorentzians to the rotational lines in the spectrum. The low frequency side of the spectrum is congested with the , and lines all overlapping. To better resolve this region of the spectrum, we set the ionisation frequency to selectively ionise only some rotational levels. For example, in Fig. 7(a) we see that there exist ionisation frequencies where only the line and lines are respectively detected. This procedure can be repeated for many of the overlapping peaks. In total, we fit 61 lines to the model described by Eq. (9). In this fit, we fix to our measured difference in term energies for and 3/2, which is cm-1 (see Table 1 and next paragraph). Table 1 gives the best fit parameters. The rotational constant is in agreement with the value predicted from the bond length calculated in [23]. The value of does not uniquely determine the coefficients but is consistent with a dominantly state; the upper bound on is 0.94.
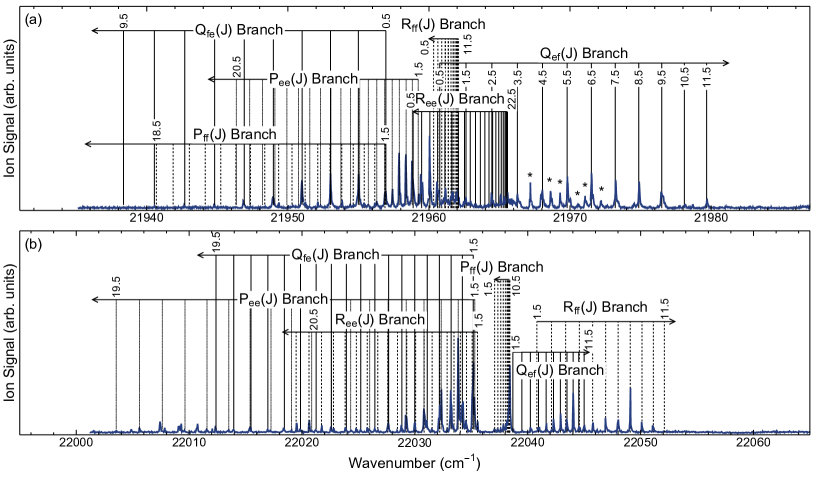
Figure 8 shows our measured spectra for the and transitions. We use the same methodology as described above to assign quantum numbers to the lines in these spectra, and the same analysis methods to determine the spectroscopic constants, using 44 and 47 lines respectively. The energy difference, , is set to -790 cm-1 based on the work by Persinger et al. [25]. For the state with the term is not relevant and we omit it.
VII [18.58] and [18.71]
The level of lies very close in energy to the level of , and they are strongly mixed. In our notation, the resulting eigenstates are labelled [18.58] and [18.71]222Elsewhere, e.g [29, 23], these states are instead labelled by their frequencies in THz: [557] and [561].. These two states have strong transitions to X, and their rotational energy level structure has been measured previously by cw laser spectroscopy of the and transitions [29]. The states were characterized by modelling them as states in Hund’s case (a). By fitting the energy levels given in Table 4 of [29] to Eq. (9)11footnotemark: 1, we find that both states fit very well to our model based on Hund’s case (c). The fit confirms that both states have . The residuals show some structure but are all below 0.01 cm-1. The parameters of these fits are given in Table 1. For both states, the value of is consistent with the value determined from the model. For [18.71], is very close to 2, which is consistent with this state being an almost pure state. Given its strongly mixed character, this seems unlikely. Instead, the value of can be explained by supposing that the state is a mixture of and , in which case we find and . If we make a similar assumption about [18.58], the value of implies and .
A previous deperturbation analysis [23] suggests that [18.58] has 52% character and 46% character, while for [18.71] the fractions are 47% and 51%. The remaining composition comes from other vibrational levels of the same electronic states and are all at least an order of magnitude smaller. Here, we study these compositions by measuring the lifetimes of the two states. The transition dipole moment for the A-X transition is about 100 times larger than for the 4f-X transition. In this limit, where the mixing is strong and one transition dipole is much larger than the other, the lifetime of a mixed state whose A state amplitude is is simply , where is the lifetime of the A state.
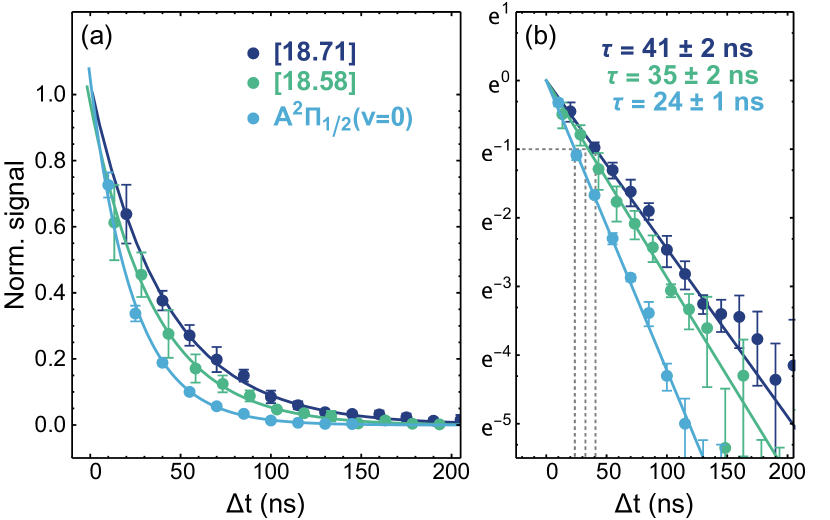
We have measured the lifetimes of , [18.58] and [18.71] using the delayed ionisation method described in Sec. IV. In each case, we measured the lifetime on three different rotational lines and averaged the data. Figure 10 shows our results. Fitting single exponential decays to these data we obtain the following lifetimes: , and . Our value of is consistent with the value of measured previously [31]. These results imply that for [18.58] %, while for [18.71] %. These percentages are both a little larger than determined through the deperturbation analysis, but confirm that the two mixed states are indeed close to 50:50 mixtures.
VIII Conclusions
Our rotationally resolved spectroscopic study of the low-lying 4f hole states of YbF has determined the character of these states. They derive from the 4f136s2 configuration of Yb+, which is split by an enormous spin-orbit interaction into two terms, the one with lying approximately 10000 cm-1 below the one with . Each of these is split by the electric field of the F- ion into a set of states labelled by , but this splitting is much smaller, 500-1000 cm-1. The rotational splitting is much smaller again, around 1 cm-1, resulting in a convenient structural hierarchy conforming to Hund’s case (c). The rotational structures of the 4f hole states fit very well to this model, requiring only 3 parameters – a term energy, a rotational constant, and an effective value of . We have determined these constants to high precision. In previous work, the energies, bond lengths and vibrational constants of the 4f hole states were calculated [23]. Our measured rotational constants imply a bond length of 1.9187(2)Å, consistent with the calculations. Similarly, the energy difference between and , measured to be 616.285(11) cm-1, is close to the calculated value of 614.3 cm-1.
We consider the splitting between the components of the 4f hole states to be the Stark splitting of the Yb+ 4f136s state. To support this picture, we estimate the polarizability of this configuration using second-order perturbation theory, summing over all relevant states of the ion. A table of the required transition frequencies and Einstein A-coefficients is given in [32]. We find the difference in polarizability between the and components to be J m2 V-2. Our measured splitting is cm-1, implying an electric field of V m-1 at the Yb+ ion. This is the electric field produced by a charge placed 1.84 Å away. Given the simplicity of this picture, and the doubtful validity of using perturbation theory for such an enormous electric field, the result is remarkably close to the actual bond length of 1.92 Å.
YbF, and similar molecules, are important for testing fundamental physics through measurements of the electron’s electric dipole moment (EDM). The precision of these measurements can be improved by cooling the molecules to K temperatures and trapping them [20]. Previous work [18, 23] suggests that laser slowing and magneto-optical trapping using the transition will be hindered by small leaks from into and . Given the upper state used for laser cooling, and the parity and angular momentum selection rules, leaks should only populate the negative parity components with and . This population can be returned to the laser cooling cycle, for example by driving it to [18.58] or [18.71]. Our work establishes the required laser frequencies with a precision of 0.01 cm-1.
As well as facilitating experiments in the ground state of YbF, we speculate that the low-lying 4f hole states may themselves be useful for tests of fundamental physics. EDM experiments measure the interaction energy between the EDM and an effective electric field, , which is enormous in heavy polar molecules. When the molecule has a pair of near-degenerate states of opposite parity, a small applied electric field fully polarizes the molecule producing a pair of states where is equal and opposite. This ability to reverse the sign of the interaction through the choice of state is exploited in the most precise electron EDM measurements [11, 12]. The ground states of laser coolable molecules do not have this structure, so attention has recently turned to polyatomic molecules [33]. The present work shows that the 4f hole states do have this structure – we have found long-lived states having closely-spaced parity doublets in a laser coolable molecule. In particular, we find that the low- levels of opposite parity in are degenerate to within our experimental resolution of 0.03 cm-1. Further experimental work is needed to determine the lifetimes and Stark shifts of these states, and a calculation of for these states would be valuable. Diatomic molecules are also being used for sensitive measurements of nuclear parity violation, utilizing the ability to tune states of opposite parity into resonance through the Zeeman shift [27]. In this context, we note that when the spacing of the and 5/2 states of the e manifold can be smaller than the rotational constant, especially when is close to 3 (opposite parity become degenerate) or close to 4 (same parity become degenerate). Thus, it may be possible to tune states into resonance at small magnetic fields. In this context, measurements of the Zeeman effect in the 4f hole states would be valuable. Finally, we note the considerable interest in developing molecular clocks, both as frequency standards and for measuring variations of fundamental constants [8, 9]. The transition from the ground state to one of the 4f hole states may be suitable for such a clock, similar to the Yb+ clock based on the equivalent electric octupole transition [1].
[31.05] and [48.73] have a very similar rotational structure to the low-lying states. It is likely that they also correspond to excitations out of the 4f shell, though we do not currently know their underlying configurations. [48.73] is especially notable as it conforms almost exactly to the Hund’s case (c) model with and . A broad-band spectroscopic survey of the entire set of inner-shell excited states in YbF would be useful, as would quantum chemistry calculations of this set. Through this combination of spectroscopy and calculation, it should be possible to determine the character of each state.
We have found many electronic states above the ionization energy, including [48.72] and [48.73] studied here. Some of them have remarkably long lifetimes, and we suppose that these also correspond to excitation of a 4f electron. We attribute the existence of such strong and narrow auto-ionizing resonances to the weak coupling between the two series of electronically excited states. [48.73] has a 4f hole but does not have enough energy to auto-ionize to any 4f hole state of the YbF+ cation or to dissociate to a state that has a 4f excitation in the atom or ion. Thus, [48.73] can only auto-ionize into the closed-shell ground-state of YbF+, which requires a two-electron Auger process. Indeed, the first core-hole excited state of the cation can be considered as the effective ionization potential of the series of YbF 4f hole states, and is likely to lie approximately 8000-10000 cm-1 above the normal ionization potential of the molecule. We advocate further studies of this interesting series of auto-ionizing states. The existence of strong auto-ionising states may open a channel for efficient state-selective detection of YbF by CW laser excitation to an auto-ionizing state. Precision measurements using this molecule currently use fluorescence detection which is often limited to an efficiency of about 10% [34], whereas ion detection can have almost unit efficiency if there is sufficient laser power for ionization. Finally, we note that these resonances result in an ionization spectrum that is different for each rotational state, which can be helpful in assigning quantum numbers to a spectrum. This method proved to be an extremely useful tool for elucidating the energy level structure of the 4f hole states from their complicated spectra.
Acknowledgements.
We are grateful to Prof. Ben Sauer for helpful discussions and advice. We acknowledge the assistance of Luca Diaconescu in some of the measurements. This research has been funded in part by the Gordon and Betty Moore Foundation through Grant GBMF12327 (DOI 10.37807/GBMF12327), and by the Alfred P. Sloan Foundation under Grant No. G-2023-21035, and by UKRI under grants EP/X030180/1 and ST/V00428X/1.References
- Huntemann et al. [2012] N. Huntemann, M. Okhapkin, B. Lipphardt, S. Weyers, C. Tamm, and E. Peik, High-accuracy optical clock based on the octupole transition in , Phys. Rev. Lett. 108, 090801 (2012).
- Hur et al. [2022] J. Hur, D. P. L. Aude Craik, I. Counts, E. Knyazev, L. Caldwell, C. Leung, S. Pandey, J. C. Berengut, A. Geddes, W. Nazarewicz, P.-G. Reinhard, A. Kawasaki, H. Jeon, W. Jhe, and V. Vuletić, Evidence of two-source king plot nonlinearity in spectroscopic search for new boson, Phys. Rev. Lett. 128, 163201 (2022).
- Fürst et al. [2020] H. A. Fürst, C.-H. Yeh, D. Kalincev, A. P. Kulosa, L. S. Dreissen, R. Lange, E. Benkler, N. Huntemann, E. Peik, and T. E. Mehlstäubler, Coherent Excitation of the Highly Forbidden Electric Octupole Transition in , Phys. Rev. Lett. 125, 163001 (2020).
- Lange et al. [2021] R. Lange, N. Huntemann, J. M. Rahm, C. Sanner, H. Shao, B. Lipphardt, C. Tamm, S. Weyers, and E. Peik, Improved limits for violations of local position invariance from atomic clock comparisons, Phys. Rev. Lett. 126, 011102 (2021).
- Patscheider et al. [2021] A. Patscheider, B. Yang, G. Natale, D. Petter, L. Chomaz, M. J. Mark, G. Hovhannesyan, M. Lepers, and F. Ferlaino, Observation of a narrow inner-shell orbital transition in atomic erbium at 1299 nm, Phys. Rev. Res. 3, 033256 (2021).
- Petersen et al. [2020] N. Petersen, M. Trümper, and P. Windpassinger, Spectroscopy of the 1001-nm transition in atomic dysprosium, Phys. Rev. A 101, 042502 (2020).
- Golovizin et al. [2019] A. Golovizin, E. Fedorova, D. Tregubov, D. Sukachev, K. Khabarova, V. Sorokin, and N. Kolachevsky, Inner-shell clock transition in atomic thulium with a small blackbody radiation shift, Nat. Commun. 10, 1724 (2019).
- Kondov et al. [2019] S. S. Kondov, C.-H. Lee, K. H. Leung, C. Liedl, I. Majewska, R. Moszynski, and T. Zelevinsky, Molecular lattice clock with long vibrational coherence, Nat. Phys. 15, 1118 (2019).
- Barontini et al. [2022] G. Barontini, L. Blackburn, V. Boyer, F. Butuc-Mayer, X. Calmet, C. L.-U. J. R., E. A. Curtis, B. Darquié, J. Dunningham, N. J. Fitch, E. M. Forgan, K. Georgiou, P. Gill, R. M. Godun, J. Goldwin, V. Guarrera, A. C. Harwood, I. R. Hill, R. J. Hendricks, M. Jeong, M. Y. H. Johnson, M. Keller, L. P. Kozhiparambil Sajith, F. Kuipers, H. S. Margolis, C. Mayo, P. Newman, A. O. Parsons, L. Prokhorov, B. I. Robertson, J. Rodewald, M. S. Safronova, B. E. Sauer, M. Schioppo, N. Sherrill, Y. V. Stadnik, K. Szymaniec, M. R. Tarbutt, R. C. Thompson, A. Tofful, J. Tunesi, A. Vecchio, Y. Wang, and S. Worm, Measuring the stability of fundamental constants with a network of clocks, EPJ Quantum Technol. 9, 12 (2022).
- Hudson et al. [2011] J. J. Hudson, D. M. Kara, I. J. Smallman, B. E. Sauer, M. R. Tarbutt, and E. A. Hinds, Improved measurement of the shape of the electron, Nature 473, 493 (2011).
- Andreev et al. [2018] V. Andreev, D. G. Ang, D. DeMille, J. M. Doyle, G. Gabrielse, J. Haefner, N. R. Hutzler, Z. Lasner, C. Meisenhelder, B. R. O’Leary, C. D. Panda, A. D. West, E. P. West, and X. Wu, Improved limit on the electric dipole moment of the electron, Nature 562, 355 (2018).
- Roussy et al. [2023] T. S. Roussy, L. Caldwell, T. Wright, W. B. Cairncross, Y. Shagam, K. B. Ng, N. Schlossberger, S. Y. Park, A. Wang, J. Ye, and E. A. Cornell, An improved bound on the electron’s electric dipole moment, Science 381, 46 (2023).
- Grasdijk et al. [2021] O. Grasdijk, O. Timgren, J. Kastelic, T. Wright, S. Lamoreaux, D. DeMille, K. Wenz, M. Aitken, T. Zelevinsky, T. Winick, and D. Kawall, CeNTREX: a new search for time-reversal symmetry violation in the 205Tl nucleus, Quantum Sci. Technol. 6, 044007 (2021).
- Ho et al. [2023] C. J. Ho, J. Lim, B. E. Sauer, and M. R. Tarbutt, Measuring the nuclear magnetic quadrupole moment in heavy polar molecules, Front. Phys. 11, 1086980 (2023).
- Safronova et al. [2018] M. S. Safronova, D. Budker, D. DeMille, D. F. J. Kimball, A. Derevianko, and C. W. Clark, Search for new physics with atoms and molecules, Rev. Mod. Phys. 90, 025008 (2018).
- Hutzler et al. [2020] N. R. Hutzler, A. Borschevsky, D. Budker, D. DeMille, V. V. Flambaum, G. Gabrielse, R. F. G. Ruiz, A. M. Jayich, L. A. Orozco, M. Ramsey-Musolf, M. Reece, M. S. Safronova, J. T. Singh, M. R. Tarbutt, and T. Zelevinsky, Searches for new sources of cp violation using molecules as quantum sensors (2020), arXiv:2010.08709 .
- Lim et al. [2018] J. Lim, J. R. Almond, M. A. Trigatzis, J. A. Devlin, N. J. Fitch, B. E. Sauer, M. R. Tarbutt, and E. A. Hinds, Laser cooled YbF molecules for measuring the electron’s electric dipole moment, Phys. Rev. Lett. 120, 123201 (2018).
- Alauze et al. [2021] X. Alauze, J. Lim, M. A. Trigatzis, S. Swarbrick, F. J. Collings, N. J. Fitch, B. E. Sauer, and M. R. Tarbutt, An ultracold molecular beam for testing fundamental physics, Quantum Sci. Technol. 6, 044005 (2021).
- Augenbraun et al. [2020] B. L. Augenbraun, Z. D. Lasner, A. Frenett, H. Sawaoka, C. Miller, T. C. Steimle, and J. M. Doyle, Laser-cooled polyatomic molecules for improved electron electric dipole moment searches, New J. Phys. 22, 022003 (2020).
- Fitch et al. [2021] N. J. Fitch, J. Lim, E. A. Hinds, B. E. Sauer, and M. R. Tarbutt, Methods for measuring the electron’s electric dipole moment using ultracold YbF molecules, Quantum Sci. Technol. 6, 014006 (2021).
- Aggarwal et al. [2018] P. Aggarwal, H. L. Bethlem, A. Borschevsky, M. Denis, K. Esajas, P. A. B. Haase, Y. Hao, S. Hoekstra, K. Jungmann, T. B. Meijknecht, M. C. Mooij, R. G. E. Timmermans, W. Ubachs, L. Willmann, and A. Zapara, Measuring the electric dipole moment of the electron in BaF, Eur. Phys. J. D 72, 197 (2018).
- Anderegg et al. [2023] L. Anderegg, N. B. Vilas, C. Hallas, P. Robichaud, A. Jadbabaie, J. M. Doyle, and N. R. Hutzler, Quantum Control of Trapped Polyatomic Molecules for eEDM Searches, Science 382, 665 (2023).
- Zhang et al. [2022] C. Zhang, C. Zhang, L. Cheng, T. C. Steimle, and M. R. Tarbutt, Inner-shell excitation in the YbF molecule and its impact on laser cooling, J. Mol. Spectrosc. 386, 111625 (2022).
- Pototschnig et al. [2021] J. V. Pototschnig, K. G. Dyall, L. Visscher, and A. S. P. Gomes, Electronic spectra of ytterbium fluoride from relativistic electronic structure calculations, Phys. Chem. Chem. Phys. 23, 22330 (2021).
- Persinger et al. [2022] T. D. Persinger, J. Han, A. T. Le, T. C. Steimle, and M. C. Heaven, Direct observation of the states and accurate determination of the YbF ionization energy, Phys. Rev. A 106, 062804 (2022).
- Veseth [1973] L. Veseth, Hund’s coupling case (c) in diatomic molecules. I. Theory, J. Phys. B 6, 1473 (1973).
- Altuntaş et al. [2018] E. Altuntaş, J. Ammon, S. B. Cahn, and D. DeMille, Demonstration of a sensitive method to measure nuclear-spin-dependent parity violation, Phys. Rev. Lett. 120, 142501 (2018).
- Fielicke et al. [2005] A. Fielicke, G. von Helden, and G. Meijer, Far-infrared spectroscopy of isolated transition metal clusters, Eur. Phys. J. D 34, 83 (2005).
- Lim et al. [2017] J. Lim, J. R. Almond, M. R. Tarbutt, D. T. Nguyen, and T. C. Steimle, The [557]-X and [561]-X bands of ytterbium fluoride, 174YbF, J. Mol. Spectrosc. 338, 81 (2017).
- Sauer et al. [1996] B. E. Sauer, J. Wang, and E. A. Hinds, Laser-rf double resonance spectroscopy of 174YbF in the X state: Spin-rotation, hyperfine interactions, and the electric dipole moment, J. Chem. Phys. 105, 7412 (1996).
- Zhuang et al. [2011] X. Zhuang, A. Le, T. C. Steimle, N. E. Bulleid, I. J. Smallman, R. J. Hendricks, S. M. Skoff, J. J. Hudson, B. E. Sauer, E. A. Hinds, and M. R. Tarbutt, Franck-Condon factors and radiative lifetime of the A-X transition of ytterbium monofluoride, YbF, Phys. Chem. Chem. Phys. 13, 19013 (2011).
- Biémont et al. [1998] E. Biémont, J.-F. Dutrieux, I. Martin, and P. Quinet, Lifetime calculations in Yb II, J. Phys. B 31, 3321 (1998).
- Hutzler [2020] N. R. Hutzler, Polyatomic molecules as quantum sensors for fundamental physics, Quantum Sci. Technol. 5, 044011 (2020).
- Ho et al. [2020] C. J. Ho, J. A. Devlin, I. M. Rabey, P. Yzombard, J. Lim, S. C. Wright, N. J. Fitch, E. A. Hinds, M. R. Tarbutt, and B. E. Sauer, New techniques for a measurement of the electron’s electric dipole moment, New J. Phys. 22, 043031 (2020).