somespace \floatsetuprowpostcode =somespace, margins = centering
A Case for a Binary Black Hole System Revealed via Quasi-Periodic Outflows
Binaries containing a compact object orbiting a supermassive black hole are thought to be precursors of gravitational wave events, but their identification has been extremely challenging. Here, we report quasi-periodic variability in X-ray absorption which we interpret as quasi-periodic outflows (QPOuts) from a previously low-luminosity active galactic nucleus after an outburst, likely caused by a stellar tidal disruption. We rule out several models based on observed properties and instead show using general relativistic magnetohydrodynamic simulations that QPOuts, separated by roughly 8.3 days, can be explained with an intermediate-mass black hole secondary on a mildly eccentric orbit at a mean distance of about 100 gravitational radii from the primary. Our work suggests that QPOuts could be a new way to identify intermediate/extreme-mass ratio binary candidates.
1 Introduction
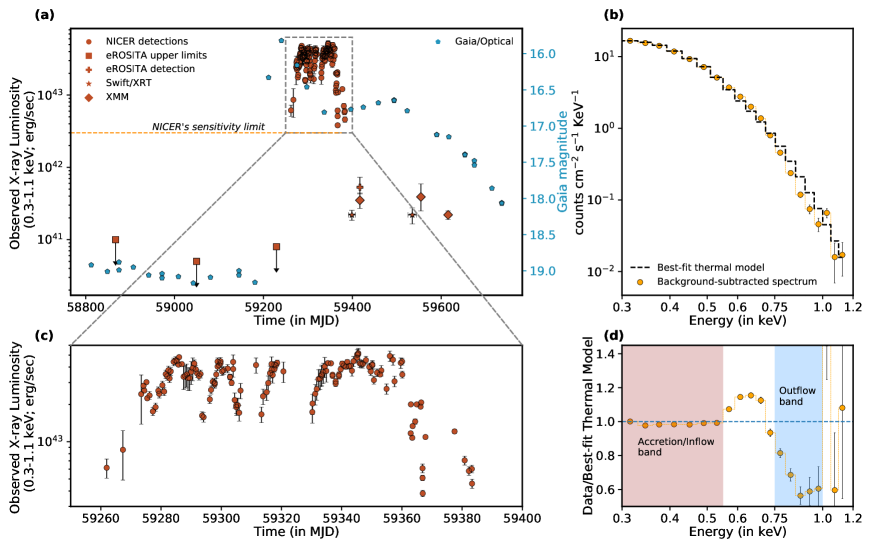
ASASSN-20qc (?) is an astrophysical flare that originated from the nucleus of a galaxy at a redshift of 0.056 (luminosity distance of 260 Mpcs). It was discovered by the All-Sky Automated Survey for SuperNovae (ASAS-SN; (?, ?)) on 20 December 2020. Throughout the paper, we reference times with respect to this discovery date of Modified Julian Date (MJD) 59203.27. A follow-up optical spectrum revealed the presence of several Hydrogen and Oxygen emission lines which facilitated the estimate of the redshift (?) (Methods section LABEL:sisec:data) and a supermassive black hole (SMBH) mass of log (Methods section LABEL:subsec:bhmass and LABEL:sec:host; Table LABEL:tab:mbh). A luminosity of 61040 erg s-1 from archival eROSITA data (Fig. 1a and Methods section LABEL:sisec:data) indicates that prior to the outburst it was a low-luminosity Active Galactic Nucleus (AGN; see Methods section LABEL:subsec:bpt) accreting at 0.002% of its Eddington limit.
Roughly 52 days after ASASSN-20qc’s optical discovery the Neil Gehrels Swift observatory (Swift) observed it and detected X-rays. Following this detection, the Neutron star Interior Composition ExploreR (NICER) started a high-cadence (1-2 visits per day) monitoring program (Fig. 1a and 1c). We analyzed the NICER soft X-ray (0.3-1.1 keV) energy spectra in the early phases of the outburst and found that the spectrum was thermal (accretion disk dominated) and contained systematic residuals reminiscent of a broad absorption trough (Fig. 1d). We also obtained an XMM-Newton observation on 14 March 2021 (MJD 59287.34), roughly a month after the first NICER exposure, noting the presence of broad absorption residuals. Subsequent NICER spectra taken at various epochs of the outburst revealed that this absorption was variable throughout the outburst. A detailed photo-ionization modeling indicates that the dominant absorption feature is due to O VIII transitions in the 0.75-1.00 keV observed energy band blue-shifted with a mildly-relativistic velocity of about 30% of the speed of light. This evidence is indicative of an ultra-fast outflow (UFO) (?). See Fig. LABEL:fig:xmmresiduals, Methods section LABEL:sisec:spectral_model for a detailed discussion on X-ray spectral modeling.
2 Results
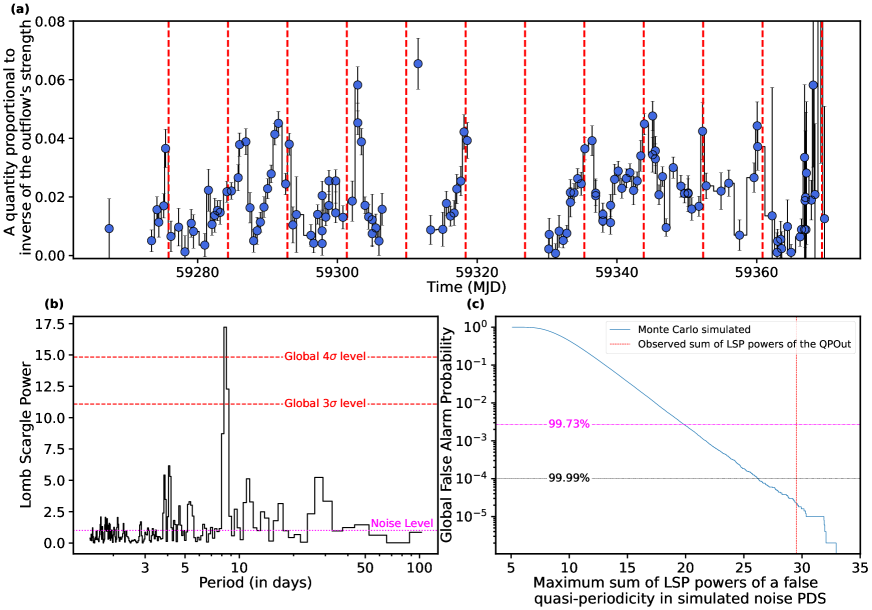
To probe the interplay between the variable outflow and the thermal continuum emission we calculated the ratio of the observed, background-subtracted count-rates in the energy band dominated by the outflow (0.75-1.00 keV) and the continuum emission (0.30-0.55 keV) (see shaded regions of Fig. 1d). This quantity, which we define as the Outflow Deficit Ratio (ODR), quantifies the amplitude of the outflow variability with respect to the continuum and it is shown in Fig. 2a. Surprisingly, the ODR curve showed repeating variations with a 8.5 day quasi-periodicity, which are not present in the unabsorbed continuum emission (SFs LABEL:fig:lcs and LABEL:fig:hid).
To quantify the variability and search for quasi-periodic signals in Fig. 2a, we computed the Lomb-Scargle Periodogram (LSP; (?, ?)) of the ODR curve (Fig. 2b). The highest power in the LSP is at days in multiple neighboring bins and is consistent with the time series in Fig. 2a. To estimate the false alarm probability that takes into account multiple bins, i.e., the chance probability of generating a signal as strong as the one observed from noise, we devised a detailed Monte Carlo method (see Fig. LABEL:fig:whitetests, Methods sections LABEL:sisec:odrtiming and LABEL:sisec:noisenature). The global false alarm probability of the observed 8.5 d quasi-periodicity is 210-5 (4.2; see Fig. 2c). Global refers to a blind search for signal over all the frequencies sampled, i.e., a day to 100 days (see Fig. 2b).
To further probe the nature of this quasi-periodicity, we extracted and fitted time-resolved NICER X-ray spectra from individual maxima and minima in the ODR curve (see Methods section LABEL:sisec:timeresolspecs, Methods section LABEL:sisec:nicercompspecs, Table LABEL:tab:_nicerxraydata, and Fig. LABEL:fig:specplots). Notably, the outflow has an order of magnitude higher column density () during the minima phases of the ODR curve with respect to the maxima: median value of 1021 cm-2 and 1021 cm-2 for the minima and the maxima, respectively. The ionization parameter, defined as log, in units of erg s-1 cm, where is the ionizing luminosity between 1 Ryd and 1000 Ryd (1 Ryd 13.6 eV), is the number density of the material, and is the distance of the gas from the central source, is on average only slightly higher during the minima than during the maxima. Instead, the outflow bulk velocity is stable at around 0.35, where is the speed of light (see Fig. LABEL:fig:specplots).
Based on the above timing analysis and the time-resolved spectral modeling, we conclude that ASASSN-20qc exhibits quasi-periodic outflows (QPOuts) about once every 8.5 days (precisely 8.30.3 days). By the term QPOuts we denote quasi-periodic variations of the outflowing material (see Fig. 2).
3 Discussion
We considered several theoretical models to interpret the above observations including a precessing inner accretion disk, clumpy or slow outflow, X-ray reflection, accretion disk instabilities, quasi-periodic eruptions, repeating partial tidal disruption event (TDE), but disfavor them based on several independent lines of arguments. See Methods section LABEL:sisec:spectral_model, LABEL:sisec:singleclump, LABEL:sisec:lateufo and Methods section LABEL:sisec:othermodels for more details and Table 1 for a summary of the strengths and the weaknesses of these various models.
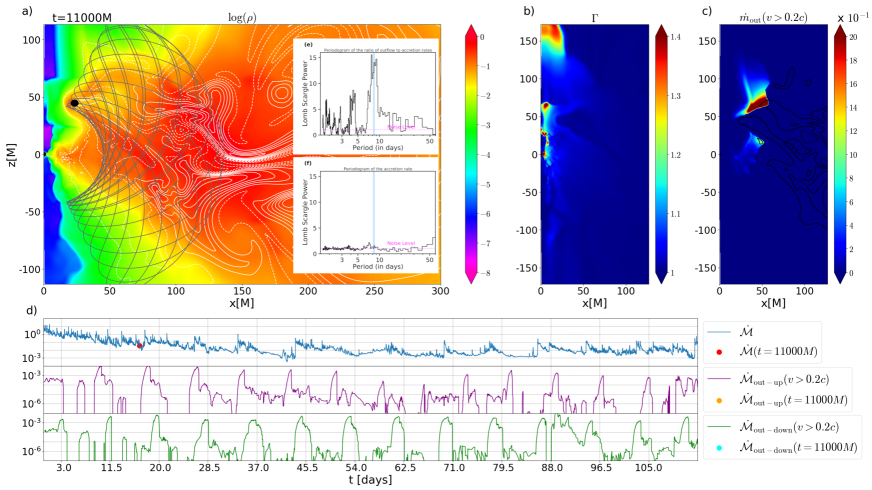
Instead, we propose a viable model with an orbiting, inclined perturber that repeatedly crosses the inner accretion flow. This scenario can explain the presence of QPOuts if the perturber is characterized by a sufficiently large influence radius at a given distance (?, ?). To further verify this model, we performed extensive 2D GRMHD simulations of an object in orbit around a SMBH using the HARMPI code (?, ?) based on the original HARM code (?, ?) (see Methods section LABEL:msec:modeldiscussion for details). Regardless of the specific setup, QPOuts are triggered by the passing perturber once per its orbit (see Fig. 3 and Table LABEL:tab:GRMHD_runs for an overview). The simulations predict a persistent magnetized outflow from the inner flow with a roughly constant radial velocity profile, which is mass-loaded periodically when the secondary crosses the primary disk. This is consistent with the observation of a persistent outflow in the maxima which is boosted during the minima of the ODR. For all the cases, the perturber is highly inclined with respect to the equatorial plane of the accretion flow, which leads to the recurrent, periodic mildly-relativistic outflow regardless of the background accretion-flow state. An ordered and stable poloidal magnetic field in the funnel region accelerates the ejected matter to mildly-relativistic velocities. Furthermore, a mildly eccentric orbit with an eccentricity of can naturally induce departures from strict periodicity which is evident from the LSP peak FWHM of day as well as from the outflow-rate temporal profiles in the bottom panels in Fig. 3. One caveat of the 2D GRMHD simulations is that while magnetorotational instability/MRI–which is responsible for accretion onto the SMBH–is active at the distance of the perturber, it decays after a few10,000 (or 100 days) in the inner regions of the accretion flow (a few gravitational radii). Thus, making direct comparisons of simulations to data beyond 100 days becomes challenging. However, since the observed QPOuts span about 100 days, our simulations with active MRI were performed on similar timescales and they show that such a scenario provides a potential mechanism for producing QPOuts. Further work using 3D GRMHD simulations where MRI does not decay with time are needed to track such systems for extended periods (see SI section LABEL:sisec:caveats for more discussion).
The observed ratio of the outflow to the inflow rate of about 20% during the ODR minima is consistent with a perturber influence radius of gravitational radii when compared to the analogous ratio derived from GRMHD simulations (see SI section LABEL:sisec:naturepert for details). Independent of the GRMHD simulations, simple analytical reasoning yields a similar estimate (see the second paragraph of SI section LABEL:sisec:naturepert). Taking into account that the ejected outflow clumps originate in the underlying flow, which can be treated as an advection-dominated accretion flow (ADAF: (?), (?)), and their sizes are comparable to , such a length-scale would be in agreement with the inferred column density of 1022 cm-2 of the spectroscopically detected UFO. Considering the tidal (Hill) length-scale of a massive perturber as well as the radius, within which the surrounding gas comoves with the perturber, we arrive at a rather broad range of the perturber masses . This broad range already includes the uncertainty in the primary SMBH mass (see SI section LABEL:sisec:naturepert for further discussion and EDFs LABEL:fig_influence_radius, LABEL:fig_Hill_syn_radius).
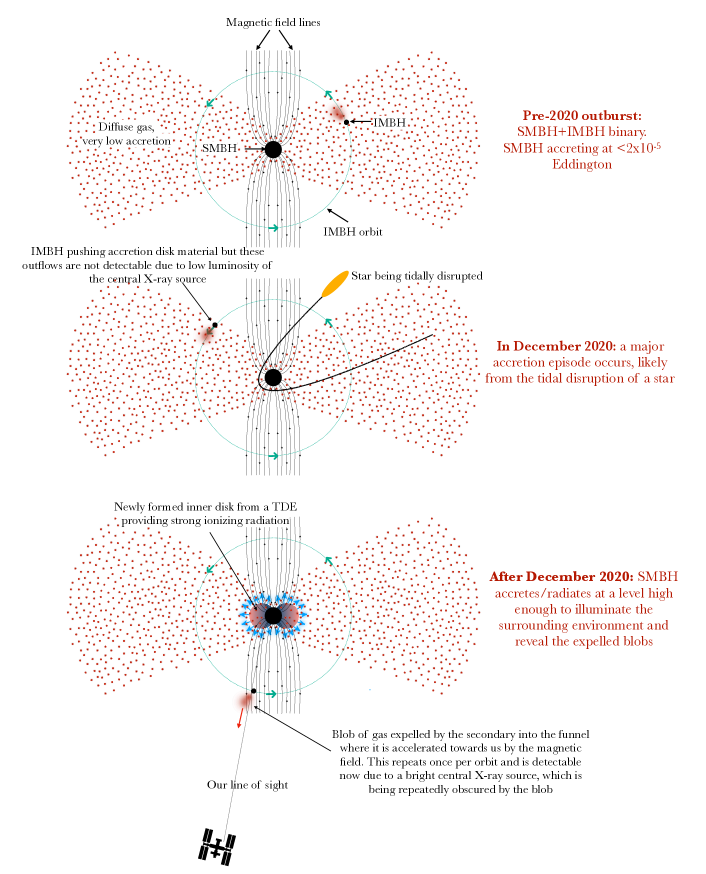
Distinct from the QPOuts, the optical light curve shown in the Fig. LABEL:fig:uvotevol exhibits a smooth rise, peak, and decay on a timescale of 150 days. This timescale is broadly consistent with the canonical fallback time of the debris from a TDE (e.g., (?)) with a black hole mass of and a solar-like star. The evolution of the optical/UV temperature and photosphere radius during the outburst is also very similar to those of known TDEs (compare the Fig. LABEL:fig:uvotevol with Figure 8 of (?) and Figure 1 of (?)). The time delay between the X-ray and the optical outbursts of a few months (see Fig. 1a) has also been seen in several TDEs (e.g., (?, ?)). Finally, the soft X-ray spectrum is also strikingly similar to thermal X-ray TDEs. Therefore, a reasonable interpretation is that the overall outburst in the optical, UV and X-rays was induced by a TDE, which produces a bright inner accretion disk, i.e., a soft X-ray source, which is quasi-periodically obscured by the blobs driven by the orbiting perturber (see Fig. 4).
Attributing the outburst to a TDE we can further constrain the mass of the secondary based on the argument that the gravitational wave inspiral time should be greater than the typical time for a stellar disruption in a galaxy. Using a TDE rate of 10-4 yr-1 (e.g., see Fig. 10 in (?)) would require the SMBH–perturber system have a merger timescale of years. This limits the perturber mass to the range of –, i.e., to the intermediate-mass black-hole (IMBH) range (see bottom panel of Fig. LABEL:fig_Hill_syn_radius). For such mass and distance of the secondary, the gravitational radiation is weak and the period of the system will not evolve significantly in the next decade, making the signal lay outside the frequency range of the upcoming space-based gravitational-wave observatory LISA. The unique combination of a SMBH-IMBH pair experiencing the TDE makes such observation rather rare, though not entirely implausible. Within the cosmological volume inside , we estimate TDEs per year in hosts with tight SMBH-IMBH pairs (out of million galaxies; see SI section LABEL:subsec_formation_channels for further discussion on the estimated event rate and the detectability of the system in gravitational waves).
In summary, our work highlights the new astrophysical phenomenon of QPOuts and the importance of high cadence optical and X-ray monitoring observations to potentially uncover electromagnetic signatures of tight binary black hole systems. The identification of such SMBH–IMBH binaries, i.e., intermediate/extreme mass ratio inspirals (I/EMRIs), has fundamental implications for multi-messenger astrophysics and for our understanding of black hole growth and evolution.
| Model/class of models | Strengths | Weaknesses | Notes |
| Inner disk precession | Thought to be commonly seen in stellar-mass black hole binaries (?) | The lack of strong continuum modulation and the observed changes from high column, high ionization parameter to low column, low ionization along with constant outflow speed and more importantly the lack of a strong quasi-periodicity in the 0.3-0.55 keV continuum variations are inconsistent with precession with all known types of outflows (?, ?, ?, ?, ?) | Disfavoured based on physical reasoning |
| Clumpy outflow | - | The outflow geometry would need to be fine tuned to have uniformly separated clumps. The probability of formation of such clumps by chance is less than 1 in 50,000 | Disfavoured due to low likelihood |
| Slow outflow | Slow outflow can, in principle, produce similar spectral signatures |
- The XMM-Newton/RGS and EPIC/pn spectrum rule out a slow outflow that can produce such a broad feature
- A typical slow outflow is distant from the SMBH and cannot produce a rapid ( week timescale) quasi-periodic variability seen here |
Disfavoured based on physical reasoning (see Methods section LABEL:sisec:noslow) |
| X-ray reflection by a corona | Seen in several highly accreting AGN with an X-ray corona (?) | Lack of a Compotonizing corona/powerlaw component in the X-ray spectrum | Disfavoured based on lack of evidence in data (see Methods section LABEL:sisec:spectral_model) |
| X-ray reflection by a disk | Argued to operate at least in one changing-look AGN (?) |
- Lack of a geometrically thick surface for reflection, would require a fine-tuned disk geometry
- Unphysically large fraction of reflected emission compared to the primary thermal emission |
Disfavoured based on statistical argument and physical grounds (see Methods section LABEL:sisec:spectral_model for more discussion) |
| Magnetically arrested accretion disk | Preliminary work by (?) suggests that outflows can be produced through repeated magnetic reconnection events |
- Based on state-of-the-art high-resolution simulations it is unclear if such outflows would be quasi-periodic in nature
- Such regular outflows are not seen in lower-resolution simulations - Lack of strong quasi-periodicity in the continuum variations |
viable but no clear indication in the state-of-the-art simulations (but see Fig. 8 of (?)) |
| Quasi-periodic eruptions (QPEs) | Seen in a small sample of AGN |
- QPEs manifest as large amplitude flux bursts as opposed to changes in ODR.
- Variable outflows have not been reported in known QPE sources. |
Disfavoured because the observed signal is distinct (see Methods section LABEL:supsec:qpemodel) |
| Repeating partial stellar tidal disruption | Argued to operate in at least 3 systems (?, ?, ?) |
- The expected orbital period would be orders of magnitude longer than what is seen here (?)
- No evidence for a similar variability in the optical light curve - A stellar core’s influence radius would be too small to produce the observed outflow |
Disfavoured based on physical reasoning |
| Stellar debris stream | Could provide obscuration when highly inclined | -Stellar debris would be tidally spread along the whole orbit, turning off the periodicity; the material would need to be continuously replenished (see partial TDE above) | Disfavoured based on physical reasoning |
| Radiation pressure driven outflows | Observed in a sample of accreting stellar-mass black holes (?) |
- The persistence of the outflow over a factor of 200 change in X-ray flux suggests negligible radiation driving
- Fine tuning of the disk properties for obtaining short-enough instability period (?) - No evidence for a similar variability in the soft X-ray continuum |
Disfavoured based on the need for fine tuning |
| A scaled-up version of quasi-periodic oscillations | Occurring in stellar-mass black-hole binaries (e.g., (?)) | The lack of a strong quasi-periodicity in the thermal continuum (0.3-0.55 keV band) | Disfavoured due to lack of a precendent |
| An orbiting object repeatedly perturbing the SMBH accretion disk |
- can explain QPOuts
- ultrafast outflow production supported by GRMHD simulations - Consistent with TDE statistics and production rates of SMBH–IMBH binaries (?) |
- An IMBH distance of makes full 3D GRMHD simulations computationally expensive
- For 2D simulations, magnetorotational instability enabling accretion tends to stop operating after sometime (within a few10,000 which corresponds to 100 days), which makes comparison with data limited at later epochs |
Viable but no precedent (see SI section LABEL:msec:modeldiscussion and LABEL:sisec:grmhdsims; see section LABEL:sisec:caveats for caveats) |