Anisotropy Scaling Functions in Heavy-Ion Collisions: Insights into the ‘Ultra-Central Flow Puzzle’ and Constraints on Transport Coefficients and Nuclear Deformation
Abstract
Anisotropy scaling functions, derived from extensive measurements of transverse momentum- and centrality-dependent anisotropy coefficients and in Pb+Pb collisions at 5.02 and 2.76 TeV, and Xe+Xe collisions at 5.44 TeV at the LHC, shed light on the ’ultra-central flow puzzle’. These functions amalgamate diverse measurements into a unified curve, elucidating anisotropy attenuation across the full and centrality range and unveiling dependencies on key factors including initial-state eccentricities (), dimensionless size (), radial flow, viscous correction to the thermal distribution function (), the medium’s stopping power (), and specific shear viscosity (). Their analysis provides distinct insights into transport coefficients and nucleus deformation constraints.
pacs:
25.75.-q, 25.75.Dw, 25.75.LdAzimuthal anisotropy measurements play a crucial role in the ongoing research aimed at determining the temperature () and baryon chemical potential () dependence of the transport coefficients of the quark gluon plasma (QGP) produced in heavy ion collisions at the Relativistic Heavy Ion Collider (RHIC) and the Large Hadron Collider (LHC). These measurements are commonly quantified as a function of collision centrality (cent) and particle transverse momentum using the complex coefficients Bilandzic et al. (2011); Luzum (2011); Teaney and Yan (2012):
| (1) |
where characterizes the magnitude of the azimuthal anisotropy of the particle spectrum in the plane transverse to the beam direction, is the event-plane and the single brackets denote an average with respect to the single-particle spectrum in a collision event.
The coefficients are related to the Fourier coefficients , which characterize the amplitude of two-particle correlations in relative azimuthal angle for particles and , forming pairs Poskanzer and Voloshin (1998); Lacey (2006):
| (2) |
where signifies possible non-flow contributions that are often mitigated with experimental cutsLacey (2006); Luzum and Ollitrault (2011); Retinskaya et al. (2012); Aad et al. (2012).
Mechanistically, the coefficients are linked to the underlying dynamics of collective flow for GeV, transitioning to jet quenching at larger . This linkage is substantiated by an extensive body of research Song et al. (2011); Alver et al. (2008, 2010a); Ollitrault et al. (2009); Dusling et al. (2010); Lacey et al. (2010); Shen et al. (2011); Niemi et al. (2013); Fu (2015); Abdallah et al. (2022); Adam et al. (2018, 2016a); Qiu and Heinz (2011); Adare et al. (2011); Magdy (2019); Adamczyk et al. (2016a, b, 2015, c); Adam et al. (2019); Gardim et al. (2015); Holopainen et al. (2011); Qin et al. (2010); Qiu and Heinz (2011); Gale et al. (2013); Burke et al. (2014); Liu and Lacey (2018); Adcox et al. (2002); Adler et al. (2002); Zhang et al. (2008); Abelev et al. (2014); Mehtar-Tani et al. (2013); Qin and Wang (2015) indicating that is influenced by factors such as radial expansion, -fluctuations, -dependent viscous attenuation, jet quenching, and the shape of the initial-state anisotropic density profile in the transverse () plane of the colliding nuclei. This shape is effectively characterized by complex eccentricity coefficients Alver et al. (2010b); Petersen et al. (2010); Lacey et al. (2011); Teaney and Yan (2011); Qiu and Heinz (2011):
| (3) |
where and are the radius and the azimuthal angle and represents the angle associated with the -order participant plane ( for and for ) Qiu and Heinz (2011); Fu (2015); Niemi et al. (2016); Noronha-Hostler et al. (2016). The deformed Woods-Saxon distribution,
| (4) | ||||
is frequently employed to model the nucleon configurations of non-spherical nuclei. Here, denotes the central nuclear density, parametrizes the nuclear radius and is the nuclear skin thickness. The spherical harmonics , along with the coefficients and encode the shape of the nucleus. Specifically, quantifies the magnitude of deformation while , varying between and , indicates the degree of asymmetry in the nucleus’s shape. The event-by-event fluctuations in the initial state density profile lead to corresponding fluctuations in .
Dynamical models based on relativistic hydrodynamics indicate an approximate linear mapping Noronha-Hostler et al. (2016); Sievert and Noronha-Hostler (2019); Rao et al. (2021), and have demonstrated success in capturing both the magnitude and trend of coefficients Qin et al. (2010); Schenke et al. (2011); Qiu and Heinz (2011); Shen et al. (2011); Bozek (2012); Gardim et al. (2012); Hirano et al. (2013). These models have also played a pivotal role in ongoing attempts to constrain the transport properties of the QGP through Bayesian inference Bernhard et al. (2016, 2019); Moreland et al. (2020); Everett et al. (2021a, b); Nijs et al. (2021); Auvinen et al. (2020); Parkkila et al. (2021). However, a significant challenge arises as these models fall short of simultaneously describing and data in ultra-central collisions (cent ) Giannini et al. (2023). Specifically, either the calculated is larger than measured, or the predicted is too small, or a combination of both inconsistencies exists.
The puzzling discrepancy in hydrodynamic models’ inability to simultaneously describe and in ultra-central collisions challenges conventional expectations. The anticipation was that these models would excel in central collisions, given the anticipated increase in charge particle multiplicities and volumes of locally thermalized domains. This incongruity introduces uncertainty, questioning whether these extensively employed models might lack essential ingredients necessary for constraining the initial state and transport coefficients.
Despite numerous dedicated efforts to solve the enigmatic “ultra-central flow puzzle” by refining initial conditions Luzum and Ollitrault (2013); Denicol et al. (2014); Shen et al. (2015); Bhalerao et al. (2015); Loizides (2016); Gelis et al. (2019); Carzon et al. (2020); Snyder et al. (2021); Zakharov (2020), investigating the influence of transport coefficients Luzum and Ollitrault (2013); Rose et al. (2014); Shen et al. (2015); Plumari et al. (2015), and exploring the role of equations of state Alba et al. (2018), a definitive solution to this puzzle has remained elusive.
This work investigates a resolution to the puzzle based on anisotropy scaling functions constructed using detailed measurements of and in collisions of and TeV Pb+Pb and TeV Xe+Xe at the LHC. The insights gained from these scaling functions suggest that a nuanced consideration of anisotropy attenuation holds promise for unraveling the puzzle. Furthermore, these functions provide distinctive constraints for transport coefficients, eccentricity spectra, and the initial-state deformation of the Xe nucleus.
In this study, we employ the concept of anisotropy scaling functions, which is based on the idea that a diverse set of measurements for and can be unified into a single curve, aptly termed the scaling function. This unification relies on the consideration of specific parameters influencing , including the initial-state eccentricities (), dimensionless size (), radial flow magnitude, the medium’s stopping power (), and its specific shear viscosity or viscosity-to-entropy ratio () Majumder et al. (2007), as well as the viscous correction to the thermal distribution function () Dusling et al. (2010).
Consequently, we can succinctly express the anisotropy coefficients driven by the flow using Eq. 5 Staig and Shuryak (2011); Gubser and Yarom (2011); Lacey et al. (2013); Liu and Lacey (2018):
| (5) |
where , Dusling et al. (2010); Liu and Lacey (2018), and is related to the mid-rapidity () charged particle multiplicity. The transition from flow coefficients to those for jet quenching at higher is achieved seamlessly by requiring a consistency between and that ensures a smooth merge of the low and high momentum regions of Dusling et al. (2010). This transition is facilitated by fixing the term in Eq. 5 to a constant value for above the cut (typically around GeV/c), which serves as the threshold distinguishing the flow-dominated and jet quenching domains.
Equation 5 reveals a crucial insight: In the domain of the most central collisions, characterized by the peak value , a scaling connection emerges. This equation links the observed values of the harmonic in these ultra-central events with those observed as at different centralities, each tied to its corresponding value:
| (6) |
where the exponential on the left-hand side of the equation accounts for the anisotropy attenuation in ultra-central collisions, and that on the right-hand side accounts for the relative attenuation at other centralities.
Moreover, when preserving a fixed centrality within a given system, a revealing correlation emerges between the values of and . These values, both subject to the same influences of radial flow, , and , adhere to the following relationship:
| (7) |
where represents a system-dependent (yet centrality-independent) normalizing constant. Equations 6 and 7 encapsulate the intricate dependencies of the high and low anisotropy coefficients from ultra-central to peripheral collisions, underlining that the scaled values of and measurements can be effectively collapsed onto a single curve or scaling function . Therefore, the identification of such scaling functions would furnish compelling evidence for the coherence of the scaling coefficients and the trustworthiness of the corresponding eccentricity spectrum and its ratios.
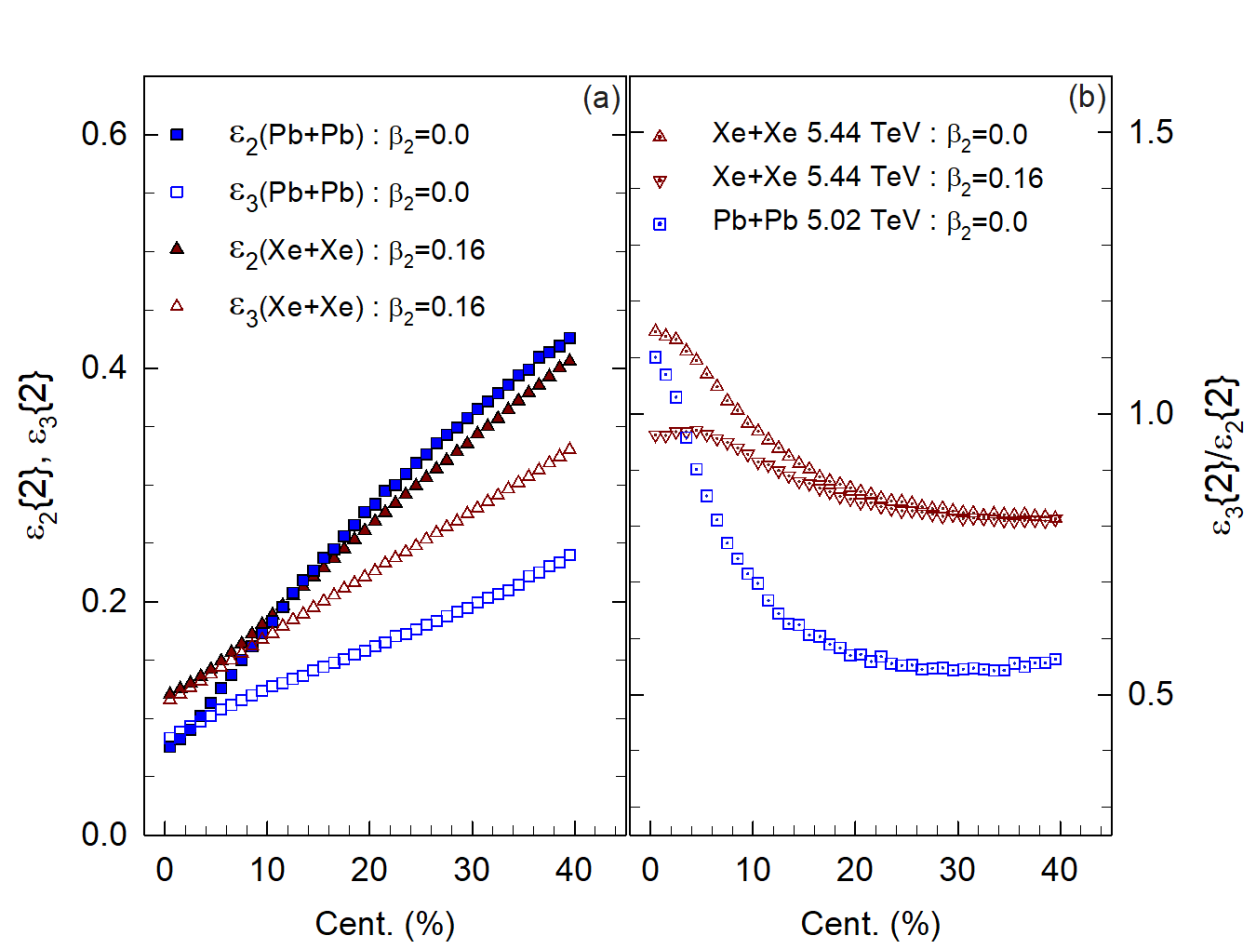
The eccentricity ratio is of paramount importance due to its nuanced dependence on centrality and deformation, as depicted in Fig. 1. This figure presents the calculated values of , , and their ratio for both Pb+Pb and Xe+Xe collisions at energies of 5.02 TeV and 5.44 TeV, revealing distinctive dependencies. These dependencies not only constrain the respective eccentricity spectrum but also provide insights into the initial-state deformation of the Xe nucleus, underscoring the critical role of central collisions in quantifying this deformation.
The data utilized in this study are sourced from the ATLAS Aad et al. (2012); Aaboud et al. (2018) and ALICE Acharya et al. (2018b, a) collaborations, encompassing and measurements for Pb+Pb collisions at and TeV, as well as Xe+Xe collisions at TeV. The required centrality-dependent values were derived from corresponding multiplicity density measurements Aamodt et al. (2011); Adam et al. (2016b); Acharya et al. (2019); Sirunyan et al. (2019). We adopted the previously established value (GeV/c)-2 Liu and Lacey (2018) to compute . The eccentricities were computed according to the procedure outlined in Eq. 3, with the assistance of a Monte Carlo quark-Glauber model (MC-qGlauber) featuring fluctuating initial conditions Liu and Lacey (2018). This model, based on the widely used MC-Glauber model Miller et al. (2007); Alver et al. (2007), accounts for the finite size of the nucleon, the nucleon’s wounding profile, the distribution of quarks within the nucleon, and quark cross sections that accurately reproduce the NN inelastic cross section for the corresponding beam energies. Calculations were performed for spherical Pb nuclei and Xe nuclei with varying degrees of initial-state deformation characterized by and several different values for the parameter (cf. Eq. 4). A systematic uncertainty of 2-3% was estimated for the eccentricities based on variations in the model parameters.
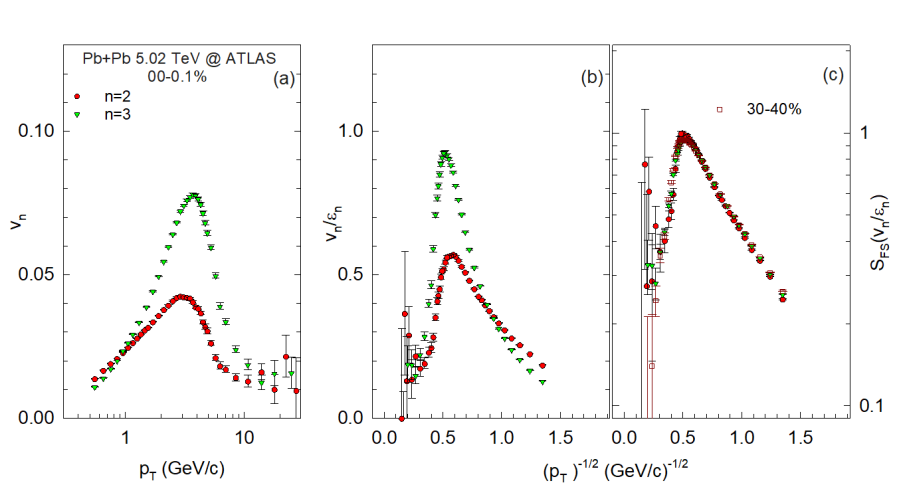
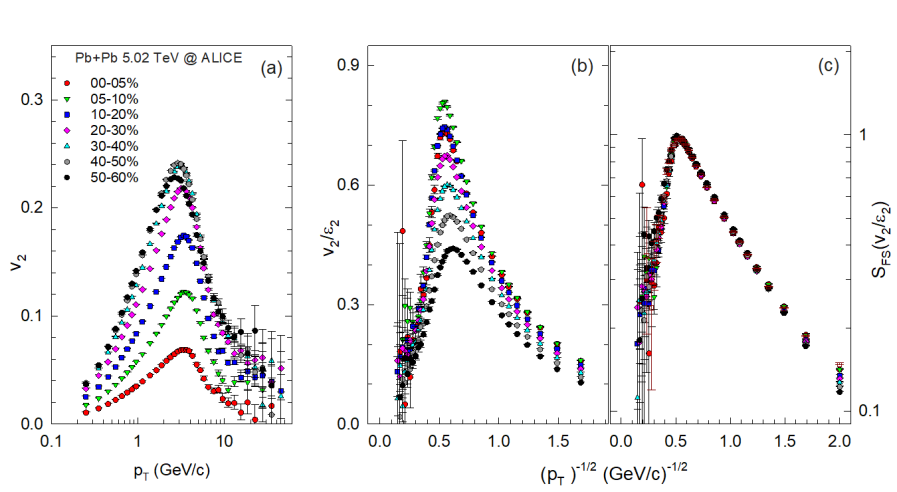
Scaling functions were derived from differential measurements of and for Pb+Pb collisions at 2.76 and 5.02 TeV, as well as Xe+Xe collisions at 5.44 TeV, employing Eqs. 6 and 7. The value for ultra-central Pb+Pb collisions at 5.02 TeV served as the reference. Figure 2 demonstrates the scaling procedure for 0.1% central Pb+Pb collisions at 5.02 TeV, utilizing for the x-axis in panels (b) and (c) to accentuate the flow- and jet-quenching-dominated domains. Panel (a) underscores the disparity between the values of and , while panel (b) indicates that eccentricity scaling ( and ) alone fails to account for their difference. Panel (c) presents the resulting scaling function, demonstrating data convergence onto a single curve for both domains, providing robust evidence for the consistency of the scaling coefficients and the validity of the corresponding eccentricity spectrum and its ratios. Validation of the scaling function spanned the entire measurement range (0.0-0.1% to 50-60%) for and , as demonstrated in Figure 3 for the measurements. The attenuation factor for the 0-5% centrality cut reflects an average that incorporates values from both ultra-central and non-ultra-central collisions, given that this selection encompasses contributions from both. Similarly, a robust scaling function, nearly identical to that for Pb+Pb collisions at 5.02 TeV, was obtained across the full range of measurements for Pb+Pb collisions at 2.76 TeV, with and , suggesting an approximate 5% relative decrease in when the collision energy is reduced from to TeV.
The observed scaling function, which spans both domains for flow and jet-quenching with identical scaling coefficients, lends further support to the conjecture proposed by Majumder et al. Majumder et al. (2007) that and are related. This scaling behavior, particularly the dependence of high anisotropy on the dimensionless size , confirms their reliance on path length and suggests a significant role of radiative energy loss in driving these jet-quenching-induced anisotropy coefficients. Additionally, the observation of a seamless transition between low and high momentum regions of at the threshold distinguishing the flow and jet-quenching domains provides a crucial constraint for the relative magnitude of and Dusling et al. (2010). This magnitude difference serves as a vital parameter for distinguishing between a strongly-coupled and weakly-coupled quark-gluon plasma Majumder et al. (2007). A rudimentary estimate, following the formalism for in Ref. Dusling et al. (2010) and by requiring consistency between and to ensure a smooth merge of the low and high momentum regions of , indicates , suggesting a strongly coupled plasma.
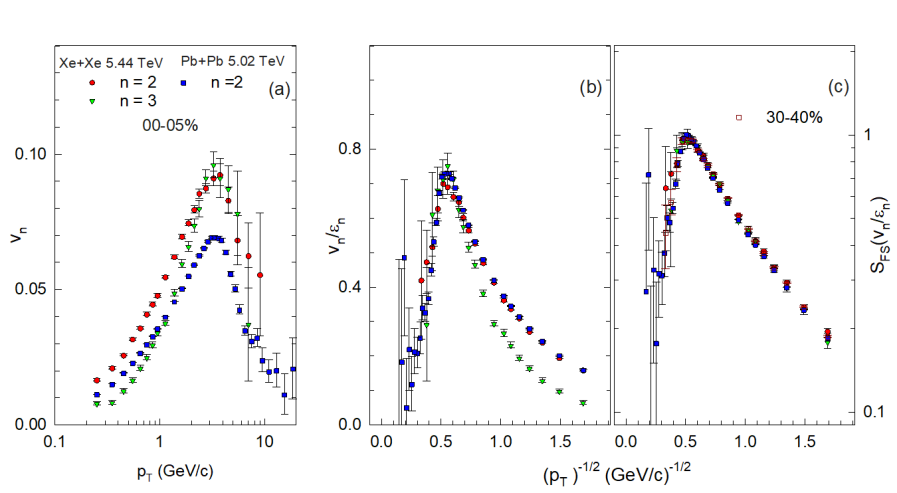
The scaling function provides unique insights into nuclear deformation, as previously illustrated in Fig. 1 and summarized in Fig. 4. In the latter figure, we compare the and results for Xe+Xe collisions with the results for Pb+Pb collisions for the 0-5% centrality cut, utilizing the eccentricities for the deformed Xe nucleus ( Tsukada et al. (2017)). Panel (a) highlights a significant difference between and for Xe+Xe collisions, reflecting the expected variation in viscous attenuation for the two harmonics. These values exhibit notably larger magnitudes than those of for Pb+Pb collisions, consistent with the larger eccentricities determined for Xe+Xe collisions (cf. Fig. 1). Panel (b) shows that while eccentricity scaling cannot fully account for the - difference in panel (a), it effectively explains the considerable difference between the data for Xe and Pb in the same panel. Panel (c) presents the resulting scaling function, revealing data collapse onto a single curve for both flow- and jet-quenching-dominated domains, providing compelling evidence for the coherence of the scaling coefficients and the reliability of the corresponding eccentricity spectrum for the deformed Xe nucleus. The validation of the scaling function extends across the full range of centrality measurements (0-5% to 40-50%) for , , . Larger or smaller values of result in less robust scaling functions, indicating deformed Xe nuclei and only an approximate 2% relative increase in when the beam energy is raised from 5.02 TeV to 5.44 TeV. Further detailed comparisons with Pb+Pb collisions at various centralities suggest slightly larger relative radial flow in 5.02 TeV Pb+Pb collisions than in 5.44 TeV Xe+Xe collisions. Notably, the utilization of scaling functions for studying nuclear deformation offers a significant advantage by (i) reliably accounting for the anisotropy attenuation in central collisions and (ii) relying on the measurement of and in identical events within the same system. This approach leads to substantial reductions in systematic uncertainties from various sources.
In summary, anisotropy scaling functions, derived from extensive measurements of and in Pb+Pb collisions at 5.02 and 2.76 TeV, and Xe+Xe collisions at 5.44 TeV, provide crucial insights into the ’ultra-central flow puzzle’ and constrain transport coefficients, the eccentricity spectrum, and nucleus deformation. Consolidating diverse measurements into a single curve, these functions account for specific parameters influencing , including initial-state eccentricities (), dimensionless size (), radial flow magnitude, the medium’s stopping power (), and its specific shear viscosity (), as well as the viscous correction to the thermal distribution function (). They yield distinct constraints for transport coefficients and nucleus deformation.
Acknowledgement
This research is supported by the US DOE under contract DE-FG02-87ER40331.A008.
References
- Bilandzic et al. (2011) A. Bilandzic, R. Snellings, and S. Voloshin, Phys. Rev. C83, 044913 (2011), arXiv:1010.0233 [nucl-ex] .
- Luzum (2011) M. Luzum, J. Phys. G38, 124026 (2011), arXiv:1107.0592 [nucl-th] .
- Teaney and Yan (2012) D. Teaney and L. Yan, Phys. Rev. C86, 044908 (2012), arXiv:1206.1905 [nucl-th] .
- Poskanzer and Voloshin (1998) A. M. Poskanzer and S. A. Voloshin, Phys. Rev. C58, 1671 (1998), arXiv:nucl-ex/9805001 [nucl-ex] .
- Lacey (2006) R. A. Lacey, Proceedings, 18th International Conference on Ultra-Relativistic Nucleus-Nucleus Collisions (Quark Matter 2005): Budapest, Hungary, August 4-9, 2005, Nucl. Phys. A774, 199 (2006), arXiv:nucl-ex/0510029 [nucl-ex] .
- Luzum and Ollitrault (2011) M. Luzum and J.-Y. Ollitrault, Phys. Rev. Lett. 106, 102301 (2011), arXiv:1011.6361 [nucl-ex] .
- Retinskaya et al. (2012) E. Retinskaya, M. Luzum, and J.-Y. Ollitrault, Phys. Rev. Lett. 108, 252302 (2012), arXiv:1203.0931 [nucl-th] .
- Aad et al. (2012) G. Aad et al. (ATLAS), Phys. Rev. C86, 014907 (2012), arXiv:1203.3087 [hep-ex] .
- Song et al. (2011) H. Song, S. A. Bass, U. Heinz, T. Hirano, and C. Shen, Phys. Rev. Lett. 106, 192301 (2011), [Erratum: Phys. Rev. Lett.109,139904(2012)], arXiv:1011.2783 [nucl-th] .
- Alver et al. (2008) B. Alver et al. (PHOBOS), Phys. Rev. C77, 014906 (2008), arXiv:0711.3724 [nucl-ex] .
- Alver et al. (2010a) B. Alver et al. (PHOBOS), Phys. Rev. C81, 034915 (2010a), arXiv:1002.0534 [nucl-ex] .
- Ollitrault et al. (2009) J.-Y. Ollitrault, A. M. Poskanzer, and S. A. Voloshin, Phys. Rev. C 80, 014904 (2009), arXiv:0904.2315 [nucl-ex] .
- Dusling et al. (2010) K. Dusling, G. D. Moore, and D. Teaney, Phys.Rev. C81, 034907 (2010), arXiv:0909.0754 [nucl-th] .
- Lacey et al. (2010) R. A. Lacey, A. Taranenko, R. Wei, N. Ajitanand, J. Alexander, et al., Phys.Rev. C82, 034910 (2010), arXiv:1005.4979 [nucl-ex] .
- Shen et al. (2011) C. Shen, U. Heinz, P. Huovinen, and H. Song, Phys. Rev. C 84, 044903 (2011), arXiv:1105.3226 [nucl-th] .
- Niemi et al. (2013) H. Niemi, G. S. Denicol, H. Holopainen, and P. Huovinen, Phys. Rev. C87, 054901 (2013), arXiv:1212.1008 [nucl-th] .
- Fu (2015) J. Fu, Phys. Rev. C92, 024904 (2015).
- Abdallah et al. (2022) M. Abdallah et al. (STAR), Phys. Rev. Lett. 129, 252301 (2022), arXiv:2201.10365 [nucl-ex] .
- Adam et al. (2018) J. Adam et al. (STAR), Phys. Lett. B783, 459 (2018), arXiv:1803.03876 [nucl-ex] .
- Adam et al. (2016a) J. Adam et al. (ALICE), Phys. Rev. Lett. 117, 182301 (2016a), arXiv:1604.07663 [nucl-ex] .
- Qiu and Heinz (2011) Z. Qiu and U. W. Heinz, Phys. Rev. C 84, 024911 (2011), arXiv:1104.0650 [nucl-th] .
- Adare et al. (2011) A. Adare et al. (PHENIX), Phys. Rev. Lett. 107, 252301 (2011), arXiv:1105.3928 [nucl-ex] .
- Magdy (2019) N. Magdy (STAR), Proceedings, 27th International Conference on Ultrarelativistic Nucleus-Nucleus Collisions (Quark Matter 2018): Venice, Italy, May 14-19, 2018, Nucl. Phys. A982, 255 (2019), arXiv:1807.07638 [nucl-ex] .
- Adamczyk et al. (2016a) L. Adamczyk et al. (STAR), Phys. Rev. C 94, 034908 (2016a), arXiv:1601.07052 [nucl-ex] .
- Adamczyk et al. (2016b) L. Adamczyk et al. (STAR), Phys. Rev. C 93, 014907 (2016b), arXiv:1509.08397 [nucl-ex] .
- Adamczyk et al. (2015) L. Adamczyk et al. (STAR), Phys. Rev. Lett. 115, 222301 (2015).
- Adamczyk et al. (2016c) L. Adamczyk et al. (STAR), Phys. Rev. Lett. 116, 112302 (2016c), arXiv:1601.01999 [nucl-ex] .
- Adam et al. (2019) J. Adam et al. (STAR), Phys. Rev. Lett. 122, 172301 (2019), arXiv:1901.08155 [nucl-ex] .
- Gardim et al. (2015) F. G. Gardim, J. Noronha-Hostler, M. Luzum, and F. Grassi, Phys. Rev. C91, 034902 (2015), arXiv:1411.2574 [nucl-th] .
- Holopainen et al. (2011) H. Holopainen, H. Niemi, and K. J. Eskola, Phys. Rev. C83, 034901 (2011), arXiv:1007.0368 [hep-ph] .
- Qin et al. (2010) G.-Y. Qin, H. Petersen, S. A. Bass, and B. Muller, Phys. Rev. C 82, 064903 (2010), arXiv:1009.1847 [nucl-th] .
- Gale et al. (2013) C. Gale, S. Jeon, B. Schenke, P. Tribedy, and R. Venugopalan, Phys. Rev. Lett. 110, 012302 (2013), arXiv:1209.6330 [nucl-th] .
- Burke et al. (2014) K. M. Burke et al. (JET), Phys. Rev. C 90, 014909 (2014), arXiv:1312.5003 [nucl-th] .
- Liu and Lacey (2018) P. Liu and R. A. Lacey, Phys. Rev. C 98, 021902 (2018), arXiv:1802.06595 [nucl-ex] .
- Adcox et al. (2002) K. Adcox et al. (PHENIX), Phys. Rev. Lett. 88, 022301 (2002), arXiv:nucl-ex/0109003 .
- Adler et al. (2002) C. Adler et al. (STAR), Phys. Rev. Lett. 89, 202301 (2002), arXiv:nucl-ex/0206011 .
- Zhang et al. (2008) H.-z. Zhang, J. F. Owens, E. Wang, and X. N. Wang, J. Phys. G 35, 104067 (2008), arXiv:0804.2381 [hep-ph] .
- Abelev et al. (2014) B. Abelev et al. (ALICE), JHEP 03, 013 (2014), arXiv:1311.0633 [nucl-ex] .
- Mehtar-Tani et al. (2013) Y. Mehtar-Tani, J. G. Milhano, and K. Tywoniuk, Int. J. Mod. Phys. A 28, 1340013 (2013), arXiv:1302.2579 [hep-ph] .
- Qin and Wang (2015) G.-Y. Qin and X.-N. Wang, Int. J. Mod. Phys. E 24, 1530014 (2015), arXiv:1511.00790 [hep-ph] .
- Alver et al. (2010b) B. H. Alver, C. Gombeaud, M. Luzum, and J.-Y. Ollitrault, Phys. Rev. C82, 034913 (2010b), arXiv:1007.5469 [nucl-th] .
- Petersen et al. (2010) H. Petersen, G.-Y. Qin, S. A. Bass, and B. Muller, Phys. Rev. C82, 041901 (2010), arXiv:1008.0625 [nucl-th] .
- Lacey et al. (2011) R. A. Lacey, R. Wei, N. N. Ajitanand, and A. Taranenko, Phys. Rev. C83, 044902 (2011), arXiv:1009.5230 [nucl-ex] .
- Teaney and Yan (2011) D. Teaney and L. Yan, Phys. Rev. C83, 064904 (2011), arXiv:1010.1876 [nucl-th] .
- Niemi et al. (2016) H. Niemi, K. J. Eskola, and R. Paatelainen, Phys. Rev. C 93, 024907 (2016), arXiv:1505.02677 [hep-ph] .
- Noronha-Hostler et al. (2016) J. Noronha-Hostler, L. Yan, F. G. Gardim, and J.-Y. Ollitrault, Phys. Rev. C 93, 014909 (2016), arXiv:1511.03896 [nucl-th] .
- Sievert and Noronha-Hostler (2019) M. D. Sievert and J. Noronha-Hostler, Phys. Rev. C 100, 024904 (2019), arXiv:1901.01319 [nucl-th] .
- Rao et al. (2021) S. Rao, M. Sievert, and J. Noronha-Hostler, Phys. Rev. C 103, 034910 (2021), arXiv:1910.03677 [nucl-th] .
- Schenke et al. (2011) B. Schenke, S. Jeon, and C. Gale, Phys. Lett. B 702, 59 (2011), arXiv:1102.0575 [hep-ph] .
- Bozek (2012) P. Bozek, Phys. Rev. C 85, 034901 (2012), arXiv:1110.6742 [nucl-th] .
- Gardim et al. (2012) F. G. Gardim, F. Grassi, M. Luzum, and J.-Y. Ollitrault, Phys. Rev. Lett. 109, 202302 (2012), arXiv:1203.2882 [nucl-th] .
- Hirano et al. (2013) T. Hirano, P. Huovinen, K. Murase, and Y. Nara, Prog. Part. Nucl. Phys. 70, 108 (2013), arXiv:1204.5814 [nucl-th] .
- Bernhard et al. (2016) J. E. Bernhard, J. S. Moreland, S. A. Bass, J. Liu, and U. Heinz, Phys. Rev. C 94, 024907 (2016), arXiv:1605.03954 [nucl-th] .
- Bernhard et al. (2019) J. E. Bernhard, J. S. Moreland, and S. A. Bass, Nature Phys. 15, 1113 (2019).
- Moreland et al. (2020) J. S. Moreland, J. E. Bernhard, and S. A. Bass, Phys. Rev. C 101, 024911 (2020), arXiv:1808.02106 [nucl-th] .
- Everett et al. (2021a) D. Everett et al. (JETSCAPE), Phys. Rev. Lett. 126, 242301 (2021a), arXiv:2010.03928 [hep-ph] .
- Everett et al. (2021b) D. Everett et al. (JETSCAPE), Phys. Rev. C 103, 054904 (2021b), arXiv:2011.01430 [hep-ph] .
- Nijs et al. (2021) G. Nijs, W. van der Schee, U. Gürsoy, and R. Snellings, Phys. Rev. C 103, 054909 (2021), arXiv:2010.15134 [nucl-th] .
- Auvinen et al. (2020) J. Auvinen, K. J. Eskola, P. Huovinen, H. Niemi, R. Paatelainen, and P. Petreczky, Phys. Rev. C 102, 044911 (2020), arXiv:2006.12499 [nucl-th] .
- Parkkila et al. (2021) J. E. Parkkila, A. Onnerstad, and D. J. Kim, Phys. Rev. C 104, 054904 (2021), arXiv:2106.05019 [hep-ph] .
- Giannini et al. (2023) A. V. Giannini, M. N. Ferreira, M. Hippert, D. D. Chinellato, G. S. Denicol, M. Luzum, J. Noronha, T. Nunes da Silva, and J. Takahashi (ExTrEMe), Phys. Rev. C 107, 044907 (2023), arXiv:2203.17011 [nucl-th] .
- Luzum and Ollitrault (2013) M. Luzum and J.-Y. Ollitrault, Nucl. Phys. A 904-905, 377c (2013), arXiv:1210.6010 [nucl-th] .
- Denicol et al. (2014) G. S. Denicol, C. Gale, S. Jeon, J. F. Paquet, and B. Schenke, (2014), arXiv:1406.7792 [nucl-th] .
- Shen et al. (2015) C. Shen, Z. Qiu, and U. Heinz, Phys. Rev. C 92, 014901 (2015), arXiv:1502.04636 [nucl-th] .
- Bhalerao et al. (2015) R. S. Bhalerao, A. Jaiswal, and S. Pal, Phys. Rev. C 92, 014903 (2015), arXiv:1503.03862 [nucl-th] .
- Loizides (2016) C. Loizides, Phys. Rev. C 94, 024914 (2016), arXiv:1603.07375 [nucl-ex] .
- Gelis et al. (2019) F. Gelis, G. Giacalone, P. Guerrero-Rodríguez, C. Marquet, and J.-Y. Ollitrault, (2019), arXiv:1907.10948 [nucl-th] .
- Carzon et al. (2020) P. Carzon, S. Rao, M. Luzum, M. Sievert, and J. Noronha-Hostler, Phys. Rev. C 102, 054905 (2020), arXiv:2007.00780 [nucl-th] .
- Snyder et al. (2021) R. Snyder, M. Byres, S. H. Lim, and J. L. Nagle, Phys. Rev. C 103, 024906 (2021), arXiv:2008.08729 [nucl-th] .
- Zakharov (2020) B. G. Zakharov, JETP Lett. 112, 393 (2020), arXiv:2008.07304 [nucl-th] .
- Rose et al. (2014) J.-B. Rose, J.-F. Paquet, G. S. Denicol, M. Luzum, B. Schenke, S. Jeon, and C. Gale, Nucl. Phys. A 931, 926 (2014), arXiv:1408.0024 [nucl-th] .
- Plumari et al. (2015) S. Plumari, G. L. Guardo, F. Scardina, and V. Greco, Phys. Rev. C 92, 054902 (2015), arXiv:1507.05540 [hep-ph] .
- Alba et al. (2018) P. Alba, V. Mantovani Sarti, J. Noronha, J. Noronha-Hostler, P. Parotto, I. Portillo Vazquez, and C. Ratti, Phys. Rev. C 98, 034909 (2018), arXiv:1711.05207 [nucl-th] .
- Majumder et al. (2007) A. Majumder, B. Muller, and X.-N. Wang, Phys. Rev. Lett. 99, 192301 (2007), arXiv:hep-ph/0703082 .
- Staig and Shuryak (2011) P. Staig and E. Shuryak, Phys. Rev. C84, 034908 (2011), arXiv:1008.3139 [nucl-th] .
- Gubser and Yarom (2011) S. S. Gubser and A. Yarom, Nucl. Phys. B 846, 469 (2011), arXiv:1012.1314 [hep-th] .
- Lacey et al. (2013) R. A. Lacey, Y. Gu, X. Gong, D. Reynolds, N. N. Ajitanand, J. M. Alexander, A. Mwai, and A. Taranenko, (2013), arXiv:1301.0165 [nucl-ex] .
- Aaboud et al. (2018) M. Aaboud et al. (ATLAS), Eur. Phys. J. C 78, 997 (2018), arXiv:1808.03951 [nucl-ex] .
- Acharya et al. (2018a) S. Acharya et al. (ALICE), JHEP 07, 103 (2018a), arXiv:1804.02944 [nucl-ex] .
- Acharya et al. (2018b) S. Acharya et al. (ALICE), Phys. Lett. B 784, 82 (2018b), arXiv:1805.01832 [nucl-ex] .
- Aamodt et al. (2011) K. Aamodt et al. (ALICE), Phys. Rev. Lett. 106, 032301 (2011), arXiv:1012.1657 [nucl-ex] .
- Adam et al. (2016b) J. Adam et al. (ALICE), Phys. Rev. Lett. 116, 222302 (2016b), arXiv:1512.06104 [nucl-ex] .
- Acharya et al. (2019) S. Acharya et al. (ALICE), Phys. Lett. B 790, 35 (2019), arXiv:1805.04432 [nucl-ex] .
- Sirunyan et al. (2019) A. M. Sirunyan et al. (CMS), Phys. Lett. B 799, 135049 (2019), arXiv:1902.03603 [hep-ex] .
- Miller et al. (2007) M. L. Miller, K. Reygers, S. J. Sanders, and P. Steinberg, Ann. Rev. Nucl. Part. Sci. 57, 205 (2007), arXiv:nucl-ex/0701025 .
- Alver et al. (2007) B. Alver et al. (PHOBOS), Phys. Rev. Lett. 98, 242302 (2007), arXiv:nucl-ex/0610037 .
- Tsukada et al. (2017) K. Tsukada et al., Phys. Rev. Lett. 118, 262501 (2017), arXiv:1703.04278 [nucl-ex] .