Current address: ]Elettra - Sincrotrone Trieste S.C.p.A., Strada Statale 14 - km 163.5 in AREA Science Park, 34149 Basovizza, Trieste, Italy
Local work-function manipulation by external optical stimulation
Abstract
Strongly differing static dipole moments of the trans and cis isomers of photochromic azobenzene allow for optical switching of the work function of azobenzene-functionalized self-assembled monolayers (SAMs). We apply these properties in a fundamental experiment to manipulate the area size of the switched SAM. Azobenzene molecules were excited by ultraviolet laser illumination and the transient isomerization profile of the SAM was spatially resolved recording photoemission electron microscopy images. Thereby we demonstrate the spatial tuning of the SAM’s work function and discuss the role of the laser spot profile in generating sharp edges or gradual changes of the work function.
Azobenzene-based self-assembled monolayers (SAMs) are prototype systems for photoresponsive surfaces. Steen, Duijnstee, and Browne (2023); Ichimura, Oh, and Nakagawa (2000); Crivillers et al. (2011a); Ah Qune et al. (2008); Crivillers et al. (2011b, 2013); Nagahiro et al. (2009) Their photochromic switching ability can, e.g., be used to tune level alignments at interfaces.Ah Qune et al. (2008); Crivillers et al. (2011b, 2013); Nagahiro et al. (2009) Here we discuss local changes of the SAM’s work function induced by altering the static dipole moment of the chromophores with controlled photoisomerization. Azobenzene is a conformational switch, consisting of two phenyl rings coupled via a dinitrogen bond (see inset in Fig. 1). In its trans form the molecule is planar and the two rings are on opposite sides of the dinitrogen bond axis. In the cis conformation, both rings are on the same side of the reference plane. Therefore, the molecule has no static dipole moment in the trans configuration, but is strongly polar in its cis state.Hartley and Le Fevre (1939) Dissolved in solution, light in the blue to ultraviolet (UV) range triggers photoswitching between the two isomers.Bandara and Burdette (2012) For fabricating photoresponsive surfaces we linked azobenzene to Au(111)/Mica substrates via an alkanethiol chain following an elaborated procedure.Freyer et al. (2009); Klajn (2010); Gahl et al. (2010); Moldt et al. (2015, 2016) Utilizing a linker with a chain length of 11 carbon atoms, the azobenzene head groups are sufficiently decoupled from the surface (see Fig. 1 insets). We will denominate the azobenzene derivative 11-(4-(phenyldiazenyl)phenoxy)-undecane-1-thiol used in this work as Az11. It is essential to dilute the chromophore density to prevent steric hindrance.Gahl et al. (2010); Heinemann et al. (2012) We observed efficient photoswitching in mixed SAMs of Az11 and a pure alkanethiolate of comparable length (C12) prepared in a wet-chemical process.Moldt et al. (2015) In this work we used samples with \qty50 Az11 surface coverage.Moldt et al. (2015)
Near edge X-ray absorption fine structure (NEXAFS) spectroscopy showed that in a pure Az11 SAM the trans chromophores are tilted by about \qty30 from the surface plane.Gahl et al. (2010)
In diluted SAMs the chromophores tilt further towards the SAM surface.Moldt et al. (2016)
When switching into its cis form, the molecule flips the upper phenyl ring and the -component of its static dipole moment points towards the surface. Thus the work function of the SAM/Au(111) sample increases with the number of molecules in cis configuration.Ah Qune et al. (2008); Nagahiro et al. (2009); Bronsch et al. (2017a)
This allows us to locally tune the work function and image areas of switched molecules in the SAM via spatially resolved photoelectron emission.
Although external work-function manipulations of azobenzene-functionalized surfaces have been studied by several groups Ah Qune et al. (2008); Crivillers et al. (2011b, 2013); Nagahiro et al. (2009); Stiller et al. (1999); Gustina et al. (1999); Schuster et al. (2019), so far no analysis of the switched area was performed.
Controlling homogeneity and locality of the switched area is highly relevant for future applications.
Here we use the photoemission electron microscopy (PEEM) mode of a time-of-flight momentum microscope for getting access to spatial modulations in the \unit\micro range. PEEM allows us to analyse the size and profile of switched areas. We demonstrate that the absolute value of the local work function and hence the isomerization profile as well as the time span to switch the work function can be tuned by laser illumination.

In Fig. 1 we compare the absorbance of Az11 molecules in methanol solution and the differential reflectance of mixed SAMs from Ref. Moldt et al., 2015 with the spectrum of a mercury arc lamp. In the SAM, the S2 band splits and its maximum shifts to higher energies with increasing Az11 percentage (Fig. 1, middle panel). This is attributed to excitonic coupling between the trans isomers, whereby the transition-dipole moments form an H-aggregate. Molecules switched to the cis state show no excitonic coupling.Bronsch et al. (2017b) Irradiation at the low-energy edge of the S2 absorption band at about \qty370nm leads to trans–cis isomerization in the SAM. The cis–trans back-isomerization is triggered by illumination either at the high energy edge of the S2 band or in the S1 band, showing up at around \qty440nm.Bronsch et al. (2017b)
We mainly used two complementary photon sources, a continuous wave (cw) laser (\qty372nm) and a Hg lamp for illumination in the S2 and S1 absorption bands, respectively. Simultaneous excitation facilitates optical tuning of the cis–trans ratio at the functionalized surface. The cw laser initiates the trans–cis isomerization only, whereas the Hg lamp contributes to both trans–cis and cis–trans configuration changes. As illustrated in Fig. 1, several emission lines of the mercury lamp are in the range of the S1 and S2 absorption bands of the Az11 SAM. The intense emission line at illuminates in the S1 band center, leading to efficient cis–trans isomerization. The emission line at \qty365nm instead triggers trans–cis switching. Considering the relative photon flux of both emission lines we estimated the photostationary state (PSS) of the mercury lamp (Hg-PSS) as discussed in detail in the supplementary material (SM, Sec. II). We find photon fluxes of cm-2 and cm-2 leading to a PSS with \qty67 cis molecules. Starting from this PSS, a maximal work-function change of \qty30meV can be reached when tuning towards a pure cis SAM by simultaneous laser illumination at \qty372nm.Bronsch et al. (2017b)
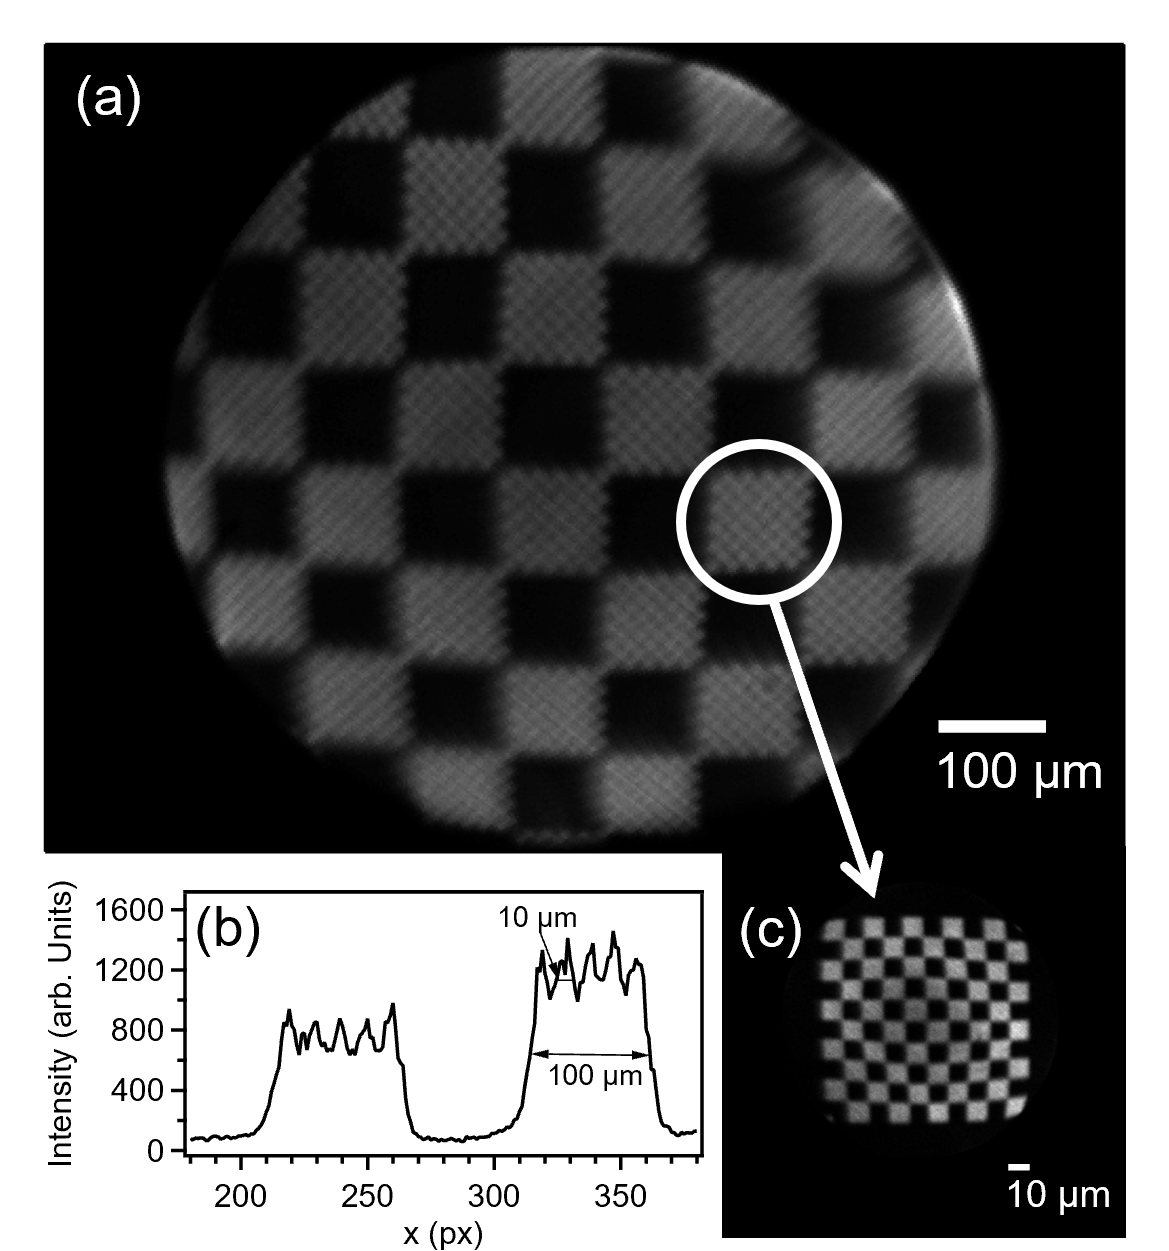
The high-energetic lines of the mercury lamp lead to photoelectron emission from the functionalized surface.Bronsch et al. (2017a, b) We perform spatially-resolved photoemission experiments in an ultra-high vacuum chamber using a momentum microscope.Schönhense, Medjanik, and Elmers (2015); Schönhense and Elmers (2022) The instrument has been set up in collaboration with G. Schönhense. In this work we use the instrument’s spatially resolving "Gaussian" imaging mode comparable to a photoelectron emission microscope.Schönhense, Medjanik, and Elmers (2015) The field of view (FoV) on the sample surface is selected by real space apertures inserted between two zoom optics. Photoelectrons are detected after a time-of-flight tube by a delay line detector.Oelsner et al. (2010) A mm2 chess-patterned gold-on-silicon sample (Chessy, Plano) was characterized for initial alignment and calibration of the focusing and magnifying electron optics, exploiting the instrumental resolution. Figure 2 shows spatially-resolved electron images of the \qty\micro2 chess patterns. With a FoV of \qty100 and \qty800\micro diameter, we obtained spatial resolutions below \qty3 and \qty16\micro, respectively (see SM, Sec. V). Since the measurements on the Az11 SAMs required a large FoV, we used the latter settings which still provide appropriate spatial resolution.
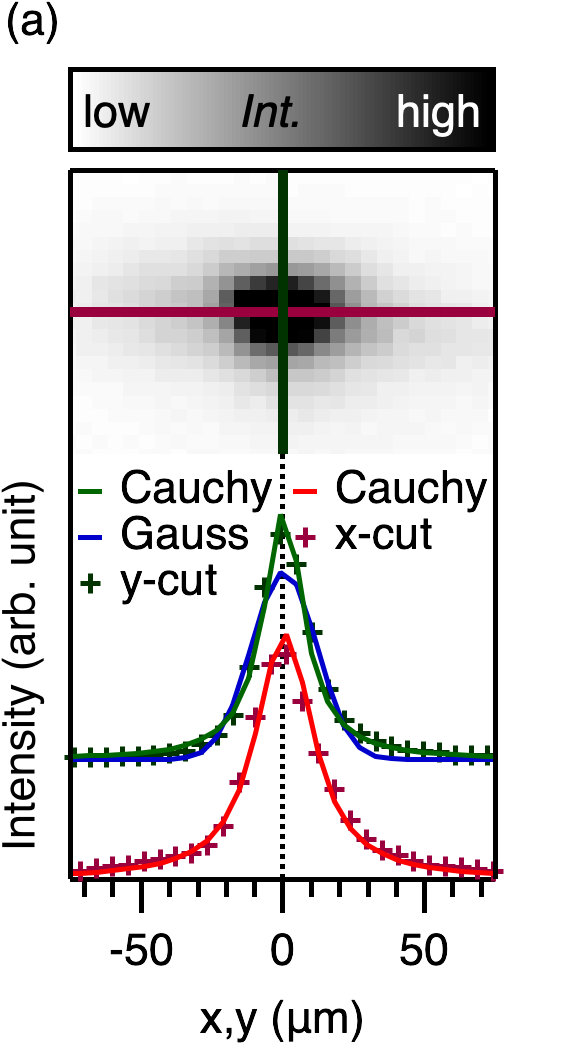
Trans–cis isomerization of the SAM in a selected area was triggered focusing the \qty372nm laser beam onto the sample. An image of the laser spot recorded with a CCD camera is shown in Fig. 3a together with horizontal () and vertical () beam profiles taken across the spot center. The focus has an elliptical profile with full width at half maximum (FWHM) of and . Beam profiles were modeled using 2D Gaussian and Cauchy distributions. The latter accounts particularly better for the projection of the laser spot along the direction of incidence .
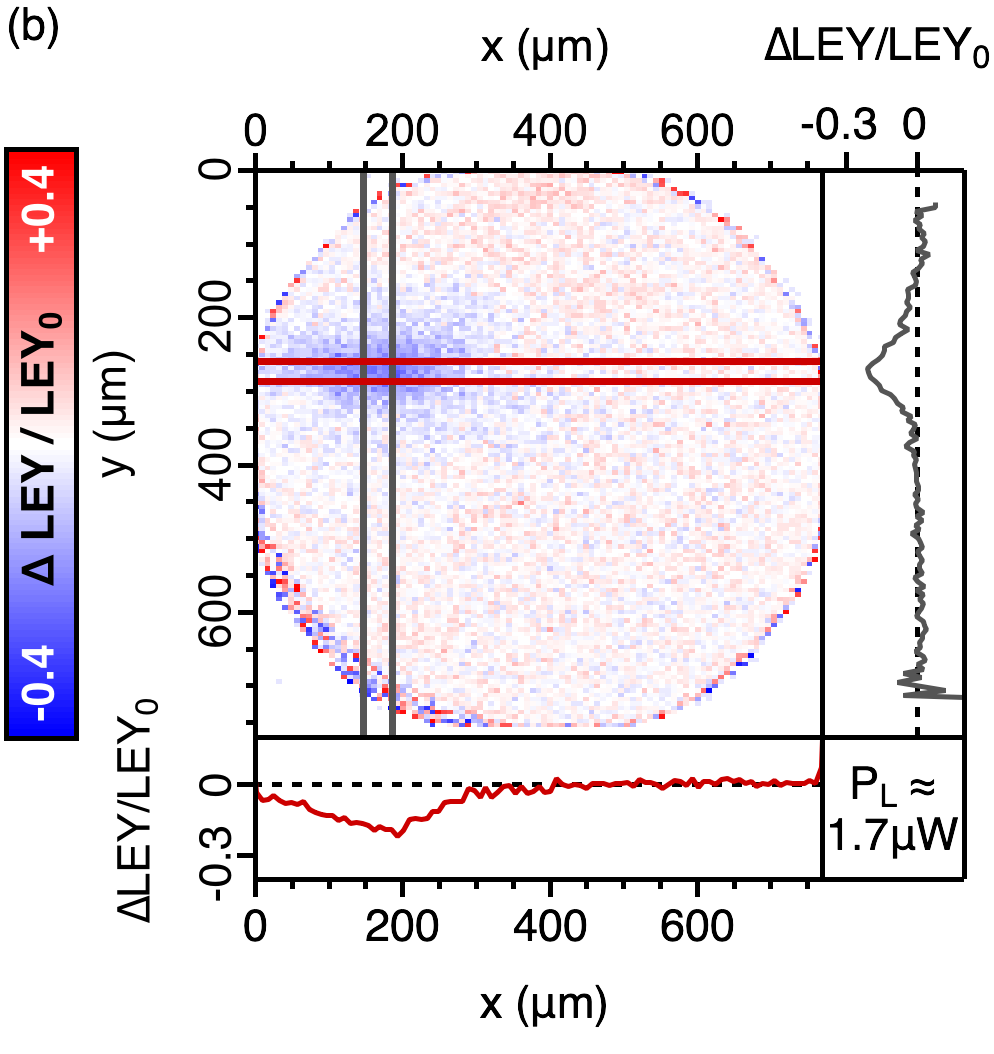
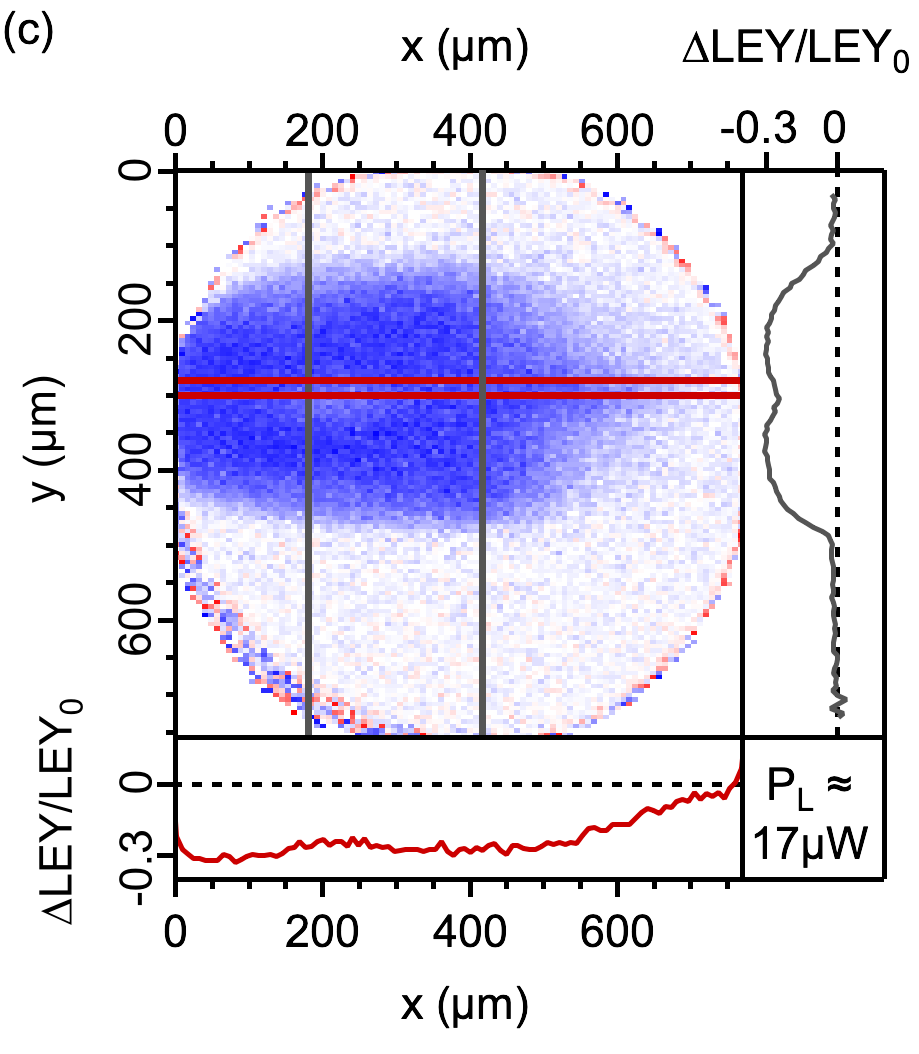
To spatially resolve the work-function shift across the sample, we recorded local electron yield (LEY) images in PEEM mode with and without laser illumination. The \qty372nm beam was focused in the upper left part of the FoV and impinged at a grazing angle of onto the sample. This expands the horizontal spot profile to a FWHM of around . Figures 3b and c show the detector sensitivity corrected normalized images (LEY(Hg + 372) - LEY(Hg))/LEY(Hg)=(LEY/LEY0) for identical spot profiles, but changing laser power by one order of magnitude. Before image acquisition the sample was exposed to laser illumination for about 300 s while the acquisition time for each images was about 150 s. The PEEM image in Fig. 3b was recorded with a laser power of . This corresponds to a photon flux of in the laser spot center, leading to about 1 switching event every \qty10s.Moldt et al. (2015); Bronsch et al. (2017b) At this threshold fluence we start to observe a local shift of the PSS state towards higher work function (higher density of cis-isomers). From the horizontal and vertical profiles we estimate a spot size of , about times larger than the FWHM of the laser focus.
Increasing the \qty372nm photon flux by a factor of 10, the area in Fig. 3c showing a decreased EY is more pronounced and significantly larger. Horizontal and vertical profiles reveal a magnification of the projected laser focus FWHM by a factor of . While the differential photoemission intensity LEY changes gradually along the direction of laser incidence , comparably sharp edges and a nearly flat top are observed along the -direction.
Taking into account the laser-focus profile, we modeled the expected local work-function shifts assuming first-order kinetics according to:
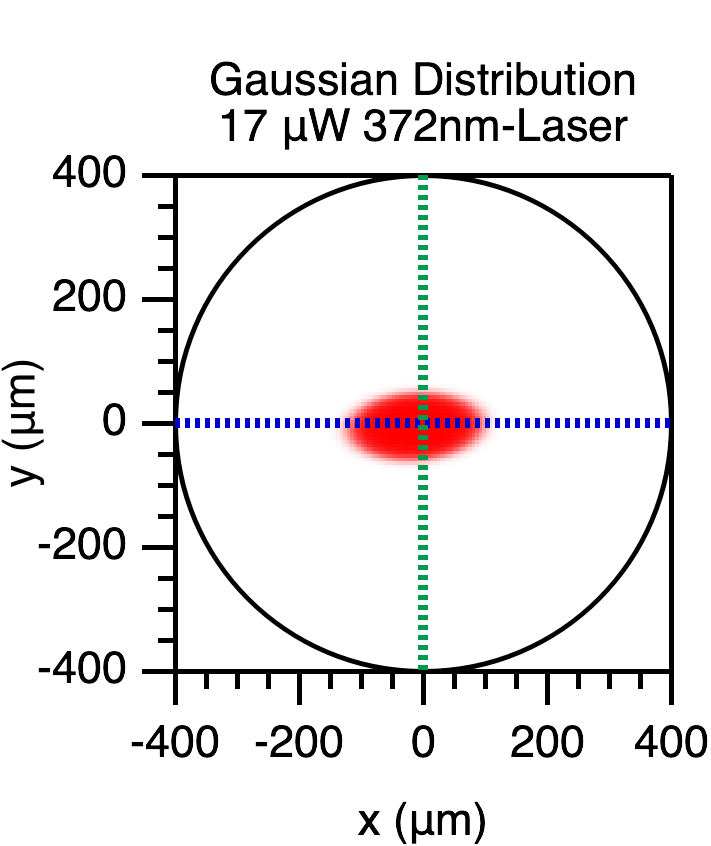
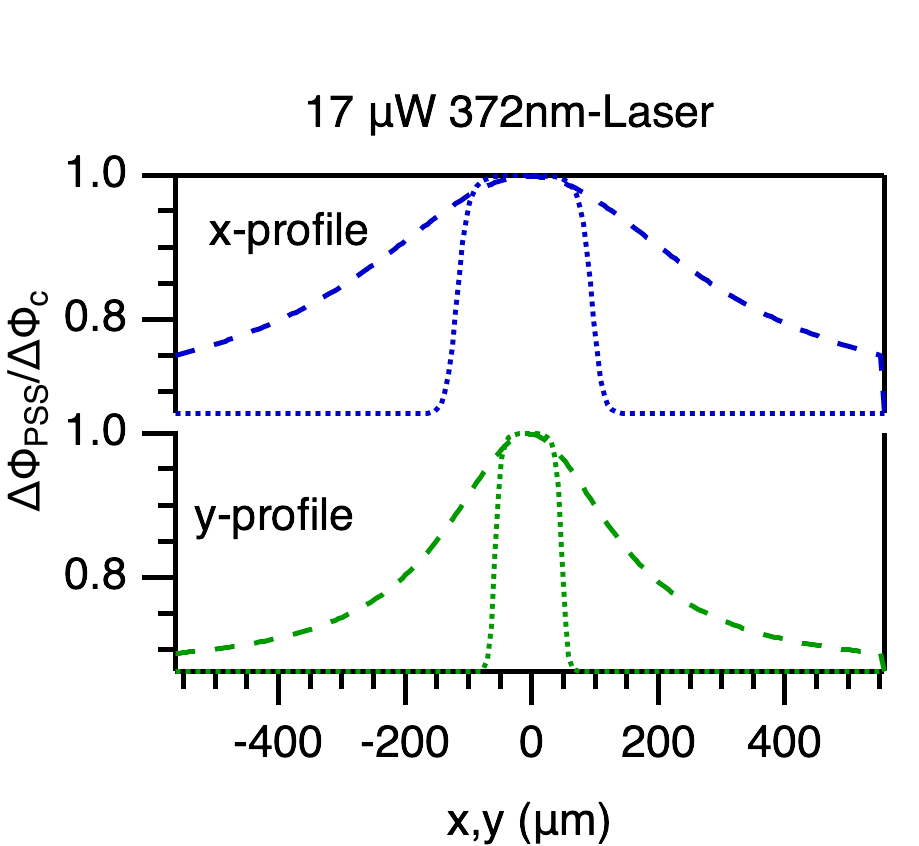
| (1) |
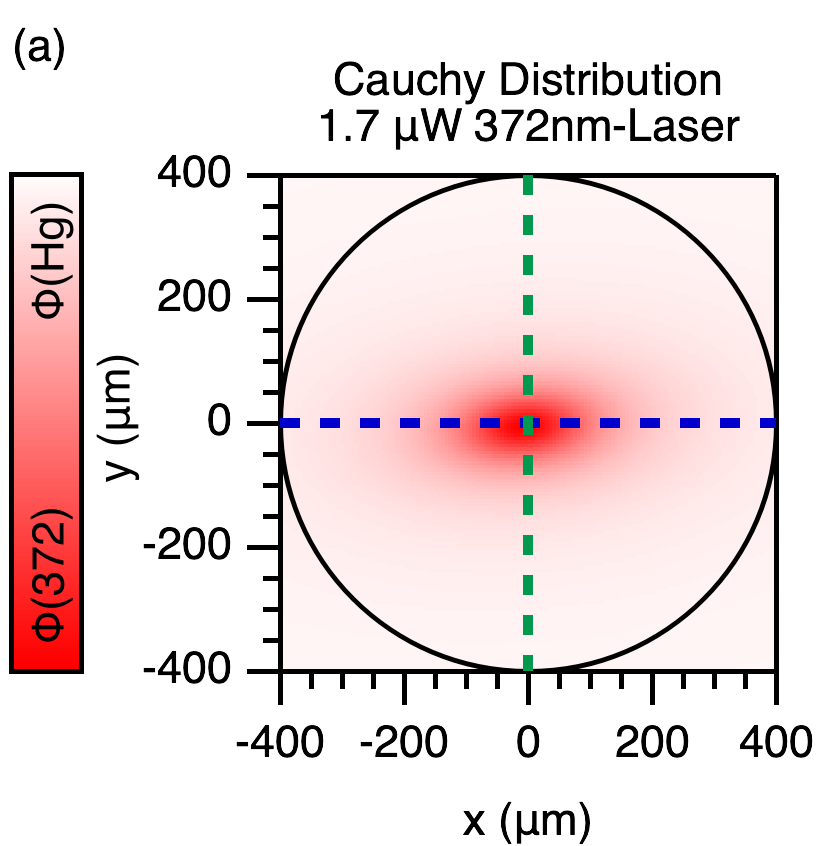
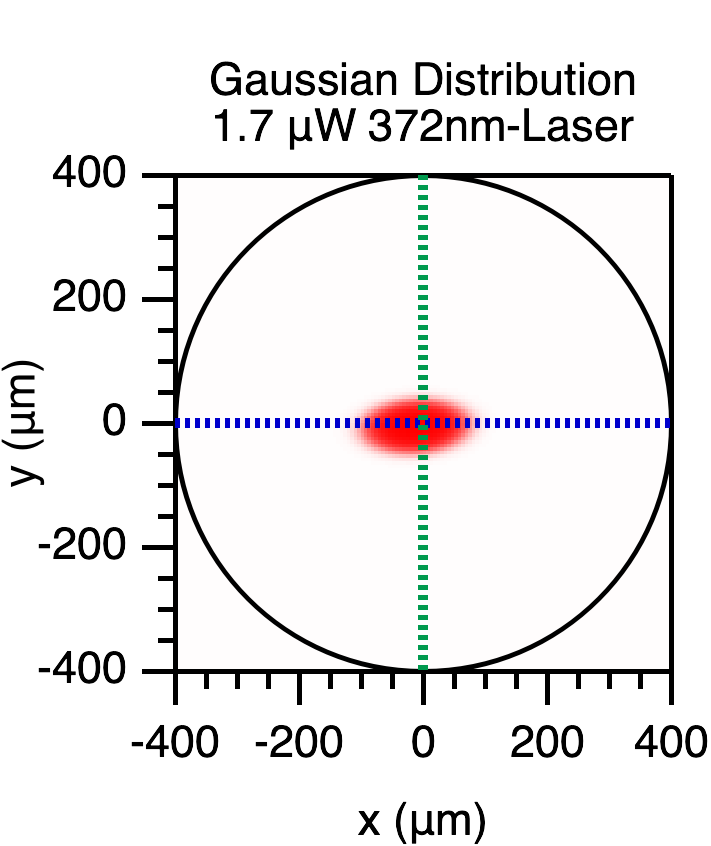
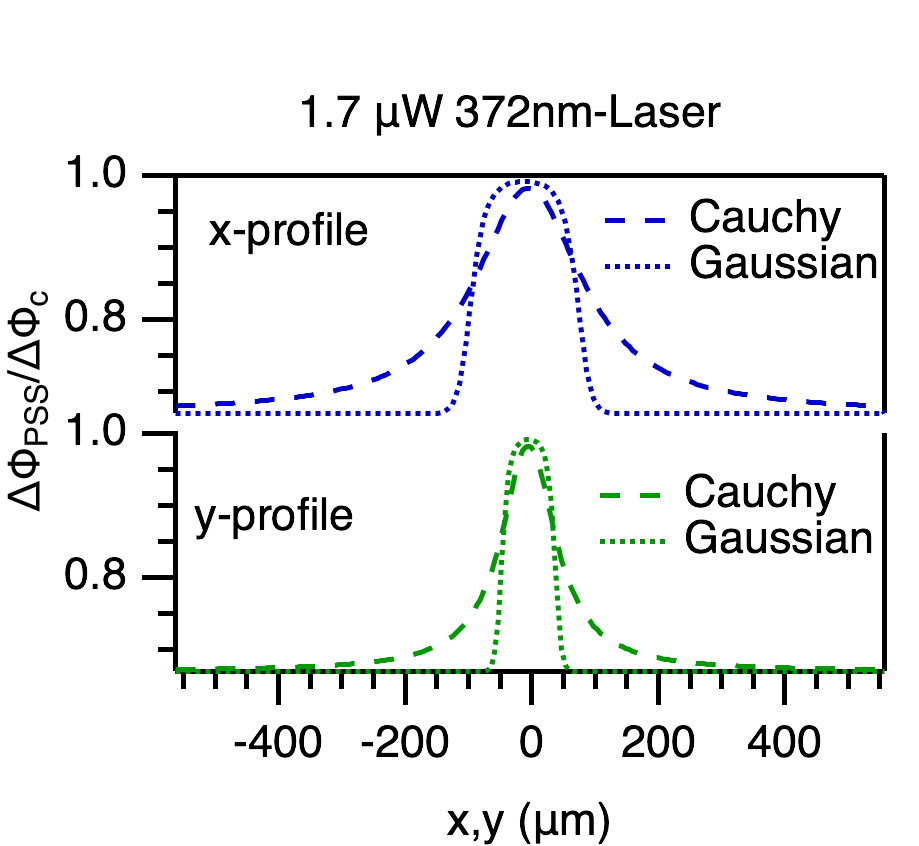
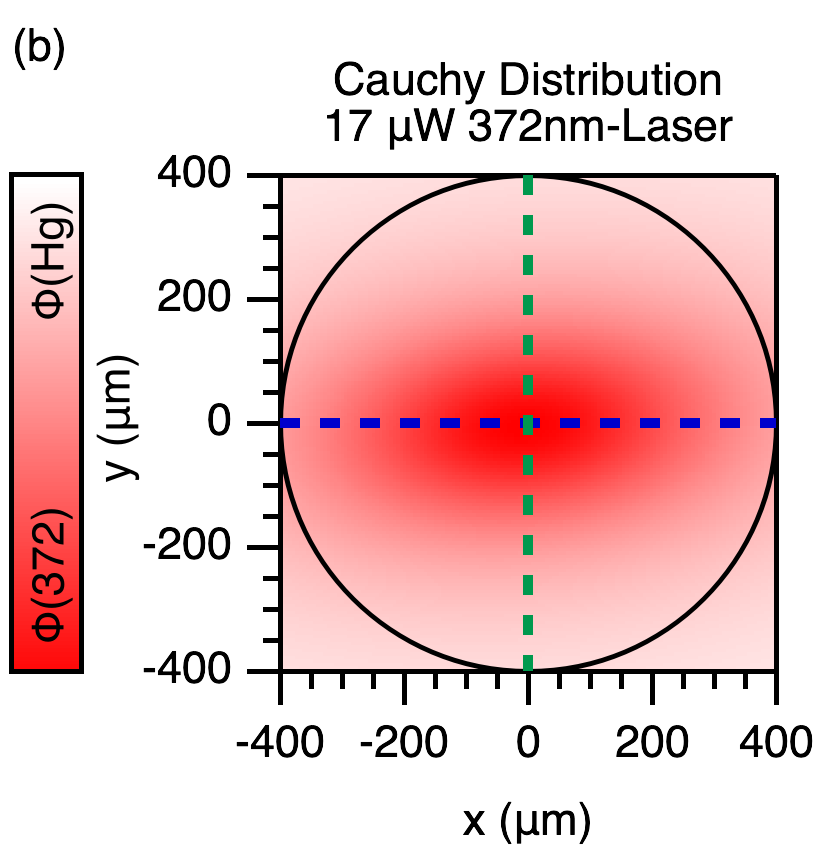
For a detailed derivation of this equation, we refer to Ref. Bronsch et al., 2017b. Here, corresponds to the photon flux ratio of Hg lamp and \qty372nm laser, while corresponds to the ratio of effective isomerization cross-sections for both light sources. denotes the work-function difference between the PSSs reached under 372 and 436 nm illumination only. From the wavelength dependence of the effective isomerization cross-section across the S2 absorption band we obtain cm2.Bronsch et al. (2017b); Moldt et al. (2015) In the case of the S1 band we approximate by cm2, which is known from NEXAFS experiments on Az11 SAMs.Moldt et al. (2015) For our simulations, we assumed homogeneous illumination by the Hg lamp in the PEEM’s FoV and fitted the measured profile of the laser spot with either Cauchy or Gaussian distributions (see SM, Sec. I). Elliptical profiles account for the different widths in horizontal and vertical directions. Figures 4a and b show calculated local work-function changes for laser intensities of 1.7 and \qty17\microW, respectively. The color scale ranges from the PSS of the Hg lamp (, white) to the maximal work-function change reached upon \qty372nm illumination only (, red), i.e. the PSS with predominantly cis Az11 chromophores. As expected, the Cauchy distribution gives smooth changes of the work function over several hundreds of micrometer away from the spot center at . In contrast, for a Gaussian distribution we observe work-function profiles with steepened edges and a flat top. None of the models perfectly describes the measured laser spot, but a combination of both contains all characteristics of the switched area. The shape of the beam profile is thus essential for the work-function gradient from the center of the switched spot to the non-changed environment, whereas the local photon flux ratio of the laser beam and the Hg lamp determines the magnitude of the local work-function shift. The tails of the Cauchy profile lead to an extended switched area, those of a Gaussian to steepened edges and a pronounced flat top along the -direction. An increase of the local work function upon trans-cis isomerization leads to a decrease of the local electron yield LEY. In Sec. III of the SM we demonstrate LEY. Thus simulated patterns of and measured LEY profiles are quantitatively comparable. Comparing the simulations (cf. Fig. 4) with our data (cf. Fig. 3), we conclude that only those areas hit by the laser beam are switched. In the PEEM experiment we spatially resolve the photoelectron yield and not directly the work function.
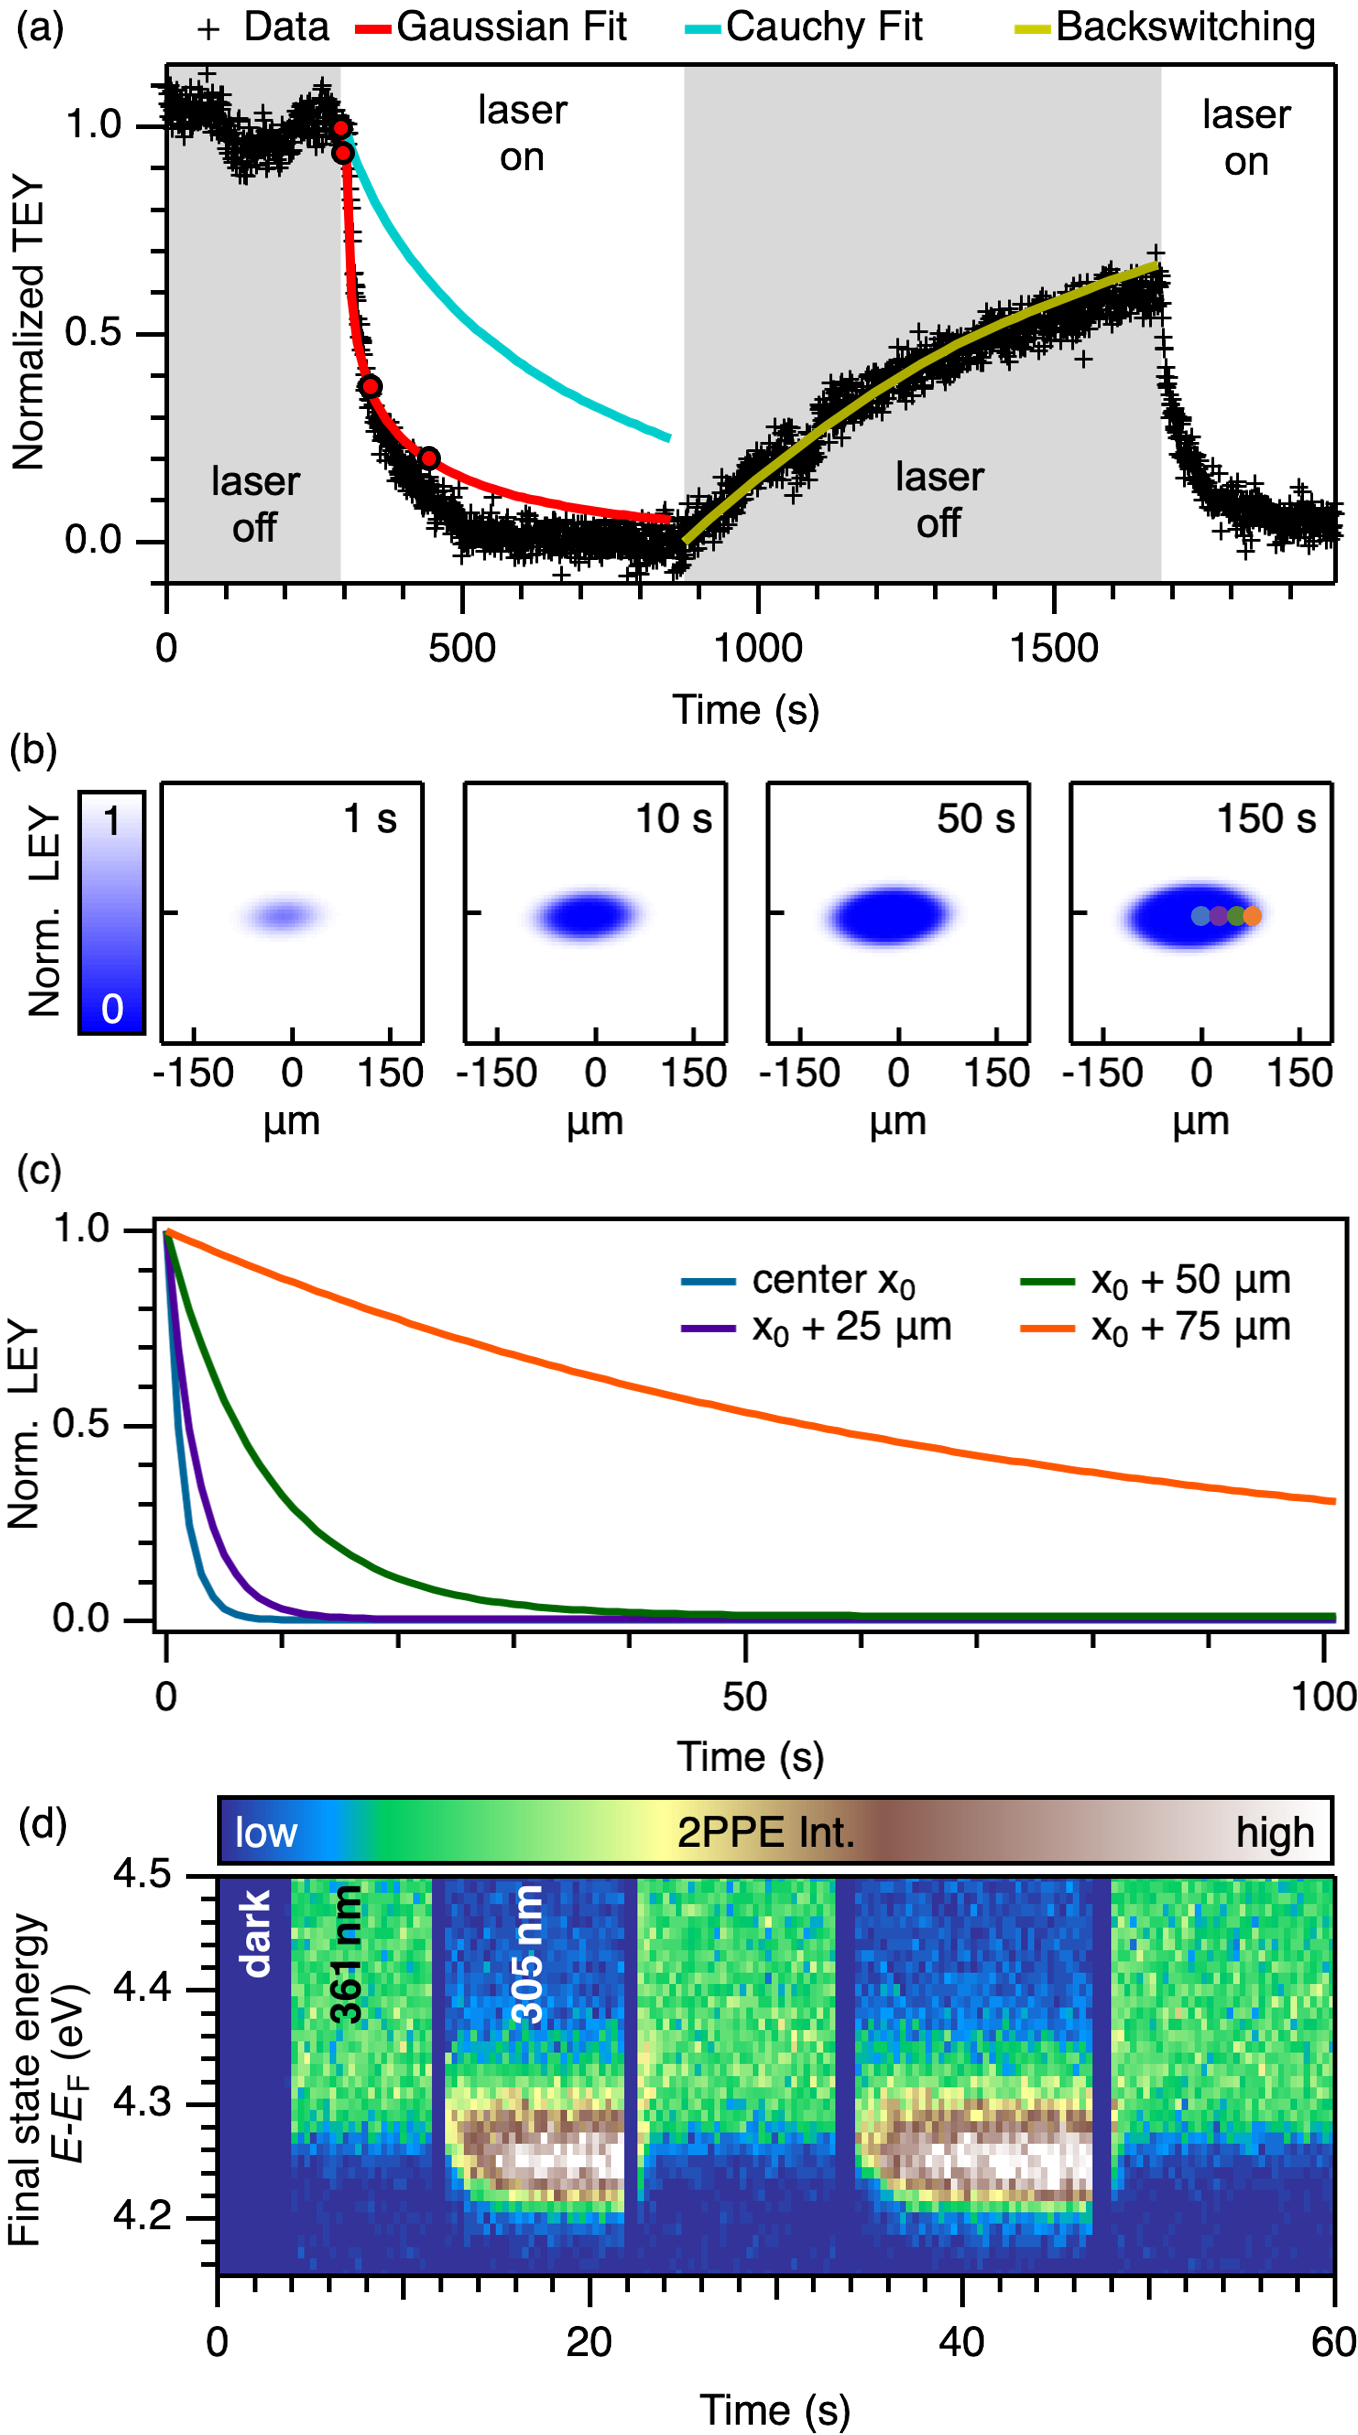
The photon flux in the laser spot not only varies the local PSS, but also the kinetics to reach this PSS. As a measure for the overall switching kinetics, we evaluate the transient of the total electron yield TEY() by summing up the electron count-rate in the complete FoV as a function of exposure time . As shown in Fig. 5a, TEY() decreases as soon as the laser beam illuminates the sample, since the Az11 SAM changes towards the new PSS that includes overall a higher fraction of cis isomers.Ah Qune et al. (2008); Bronsch et al. (2017a, b) When turning laser illumination off, the ensemble of Az11 molecules relaxes back to the Hg-PSS.
To describe the transient work-function shift , which expresses the ensemble switching kinetics, the time-dependent change of the local fraction of cis molecules has to be considered (for details see SM, Sec. IV):
| (2) |
with
with , and .
The solid lines in Fig. 5a show the calculated change of the TEY for the fitted Cauchy and Gaussian laser spot profiles (cf. Fig. 3). Using the Cauchy distribution, we get poor agreement between modelled and measured switching kinetics (cyan line). The Gaussian beam profile (red line) shows a much better agreement. This matches the observation of sharp edges of the switched areas, shown by the line profiles in Fig. 3c. We modelled the temporal evolution of the spatial work-function distribution in a defined FoV to illustrate how the LEY gradually evolves under laser illumination. Figure 5b shows exemplary images after \qtylist1;10;50;150s laser illumination with a Gaussian profile, Fig. 5c the corresponding kinetics curves for selected positions in real space. In the center of the beam, the PSS state is close to a pure cis SAM and is reached after few seconds for \qty48\microW laser power (blue curve). In the tails of the laser spot, the local PSS is not reached within \qty100s (orange curve). The fast and precise work-function tuning modelled for the spot center can be shown using photoemission from a pulsed laser source operated at a wavelength in the S2 band. This gives excitation densities high enough to induce two-photon photoemission (2PPE) and enables direct tracing of the work-function change as shown in Fig. 5d for \qty361 and \qty305nm photons. Upon excitation with \qty305nm, the low energy cutoff of the photoemitted electron spectrum shifts towards \qty4.22eV with respect to \qty4.27eV when illuminated by \qty361nm. This indicates a work-function shift of \qty50meV. Enhancing the capabilities of the experimental PEEM setup with a new pulsed laser source (SM, Sec. V) will enable spatially resolved measurements of the work-function distribution, paving the path for transient work-function patterning beyond the LEY signatures.
In conclusion, we showed that well-defined and homogeneous switched areas can be produced by illuminating an azobenzene-functionalized surface with a focused UV beam without the need of current patterning techniques with predefined vignettesYue, Azumi, and Norikane (2020); Bakker et al. (2023), enabling on-the-fly modifications.
When shaping the beam profile, the absolute value of the local work function as well as the time scale required to switch the work function can be controlled. The switched area and isomerization profile depend on the laser spot profile paving the route towards designing cheap organic optoelectronic devices with active area, tuning not only the work function, but, e.g., the lateral excitonic coupling among the photoswitches.
We thank Rafal Klajn for the kind supply of the Az11 molecules and Johannes Mosig for fruitful discussions and computational support. J.B. thanks the International Max Planck Research School for Elementary Processes in Physical Chemistry for financial support in the initial phase of his PhD. This project was supported by Deutsche Forschungsgemeinschaft via the Collaborative Research Center TRR 227 on Ultrafast Spin Dynamics, projects A01 and B07. Part of the equipment was financed by the Deutsche Forschungsgemeinschaft via the program for major research instrumentation (91b GG).
References
- Steen, Duijnstee, and Browne (2023) J. D. Steen, D. R. Duijnstee, and W. R. Browne, Surface Science Reports 78, 100596 (2023).
- Ichimura, Oh, and Nakagawa (2000) K. Ichimura, S.-K. Oh, and M. Nakagawa, Science 288, 1624 (2000).
- Crivillers et al. (2011a) N. Crivillers, E. Orgiu, F. Reinders, M. Mayor, and P. Samorì, Adv. Mater. 23, 1447 (2011a), publisher: WILEY-VCH Verlag.
- Ah Qune et al. (2008) L. F. N. Ah Qune, H. Akiyama, T. Nagahiro, K. Tamada, and A. T. S. Wee, Appl. Phys. Lett. 93, 083109 (2008).
- Crivillers et al. (2011b) N. Crivillers, A. Liscio, F. Di Stasio, C. Van Dyck, S. Osella, D. Cornil, S. Mian, G. M. Lazzerini, O. Fenwick, E. Orgiu, F. Reinders, S. Braun, M. Fahlman, M. Mayor, J. Cornil, V. Palermo, F. Cacialli, and P. Samorì, Phys. Chem. Chem. Phys. 13, 14302 (2011b), publisher: The Royal Society of Chemistry.
- Crivillers et al. (2013) N. Crivillers, S. Osella, C. Van Dyck, G. M. Lazzerini, D. Cornil, A. Liscio, F. Di Stasio, S. Mian, O. Fenwick, F. Reinders, M. Neuburger, E. Treossi, M. Mayor, V. Palermo, F. Cacialli, J. Cornil, and P. Samorì, Adv. Mater. 25, 432 (2013), publisher: WILEY-VCH Verlag.
- Nagahiro et al. (2009) T. Nagahiro, H. Akiyama, M. Hara, and K. Tamada, J. Electron Spectrosc. Relat. Phenom. 172, 128 (2009).
- Hartley and Le Fevre (1939) G. S. Hartley and R. J. W. Le Fevre, J. Chem. Soc. , 531 (1939), publisher: The Royal Society of Chemistry.
- Bandara and Burdette (2012) H. M. D. Bandara and S. C. Burdette, Chem. Soc. Rev. 41, 1809 (2012), publisher: The Royal Society of Chemistry.
- Freyer et al. (2009) W. Freyer, D. Brete, R. Schmidt, C. Gahl, R. Carley, and M. Weinelt, J. Photochem. Photobiol., A 204, 102 (2009).
- Klajn (2010) R. Klajn, Pure Appl. Chem. 82, 2247 (2010).
- Gahl et al. (2010) C. Gahl, R. Schmidt, D. Brete, E. R. McNellis, W. Freyer, R. Carley, K. Reuter, and M. Weinelt, J. Am. Chem. Soc. 132, 1831 (2010).
- Moldt et al. (2015) T. Moldt, D. Brete, D. Przyrembel, S. Das, J. R. Goldman, P. K. Kundu, C. Gahl, R. Klajn, and M. Weinelt, Langmuir 31, 1048 (2015).
- Moldt et al. (2016) T. Moldt, D. Przyrembel, M. Schulze, W. Bronsch, L. Boie, D. Brete, C. Gahl, R. Klajn, P. Tegeder, and M. Weinelt, Langmuir 32, 10795 (2016).
- Heinemann et al. (2012) N. Heinemann, J. Grunau, T. Leißner, O. Andreyev, S. Kuhn, U. Jung, D. Zargarani, R. Herges, O. Magnussen, and M. Bauer, Chem. Phys. 402, 22 (2012).
- Bronsch et al. (2017a) W. Bronsch, D. Przyrembel, L. Boie, C. Gahl, and M. Weinelt, Appl. Phys. Lett. 111, 081601 (2017a), publisher: AIP Publishing.
- Stiller et al. (1999) B. Stiller, G. Knochenhauer, E. Markava, D. Gustina, I. Muzikante, P. Karageorgiev, and L. Brehmer, Mater. Sci. Eng., C 8, 385 (1999).
- Gustina et al. (1999) D. Gustina, E. Markava, I. Muzikante, B. Stiller, and L. Brehmer, Advanced Materials for Optics and Electronics 9, 245 (1999), publisher: Wiley Online Library.
- Schuster et al. (2019) S. Schuster, M. Füser, A. Asyuda, P. Cyganik, A. Terfort, and M. Zharnikov, Phys. Chem. Chem. Phys. 21, 9098 (2019), publisher: The Royal Society of Chemistry.
- Bronsch et al. (2017b) W. Bronsch, T. Moldt, L. Boie, C. Gahl, and M. Weinelt, Journal of Physics: Condensed Matter 29, 484002 (2017b).
- Schönhense, Medjanik, and Elmers (2015) G. Schönhense, K. Medjanik, and H.-J. Elmers, Journal of Electron Spectroscopy and Related Phenomena 200, 94 (2015).
- Schönhense and Elmers (2022) G. Schönhense and H.-J. Elmers, Journal of Vacuum Science & Technology A 40, 020802 (2022).
- Oelsner et al. (2010) A. Oelsner, M. Rohmer, C. Schneider, D. Bayer, G. Schönhense, and M. Aeschlimann, Journal of Electron Spectroscopy and Related Phenomena 178-179, 317 (2010).
- Yue, Azumi, and Norikane (2020) Y. Yue, R. Azumi, and Y. Norikane, ChemPhotoChem 4, 5383 (2020).
- Bakker et al. (2023) S. Bakker, E. de Korver, M. Fransen, E. Kamer, G. A. Metselaar, A. C. C. Esteves, and A. P. H. J. Schenning, Applied Optical Materials 1, 403 (2023).