Influence of buffer gas on the formation of -resonances in rubidium vapors
Abstract
The -resonance process is an accessible and effective method for obtaining narrow (down to subnatural linewidth), and contrasted resonances, using two continuous lasers and a Rb vapor cell. In this article, we investigate the impact of buffer gas partial pressure on the contrast and linewidth of -resonances formed in the line of an 85Rb thermal vapor. -resonances are compared to usual EIT resonances, and we highlight their advantages and disadvantages. Several rounds of measurements were performed with five vapor cells, each containing Rb and Ne buffer gas with different partial pressures (ranging from 0 to 400 Torr). This reveals the existence of an optimum Ne partial pressure that yields the best contrast, for which we provide a qualitative description. We then study the behavior of the -resonance components when a transverse magnetic field is applied to the vapor cell. The frequency shift of each component is well described by theoretical calculations.
I Introduction
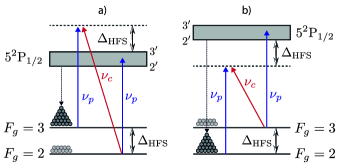
-resonances are narrow-band, all-optical Doppler-free absorptive resonances. They were first observed and studied by Zibrov et al. [1]. Initally referred to as three-photon absorption resonances or three-photon EIT resonances due to their resemblance with EIT resonances, they result from a two-field (probe and coupling) three-photon absorption process involving a two-photon Raman transition combined with optical pumping (from the probe beam). They are obtained in -systems (as illustrated in Fig. 1). In this paper, we study the optical transition of 85Rb. The states involved in the process are thus and the (unresolved) excited electronic state P1/2. The coupling beam is detuned from the excited state by the ground state hyperfine frequency GHz [2]. When the Raman condition is fulfilled, a -resonance appears in the absorption spectrum, in the form of an increase in absorption on top of the usual Doppler-broadened profile. Therefore, -resonances differ from EIT resonances in that the latter result in a decrease in absorption [3, 4, 5, 6]. -resonances are closely related to Electromagnetically Induced Absorption (EIA) resonances, which have been studied in vapors of other alkali atoms (Cs, Na and K) [1, 7, 8, 9, 10, 11, 12, 13, 14, 15, 16]. As in EIT, the linewidth of a -resonance is strongly dependent on ground-state hyperfine decoherence.
When an external magnetic field is applied, EIT and -resonances behave similarly: the number of components in which they split depends on the hyperfine structure of the system (namely the total angular momentum of the lower ground states), the orientation of the magnetic field with respect to the laser propagation direction and the laser polarization. It was recently shown in [17] that EIT components formed in a magnetic field are useful tools that allow to retrieve both the direction and magnitude of the magnetic field. In principle, this could also be true for -resonances.
Previous studies [1, 9, 10, 11, 12, 13, 14, 15] have shown that -resonances exhibit enhanced contrast and reduced linewidth when a buffer gas, typically Neon, is introduced in the alkali vapor cell. However, in-depth investigations to pinpoint the optical buffer gas pressure for the formation of -resonances have been lacking. Despite the extensive literature on the EIT process (see for example [3, 4, 5, 6] and references therein), research on -resonances remains limited. This highlights the importance of further investigation. Due to their weak light shift compared to CPT resonances, -resonances are promising candidates for small atomic frequency standards that can be realized with commercially available diode lasers [12, 13, 18].
In this work, we use five vapor cells with varying buffer gas pressures, spanning from 0 to 400 Torr. The objective is to investigate how these pressure conditions influence the contrast and linewidth of the -resonance. By covering a broad spectrum of pressures, we aim to gain a comprehensive understanding of the behavior of the -resonance under various experimental conditions. This allows us to observe how the spectral features behave and provides a valuable insight into the optimal buffer gas pressure conditions required for the formation of a narrow and contrasted -resonance. Once the optimal pressure range is obtained, we examine the evolution of the resonance when an external magnetic field is applied and compare the frequency shift of its components with previous theoretical calculations.
II Experiment
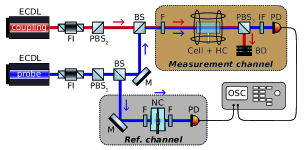
The layout of the experimental setup is shown in Fig. 2. Two VitaWave [19] continuous external cavity narrow-band ( MHz) diode lasers were used. Both lasers were tuned in the vicinity of the line of 85Rb. Two beams with mutually perpendicular polarizations were formed, hereafter referred to as probe () and coupling () beams, using polarizing beam splitters labelled PBS1 and PBS2. The probe laser frequency was tunable in order to scan the 52P1/2 state, while the frequency of the coupling laser was fixed. The probe power was kept in the range 0.5 - 1 mW, while the coupling power could be increased up to 40 mW. Roughly 10 of the coupling laser was directed to a Dichroic Atomic Vapor Laser Locking (DAVLL) frequency locking scheme [20], omitted in Fig. 2 for the sake of clarity.
The probe and coupling beams were combined with a beam splitter and directed to a 0.8 cm-long vapor cell containing Rb and Ne buffer gas. Several rounds of measurements were performed with cells having a different Ne partial pressure. In all cases, the temperature of the cell was 50 ∘C, corresponding to a number density of the order of 10cm-3. The photodetector was then used to record the probe radiation passing through the cell, the coupling radiation being cut out by the analyzer labelled PBS3. The cell was placed in the middle of three pairs of Helmholtz coils (Cell + HC), allowing the formation of a magnetic field if needed. A fraction of the coupling radiation (Ref. channel) was directed to a nanometric-thin cell with a thickness nm [11] to form a reference spectrum, as presented in Fig. 3 (lower, blue curve).
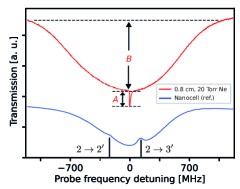
The red curve in Fig. 3 is an absorption spectrum of the probe beam passing through a 0.8 cm cell ( Torr) when the coupling beam is on. The spectrum contains a narrow -resonance with a FWHM of 9 MHz and a contrast of around 20%. Throughout this paper, the contrast is defined as the ratio of the depth of the -resonance () to the probe-only absorption () [21]. The contrast increases with the power of the coupling laser, as can be seen in Fig. 4, and can reach with this cell a maximum of 25% (approximately 2.5 greater than the contrast of a -resonance formed in a cell without buffer gas). For a cell with 6 Torr Neon, the contrast can reach up to 40%.
In Fig. 1, we present two diagrams of the energy levels of 85Rb line involved in the -resonance formation process. Two configurations are presented, depending on whether the probe laser is scanning the or set of transitions. In diagram a) the probe field , resonant with the transition between the lower-energy level of the ground state () and the electronic excited state P1/2, pumps the atoms into the upper ground state [22], enhancing the probe transmission through the vapor, ultimately leading to population inversion. The coupling beam is detuned from the transition. If the two-photon absorption condition is fulfilled, atoms are driven coherently back to the lower energy level via a two-photon absorption process [8], followed by a one-photon absorption from the probe bringing the atom to the excited state. The spectrum then shows a narrow, all-optical -resonance induced by the three-photon non-linear process on top of a Doppler-broadened background caused by regular absorption, as it is shown in Fig. 1. The frequency of the -resonance can be easily changed by tuning the frequency of the coupling field. In diagram b), a similar behavior is depicted. The probe field, resonant with the transition between and the excited state, pumps the atoms into the lower-energy level of the ground state. In this case, if the condition is fulfilled, atoms are driven coherently to , followed as before by a one-photon absorption from the probe bringing the atom to the excited state. More details about -resonance formation are provided in section IV.
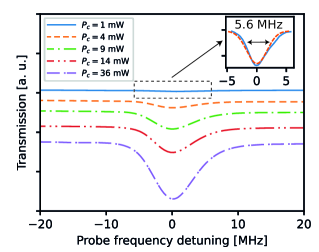
Fig. 4 shows the dependence of the amplitude of the -resonance ( Torr) on the coupling power. Five different curves are provided, which were respectively obtained for and mW (from top to bottom). The probe power was fixed at 1 mW in all cases. Since the diameter of both laser beams is 2 mm, the intensity for a laser of power [mW/cm2] is .
Note that reducing and to, say, 1 mW and 0.5 mW respectively allows to form a -resonance with a smaller contrast (a few %) but with subnatural linewidth, as shown in the inset of Fig. 4. The resonance was fitted with a Gaussian profile (which is a good approximation for low coupling powers) and its FWHM is in that case around MHz.
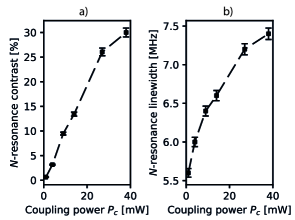
In Fig. 5a, we show the dependence of the -resonance amplitude on the coupling power . We observe an increase of the amplitude with the coupling power following a somewhat linear dependency (the dashed line are only to guide the eye). However, the increase in spectral width is much weaker with respect to the coupling power, as depicted in Fig. 5b. This is important when studying the splitting of the -resonance in an external magnetic field to avoid overlapping of the different components.
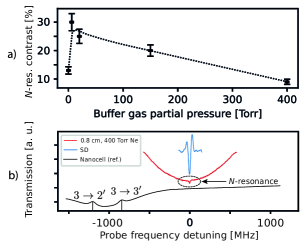
Fig. 6a shows the dependence of the contrast of the -resonance on the Ne partial pressure, in the 0 to 400 Torr range. The coupling power is 1 mW and the probe power is 36 mW. It can be seen that the optimal Ne partial pressure is located between 6 and 30 Torr, where the contrast is maximum. It is interesting to note that this pressure is also optimal for the EIT process (see Fig. 8 in [3]).
In Fig. 6b, we present a probe transmission spectrum recorded in a cell with 400 Torr Ne (red curve). The blue curve is the second derivative (SD) of the region highlighted by the dotted oval [23]. In this case, the contrast is strongly reduced (), and the SD allows to see the resonance better. The lower curve in Fig. 6b is a reference spectrum of the transitions of 85Rb.
It should be noted that despite the relatively low contrast of the -resonance ( %) formed in a 400 Torr Ne vapor cell shown in Fig. 6b, it is still easily recordable. The Saturated Absorption (SA) process, used in many experiments to form reference spectra, can not be seen in cells containing buffer gas (even as little as 0.1 Torr) [24].
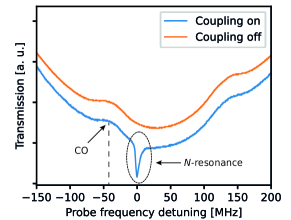
In Fig. 7, the upper orange curve shows the spectrum of only the probe radiation formed in a cell with pure Rb vapor, while curve the lower blue curve shows the spectrum of probe radiation in the presence of the coupling radiation, which contains a -resonance with a linewidth of 6 MHz. Since the one-photon Doppler width of Rb line is 500 MHz [25, 24], we observe strong narrowing of the -resonance by 83 times.
III Behavior of the -resonance in a magnetic field
.
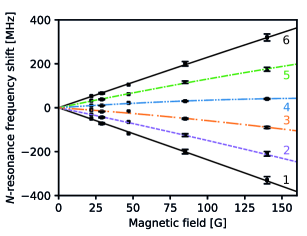
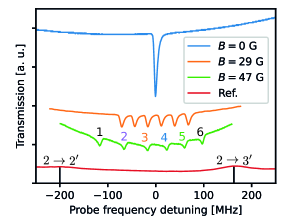
To study the evolution of the -resonance in an external magnetic field, we placed a vapor cell (Rb + 20 Torr Ne) in the middle of a system of three pairs of Helmholtz coils. This allows to create a magnetic field in the desired direction while zeroing the laboratory magnetic field. The spectra presented in Fig. 8 correspond to the case where a transverse magnetic field () was applied to the cell. The zero field resonance (, upper curve) splits into 6 equidistant components, all having the same linewidth of around 6 MHz. The components move away from each other as the magnetic field increases, as we see with the spectra corresponding to G and G. Under the influence of , the ground levels and respectively split into 5 and 7 Zeeman sublevels. Since the frequency shifts of these levels are respectively MHz/G [2] (where is the Bohr magneton), the states are shifted in opposite directions and the distance between two adjacent components of the -resonance can be easily estimated as
| (1) |
yielding around 27 MHz for G and 44 MHz for G, which is consistent with what is seen in Fig. 8. Equidistance of the components (as shown in Fig. 9) is obtained in the small magnetic field regime (), where is the magnetic dipole interaction constant [2, 26, 27, 28]. The value of for 85Rb is kG. For higher magnetic fields, i.e. when and are decoupled and are not good quantum numbers, the Breit-Rabi formula can be used [3, 2, 27, 28] to determine theoretically the frequency shifts of the states.
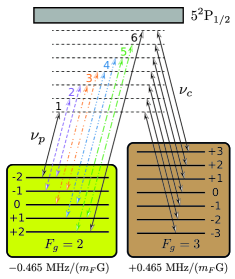
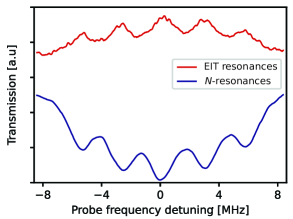
Fig. 10 is a diagram depicting the splitting of the states of 85Rb in a magnetic field. For the sake of clarity, we did not show the splitting of the levels of the excited state P1/2. In the diagram, ten possible pairs of probe/coupling frequencies which can lead to two-photon absorption from with transfer of atoms to are shown. It can be observed that the probe laser frequencies are in some cases the same (such groups of two transitions with the same frequencies are depicted by two arrows of the same color in Fig. 10). These 6 pairs lead to the splitting of the -resonance into 6 different components, as seen in Fig. 8 and 9. When , the and polarizations form 5 -systems with the and levels of the ground state, and the -resonance splits into 5 equidistant narrow-band components [11]. This configuration is shown in Fig. 11 for both EIT and -resonances (a longitudinal magnetic field G was applied). The linewidth of each component is about 1.5 MHz, 4 times narrower than the natural linewidth. However, it is clearly seen from the upper curve of Fig. 11 that the EIT signal is “noisier” than that of the -resonance, which is explained by a higher contrast of the latter (i.e. higher signal-to-noise ratio).
IV Discussion of the experimental results
Let us consider the diagram presented in Fig. 1b (all the following conclusions, with small modifications, are also true for Fig. 1a). As mentioned above, the purpose of adding a buffer gas (in this case, Ne) to a Rb cell is the following:
-
1.
A strong Rb-Ne collisional broadening of the P1/2 state occurs [29], leading to greater absorption of the probe laser and, consequently, to an increase of the value, where and are the populations of the ground states.
-
2.
The speed of the atoms is greatly reduced, thereby increasing the time of flight of an atom through the laser beam, increasing the optical pumping process.
A theoretical consideration of the -resonance formation process is given in [14]. Here, we present a qualitative consideration of the process according to [8].
The amplitude of the -resonance depends on the two-photon absorption resonance cross-section such that
| (2) |
where is the length of the vapor cell. The two-photon absorption resonance cross-section is defined as:
| (3) |
where is the detuning of the coupling laser from the excited state P1/2, is the natural linewidth of the excited state ( MHz) and represents ground-state decoherence + other terms that may lead to line broadening [3, 4]. The coupling Rabi frequency, , is defined as , where is the coupling electric field and is the matrix element of the transition dipole moment of the P1/2 transition. Estimates of the Rabi frequency can be obtained from [30]:
| (4) |
where is the laser intensity [mW/cm2]. For mW, we obtain mW/cm2 which yields MHz. Note that if the -resonance is power-broadened, it is possible to estimate its linewidth with the formula given in [6]:
| (5) |
where is the one-photon Doppler width [31]:
| (6) |
with the transition frequency (here THz) and the atomic mass of 85Rb ( kg) [2, 24]. In our case, MHz, which gives MHz. From equation (5), it is clear that by reducing the coupling intensity, one can obtain a -resonance with subnatural linewidth. An important fact to note is that amplitude depends on , therefore, -resonances cannot be formed at small thicknesses, i.e. in micrometric-thin cells. However, since the dependence on is much weaker for EIT resonances, they can even be formed and detected in nanometric-thin cells [32, 33]. Another significant difference is that, when recording resonance fluorescence spectra during the EIT process, a narrow dip (decrease) can be observed on the fluorescence peak, while when a -resonance is formed, we observe a narrow peak of increased fluorescence [8]. Moreover, the increase of absorption exhibited in -resonance spectra can be changed into a decrease of absorption in the presence of an additional laser field [34].
It is important to note that the two-photon absorption resonance cross-section (eq. 3) is inversely proportional to ( is the detuning of coupling laser from the excited state P1/2). At high buffer gas partial pressures, a strong broadening of the excited state occurs [29], resulting in an increase in . Since the buffer gas contributes to the population inversion required to form a -resonance while simultaneously increasing the frequency detuning, there is an optimum for its partial pressure, as it is clearly seen in Fig. 6a.
V Conclusion
In this article, we have studied the formation of all-optical high-contrast narrow-band -resonance in -systems of 85Rb line using two continuous-wave lasers. In the configurations studied in this paper, the -resonance consists in an increase of absorption on top of the usual Doppler-broadened (+ additional broadening if the cell contains buffer gas) profile. We have performed, for the first time, the analysis in several Rb vapor cells containing different amounts of Ne buffer gas (from 0 to 400 Torr). It is demonstrated that the optimum of Ne partial pressure lies in the range 6 - 30 Torr. The -resonances can be in many ways compared to usual EIT resonances:
-
1.
-resonances show an increase of both absorption and resonance fluorescence, while EIT resonances show a decrease of absorption and fluorescence.
-
2.
To obtain narrow and contrasted -resonances, the cell length must be quite large ( m), while EIT resonances can be formed in cells as thin as nm.
-
3.
Under the same experimental parameters in the same -systems, the contrast of the -resonance is higher, meaning the signal-to-noise ratio is better (see Fig. 11).
In an external transverse magnetic field, six -resonance components can be recorded (for 85Rb line), the frequency positions of which are very well described by theoretical calculations. This statement is also correction for EIT resonance. According to our expertise, forming a narrow and contrasted -resonance in a centimetric vapor cell is easier than forming EIT resonances, while having a high signal-to-noise ratio is crucial for applications. This is explained by the strong dependence of the -resonance amplitude on the intensity of the coupling laser shown in Fig. 4. Thanks to narrow linewidth and high contrast, -resonances can have a number of important applications (as much as EIT resonances) in a variety of fields, such as information storage, quantum communication, optical magnetometry or metrology [3, 4, 6].
Acknowledgments
This work was supported by the Science Committee of RA, in the frame of the project n°1-6/23-I/IPR, and was sponsored by the NATO Science for Peace and Security Programme under grant G5794.
Disclosures
The authors declare no conflict of interest.
References
- [1] A. S. Zibrov, C. Y. Ye, Y. V. Rostovtsev, A. B. Matsko, M. O. Scully, Observation of a three-photon electromagnetically induced transparency in hot atomic vapor, Physical Review A 65 (4) (2002) 043817. doi:10.1103/PhysRevA.65.043817.
- [2] D. Steck, Rubidium 85 D Line Data (2019).
- [3] R. Wynands, A. Nagel, Precision spectroscopy with coherent dark states, Applied Physics B 68 (1) (1999) 1–25. doi:10.1007/s003400050581.
- [4] M. Fleischhauer, A. Imamoglu, J. P. Marangos, Electromagnetically induced transparency: Optics in coherent media, Reviews of Modern Physics 77 (2) (2005) 633–673. doi:10.1103/RevModPhys.77.633.
- [5] Z. S. Xu, M. H. Cai, S. H. You, S. S. Zhang, H. P. Liu, Optical-optical double resonance spectroscopy of Rb 5D3/2,5/2 in magnetic fields, Spectrochimica Acta Part B: Atomic Spectroscopy 193 (2022) 106453. doi:10.1016/j.sab.2022.106453.
- [6] R. Finkelstein, S. Bali, O. Firstenberg, I. Novikova, A practical guide to electromagnetically induced transparency in atomic vapor, New Journal of Physics 25 (3) (2023) 035001. doi:10.1088/1367-2630/acbc40.
- [7] A. Lezama, S. Barreiro, A. M. Akulshin, Electromagnetically induced absorption, Physical Review A 59 (6) (1999) 4732–4735. doi:10.1103/PhysRevA.59.4732.
- [8] A. Sargsyan, A. Papoyan, A. Sarkisyan, Y. Malakyan, G. Grigoryan, D. Sarkisyan, Y. Pashayan-Leroy, C. Leroy, Narrow and contrast resonance of increased absorption in Lambda- system observed in Rb cell with buffer gas, Armenian Journal of Physics 2 (2009) 84.
- [9] M. G. Bason, A. K. Mohapatra, K. J. Weatherill, C. S. Adams, Narrow absorptive resonances in a four-level atomic system, Journal of Physics B: Atomic, Molecular and Optical Physics 42 (7) (2009) 075503. doi:10.1088/0953-4075/42/7/075503.
- [10] C. Hancox, M. Hohensee, M. Crescimanno, D. F. Phillips, R. L. Walsworth, Lineshape asymmetry for joint coherent population trapping and three-photon N resonances, Optics Letters 33 (13) (2008) 1536–1538. doi:10.1364/OL.33.001536.
- [11] A. Sargsyan, R. Mirzoyan, A. Papoyan, D. Sarkisyan, N-type resonances in a buffered micrometric Rb cell: splitting in a strong magnetic field, Optics Letters 37 (23) (2012) 4871–4873. doi:10.1364/OL.37.004871.
- [12] D. Slavov, A. Sargsyan, D. Sarkisyan, R. Mirzoyan, A. Krasteva, A. D. Wilson-Gordon, S. Cartaleva, Sub-natural width N-type resonance in cesium atomic vapour: splitting in magnetic fields, Journal of Physics B: Atomic, Molecular and Optical Physics 47 (3) (2014) 035001. doi:10.1088/0953-4075/47/3/035001.
- [13] N. Hayashi, R. Sugizono, K. Harimaya, K. Shijo, K. Tsubota, M. Mitsunaga, Interference between electromagnetically induced transparency and N-type resonances in Na vapor, JOSA B 32 (8) (2015) 1754–1760. doi:10.1364/JOSAB.32.001754.
- [14] A. Krasteva, P. Gosh, S. Gateva, S. Tsvetkov, D. Sarkisyan, A. Sargsyan, T. Vartanyan, S. Cartaleva, Observation and theoretical simulation of N-resonances in Cs lines, Phys. Scr. 95 (2020) 015404.
- [15] A. Sargsyan, Formation of Narrow-Band N-Type Optical Resonance in Vapors of Potassium Atoms, J. Appl. Spectrosc. 89 (2022) 12.
- [16] D. Brazhnikov, S. Ignatovich, V. Vishnyakov, R. Boudot, M. Skvortsov, Electromagnetically induced absorption scheme for vapor-cell atomic clock, Optics Express 27 (25) (2019) 36034–36045. doi:10.1364/OE.27.036034.
- [17] J. A. McKelvy, I. Novikova, E. E. Mikhailov, M. A. Maldonado, I. Fan, Y. Li, Y.-J. Wang, J. Kitching, A. B. Matsko, Application of kernel principal component analysis for optical vector atomic magnetometry, Machine Learning: Science and Technology 4 (4) (2023) 045048. doi:10.1088/2632-2153/ad0fa4.
- [18] I. Novikova, D. F. Phillips, A. S. Zibrov, R. L. Walsworth, A. V. Taichenachev, V. I. Yudin, Cancellation of light shifts in an N-resonance clock, Optics Letters 31 (5) (2006) 622–624. doi:10.1364/OL.31.000622.
- [19] V. V. Vassiliev, S. A. Zibrov, V. L. Velichansky, Compact extended-cavity diode laser for atomic spectroscopy and metrology, Review of Scientific Instruments 77 (1) (2006) 013102. doi:10.1063/1.2162448.
- [20] V. V. Yashchuk, D. Budker, J. R. Davis, Laser frequency stabilization using linear magneto-optics, Review of Scientific Instruments 71 (2) (2000) 341–346. doi:10.1063/1.1150205.
- [21] J. Kitching, Chip-scale atomic devices, Applied Physics Reviews 5 (3) (2018) 031302. doi:10.1063/1.5026238.
- [22] W. Happer, Optical Pumping, Reviews of Modern Physics 44 (2) (1972) 169–249. doi:10.1103/RevModPhys.44.169.
- [23] A. Sargsyan, R. Momier, C. Leroy, D. Sarkisyan, Competing van der Waals and dipole-dipole interactions in optical nanocells at thicknesses below 100 nm, Physics Letters A 483 (2023) 129069. doi:10.1016/j.physleta.2023.129069.
- [24] W. Demtröder, Laser Spectroscopy: Basic Concepts and Instrumentation, Springer Science & Business Media, 2002.
- [25] D. E. Thornton, G. T. Phillips, G. P. Perram, Velocity changing collisions in the laser saturation spectra of 87Rb , Optics Communications 284 (12) (2011) 2890–2894. doi:10.1016/j.optcom.2011.02.057.
- [26] B. A. Olsen, B. Patton, Y. Y. Jau, W. Happer, Optical pumping and spectroscopy of Cs vapor at high magnetic field, Phys. Rev. A 84 (2011) 063410.
- [27] X.-G. Wei, J.-H. Wu, G.-X. Sun, Z. Shao, Z.-H. Kang, Y. Jiang, J.-Y. Gao, Splitting of an electromagnetically induced transparency window of rubidium atoms in a static magnetic field, Physical Review A 72 (2) (2005) 023806. doi:10.1103/PhysRevA.72.023806.
- [28] R. Mottola, G. Buser, P. Treutlein, Electromagnetically induced transparency and optical pumping in the hyperfine Paschen-Back regime, Physical Review A 108 (6) (2023) 062820. doi:10.1103/PhysRevA.108.062820.
- [29] G. A. Pitz, A. J. Sandoval, T. B. Tafoya, W. L. Klennert, D. A. Hostutler, Pressure broadening and shift of the rubidium transition and potassium transitions by various gases with comparison to other alkali rates, Journal of Quantitative Spectroscopy and Radiative Transfer 140 (2014) 18–29. doi:10.1016/j.jqsrt.2014.01.024.
- [30] A. J. Krmpot, M. M. Mijailović, B. M. Panić, D. V. Lukić, A. G. Kovačević, D. V. Pantelić, B. M. Jelenković, Sub-Doppler absorption narrowing in atomic vapor at two intense laser fields, Optics Express 13 (5) (2005) 1448–1456. doi:10.1364/OPEX.13.001448.
- [31] W. Demtröder, Atoms, Molecules and Photons: An Introduction to Atomic-, Molecular- and Quantum Physics, Springer, 2010. doi:10.1007/978-3-642-10298-1.
- [32] A. Tonoyan, A. Sargsyan, R. Momier, C. Leroy, D. Sarkisyan, Formation of Narrow Atomic Lines of Rb in the UV Region Using a Magnetic Field, Optical Memory and Neural Networks 32 (Suppl. 3) (2023) S343–S348. doi:10.3103/S1060992X23070196.
- [33] A. Sargsyan, D. Sarkisyan, L. Margalit, A. D. Wilson-Gordon, Comparison of three EIT-type resonances formed in Rb nanocell, Journal of Modern Optics 63 (17) (2016) 1713–1718. doi:10.1080/09500340.2016.1170903.
- [34] D. Sarkisyan, A. Sargsyan, A. D. Wilson-Gordon, S. Cartaleva, Conversion between electromagnetically induced absorption and transparency in a four-level system, in: 18th International School on Quantum Electronics: Laser Physics and Applications, Vol. 9447, SPIE, 2015, pp. 51–56. doi:10.1117/12.2177887.