1]organization=Department of Electronics, Information, and Bioengineering, Politecnico di Milano, addressline=Via Ponzio 34/5, city=Milan, postcode=20133, country=Italy
[ orcid=0000-0002-6945-2625 ]
Supervision, Conceptualization, Investigation, Writing - Review and Editing
[ orcid=0009-0006-0713-3887 ]
[1]
Investigation, Writing - Original Draft, Writing - Review and Editing, Visualization
[ orcid=0000-0002-8903-0622 ]
Conceptualization, Investigation, Writing - Original Draft, Writing - Review and Editing
[1]Corresponding author
Solid Waste Detection in Remote Sensing Images: A Survey
Abstract
The detection and characterization of illegal solid waste disposal sites are essential for environmental protection, particularly for mitigating pollution and health hazards. Improperly managed landfills contaminate soil and groundwater via rainwater infiltration, posing threats to both animals and humans. Traditional landfill identification approaches, such as on-site inspections, are time-consuming and expensive. Remote sensing is a cost-effective solution for the identification and monitoring of solid waste disposal sites that enables broad coverage and repeated acquisitions over time. Earth Observation (EO) satellites, equipped with an array of sensors and imaging capabilities, have been providing high-resolution data for several decades. Researchers proposed specialized techniques that leverage remote sensing imagery to perform a range of tasks such as waste site detection, dumping site monitoring, and assessment of suitable locations for new landfills. This review aims to provide a detailed illustration of the most relevant proposals for the detection and monitoring of solid waste sites by describing and comparing the approaches, the implemented techniques, and the employed data. Furthermore, since the data sources are of the utmost importance for developing an effective solid waste detection model, a comprehensive overview of the satellites and publicly available data sets is presented. Finally, this paper identifies the open issues in the state-of-the-art and discusses the relevant research directions for reducing the costs and improving the effectiveness of novel solid waste detection methods.
keywords:
Solid Waste Detection \sepRemote Sensing \sepSatellite Images \sepComputer Vision1 Introduction
The detection of illegal solid waste disposal sites is crucial for environmental protection and can help mitigate the effects of global warming and climate change (Ackerman, 2000; Manfredi et al., 2009). Improperly managed landfills most often do not control the emission of toxins that may pollute the environment and cause health risks (Alberti, 2022; Troschinetz and Mihelcic, 2009). Rainwater may also infiltrate the inappropriately disposed waste and produce leachate that contaminates soil and groundwater causing diseases to animals and humans. Last but not least, large garbage deposits exposed to high temperatures emit hot gases and heat, which may eventually lead to subsurface fires difficult to detect and extinguish (Nazari et al., 2020).
Given such risks, searching and characterizing solid waste dumping sites becomes an essential task, traditionally managed with investigations and on-site inspections, which are time-consuming and costly due to the need for specialized personnel and expensive sensing infrastructures. Aerial surveys conducted with drones help speed up the monitoring process but cover limited areas, which must be identified in advance, and require operators on the field to collect images and sensor data.
Remote sensing provides an effective and economic solution for the identification and monitoring of landfills and solid waste disposal sites. The use of satellite data enables the coverage of large regions, eliminates the need for costly infrastructures, helps focus investigations on the most suspicious sites, and allows repeated acquisitions of the same area to follow the evolution of a site over time. Earth Observation (EO) satellites have been deployed for decades and a wide selection of sensors periodically collecting images are available for research or commercial purposes. Thanks to the technological evolution, revisit periods decreased over the years and daily acquisitions of the same location are feasible nowadays. At the same time, sensor resolution increased up to the point that sub-meter resolution images are the standard in modern satellites. With the increase of publicly available satellite images, a growth in the research effort has been registered and many diverse approaches have been proposed to tackle the problem of solid waste dumping site detection. Researchers developed specialized techniques that leverage various aspects of the landfill presence (e.g., visible content, spectral signatures, vegetation stress, surface temperature) for performing different tasks such as the identification of large-scale landfills or smaller dumping sites, monitoring of existing waste sites, and assessment of suitable locations for new landfills.
1.1 Focus of the survey, methodology, and contributions
This review aims to provide a detailed survey of the relevant approaches for the identification and monitoring of solid waste disposal sites and of the data sets and techniques employed for such a task. The relevant research has been identified by following a simplified PRISMA procedure for systematic reviews (Page et al., 2021).
-
1.
The search has been conducted on the Scopus repository, as recommended in Falagas et al. (2008). The search phrases have been composed as follows:
<search> :- <source> AND <task> AND <subject>
<source> :- satellite images | satellite data |
            remote sensing | geographic information system
<task> :- detection | identification
<subject> :- waste | illegal dumping sites |
             illegal landfills | waste disposal sites
The output of the search was filtered to retain only contributions from journals, conferences, and workshops.
-
2.
The initial corpus has been expanded by adding related studies citing or cited by the works in the initial corpus.
-
3.
The expanded corpus, composed of 1294 works, has been reduced by removing duplicates. Next, we eliminated the studies unrelated to the focus of the survey, by checking the title, keywords, and abstract of each contribution. The reduced corpus contained 78 contributions.
-
4.
A final eligibility filter has been applied by reading the articles in the reduced corpus. This final step yielded the 48 works considered in this survey.
The main contributions of the survey can be summarized as follows:
-
•
The most relevant papers presented in the literature for the detection and monitoring of landfills are identified and selected.
-
•
The papers in the identified corpus are described and compared based on different aspects (year, country, focus, implemented technique, employed data).
-
•
A detailed overview of the satellites and publicly available data sets that can be used for the development of solid waste detection models is presented.
-
•
The most significant open issues and relevant research directions are identified and discussed. The open issues are mainly methodological. The solid waste detection field currently lacks a standard benchmark for the assessment and comparison of competing approaches, based on a large and global data set of remote sensing images and on well-defined inference tasks supported by agreed-upon performance evaluation metrics. This hinders the appraisal of the research progression and the development of methodologically sound guidelines for practitioners facing waste management problems. The future research directions are extremely exciting. The waste detection challenge can benefit from such astounding innovations in the Computer Vision (CV) arena as Vision Transformers (Vaswani et al., 2017), billion-scale foundation models (Cha et al., 2023) and visual language models (Radford et al., 2021). However, such breakthrough achievements have exercised their positive effects mostly in the domain of natural image analysis and thus many opportunities for improvement are open for remote sensing tasks in general (Wen et al., 2023) and for waste detection research in particular.
The review is organized as follows: Section 2 overviews the relevant approaches along with a description of their focuses. Section 3 presents the satellites and data sets available for research purposes, Section 4 discusses the techniques implemented by the papers, Section 5 highlights the open issues and discusses the relevant research directions and finally, Section 6 draws the conclusions.
2 Approaches to solid waste detection in Remote Sensing data
Table LABEL:tab:approaches_table lists the 48 analyzed papers with the names of the authors, the publication year, the countries of interest, and the focus of the research. The reported countries refer to the locations of the data used for the research.
| 1 | |||||||
|---|---|---|---|---|---|---|---|
| Number | Reference | Year | Countries | Research focus | |||
| 2 | Lyon | 1987 | USA | Landfill or sparse waste detection | |||
| 3 | Salleh and Tsudagawa | 2002 | Japan | Landfill or sparse waste detection | |||
| 4 | Notarnicola et al. | 2004 | Italy | Landfill or sparse waste detection | |||
| 5 | Silvestri and Omri | 2008 | Italy | Landfill or sparse waste detection | |||
| 6 | Biotto et al. | 2009 | Italy | Illegal dumping distribution characterization | |||
| 7 | Viezzoli et al. | 2009 | Italy | Landfill or sparse waste detection | |||
| 8 | Chinatsu | 2009 | Japan | Landfill sites monitoring | |||
| 9 | Shaker and Yan | 2010 | Canada | Landfill sites monitoring | |||
| 10 | Shaker et al. | 2011 | Canada | Landfill sites monitoring | |||
| 11 | Bilotta et al. | 2012 | Italy | Landfill or sparse waste detection | |||
| 12 | Cadau et al. | 2013 | Italy | Landfill sites detection and monitoring | |||
| 13 | Jordá-Borrell et al. | 2014 | Spain | Mapping of areas with high risk of illegal waste dumping | |||
| 14 | Alexakis and Sarris | 2014 | Greece | Assessment of suitable landfill locations | |||
| 15 | Yan et al. | 2014 | Canada | Landfill sites monitoring | |||
| 16 | Beaumont et al. | 2015 | Belgium | Landfill or sparse waste detection | |||
| 17 | Lucendo-Monedero et al. | 2015 | Spain | Mapping of areas with high risk of illegal waste dumping | |||
| 18 | Agapiou et al. | 2016 | Greece | Landfill or sparse waste detection | |||
| 19 | Richter et al. | 2017 | Russia | Waste heat contamination monitoring | |||
| 20 | Di Fiore et al. | 2017 | Italy | Landfill or sparse waste detection | |||
| 21 | Manzo et al. | 2017 | Italy | Landfill sites monitoring | |||
| 22 | Seror and Portnov | 2018 | Israel | Mapping of areas with high risk of illegal waste dumping | |||
| 23 | Gill et al. | 2019 | Kuwait | Landfill or sparse waste detection | |||
| 24 | Abd-El Monsef and Smith | 2019 | Egypt | Assessment of suitable landfill locations | |||
| 25 | Vambol et al. | 2019 | Ukraine | Landfill or sparse waste detection | |||
| 26 | Quesada-Ruiz et al. | 2019 | Spain | Illegal dumping distribution characterization | |||
| 27 | Faizi et al. | 2020 | Pakistan | Landfill sites monitoring | |||
| 28 | Fazzo et al. | 2020 | Italy | Landfill sites monitoring | |||
| 29 | Nazari et al. | 2020 | USA | Identification of landfills subsurface fires | |||
| 30 | Devesa and Brust | 2021 | Argentina | Landfill or sparse waste detection | |||
| 31 | Parrilli et al. | 2021 | Italy | Landfill or sparse waste detection | |||
| 32 | Torres and Fraternali | 2021 | Italy | Landfill or sparse waste detection | |||
| 33 | Kremezi et al. | 2021 | Greece | Landfill or sparse waste detection | |||
| 34 | Taggio et al. | 2022 | Greece | Landfill or sparse waste detection | |||
| 35 | Yang et al. | 2022 | China | Landfill or sparse waste detection | |||
| 36 | Rajkumar et al. | 2022 |
|
Landfill or sparse waste detection | |||
| 37 | Aslam et al. | 2022 | Pakistan | Assessment of suitable landfill locations | |||
| 38 | Karimi and Ng | 2022 | Canada | Mapping of areas with high risk of illegal waste dumping | |||
| 39 | Azmi et al. | 2022 | Malaysia | Landfill or sparse waste detection | |||
| 40 | Karimi et al. | 2022 | Canada | Mapping of areas with high risk of illegal waste dumping | |||
| 41 | Didelija et al. | 2022 | Bosnia-Herzegovina | Landfill or sparse waste detection | |||
| 42 | Abou El-Magd et al. | 2022 | Egypt | Landfill sites monitoring | |||
| 43 | Yailymova et al. | 2022 | Ukraine | Landfill sites monitoring | |||
| 44 | Zhou et al. | 2022 | China | Landfill or sparse waste detection | |||
| 45 | Lavender | 2022 |
|
Landfill or sparse waste detection | |||
| 46 | Kruse et al. | 2023 | Asia | Landfill or sparse waste detection | |||
| 47 | Révolo-Acevedo et al. | 2023 | Peru | Assessment of suitable landfill locations | |||
| 48 | Sun et al. | 2023 |
|
Landfill or sparse waste detection | |||
| 49 | Ulloa-Torrealba et al. | 2023 | Colombia | Landfill or sparse waste detection |
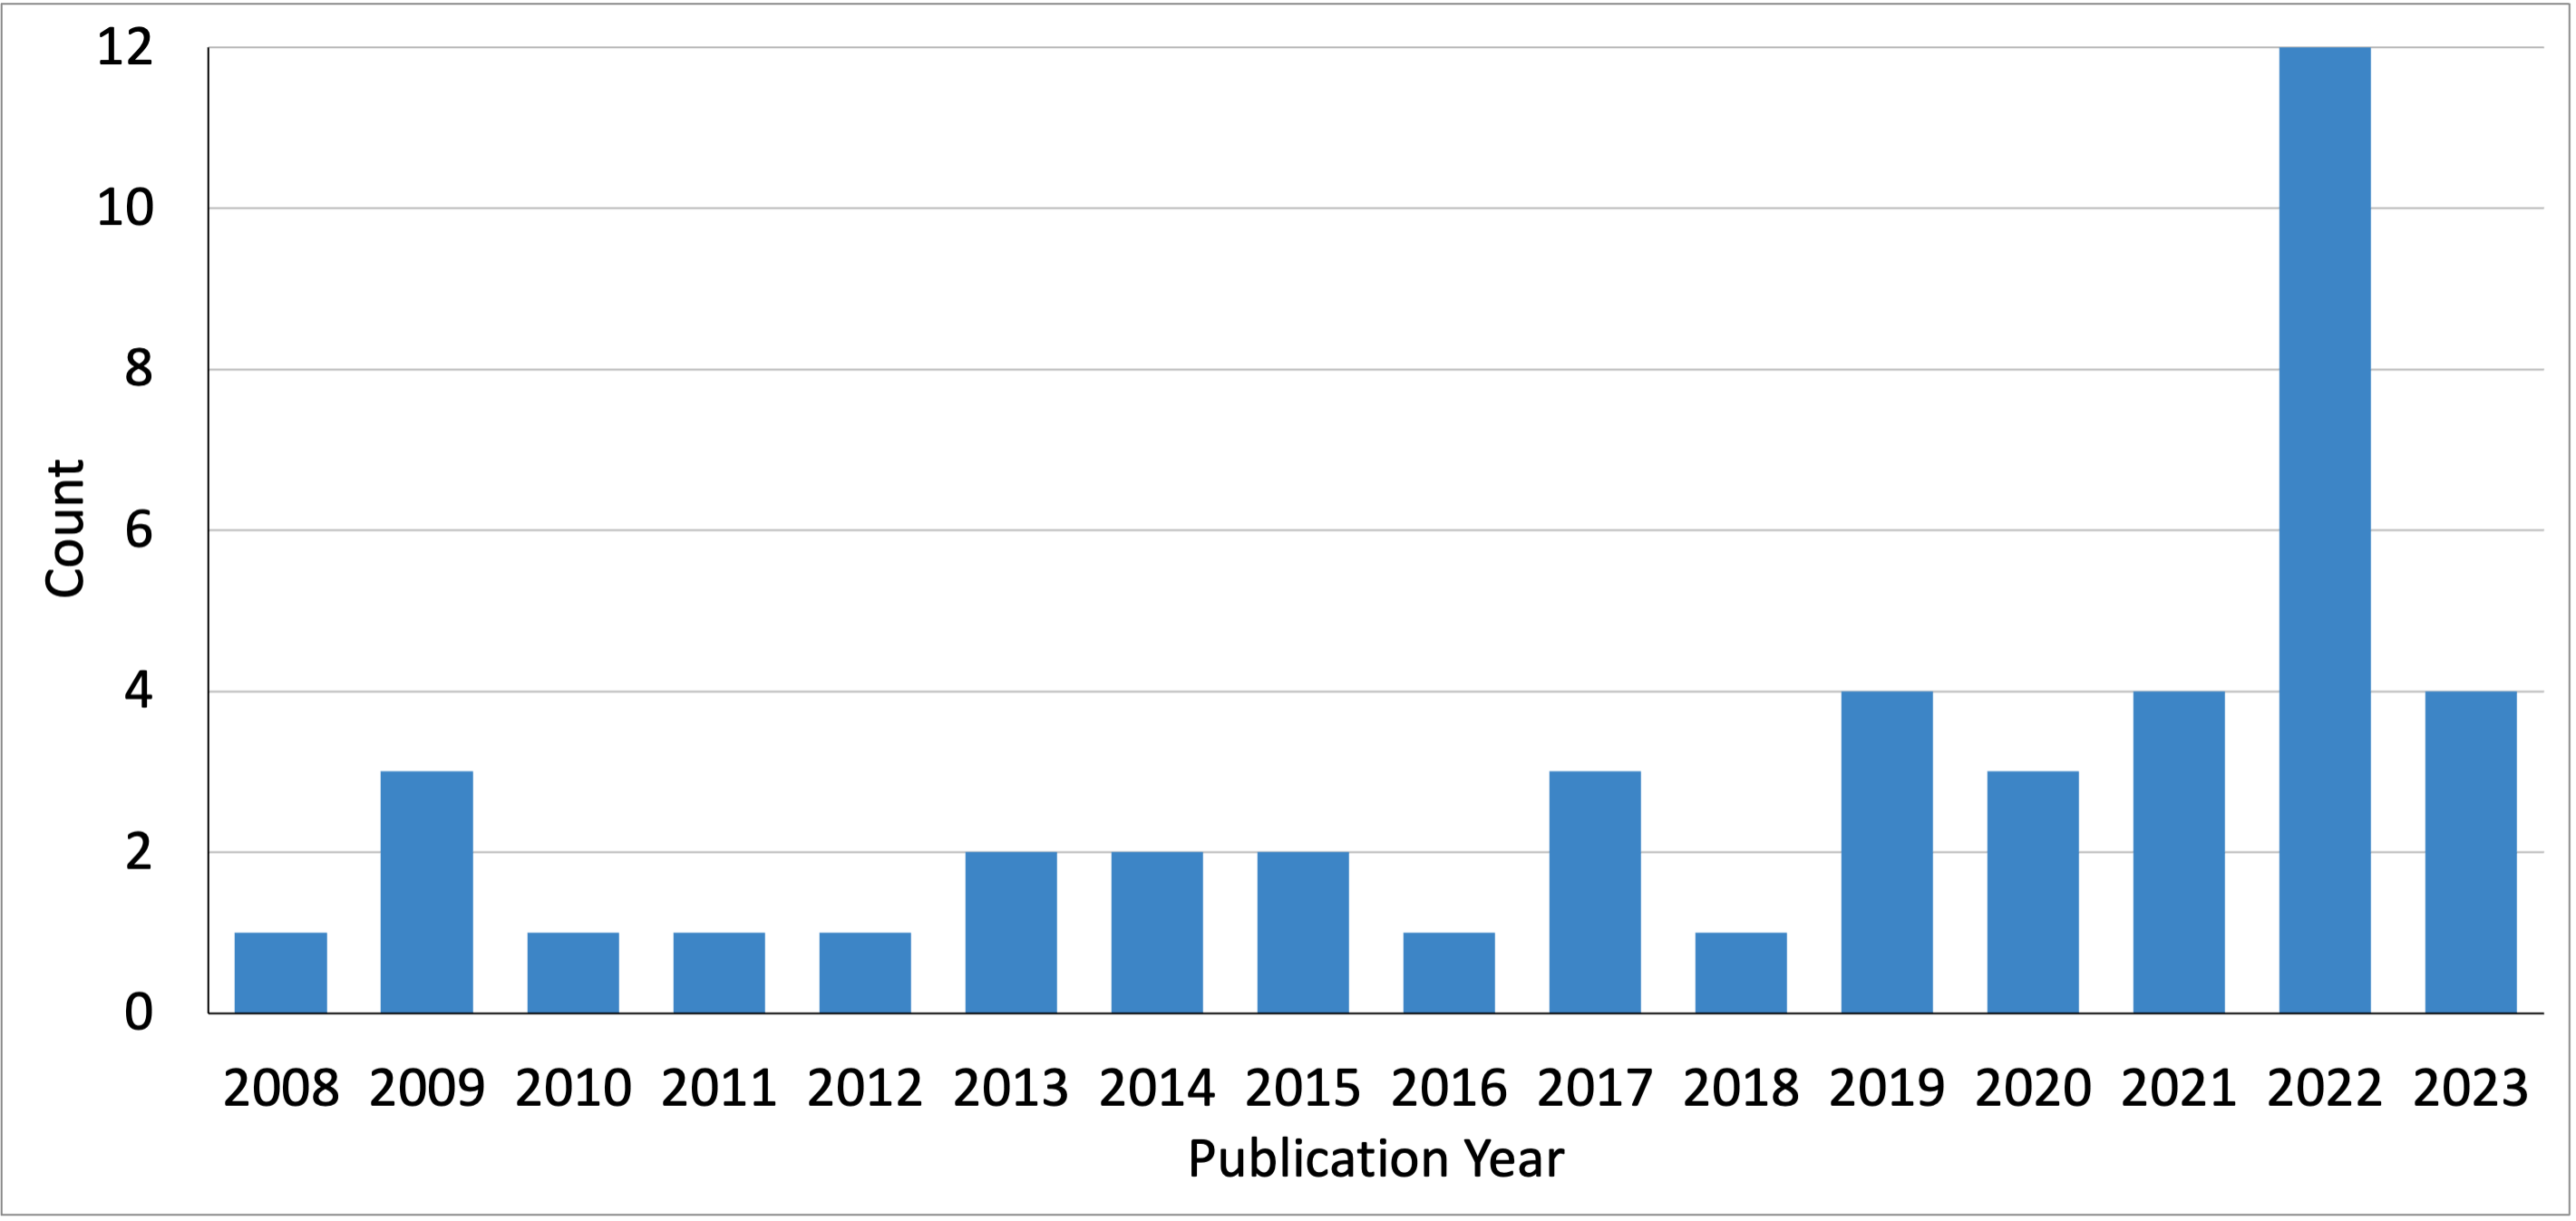
Figure 1 shows an increasing temporal trend with a peak of published papers in 2022. The initial experiments on the use of satellite images to identify waste sites are from the early 2000s, with the first application dating back to 1987, a few years after the deployment of the first satellites offering access to EO data.
Researchers from all over the world have addressed the solid waste disposal issue but the majority of the case studies are focused on specific regions. The mentioned countries refer to the geographical position of the data collected for training and evaluating the proposed methods, which gives a hint about where the problem of illegal landfilling is more urgent. As Figure 2 shows, more than 40% of the relevant proposals are focused in Europe followed by 33% in Asia. However, the improper management and disposal of waste remain a global issue as demonstrated by the diversity of places and the variety of land cover (e.g. desert, urban area, forest, marine environment, etc.).
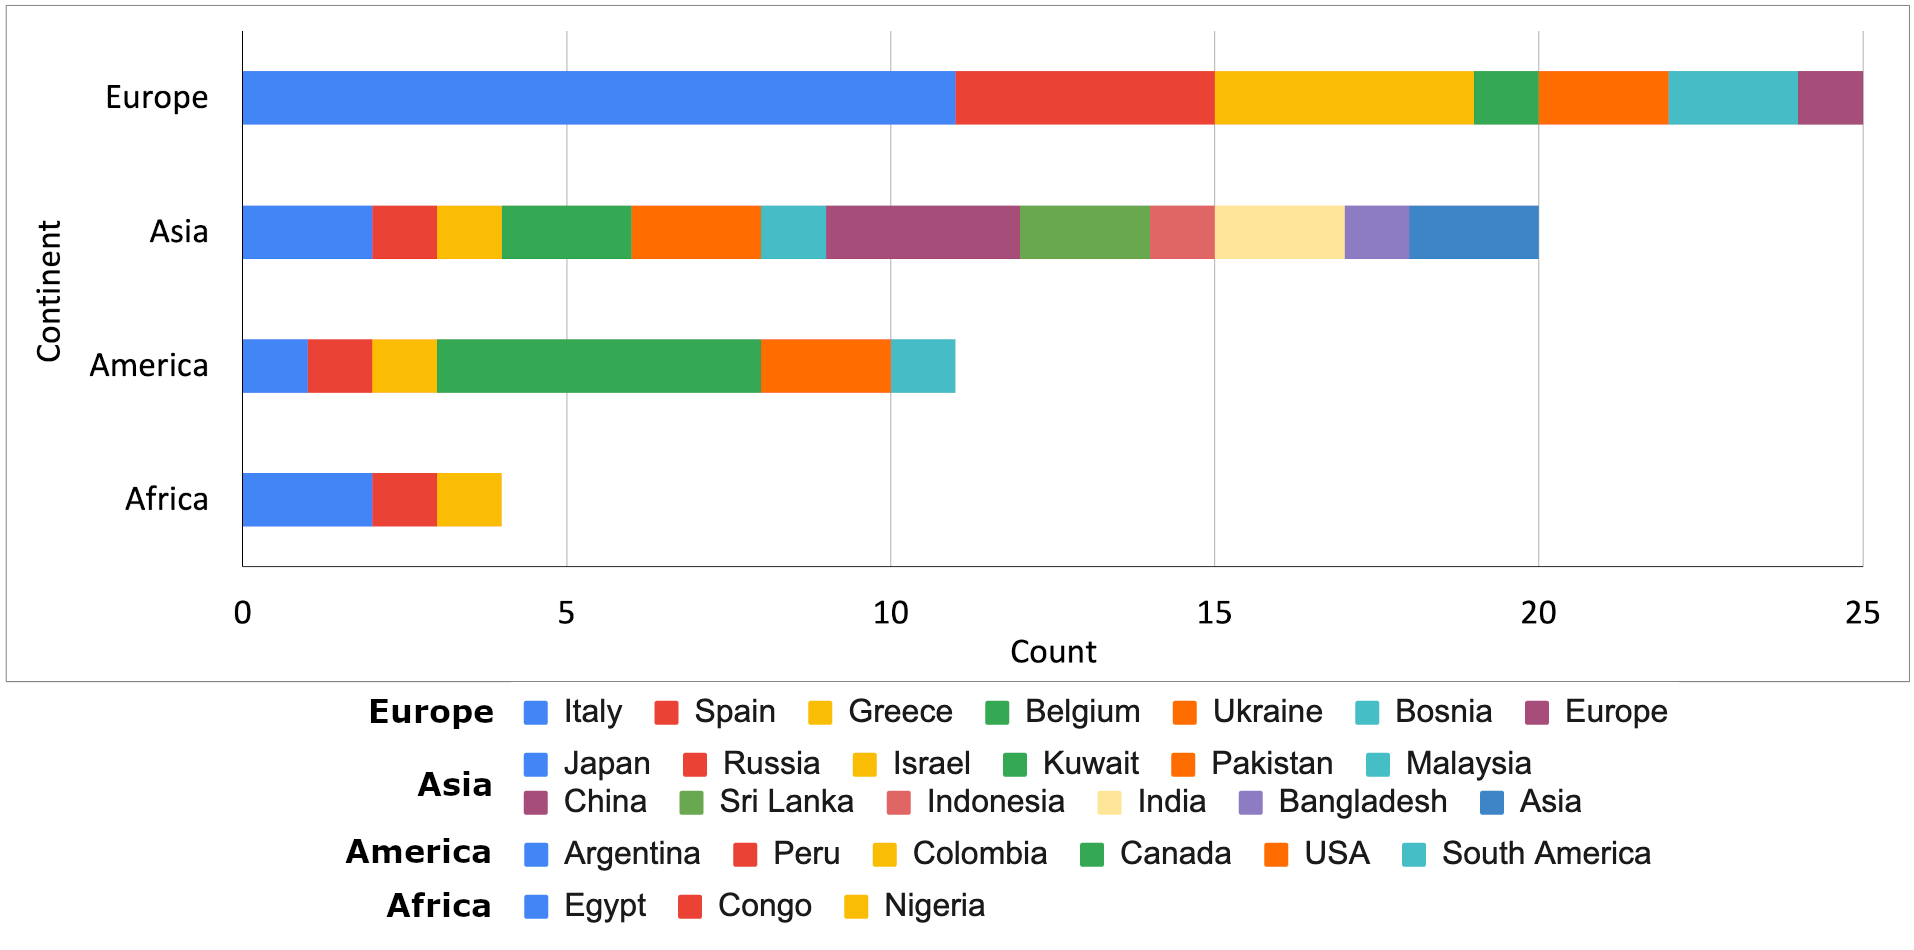
In Europe, Italy is the country that is more actively researching methods to identify illegal landfills. The country is known for the frequent discovery of unauthorized waste disposal that can harm the health of local people (Alberti, 2022). Spain and Greece are the second most active countries and few works are located in other European regions.
2.1 Solid waste detection tasks
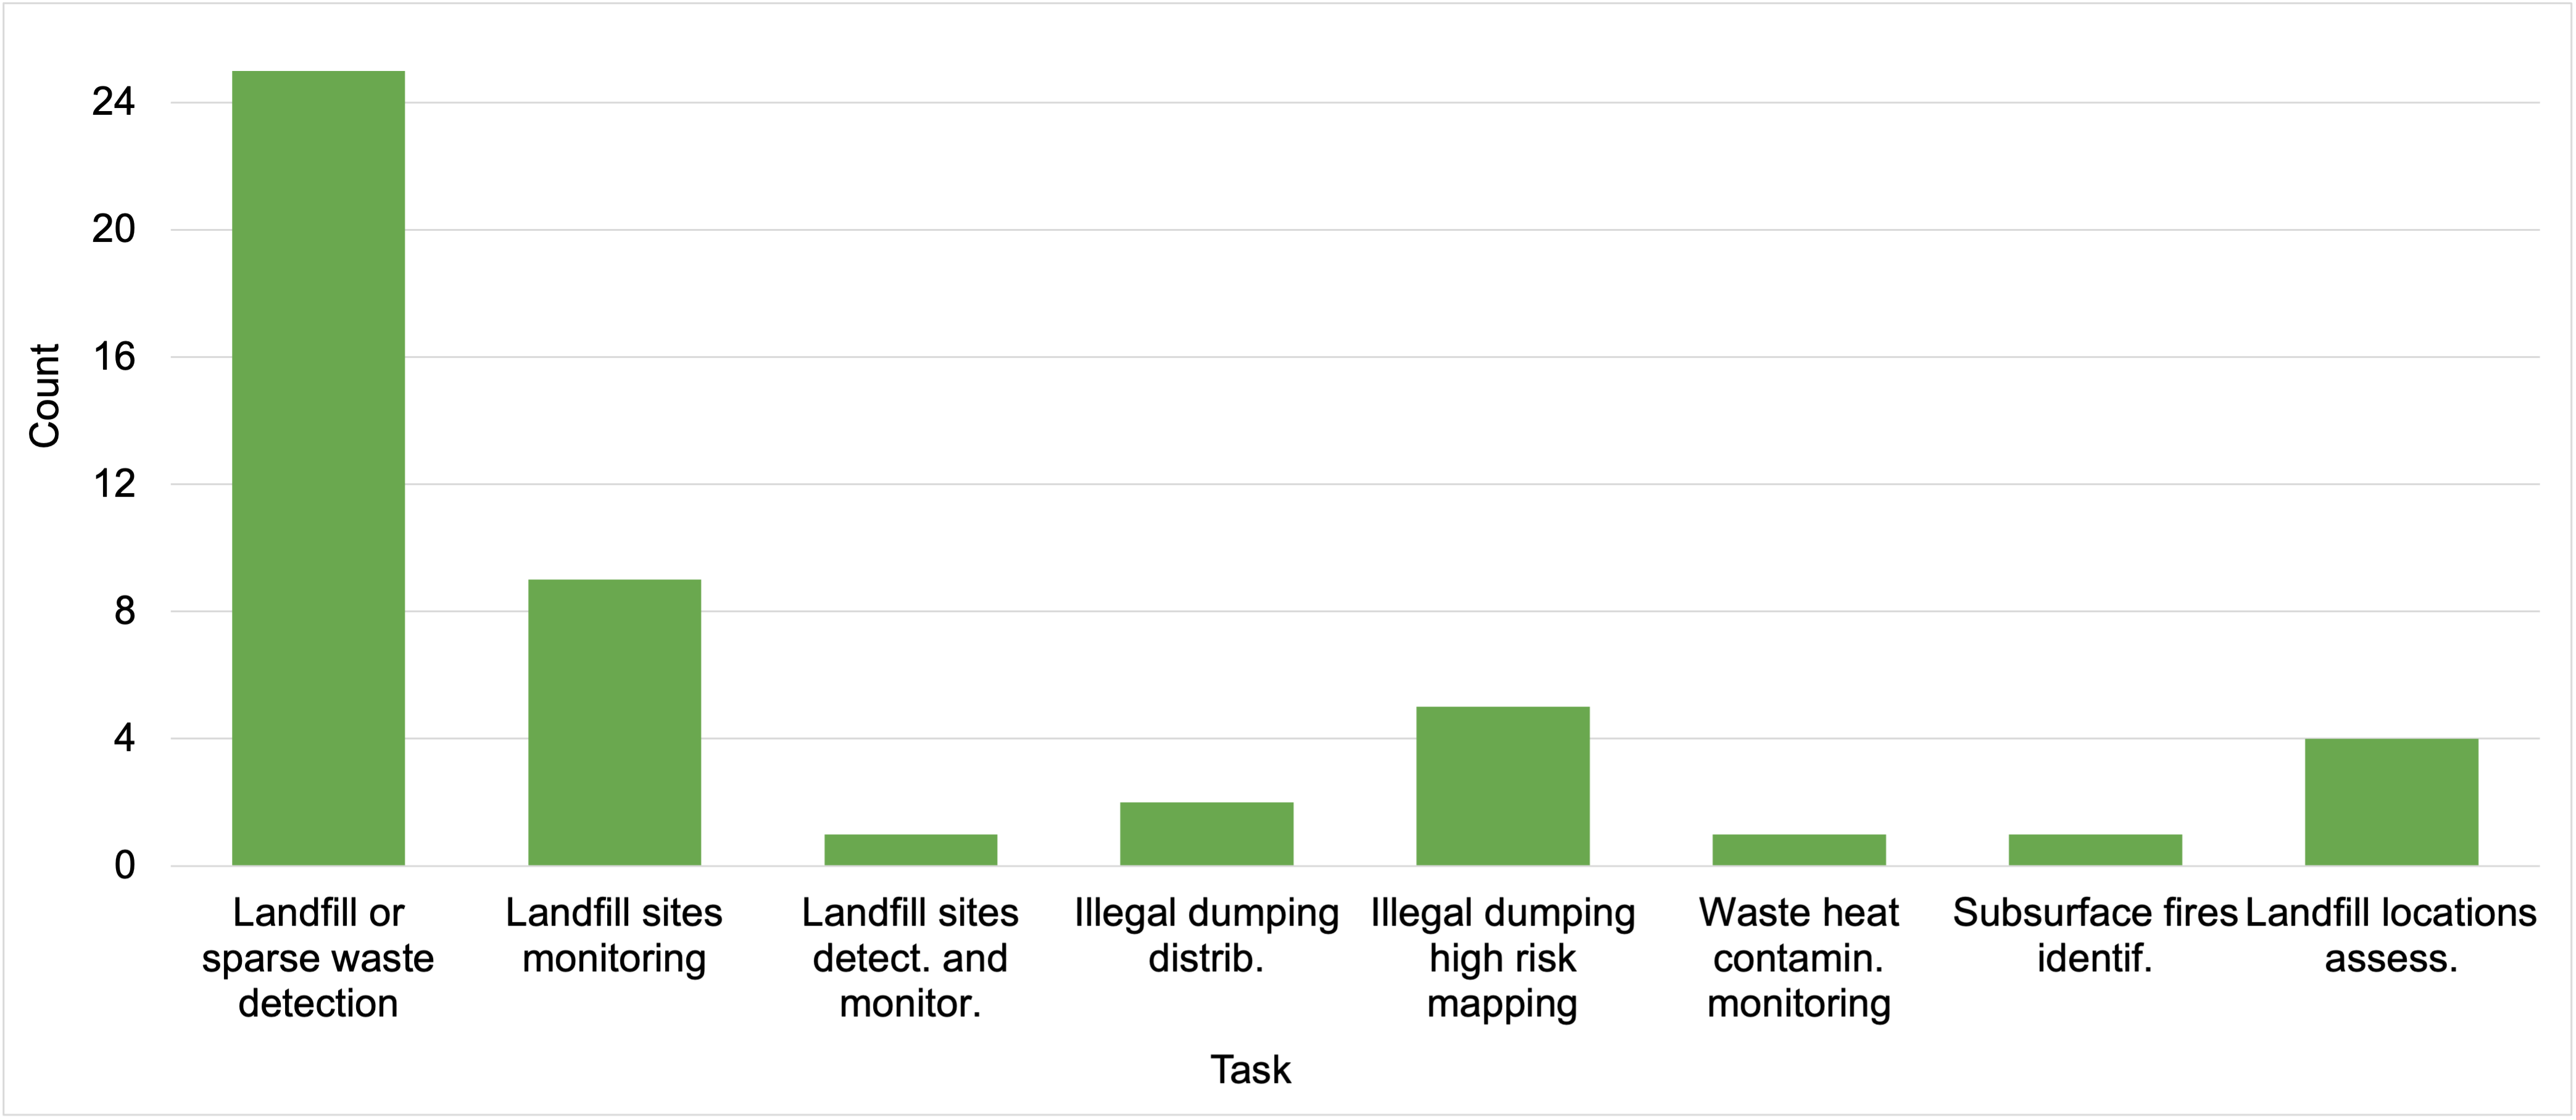
The approaches proposed in the literature can be grouped into categories that, under the common goal of detecting and monitoring solid waste disposal sites, tackle specific problems. Figure 3 shows the distribution of papers across the various tasks. Some approaches present a general methodology for detecting and monitoring landfills that can be employed in many use cases. Other works describe more specific scenarios, such as Agapiou et al. (2016), which proposes a method to identify olive oil mill waste in satellite images, or Nazari et al. (2020), which detects subsurface fires in landfills.
Landfill or sparse waste detection The papers in this category have the main purpose of detecting the presence of solid waste in remote sensing data. Some work focuses on landfill sites where a significant amount of accumulated garbage is visible and therefore it is possible to apply techniques that are not particularly accurate, proving effective thanks to the large size of the area covered by the landfill (Vambol et al., 2019). For instance, in Gill et al. (2019) satellite measurements in the infrared spectrum are used to estimate the heat flux, which is higher in waste dumping areas. Similarly, Beaumont et al. (2014) uses the identified thermal anomalies in the surface temperature as an indicator of the presence of major landfills. Other approaches are based on the identification of stressed vegetation (Silvestri and Omri, 2008), which is caused by the leachate released by the accumulated solid waste, or aim at detecting large landfills through the integration of geological and geophysical data (Di Fiore et al., 2017; Viezzoli et al., 2009).
On the other side, some research works target small dump sites in urban environments, which can be more challenging due to the confusion induced by the surrounding background or by authorized solid waste disposal areas. In (Didelija et al., 2022) and (Devesa and Brust, 2021), potential illegal landfill sites in urban areas are detected while Torres and Fraternali (2021) focuses on the identification of unauthorized solid waste deposits from RGB photogrammetry imagery. Other approaches work at the urban scale: for example, (Azmi et al., 2022) aims to detect scattered waste in urban locations and (Ulloa-Torrealba et al., 2023) identifies residual urban waste on the streets. Some other works narrow the viewpoint to specific types of solid waste: Yang et al. (2022) localizes demolition waste in construction sites. Agapiou et al. (2016) identifies waste produced by olive mills that may contain high concentrations of hazardous pollutants. The authors use traditional vegetation indices and propose a novel domain-specific index named Olive Oil Mill Waste Index (OOMWI). Other approaches focus on searching aggregations of plastic waste. For instance, Lavender (2022) combines vegetation indices with terrain morphology information to detect plastic waste in marine and terrestrial environments. Kremezi et al. (2021) proposes a set of domain-specific spectral indices for detecting plastic waste in marine environments and, similarly, Taggio et al. (2022) classifies each pixel of a pansharpened image to detect plastic litter floating on seawater.
Landfill sites monitoring Some of the approaches present techniques to exploit EO data for monitoring existing landfills (Shaker et al., 2011; Yan et al., 2014; Manzo et al., 2017). Other papers propose methods to monitor known solid waste disposal locations to assess the impact on the environment (Shaker and Yan, 2010) and ensure that waste management activities are appropriately executed (Chinatsu, 2009). In Yailymova et al. (2022) landfills are periodically monitored to analyze changes over time using historical and recent satellite data.
Landfill sites detection and monitoring Works in this category make a combination of the two previous classes: first landfills are detected and then are constantly monitored to identify any changes. In Cadau et al. (2013), new potential landfills are detected by combining vegetation indices and anomalies in the surface temperature. Then, the identified waste sites are monitored using SAR information to identify variations in the landfill surface.
Illegal dumping distribution characterization Another line of research aims at integrating remote sensing data and geographical variables such as road networks, land use maps, and location of residential areas to characterize the distribution of illegal dumps (Biotto et al., 2009; Quesada-Ruiz et al., 2019).
Mapping of areas with a high risk of illegal waste dumping The approaches define a probabilistic map of the areas with a higher likelihood of the presence of an illegal landfill. In Jordá-Borrell et al. (2014) and Seror and Portnov (2018), a wide selection of geolocalized variables is combined to predict areas at risk, while in Karimi and Ng (2022) geographical data combined with remote sensing indices are used to classify candidate locations. The approach proposed in Lucendo-Monedero et al. (2015), after estimating the areas with the highest likelihood of occurrence of illegal landfills, exploits the derived distribution as a predictive model to classify suspicious sites.
Waste heat contamination monitoring In Richter et al. (2017), a thermal model of solid waste disposal sites is developed to assess the heat contamination in the surrounding environment. The purpose of this research is to identify possible large-scale solid waste contamination that may be hazardous to the environment.
Identification of subsurface fires within landfills In Nazari et al. (2020), the Land Surface Temperature (LST) is used to identify and monitor the extension of subsurface fires in landfill areas. This phenomenon may happen due to high-temperature gas emissions produced by waste constrained in a limited space, especially during summer.
Assessment of suitable landfill locations Finally, this category includes works that deal with the analysis and selection of the most appropriate locations to build a new landfill to minimize environmental risk. In Révolo-Acevedo et al. (2023), based on remotely sensed data, the physical and biological conditions of existing landfills are analyzed to derive a map indicating the best areas for placing a new solid waste site. Similarly in Alexakis and Sarris (2014), Abd-El Monsef and Smith (2019) and Aslam et al. (2022), the optimal position for locating a new landfill is derived by combining remote sensing vegetation indices and geographical data.
3 Available satellites and resources
Satellites for EO had huge improvements in the last 50 years. Today 30cm resolution with less than a day revisit time is possible. Most missions offer some level of access to research projects and a few programs provide full access to the historical data and quotas for the current ones.
3.1 Satellites
In this Section, we summarize the most common satellite missions used in landfill detection research and their capabilities and products.
WorldView Series111https://earth.esa.int/eogateway/missions/worldview: they are owned by Maxar222https://www.maxar.com/ and their data can be accessed via the European Space Agency (ESA). WorldView-1 includes panchromatic-only instruments that provide black and white images with 50cm Ground Sampling Distance (GSD) and a revisit frequency of 1.7 days at 1m GSD or less. WorldView-2 collects panchromatic and 8-band multispectral imagery, which includes Visible Near-Infrared (VNIR). Panchromatic images have 0.46m GSD and multi-band images have 1.8m GSD. The revisiting frequency is 1.1 days. WorldView-3 includes also 8 Shortwave Infrared (SWIR) bands and 12 CAVIS (Clouds, Aerosols, Vapors, Ice, Snow) bands. GSD is 0.31m for panchromatic, 1.24m for VNIR, 3.7m for SWIR, and 30m for CAVIS. The revisiting frequency is less than a day at 1m GSD (at 40º N latitude). WorldView-4 formerly known as GeoEye-2, was launched in 2016 with the objective of providing large area single pass (synoptic) collection. It offered better geolocation accuracy with respect to its predecessor and bi-directional scanning with daily revisits. The satellite stopped working in 2019, but the archive data is available.
GeoEye-1333https://earth.esa.int/eogateway/missions/geoeye-1: It is also part of the WorldView series and is optimized for large projects because it can collect over 350,000 km2 of Very High Resolution (VHR) images per day. It provides panchromatic and VNIR multispectral imagery at 0.41m and 1.64m GSD respectively, with a geo-location accuracy of 3m. Revisit time is 1.7 days at 1m GSD and 3 days at 0.41m GSD.
Copernicus Programme444https://www.copernicus.eu/en: It is an EO program established by the European Commission in collaboration with ESA (Jutz and Milagro-Pérez, 2018) with most data open to citizens and institutions. The missions include radar and super-spectral imaging for land, ocean, and atmospheric monitoring. Each mission had specific objectives:
-
•
Sentinel-1: launched in 2014 with a C-band Synthetic Aperture Radar (C-SAR), it provides all-weather day-and-night imagery. Four acquisition modes are used depending on the area to cover with resolutions of 5x5m, 5x20m, 20x40m, and average revisit time from less than 1 day to 3 days.
-
•
Sentinel-2: launched in 2015 with a multispectral sensor with 13 channels in the VNIR and SWIR spectral range, it provides 10m GSD and revisit time of 5 days around the equator and 2 to 3 days for mid-latitudes. One of its main applications is land classification.
-
•
Sentinel-3 and other missions: other posterior missions, such as Sentinel-3, Sentinel-5P, and Sentinel-6 feature multiple payloads but are more oriented towards the monitoring of the atmosphere and the collection of accurate topographic measurements, and thus their data are not employed for land use and waste detection.
Pléiades Missions555https://earth.esa.int/eogateway/missions/pleiades: is an environment-focused constellation owned by the French Space Agency (CNES) and operated by AirBus. Data are provided by ESA for approved projects or can be acquired from AirBus666https://www.intelligence-airbusds.com/imagery/constellation/pleiades/. Pléiades: it features multispectral, optical, and VNIR sensors with 0.5m GSD for panchromatic images and 2m GSD for multispectral images. Location accuracy is 1m with ground control points (GCP) and 20m without GCP. Pléiades Neo: provides a spatial resolution of 0.3m for panchromatic spectral bands and 1.2m for multispectral bands. Revisit time is twice a day anywhere with an accuracy of less than 5m.
LandSat777https://landsat.gsfc.nasa.gov/: is an EO program started by NASA in 1972 for land monitoring and applications in agriculture, cartography, geology, forestry, regional planning, surveillance, and education. Some data are freely available or can be requested through the United States Geological Survey (USGS). Two satellite missions are still active. Landsat 8 features an Operational Land Imager (OLI) sensor, which provides panchromatic, optical, NIR, SWIR, and coastal aerosol, and a Thermal InfraRed Sensor (TIRS), which collects infrared images. It delivers 15m panchromatic and 30m multispectral GSD. Landsat 9 features enhanced versions of the sensors (OLI-2 and TIRS-2). The radiometric resolution for OLI-2 is improved enabling sensors to detect more subtle differences.
SPOT888https://earth.esa.int/eogateway/missions/spot: is a commercial high-resolution EO satellite system initiated by the French space agency and currently operated by Spot Image and AirBus. It supports climatology and oceanography studies and the monitoring of human activities. The data of the SPOT mission 1 to 5 is freely available through ESA, whereas current mission data can be acquired from AirBus. The currently active missions are SPOT 6 and SPOT 7. The former provides panchromatic, optical, and VNIR imagery at 1.5m GSD for panchromatic images and 6m GSD for multispectral ones with a revisit time of 1 to 3 days with a single satellite and 1 day with multiple satellites. The latter carries a SPOT Vegetation sensor operating in four spectral bands (blue, red, near-infrared, and middle-infrared) designed to study the spatial and temporal evolution of vegetation at multiple scales.
COSMO-SkyMed999https://earth.esa.int/eogateway/missions/cosmo-skymed: funded by the Italian Ministry of Research and by the Italian Ministry of Defence for military and civil applications, supports cartography, forest and environment protection, natural resources exploration, land management, defence and security, maritime surveillance, food and agriculture management. The current second generation uses a SAR sensor with 5 modes to produce imagery with resolutions ranging from 0.3x0.5m to 40x6m. Data can be accessed through ESA for approved research projects and acquired from e-GEOS101010https://www.e-geos.it/en/.
ALOS111111https://earth.esa.int/eogateway/missions/alos: The Advanced Land Observing Satellite (ALOS), managed by the Japanese Aerospace Exploration Agency (JAXA), supports applications such as cartography, regional observation, disaster monitoring, and resource survey. The ALOS-2 satellite operates a Phased Array L-band Synthetic Aperture Radar (PALSAR) and a Compact InfraRed Camera (CIRC), with multiple operation modes and resolutions ranging from 1x3m for 25 km2 scan to 100m for 490km swath. ALOS-1 data can be accessed through ESA and ALOS-2 data can be acquired from PASCO121212https://alos-pasco.com/.
Terra131313https://terra.nasa.gov/: is a scientific satellite operated by NASA under the Earth Observing System (EOS) for taking atmosphere, land, and water measurements and for monitoring human activity. Terra carries 5 sensors: Advanced Spaceborne Thermal Emission and Reflection Radiometer (ASTER) creates high-resolution images of clouds, ice, water, and land with 3 sensor subsystems (SWIR, TIR, and VNIR); Clouds and the Earth’s Radiant Energy System (CERES); Multi-angle Imaging SpectroRadiometer (MISR); Moderate-resolution Imaging Spectroradiometer (MODIS) and Measurements of Pollution in the Troposphere (MOPITT). Terra images have 15m GSD for SWIR, 30m for VNIR, and 90m for TIR with 60km swath. Data is freely available.
PRISMA141414https://www.asi.it/scienze-della-terra/prisma/: is a medium-resolution EO satellite mission developed and operated by the Italian Space Agency (ASI) with the primary objective of imaging land, vegetation, inner waters and coastal zones. The PRISMA satellite is equipped with a hyperspectral sensor that operates in the VNIR and SWIR bands with a 30m GSD and a panchromatic sensor with a 5m ground resolution. Data products can be requested after registration on the ASI website151515https://prismauserregistration.asi.it/.
Gaofen-2161616https://www.eoportal.org/satellite-missions/gaofen-2: is the second high-resolution EO satellite developed by China National Space Administration (CNSA) as part of CHEOS (China High-resolution Earth Observation System) program. The mission supports applications in the agriculture, disaster, resource, and environment fields. The satellite is equipped with two panchromatic sensors and two multispectral sensors that are combined to increase the swath width up to 45.3km. The spatial resolution of the panchromatic sensors is 0.8m while the multispectral sensors have a 3.2m GSD. The revisit time is in the range of 4-69 days, depending on the specific application.
Other satellite missions have been deployed for medium or high resolution multispectral and hyperspectral imaging, such as EnMAP171717https://www.eoportal.org/satellite-missions/enmap, Resurs-P181818https://www.eoportal.org/satellite-missions/resurs-p, PROBA-1191919https://www.eoportal.org/satellite-missions/proba-1, GHOSt202020https://www.eoportal.org/satellite-missions/ghost, Aleph-1 constellation212121https://www.eoportal.org/satellite-missions/satellogic. However, at the time of publication of this survey, no paper in the literature leverages the data produced from such missions for solid waste detection activities.
Although very high-resolution imagery is available nowadays, it is important to evaluate the data requirements because there is a direct relation between resolution and cost, not only for data acquisition but also for storage and processing. Finding the balance between cost, data quality (resolution), timeliness (revisit time) and the desired results is a key aspect in the design of waste detection solutions.
Table LABEL:tab:satellites_table summarises the satellites and sensor data used by the analyzed papers.
| Mission | Papers numbers | Payload | Resolution | Revisit time (days) | |||||||
|---|---|---|---|---|---|---|---|---|---|---|---|
| WorldView-1 | LABEL:appr:vambol2019nature | Panchromatic | 0.5m | 1.7 | |||||||
| WorldView-2 | LABEL:appr:agapiou2016monitoring, LABEL:appr:manzo2017top, LABEL:appr:rajkumar2022detecting, LABEL:appr:zhou2023swdet |
|
|
1.1 | |||||||
| WorldView-3 | LABEL:appr:rajkumar2022detecting |
|
|
1 | |||||||
| GeoEye-1 | LABEL:appr:agapiou2016monitoring, LABEL:appr:vambol2019nature, LABEL:appr:rajkumar2022detecting |
|
|
|
|||||||
| Sentinel-1 | LABEL:appr:lavender2022detection | SAR | 5-40m | 1-3 (based on latitude) | |||||||
| Sentinel-2 | LABEL:appr:faizi2020satellite, LABEL:appr:devesa2021mapping, LABEL:appr:kruse2023satellite, LABEL:appr:yailymova2022neural, LABEL:appr:lavender2022detection | Multispectral | 10-60m |
|
|||||||
| Pléiades | LABEL:appr:agapiou2016monitoring, LABEL:appr:manzo2017top, LABEL:appr:vambol2019nature, LABEL:appr:parrilli2021illegal, LABEL:appr:azmi2022landfill, LABEL:appr:djidelija2022segmentation |
|
|
1 | |||||||
| Landsat 4 | LABEL:appr:richter2017estimation |
|
|
16 | |||||||
| Landsat 5 | LABEL:appr:notarnicola2004southern, LABEL:appr:shaker2010trail, LABEL:appr:shaker2011integration, LABEL:appr:yan2014analysis, LABEL:appr:beaumont2014assessment, LABEL:appr:gill2019detection, LABEL:appr:nazari2020application, LABEL:appr:abou2022qualitative |
|
|
16 | |||||||
| Landsat 7 | LABEL:appr:alexakis2014integrated, LABEL:appr:beaumont2014assessment, LABEL:appr:gill2019detection |
|
|
16 | |||||||
| Landsat 8 | LABEL:appr:richter2017estimation, LABEL:appr:abd2019integrating, LABEL:appr:faizi2020satellite, LABEL:appr:nazari2020application, LABEL:appr:aslam2022identifying, LABEL:appr:karimi2022development, LABEL:appr:abou2022qualitative, LABEL:appr:yailymova2022neural, LABEL:appr:revolo2023analyzing |
|
|
16 | |||||||
| SPOT 4 | LABEL:appr:alexakis2014integrated |
|
|
26 | |||||||
| SPOT 5 | LABEL:appr:cadau2013simdeo, LABEL:appr:quesada2019characterization |
|
|
26 | |||||||
| SPOT 6 | LABEL:appr:agapiou2016monitoring, LABEL:appr:zhou2023swdet |
|
|
1-3 | |||||||
| SPOT 7 | LABEL:appr:azmi2022landfill |
|
|
1-3 | |||||||
| COSMO-SkyMed | LABEL:appr:cadau2013simdeo, LABEL:appr:agapiou2016monitoring |
|
|
5 | |||||||
| ALOS | LABEL:appr:chinatsu2009possibility |
|
|
46 | |||||||
| Terra | LABEL:appr:cadau2013simdeo, LABEL:appr:beaumont2014assessment, LABEL:appr:abd2019integrating, LABEL:appr:karimi2022mapping |
|
|
4-16 | |||||||
| IKONOS | LABEL:appr:silvestri2008method, LABEL:appr:biotto2009gis, LABEL:appr:bilotta2012recognition, LABEL:appr:vambol2019nature |
|
|
3 | |||||||
| EO-1 | LABEL:appr:agapiou2016monitoring |
|
|
16 | |||||||
| QuickBird | LABEL:appr:chinatsu2009possibility, LABEL:appr:agapiou2016monitoring, LABEL:appr:vambol2019nature |
|
|
1.5 | |||||||
| RapidEye | LABEL:appr:cadau2013simdeo | Multispectal | 6.5m | 1 | |||||||
| PRISMA | LABEL:appr:kremezi2021pansharpening, LABEL:appr:taggio2022combination |
|
|
29 | |||||||
| Gaofen-2 | LABEL:appr:yang2022automatic |
|
|
4-69 |
3.2 Datasets
The increased accessibility of high-quality EO imagery is not matched by a similar availability of public datasets annotated for the training and evaluation of waste detection approaches. In this section, we present some of the public datasets that are specific for solid waste detection from satellite images.
AerialWaste222222http://aerialwaste.org/: is a dataset for the discovery of landfills from aerial images. The imagery is collected from the Lombardy region in Italy and is sourced from the Italian Agriculture Development Agency (AGEA), WorldView-3, and Google Earth. It provides multiple annotations: binary labels (presence or absence of waste); multi-class multi-label divided into 15 solid waste types and 7 storage modes; and metadata for weakly-supervised localization in the form of segmentation masks surrounding relevant waste objects.
Automatic Detection of Landfill Using Deep Learning232323https://github.com/AnupamaRajkumar/LandfillDetection_SemanticSegmentation: is a landfill detection dataset with the geo-locations of large landfills. Images are from Asia, Europe, and South America and sourced from WorldView-3, WorldView-2, and GeoEye-1. It is annotated with one class and includes segmentation masks.
SWAD242424https://www.kaggle.com/datasets/shenhaibb/swad-dataset: is a dataset for Solid Waste Aerial Detection. The images are collected in the Henan Province in China. It is sourced from Google Earth, WorldView-2, and SPOT. It provides annotations for one class and includes bounding boxes around the waste objects.
Global Dumpsite Test Data252525https://www.scidb.cn/en/s/6bq2M3: is a dataset for dumpsite detection. It covers several large cities in Africa and Asia and is mostly sourced from Google Earth. It provides annotations for 4 classes of waste (domestic, construction, agricultural, and covered).
Table 3 summarises the characteristics of the analyzed datasets.
| Data set | Year | Task | Countries | Number of classes | Number of images | Number of annotations |
| AerialWaste (Torres and Fraternali) | 2023 | Image classification, object detection | Italy | 22 | 10434 | 3478 |
| Automatic Detection of Landfill Using Deep Learning (Rajkumar et al.) | 2022 | Semantic segmentation | Serbia, Brazil, Hungary, Malta, India, Germany | 1 | 3390 | 297 |
| SWAD Dataset (Zhou et al.) | 2022 | Object detection | China | 1 | 1996 | 5562 |
| Global Dumpsite Test Data (Yin) | 2023 | Object detection | Bangladesh, India, Sri Lanka, China, Nigeria, Congo | 4 | 2219 | 2500 |
Most analyzed works do not release the dataset used for the experimentation, and in some cases, omit a detailed description of the data used. This lack of transparency hinders the replication, validation, and comparison of the approaches. Furthermore, some works employ a small set of images and apply the proposed approach to specific contexts, which might not generalize to other scenarios.
The entries listed in Table 3 are a first step towards a global dataset that could be used for benchmarking. However, limitations still exist: some datasets cover only a specific geographical region with a homogeneous background and thus models trained on such data may not generalize well to regions with different types of land use or terrain configuration. Some datasets cover multiple regions but are annotated with a small number of classes, binary annotations in some cases, which do not support the automatic classification of the waste materials. For confidentiality reasons, all datasets but one do not publish the geographical coordinates of the detected waste deposits. Finally, all datasets offer a snapshot of the area they cover and thus do not support the evaluation of the evolution of waste dumping over time.
In summary, a global dataset covering different regions with diverse vegetation, climates, and land use while including urban, peri-urban, and rural settings is still missing. Such a dataset should provide a comprehensive classification of waste materials, in the form of annotations, bounding boxes and segmentation masks. For the studies of waste sites evolution over time, such global datasets should comprise multiple snapshots of the covered regions at different times, possibly sampled at short (e.g., revisit time) and mid-term (e.g., yearly) frequency.
3.3 Data types employed
Remote sensing images can be used alone or in conjunction with other information. Table LABEL:tab:data_sat_table reports the data types exploited by the analyzed works, sorted in chronological order. For each paper, the employed satellites are listed along with the GIS variables and the other non-geographical information. Similarly, Table 5 reports the data exploited by the relevant papers that do not leverage satellite products but are more focused on other inputs such as GIS factors or other sources of aerial images.
| Reference | Year | Satellites | GIS data | Other data |
|---|---|---|---|---|
| Notarnicola et al. | 2004 | Landsat 5 | Land cover maps | Digital orthophotos |
| Silvestri and Omri | 2008 | IKONOS | Road network | Historical aerial images, population |
| Biotto et al. | 2009 | IKONOS | Land cover maps, road network, industrial sites, location of quarries, location of authorized landfills | Population |
| Chinatsu | 2009 | ALOS, QuickBird | - | - |
| Shaker and Yan | 2010 | Landsat (TM) | - | - |
| Shaker et al. | 2011 | Landsat (TM) | - | Landfill gas monitoring data |
| Bilotta et al. | 2012 | IKONOS | - | Cadastral data |
| Cadau et al. | 2013 | COSMO-SkyMed, SPOT 5, RapidEye, Terra (ASTER) | - | - |
| Alexakis and Sarris | 2014 | SPOT 4, Landsat (ETM+) | Road network, land use maps, terrain morphology, distance from cities and airports, wind orientation, surface water, … | - |
| Yan et al. | 2014 | Landsat (TM) | - | - |
| Beaumont et al. | 2015 | Landsat 5, Landsat 7, Terra (ASTER) | Land cover maps | Aerial thermal images, Google Earth archive |
| Agapiou et al. | 2016 | Pléiades, SPOT 6, GeoEye-1, WorldView-2, QuickBird, COSMO-SkyMed, EO-1 | - | - |
| Richter et al. | 2017 | Landsat 4, Landsat 8 | - | - |
| Manzo et al. | 2017 | Pléiades, WorldView-2 | - | Aerial orthophotos, ground chemical data, field thermal/optical images |
| Gill et al. | 2019 | Landsat (TM, ETM+) | - | Landfill gas measurements |
| Abd-El Monsef and Smith | 2019 | Landsat 8, Terra (ASTER) | Waste sources locations, slope, infrastructure, land use maps, road network, topography, … | Population |
| Vambol et al. | 2019 | QuickBird, WorldView, GeoEye, Pléiades, IKONOS | - | - |
| Quesada-Ruiz et al. | 2019 | SPOT 5 | Land use maps, elevation, slope, buildings maps, cadastral data | Orthophotos, population, per capita income, economic indicators, industrial indicators, waste types, … |
| Faizi et al. | 2020 | Landsat 8, Sentinel 2 | Land cover maps | |
| Nazari et al. | 2020 | Landsat 5, Landsat 8 | - | - |
| Devesa and Brust | 2021 | Sentinel 2 | Location of waste sites | - |
| Parrilli et al. | 2021 | Pléiades | - | - |
| Kremezi et al. | 2021 | PRISMA | - | - |
| Taggio et al. | 2022 | PRISMA | - | - |
| Yang et al. | 2022 | Gaofen-2 | - | - |
| Rajkumar et al. | 2022 | GeoEye-1, WorldView-2, WorldView-3 | - | - |
| Aslam et al. | 2022 | Landsat 8 | Water bodies, road network, vegetation | Population, air quality, temperature |
| Karimi and Ng | 2022 | Terra, Aura | Road network, location of waste sites | Nighttime light imagery |
| Azmi et al. | 2022 | Pléiades, SPOT 7 | Road network, vegetation land cover maps, residential areas | - |
| Karimi et al. | 2022 | Landsat 8 | Road and railway network, location of waste sites | Nighttime light imagery |
| Didelija et al. | 2022 | Pléiades | Location of illegal landfill sites | - |
| Abou El-Magd et al. | 2022 | Landsat 5, Landsat 8 | Land use/land cover maps, DEM data, geophysical data | Rainfall data, population |
| Yailymova et al. | 2022 | Landsat 8, Sentinel 2 | Location of waste sites | - |
| Zhou et al. | 2022 | WorldView-2, SPOT | - | - |
| Lavender | 2022 | Sentinel 1, Sentinel 2 | - | DEM data from SRTM (Shuttle Radar Topography Mission) |
| Kruse et al. | 2023 | Sentinel 2 | Land cover maps | - |
| Révolo-Acevedo et al. | 2023 | Landsat 8 | Land use maps, soil type | Temperatures, humidity, rainfall data |
| Reference | Year | GIS data | Other data |
| Lyon | 1987 | - | Historical maps, aerial photography |
| Salleh and Tsudagawa | 2002 | - | Aerial images |
| Viezzoli et al. | 2009 | - | Ground electrical resistivity and magnetic data (SkyTEM sensor mounted on a helicopter) |
| Jordá-Borrell et al. | 2014 | Vegetation, altitude, land use maps, agricultural use, road network, residential areas, … | Accessibility and visibility of illegal landfills, taxes, population, industries, urban waste, … |
| Lucendo-Monedero et al. | 2015 | Land use maps, slope, urban areas, road network, … | Recycling facilities, population waste disposal frequency, industries, per capita income, … |
| Di Fiore et al. | 2017 | - | Ground electrical resistivity and magnetic data, aerial orthophotos |
| Seror and Portnov | 2018 | Road network, slope, forest proximity | Landfill site visibility, amount of waste |
| Fazzo et al. | 2020 | Location of waste sites | Waste hazard, population |
| Torres and Fraternali | 2021 | Location of waste sites | RGB aerophotogrammetry images |
| Sun et al. | 2023 | - | Google Earth satellite images |
| Ulloa-Torrealba et al. | 2023 | Building rooftops footprint | Multispectral aerial images |
4 Techniques
The surveyed works span over three decades and have applied a broad range of techniques, which can be grouped into homogeneous categories:
-
•
Visual interpretation: some works exploit EO images but leave their interpretation to human experts.
-
•
Descriptive indices extraction and analysis: EO multispectral images are used to extract descriptive indices, typically about surface temperature and vegetation, which are then used as inputs for waste detection.
-
•
Multi-factor analysis: some methods exploit multi-modal inputs (e.g., GIS data and descriptive indices) as inputs to waste detection algorithms.
-
•
Features extraction and classification: some methods extract descriptive features from EO images (e.g., brightness, spectral or spatial features) and use them as input to waste detection algorithms.
-
•
Traditional CV techniques: CV techniques based on handcrafted image features are applied to detect waste by implementing such tasks as image binary and multi-label classification, object detection, and semantic segmentation.
-
•
Deep Learning CV techniques: recent works apply the advances in CV brought by Deep Learning (DL) architectures to the analysis of EO images for waste detection.
-
•
Other approaches: A few works apply ad hoc procedures that do not fall in any of the preceding categories.
Table 6 groups the techniques of the analyzed works by the type(s) of input data and by the category of data processing. A detailed description of the satellite missions and other data sources employed by each work is presented in Table LABEL:tab:data_sat_table and Table 5.
4.1 Descriptive indices
From remotely sensed multispectral images, some descriptive indices can be computed and used for the identification of landfills:
-
•
Land Surface Temperature (LST) The LST can be retrieved from the Thermal InfraRed (TIR) channels. It is used to estimate the surface temperature and has proved effective for the identification of large accumulations of solid waste.
-
•
Vegetation indices Several vegetation indices have been proposed in the literature, which can be computed from a subset of multispectral channels. NDVI (Normalized Difference Vegetation Index) is the most used vegetation index and measures plant health based on the reflection of sunlight at specific frequencies. NDWI (Normalized Difference Water Index) is another vegetation index complementary to the NDVI and is sensitive to variations in vegetation water content. SAVI (Soil-Adjusted Vegetation Index) is derived from NDVI and takes into account the vegetation density that can be adjusted with a parameter. The identification of stressed or unhealthy vegetation proved to be a good indicator of the presence of landfills.
-
•
Domain-specific indices Other spectral indices tailored for the remote identification of specific classes of waste have been proposed. Some examples are OSI (Oil Spill Index) which is used to map marine oil spills and similarly FDI (Floating Debris Index) which is exploited for the detection of marine floating plastic. Further examples of domain-specific indices are OOMWI (Olive Oil Mill Waste Index) for the identification of potentially dangerous oil mill waste and HI (Hydrocarbon Index) which has been developed for detecting hydrocarbons on the ground surface.
-
•
Spectral signatures Large-scale landfills usually have different terrain compositions with respect to other land uses. For this reason, specific signatures in the spectral channels can be identified which may hint at the presence of waste. This method is not often exhaustive but helps to identify areas with a high likelihood of being at a hazardous level of degradation (Notarnicola et al., 2004).
| Optical | Multispectral | Pansharpened | Panchromatic | GIS data | GIS and RS data | Geophysical and RS data | |
| Visual interpretation | LABEL:appr:lyon1987use, LABEL:appr:azmi2022landfill | LABEL:appr:chinatsu2009possibility | |||||
| Descriptive indices extraction and analysis | LABEL:appr:silvestri2008method, LABEL:appr:manzo2017top, LABEL:appr:shaker2011integration, LABEL:appr:yan2014analysis, LABEL:appr:beaumont2014assessment, LABEL:appr:richter2017estimation, LABEL:appr:gill2019detection, LABEL:appr:nazari2020application, LABEL:appr:shaker2010trail, LABEL:appr:cadau2013simdeo | LABEL:appr:agapiou2016monitoring, LABEL:appr:kremezi2021pansharpening | |||||
| Multi-factor analysis | LABEL:appr:jorda2014factor, LABEL:appr:lucendo2015predictive, LABEL:appr:seror2018identifying, LABEL:appr:fazzo2020geographic | LABEL:appr:biotto2009gis, LABEL:appr:alexakis2014integrated, LABEL:appr:quesada2019characterization, LABEL:appr:abd2019integrating, LABEL:appr:karimi2022mapping, LABEL:appr:karimi2022development, LABEL:appr:aslam2022identifying, LABEL:appr:revolo2023analyzing | |||||
| Features extraction and classification | LABEL:appr:salleh2002classification | LABEL:appr:notarnicola2004southern | LABEL:appr:vambol2019nature, LABEL:appr:parrilli2021illegal | ||||
| Traditional CV techniques | LABEL:appr:bilotta2012recognition, LABEL:appr:djidelija2022segmentation, LABEL:appr:yrneh2023litter, LABEL:appr:faizi2020satellite | LABEL:appr:taggio2022combination | |||||
| Deep Learning CV techniques | LABEL:appr:torres2021learning, LABEL:appr:zhou2023swdet, LABEL:appr:sun2023revealing | LABEL:appr:kruse2023satellite, LABEL:appr:yailymova2022neural, LABEL:appr:lavender2022detection, LABEL:appr:devesa2021mapping | LABEL:appr:yang2022automatic, LABEL:appr:rajkumar2022detecting | ||||
| Other approaches | LABEL:appr:viezzoli2009use, LABEL:appr:di2017integrated, LABEL:appr:abou2022qualitative |
4.2 Description of the works by category
Visual interpretation A few works simply apply a visual interpretation of optical EO images to locate areas at risk, such as unoccupied land, sick vegetation, uneven terrain texture, or darker waters (Azmi et al., 2022). In Chinatsu (2009), authors proposed to visually inspect pansharpened imagery which combines the information from multispectral images with the high-resolution details of a panchromatic band. Such a manual approach was employed in the pioneering work by Lyon (1987), when automatic image processing was not common.
Descriptive indices extraction and analysis A widely adopted approach for detecting solid waste from EO data is based on the extraction of remote sensing indices from multispectral images. Three main cases can be identified based on the analysis of the LST, of descriptive indices, or of a combination of both.
-
•
LST The LST is one of the most commonly used indicators for detecting large waste disposal sites (Beaumont et al., 2014). Especially during summer, when the heat flux emitted by the decomposition process is more pronounced (Gill et al., 2019), a higher temperature difference between the landfill and the surrounding area can be observed (Yan et al., 2014). The heat is generated by the biochemical degradation of waste (Richter et al., 2017) which results in higher surface temperatures (Shaker et al., 2011).
-
•
Descriptive indices The NDVI index is employed to identify stressed vegetation in Silvestri and Omri (2008) as an indicator of solid waste disposal. In Manzo et al. (2017), together with NDVI, the GEMI (Global Environmental Monitoring Index) vegetation index is used which is less influenced by atmospheric effects while being more sensitive to bare soil variation. In some specific scenarios, such as in Agapiou et al. (2016), the domain-specific index named OOMWI (Olive Oil Mill Waste Index) tailored to identify olive oil waste is used. In Kremezi et al. (2021), three domain-specific spectral indices are proposed to detect marine plastic waste. These indices are computed from the VNIR channels of pansharpened images and proved to be effective for the detection of small-sized plastic litter floating on the sea.
-
•
Composite indicators In Cadau et al. (2013), DDI (Dump Detection Index) is introduced as a domain-specific indicator for landfill detection. It combines the SAVI vegetation index and the measure of randomness in the local texture of the vegetation index images. High values of DDI are an indicator of landfill presence, which is confirmed by detecting thermal anomalies in the LST. Similarly in Shaker and Yan (2010), the LST and SAVI are used to monitor the decomposition process and the health status of the vegetation to identify candidate landfill locations.
Multi-factor analysis Another common technique for predicting the presence of landfills consists of defining a probability map that estimates the locations at risk. The spatial probability distribution is derived from the combination of multiple variables associated with known dumping sites. The considered variables can be georeferenced information (e.g. road network, land cover maps) (Jordá-Borrell et al., 2014; Biotto et al., 2009; Lucendo-Monedero et al., 2015) or other types of data such as population distribution (Abd-El Monsef and Smith, 2019; Aslam et al., 2022; Fazzo et al., 2020), economic and industrial indicators (Quesada-Ruiz et al., 2019), frequency of waste disposal (Lucendo-Monedero et al., 2015), distance from cities and airports (Alexakis and Sarris, 2014), rainfall data (Révolo-Acevedo et al., 2023), or nighttime light imagery used as a proxy of population density (Karimi and Ng, 2022; Karimi et al., 2022). Some works also include vegetation indices (Biotto et al., 2009) and the LST distribution (Karimi and Ng, 2022; Karimi et al., 2022; Révolo-Acevedo et al., 2023). The combination of vegetation indices and GIS data can also be exploited for selecting the most suitable location for building a new landfill (Alexakis and Sarris, 2014) to mitigate the impact on the environment and the nearby population (Aslam et al., 2022). This technique is particularly relevant for hazardous materials that require to be disposed in environmentally safe landfills (Abd-El Monsef and Smith, 2019).
Features extraction and classification To reduce the data dimensionality and focus the detection models on the salient information, some works extract a combination of spatial and spectral features from the images. In Vambol et al. (2019), several brightness features (e.g. mean value, dispersion, excess, asymmetry coefficient) are computed from panchromatic images which are then thresholded to detect waste dumps. In Parrilli et al. (2021), spectral information of multispectral images is combined with spectral features of panchromatic images based on brightness percentile intervals. Spatial features are also computed from panchromatic imagery, which proved useful for detecting micro dumps and greenhouses. The combined features are then processed with a Nearest Neighbor classifier. In Notarnicola et al. (2004), degraded areas are detected by recognizing characteristic spectral signatures of solid waste disposal sites using an unsupervised classification technique. Spectral signatures permitted the identification of a recent landfill for which thermal anomalies and vegetation stress were undetectable. With a multi-temporal comparison, the authors also found that the employed spectral signatures can be recognized thanks to their stability. To increase landfill detection performance, some researchers combine spectral signatures with spatial features to improve image textural characterization. In Salleh and Tsudagawa (2002), a spatial filter is applied to an input optical image to remove the noise. The filtered data is stacked with the original image and a Bayesian classifier is used to assign a category to each image. The authors proved that the combination of spectral data (colour channels) and spatial information improves the accuracy.
Traditional CV techniques Some works approached the solid waste detection task by applying CV techniques to multispectral images. A popular method used in remote sensing image analysis is object-based classification, which pursues the identification and classification of objects or regions of interest rather than individual pixels. In Bilotta et al. (2012) and Didelija et al. (2022), multi-resolution segmentation is used to sequentially merge pixels and identify image objects which are then classified as landfills. Similarly in Ulloa-Torrealba et al. (2023), image objects are defined using the SLIC algorithm which is based on the unsupervised K-Means clustering method. In Faizi et al. (2020), a pixel-based image classification model based on multispectral imagery is presented. Both unsupervised and supervised approaches are explored to extract land cover information which is then used to localize potential landfills. The unsupervised classification provided better results and performance improved when using higher spectral resolutions. A similar approach is presented in Taggio et al. (2022) where each pixel of a pansharpened image is classified using a combination of an unsupervised clustering method (K-Means) and a supervised classification technique (Light Gradient Boosting Model). The objective is to detect offshore floating plastic waste in the ocean and coastal areas.
Deep Learning CV techniques Some works employ Convolutional Neural Networks (CNNs) trained on optical or multispectral images for such CV tasks as image classification, object detection, and semantic segmentation. In Kruse et al. (2023), pixel-level and patch-level neural network classifiers are trained on the spatial, spectral, and temporal dimensions of multispectral images in a semi-supervised setting. The pixel-level network exploits a small CNN that extracts features across the spectral bands of each pixel which are then classified using a fully connected network. Similarly, the patch-level network extracts and classifies spatial features using a CNN architecture. Temporal data is used to account for seasonal variations while spatial information is incorporated to improve the discrimination between solid waste and objects with a similar spectral profile. Other pixel-level DL approaches exploit information derived from vegetation indices instead of the full spectral data. In Lavender (2022), a DL model integrates vegetation indices and multispectral channels to classify each pixel. A network composed of fully connected layers takes as input the bands of each pixel and predicts a waste type or land use class. The output of the network is fed to a Decision Tree to further improve the classification performance. Similarly Yailymova et al. (2022) combines vegetation indices and LST to classify pixels. A segmentation model based on the U-Net (Ronneberger et al., 2015) architecture is tested but due to the poor accuracy, a pixel-based classification model is preferred. A semantic segmentation network applied to multispectral images is proposed in Devesa and Brust (2021) where a model based on the U-Net architecture is adapted to a higher number of spectral channels and produces a binary mask denoting waste sites. Similarly, in Rajkumar et al. (2022) a segmentation model based on the U-Net architecture is trained on pansharpened images. In this work, both VGG (Simonyan and Zisserman, 2015) and ResNet (He et al., 2015) encoders are used as feature extractors. These encoders are also tested using a Fully Convolutional Network (FCN) architecture. In Yang et al. (2022) the aim is to identify construction and demolition waste in urban areas. To cope with the complex spectrum and texture of such a class of waste a DL model based on the DeepLabv3+ (Chen et al., 2018) architecture with Xception (Chollet, 2017) backbone network is used to perform semantic segmentation on high-resolution pansharpened images. Some works target small-scale landfills in densely populated contexts where analysis based on LST and vegetation indices may fail. In Torres and Fraternali (2021), a binary classification model is trained on labelled optical images at different ground resolutions to perform a scene classification task. The binary classifier exploits ResNet as the network backbone and augments it with a Feature Pyramid Network (FPN) (Lin et al., 2017) architecture. FPN creates a feature pyramid that has good semantics at all scales by combining low-resolution semantically strong features with high-resolution semantically weaker ones. The model can identify a wide variety of solid waste materials dispersed in a vast region composed of urban and extra-urban scenarios. In the works Zhou et al. (2023) and Sun et al. (2023), a CNN object detector is trained to localize landfills in urban scenarios. In Zhou et al. (2023) a novel Asymmetric Deep Aggregation (ADA) block is used as the backbone to extract features of weakly visible waste by fusing feature maps extracted with asymmetric convolutions. Then, an Efficient Attention Fusion Pyramid Network (EAFPN) merges multi-scale geospatial information using attention fusion blocks, and the resulting feature maps are fed to a YOLO (Redmon et al., 2016) detection head for the final waste localization. Additionally, in Sun et al. (2023) the waste type is also predicted (domestic, construction, covered, and agricultural waste). The proposed architecture is based on a ResNet backbone to extract high-level features that are connected to Blocked Channel Attention (BCA) modules. The network is based on a Feature Pyramid Network (FPN) structure to preserve multi-scale features of dumpsites.
Other approaches Landfills can also be identified by integrating geological, geographical, and geophysical data. In Di Fiore et al. (2017) the authors proved that electrical conductivity and induced polarization (a technique used to quantify the electrical chargeability of subsurface materials) are effective for the analysis of contaminated areas. A different approach presented in Viezzoli et al. (2009) employs a special sensor mounted on a helicopter to detect anomalies in the subsurface electrical conductivity that may indicate the presence of a landfill. However, such a method would be effective for small landfills only in the case of highly conductive waste material. In Abou El-Magd et al. (2022), NDVI and LST indices are derived from remote sensing data and are integrated with hydrological and geophysical measures collected during in-situ expeditions to perform an environmental assessment of a municipal landfill.
From the survey of the adopted techniques, it can be noted that the approaches vary significantly based on the scale of the solid waste disposal to be detected. Small sites and large-scale landfills have very different characteristics that can be exploited for their identification. Large-scale landfills emit large quantities of gas that produce heat and thus thermal anomalies in the surface temperature and vegetation indices can be used as indicators for their detection. Smaller waste sites do not have a significant impact on thermal and vegetation indicators and therefore the analysis of optical and spectral signatures is preferable. In recent years, the adoption of DL for landfill detection has increased thanks to the development of powerful architectures that obtain very high performance even on aerial images. However, some recent works still obtain good performance with simpler techniques based on descriptive indices and with shallow Machine Learning models.
5 Issues and research directions
Applications that leverage remote sensing data have been proposed for many decades. Implementing solid waste detection models is challenging due to many variables such as diverse backgrounds, satellite image resolution, data availability, and reliable ground truth annotations. Some approaches have proved very effective for identifying and localizing waste disposal sites and illegal landfills. With the notable exceptions of Lavender (2022), Sun et al. (2023) and Rajkumar et al. (2022), the proposed solutions are tested in specific territories, with distinctive geographic characteristics, which questions the generalizability of waste detection models at a more global scale. Ultimately, the analysis of the current state-of-the-art demonstrates that there are still margins for improving the current level of maturity in this research field.
5.1 Open issues
-
•
Data set availability As shown in Table 3 there are very few publicly available data sets that can be exploited for training and evaluating solid waste detection models. The reasons behind the lack of available data sets may be caused by legal concerns to avoid exposing sensitive information about illegal activities, the adoption of an inappropriate methodology that does not consider the repeatability of the obtained results and the access to satellite images under a contract that does not allow the publication of data.
-
•
Benchmarking The lack of a widely adopted data set prevents the comparison of the different approaches, which in turn hinders the reliable evaluation of the progress in the field. Inspiration can be taken from other Computer Vision and image analysis applications, which exist also in the remote sensing field, such as aerial scene classification (e.g. AID (Xia et al., 2017), Million-AID (Long et al., 2021), NWPU-RESISC45 (Cheng et al., 2017)) and land cover characterization (e.g. UC Merced (Yang and Newsam, 2010), BigEarthNet (Sumbul et al., 2019), EuroSAT (Helber et al., 2019)). A benchmark should comprise a large and representative set of training, validation, and testing samples addressing diverse image resolutions and quality, object scales, scene configurations, solid waste materials, land uses, and geographical context. It should also specify a variety of downstream waste-related tasks, such as image-level binary and multi-label scene classification, and solid waste object detection.
-
•
Performance assessment procedures Many works lack a quantitative assessment of the detection capability. In these cases, a model is directly executed on a case scenario and the results are validated visually. For this reason, it is difficult to understand the detection and generalization capability of the approach. Moreover, studies that report a quantitative evaluation use different performance metrics (accuracy, F1, AUC-ROC) which impede the comparison of works.
-
•
Data and compute efficiency The requirement of high-resolution remote sensing images for solid waste detection, and the push towards larger detection models, challenge the capacity of training and executing waste detection solutions on affordable hardware infrastructures. Furthermore, it poses a severe toll in terms of energy consumption and CO2 emissions (Chen et al., 2022; Song et al., 2023).
5.2 Research directions
-
•
Waste material identification Most works detect generic solid waste or only a few high-level types of materials (e.g., construction, plastics). However, the risk of contamination and the severity of an illicit depend also on the type of materials. Training detectors for identifying a broad range of waste types (e.g., the waste materials coded by the European Union (Eurostat, 2010)) would enable a finer characterization of the waste site and thus the assessment of risk and the prioritization of site inspections. Dual image approaches, such as Alvarez-Vanhard et al. (2021), fuse EO and drone images of the same site and could help discriminate the diverse solid waste materials.
-
•
Creation of a global data set In the Computer Vision field benchmark data sets for training models for different tasks are the norm. For instance, ImageNet (Russakovsky et al., 2015) for the classification of natural images or, specifically for RS tasks, the AID dataset (Xia et al., 2017) for the classification of aerial scenes or the UC-Merced dataset (Yang and Newsam, 2010) for land use characterization. Similarly, for the task of solid waste detection from EO data, defining a data set composed of many remote sensing data captured with a wide selection of sensors (RGB, Panchromatic, Multispectral) could standardize the comparison of models and enable the selection of the detection approach that best matches the characteristics of a real scenario. An example of a similar effort, in the more general domain of land use classification, is the Million-AID data set (Long et al., 2021), a collection of one million Google Earth images annotated with 51 semantic categories organized into a taxonomy and featuring diverse ground sample distances and different sizes. Besides introducing the collection, the authors discuss the properties of diversity, richness, and scalability for large scale remote sensing image data sets and describe a pipeline for their creation and annotation, which could be beneficial also for the construction of large global collections of remote sensing images for waste related tasks.
-
•
Geospatial Foundation Models Large pre-trained models, also known as foundation models (FMs), are trained on a large set of unlabelled data in a task-agnostic manner and can be fine-tuned to various downstream tasks. Thanks to the pre-training, fine-tuning an FM can outperform task-specific fully-supervised models while requiring less annotated data. In the context of remote sensing tasks, NASA and IBM openly released a Geospatial AI Foundation Model262626https://www.earthdata.nasa.gov/news/impact-ibm-hls-foundation-model pre-trained on NASA’s Harmonized Landsat Sentinel-2 (HLS) data set. The pre-trained backbone, named Prithvi-100M (Jakubik et al., 2023), has a wide range of applications and could be exploited in the detection of solid waste for reducing the semantic gap due to the pre-training on collections of natural images for remote sensing tasks. The effectiveness of remote sensing (RS) pre-training is studied empirically in (Wang et al., 2023). The authors train different networks from scratch with the Million-AID data set to obtain a series of pre-trained backbones, including both CNNs and Vision Transformers, and compare them with their counterparts pre-trained on ImageNet. Experiments on four tasks (scene recognition, semantic segmentation, object detection, and change detection) highlight the need for further investigation. The benefits of RS pre-training over ImageNet vary depending on the downstream task. They are more evident for scene recognition and less apparent for fine granularity tasks such as image segmentation. Such a finding challenges the approaches that aim at the detection of solid waste in remote sensing images at the pixel level and demands more research to align the features extracted during the pre-training phase and those required for the waste detection task.
-
•
Data and compute efficiency Building a Geospatial Foundation Model to support downstream solid waste detection tasks is both data and compute intensive. Brute-force scaling models to billions of parameters, as recently done in (Cha et al., 2023) for remote sensing image analysis tasks, improves performances to the price of severe environment impact in terms of energy consumption and CO2 emissions. This calls for novel techniques that target both efficiency and accuracy. An interesting perspective is explored in (Mendieta et al., 2023), which advocates quite the opposite approach with respect to the classical method of fine-tuning ImageNet pre-trained models on remote sensing data sets and tasks. The authors actually do the reverse: they build a satellite image collection (called GeoPile) from both labelled and unlabelled samples, with the aim of maximizing the diversity and representativeness of remote sensing scenes. Then they use both GeoPile and ImageNet to train a network with a teacher-student strategy in which the student learns from GeoPile and from the knowledge distilled by a teacher pre-trained on ImageNet. This method exploits the strong features of ImageNet to guide and accelerate learning and at the same time permits the acquisition of remote sensing features. The resulting model performs favourably with respect to other geospatial pre-training methods and ImageNet baselines and could be applied to solid waste detection tasks by incorporating a limited number of sufficiently diverse waste scenes in the remote sensing image collection.
-
•
Zero/Few Shot Learning for detecting rare waste types In the surveyed data sets the detectable solid waste categories exhibit a long tail distribution. A few classes have a majority of labelled samples, while many other types are scarcely annotated. For example, in the AerialWaste data set (Torres and Fraternali, 2023) the top 5 classes (rubble, bulky items, firewood, scraps, and plastic) account for 83% of the labels of 15 waste types. Considering that the European Waste Catalogue (Eurostat, 2010) lists 839 codes, even if only a fraction of such materials should be detected in remote sensing images, it is easy to see that suitable techniques should be devised for their identification based on very few or even no prior visual examples. Learning in the presence of zero or few samples is addressed by zero- and few-shot approaches, which have demonstrated impressive results in the Computer Vision domain thanks to the advent of Visual Language Models (VLM) (Radford et al., 2021). A VLM exploits a massive amount of text, typically scraped from the Web, to supervise the training of a visual model through a simple ancillary task, such as image-to-text pairing. The extracted multimodal embeddings align the textual and visual representations and enable the use of knowledge mined from the text to classify visual content denoting previously unseen concepts. The application of VLM to remote sensing tasks is in its infancy (Wen et al., 2023; Li et al., 2023). The main difficulty of building a VLM for remote sensing applications is that the amount of textual knowledge about remote sensing concepts is much smaller than the text characterizing natural images. Furthermore, remote sensing scenes have great structural and background diversity and manifest weaker semantic correlations between entities observed in the context of remote sensing, making the semantic reasoning at the base of zero-shot learning more difficult. This poses a challenge both for the construction of an effective VLM for remote sensing applications (Li et al., 2023) and for the adaptation of such a model to the waste domain. However, if such a VLM could be built effectively, it would enable an array of very interesting applications, including the detection of previously unseen waste types, the automatic textual description of waste images, the grounding of image classifications by highlighting the relevant regions where the waste appears, and the implementation of query systems retrieving waste images from textual inputs.
6 Conclusions
This review presented the state-of-the-art for detecting and monitoring solid waste dumps in remote sensing data with the aim of providing a practical analysis of the works in the field. The proposed approaches have been categorized, described, and compared and the publicly available data sets identified. The available remote sensing data and the satellite products usable for solid waste detection and monitoring have been illustrated. The most significant open issues identified are mainly methodological and refer to the lack of a standard benchmark for assessing and comparing competing approaches, based on a large and global collection of remote sensing images and well-defined inference tasks supported by agreed-upon performance evaluation metrics. Although establishing a reference dataset is a commendable initiative, the complexity of the problem should be considered. Effectively addressing the breadth of encountered scenarios requires the inclusion of a comprehensive set of samples characterized by heterogeneous geographical contexts and scene configurations capturing a wide selection of solid waste materials and landfill scale. Moreover, imagery from several EO sensors, represented at different ground resolutions, should be provided within the dataset. The identified research directions for the future are extremely exciting. The waste detection domain can benefit from the recent innovations in the Computer Vision arena, such as Vision Transformers (Vaswani et al., 2017), billion-scale foundation models (Cha et al., 2023) and visual language models (Radford et al., 2021). However, such breakthroughs have impacted mostly the domain of natural image analysis and thus research opportunities are open for improving the state-of-the-art in both remote sensing in general (Wen et al., 2023) and solid waste detection research in particular.
Declaration of Competing Interest
The authors declare that they have no known competing financial interests or personal relationships that could have appeared to influence the work reported in this paper.
Acknowledgements
This work is supported by the project PERIVALLON - Protecting the EuRopean terrItory from organised enVironmentAl crime through inteLLigent threat detectiON tools, funded by the EU H2020 Programme, grant agreement no. 101073952.
References
- Abd-El Monsef and Smith (2019) Abd-El Monsef, H., Smith, S.E., 2019. Integrating remote sensing, geographic information system, and analytical hierarchy process for hazardous waste landfill site selection. Arabian Journal of Geosciences 12, 1–14.
- Abou El-Magd et al. (2022) Abou El-Magd, I., Attwa, M., El Bastawesy, M., Gad, A., Henaish, A., Zamzam, S., 2022. Qualitative and quantitative characterization of municipal waste in uncontrolled dumpsites and landfills using integrated remote sensing, geological and geophysical data: A case study. Sustainability 14, 4539.
- Ackerman (2000) Ackerman, F., 2000. Waste management and climate change. Local Environment 5, 223–229. URL: https://doi.org/10.1080/13549830050009373, doi:10.1080/13549830050009373.
- Agapiou et al. (2016) Agapiou, A., Papadopoulos, N., Sarris, A., 2016. Monitoring olive mills waste disposal areas in crete using very high resolution satellite data. The Egyptian Journal of Remote Sensing and Space Science 19, 285–295.
- Alberti (2022) Alberti, P., 2022. The ‘land of fires’: Epidemiological research and public health policy during the waste crisis in campania, italy. Heliyon .
- Alexakis and Sarris (2014) Alexakis, D.D., Sarris, A., 2014. Integrated gis and remote sensing analysis for landfill sitting in western crete, greece. Environmental earth sciences 72, 467–482.
- Alvarez-Vanhard et al. (2021) Alvarez-Vanhard, E., Corpetti, T., Houet, T., 2021. Uav & satellite synergies for optical remote sensing applications: A literature review. Science of Remote Sensing 3, 100019. URL: https://www.sciencedirect.com/science/article/pii/S2666017221000067, doi:https://doi.org/10.1016/j.srs.2021.100019.
- Aslam et al. (2022) Aslam, B., Maqsoom, A., Tahir, M.D., Ullah, F., Rehman, M.S.U., Albattah, M., 2022. Identifying and ranking landfill sites for municipal solid waste management: An integrated remote sensing and gis approach. Buildings 12, 605.
- Azmi et al. (2022) Azmi, M.Z.M., Sharom, M., Numpang, W., Jamil, M., Yahaya, K., Muazah, S., Zin, M., Abd, C., Sipit, R., 2022. Landfill identification through high-resolution satellite images and verification using drone full motion video (fmv). ASM Sci. J 17, 1–7.
- Beaumont et al. (2014) Beaumont, B., Radoux, J., Defourny, P., 2014. Assessment of airborne and spaceborne thermal infrared remote sensing for detecting and characterizing landfills. Waste Management and The Environment VII 180, 237–248.
- Bilotta et al. (2012) Bilotta, G., Barrile, V., Meduri, G.M., 2012. Recognition and classification of illegal dumps with object based image analysis of satellite data. A-+ A 1, 4.
- Biotto et al. (2009) Biotto, G., Silvestri, S., Gobbo, L., Furlan, E., Valenti, S., Rosselli, R., 2009. Gis, multi-criteria and multi-factor spatial analysis for the probability assessment of the existence of illegal landfills. International Journal of Geographical Information Science 23, 1233–1244. URL: https://doi.org/10.1080/13658810802112128, doi:10.1080/13658810802112128.
- Cadau et al. (2013) Cadau, E.G., Putignano, C., Aurigemma, R., Melchiorre, A., Bosco, P., Tesseri, A., Battazza, F., 2013. Simdeo: An integrated system for landfill detection and monitoring using eo data, in: 2013 IEEE International Geoscience and Remote Sensing Symposium - IGARSS, pp. 3305–3308. doi:10.1109/IGARSS.2013.6723534.
- Cha et al. (2023) Cha, K., Seo, J., Lee, T., 2023. A billion-scale foundation model for remote sensing images. arXiv:2304.05215.
- Chen et al. (2018) Chen, L.C., Zhu, Y., Papandreou, G., Schroff, F., Adam, H., 2018. Encoder-decoder with atrous separable convolution for semantic image segmentation. arXiv:1802.02611.
- Chen et al. (2022) Chen, Z., Yang, J., Feng, Z., Chen, L., 2022. Rscnet: An efficient remote sensing scene classification model based on lightweight convolution neural networks. Electronics 11. URL: https://www.mdpi.com/2079-9292/11/22/3727, doi:10.3390/electronics11223727.
- Cheng et al. (2017) Cheng, G., Han, J., Lu, X., 2017. Remote sensing image scene classification: Benchmark and state of the art. Proceedings of the IEEE 105, 1865--1883. doi:10.1109/JPROC.2017.2675998.
- Chinatsu (2009) Chinatsu, Y., 2009. Possibility of monitoring of waste disposal site using satellite imagery. JIFS 6, 23--28.
- Chollet (2017) Chollet, F., 2017. Xception: Deep learning with depthwise separable convolutions. arXiv:1610.02357.
- Devesa and Brust (2021) Devesa, M.R., Brust, A.V., 2021. Mapping illegal waste dumping sites with neural-network classification of satellite imagery. arXiv preprint arXiv:2110.08599 .
- Di Fiore et al. (2017) Di Fiore, V., Cavuoto, G., Punzo, M., Tarallo, D., Casazza, M., Guarriello, S.M., Lega, M., 2017. Integrated hierarchical geo-environmental survey strategy applied to the detection and investigation of an illegal landfill: A case study in the campania region (southern italy). Forensic science international 279, 96--105.
- Didelija et al. (2022) Didelija, M., Kulo, N., Mulahusić, A., Tuno, N., Topoljak, J., 2022. Segmentation scale parameter influence on the accuracy of detecting illegal landfills on satellite imagery. a case study for novo sarajevo. Ecological Informatics 70, 101755.
- Eurostat (2010) Eurostat, 2010. Guidance on classification of waste according to ewc-stat categories. URL: https://ec.europa.eu/eurostat/documents/342366/351806/Guidance-on-EWCStat-categories-2010.pdf.
- Faizi et al. (2020) Faizi, F., Mahmood, K., Chaudhry, M., Rana, A., 2020. Satellite remote sensing and image processing techniques for monitoring msw dumps, in: Proccedings of 5th EurAsia Waste Management Symposium, pp. 26--28.
- Falagas et al. (2008) Falagas, M.E., Pitsouni, E.I., Malietzis, G.A., Pappas, G., 2008. Comparison of pubmed, scopus, web of science, and google scholar: strengths and weaknesses. The FASEB journal 22, 338--342.
- Fazzo et al. (2020) Fazzo, L., De Santis, M., Beccaloni, E., Scaini, F., Iavarone, I., Comba, P., Airoma, D., 2020. A geographic information system-based indicator of waste risk to investigate the health impact of landfills and uncontrolled dumping sites. International journal of environmental research and public health 17, 5789.
- Gill et al. (2019) Gill, J., Faisal, K., Shaker, A., Yan, W.Y., 2019. Detection of waste dumping locations in landfill using multi-temporal landsat thermal images. Waste Management & Research 37, 386--393.
- He et al. (2015) He, K., Zhang, X., Ren, S., Sun, J., 2015. Deep residual learning for image recognition. arXiv:1512.03385.
- Helber et al. (2019) Helber, P., Bischke, B., Dengel, A., Borth, D., 2019. Eurosat: A novel dataset and deep learning benchmark for land use and land cover classification. IEEE Journal of Selected Topics in Applied Earth Observations and Remote Sensing 12, 2217--2226. doi:10.1109/JSTARS.2019.2918242.
- Jakubik et al. (2023) Jakubik, J., Chu, L., Fraccaro, P., Gomes, C., Nyirjesy, G., Bangalore, R., Lambhate, D., Das, K., Oliveira Borges, D., Kimura, D., Simumba, N., Szwarcman, D., Muszynski, M., Weldemariam, K., Zadrozny, B., Ganti, R., Costa, C., Edwards, Blair & Watson, C., Mukkavilli, K., Schmude, Johannes & Hamann, H., Robert, P., Roy, S., Phillips, C., Ankur, K., Ramasubramanian, M., Gurung, I., Leong, W.J., Avery, R., Ramachandran, R., Maskey, M., Olofossen, P., Fancher, E., Lee, T., Murphy, K., Duffy, D., Little, M., Alemohammad, H., Cecil, M., Li, S., Khallaghi, S., Godwin, D., Ahmadi, M., Kordi, F., Saux, B., Pastick, N., Doucette, P., Fleckenstein, R., Luanga, D., Corvin, A., Granger, E., 2023. Prithvi-100M. doi:10.57967/hf/0952.
- Jordá-Borrell et al. (2014) Jordá-Borrell, R., Ruiz-Rodríguez, F., Lucendo-Monedero, Á.L., 2014. Factor analysis and geographic information system for determining probability areas of presence of illegal landfills. Ecological Indicators 37, 151--160.
- Jutz and Milagro-Pérez (2018) Jutz, S., Milagro-Pérez, M., 2018. 1.06 - copernicus program, in: Liang, S. (Ed.), Comprehensive Remote Sensing. Elsevier, Oxford, pp. 150--191. URL: https://www.sciencedirect.com/science/article/pii/B9780124095489103173, doi:https://doi.org/10.1016/B978-0-12-409548-9.10317-3.
- Karimi and Ng (2022) Karimi, N., Ng, K.T.W., 2022. Mapping and prioritizing potential illegal dump sites using geographic information system network analysis and multiple remote sensing indices. Earth 3, 1123--1137.
- Karimi et al. (2022) Karimi, N., Ng, K.T.W., Richter, A., 2022. Development and application of an analytical framework for mapping probable illegal dumping sites using nighttime light imagery and various remote sensing indices. Waste Management 143, 195--205.
- Kremezi et al. (2021) Kremezi, M., Kristollari, V., Karathanassi, V., Topouzelis, K., Kolokoussis, P., Taggio, N., Aiello, A., Ceriola, G., Barbone, E., Corradi, P., 2021. Pansharpening prisma data for marine plastic litter detection using plastic indexes. IEEE Access 9, 61955--61971. doi:10.1109/ACCESS.2021.3073903.
- Kruse et al. (2023) Kruse, C., Boyda, E., Chen, S., Karra, K., Bou-Nahra, T., Hammer, D., Mathis, J., Maddalene, T., Jambeck, J., Laurier, F., 2023. Satellite monitoring of terrestrial plastic waste. PloS one 18, e0278997.
- Lavender (2022) Lavender, S., 2022. Detection of waste plastics in the environment: Application of copernicus earth observation data. Remote Sensing 14. URL: https://www.mdpi.com/2072-4292/14/19/4772, doi:10.3390/rs14194772.
- Li et al. (2023) Li, X., Wen, C., Hu, Y., Zhou, N., 2023. RS-CLIP: zero shot remote sensing scene classification via contrastive vision-language supervision. Int. J. Appl. Earth Obs. Geoinformation 124, 103497. URL: https://doi.org/10.1016/j.jag.2023.103497, doi:10.1016/J.JAG.2023.103497.
- Lin et al. (2017) Lin, T.Y., Dollár, P., Girshick, R., He, K., Hariharan, B., Belongie, S., 2017. Feature pyramid networks for object detection, in: 2017 IEEE Conference on Computer Vision and Pattern Recognition (CVPR), pp. 936--944. doi:10.1109/CVPR.2017.106.
- Long et al. (2021) Long, Y., Xia, G.S., Li, S., Yang, W., Yang, M.Y., Zhu, X.X., Zhang, L., Li, D., 2021. On creating benchmark dataset for aerial image interpretation: Reviews, guidances, and million-aid. IEEE Journal of Selected Topics in Applied Earth Observations and Remote Sensing 14, 4205--4230. doi:10.1109/JSTARS.2021.3070368.
- Lucendo-Monedero et al. (2015) Lucendo-Monedero, A.L., Jordá-Borrell, R., Ruiz-Rodríguez, F., 2015. Predictive model for areas with illegal landfills using logistic regression. Journal of Environmental Planning and Management 58, 1309--1326.
- Lyon (1987) Lyon, J., 1987. Use of maps, aerial photographs, and other remote sensor data for practical evaluations of hazardous waste sites. Photogrammetric engineering and remote sensing 53, 515--519.
- Manfredi et al. (2009) Manfredi, S., Tonini, D., Christensen, T.H., Scharff, H., 2009. Landfilling of waste: accounting of greenhouse gases and global warming contributions. Waste Management & Research 27, 825--836. URL: https://doi.org/10.1177/0734242X09348529, doi:10.1177/0734242X09348529. pMID: 19808732.
- Manzo et al. (2017) Manzo, C., Mei, A., Zampetti, E., Bassani, C., Paciucci, L., Manetti, P., 2017. Top-down approach from satellite to terrestrial rover application for environmental monitoring of landfills. Science of the Total Environment 584, 1333--1348.
- Mendieta et al. (2023) Mendieta, M., Han, B., Shi, X., Zhu, Y., Chen, C., Li, M., 2023. Gfm: Building geospatial foundation models via continual pretraining. ArXiv abs/2302.04476. URL: https://api.semanticscholar.org/CorpusID:263890040.
- Nazari et al. (2020) Nazari, R., Alfergani, H., Haas, F., Karimi, M.E., Fahad, M.G.R., Sabrin, S., Everett, J., Bouaynaya, N., Peters, R.W., 2020. Application of satellite remote sensing in monitoring elevated internal temperatures of landfills. Applied Sciences 10, 6801.
- Notarnicola et al. (2004) Notarnicola, C., Angiulli, M., Giasi, C.I., 2004. Southern italy illegal dumps detection based on spectral analysis of remotely sensed data and land-cover maps, in: Remote Sensing for Environmental Monitoring, GIS Applications, and Geology III, SPIE. pp. 483--493.
- Page et al. (2021) Page, M.J., McKenzie, J.E., Bossuyt, P.M., Boutron, I., Hoffmann, T.C., Mulrow, C.D., Shamseer, L., Tetzlaff, J.M., Akl, E.A., Brennan, S.E., et al., 2021. The prisma 2020 statement: an updated guideline for reporting systematic reviews. International Journal of Surgery 88, 105906.
- Parrilli et al. (2021) Parrilli, S., Cicala, L., VincenzoAngelino, C., Amitrano, D., 2021. Illegal micro-dumps monitoring: Pollution sources and targets detection in satellite images with the scattering transform, in: 2021 IEEE International Geoscience and Remote Sensing Symposium IGARSS, IEEE. pp. 4892--4895.
- Quesada-Ruiz et al. (2019) Quesada-Ruiz, L.C., Rodriguez-Galiano, V., Jordá-Borrell, R., 2019. Characterization and mapping of illegal landfill potential occurrence in the canary islands. Waste Management 85, 506--518.
- Radford et al. (2021) Radford, A., Kim, J.W., Hallacy, C., Ramesh, A., Goh, G., Agarwal, S., Sastry, G., Askell, A., Mishkin, P., Clark, J., Krueger, G., Sutskever, I., 2021. Learning transferable visual models from natural language supervision, in: Meila, M., Zhang, T. (Eds.), Proceedings of the 38th International Conference on Machine Learning, ICML 2021, 18-24 July 2021, Virtual Event, PMLR. pp. 8748--8763. URL: http://proceedings.mlr.press/v139/radford21a.html.
- Rajkumar et al. (2022) Rajkumar, A., Kft, C.A., Sziranyi, T., Majdik, A., 2022. Detecting landfills using multi-spectral satellite images and deep learning methods. Presented at Practical Machine Learning for Developing Countries(PML4DC) Workshop on the International Conference on Learning Representations(ICLR 22).
- Redmon et al. (2016) Redmon, J., Divvala, S., Girshick, R., Farhadi, A., 2016. You only look once: Unified, real-time object detection, in: 2016 IEEE Conference on Computer Vision and Pattern Recognition (CVPR), pp. 779--788. doi:10.1109/CVPR.2016.91.
- Richter et al. (2017) Richter, A., Kazaryan, M., Shakhramanyan, M., Nedkov, R., Borisova, D., Stankova, N., Ivanova, I., Zaharinova, M., 2017. Estimation of thermal characteristics of waste disposal sites using landsat satellite images. Comptes rendus de l’Academie bulgare des Sciences 70.
- Ronneberger et al. (2015) Ronneberger, O., Fischer, P., Brox, T., 2015. U-net: Convolutional networks for biomedical image segmentation. arXiv:1505.04597.
- Russakovsky et al. (2015) Russakovsky, O., Deng, J., Su, H., Krause, J., Satheesh, S., Ma, S., Huang, Z., Karpathy, A., Khosla, A., Bernstein, M., Berg, A.C., Fei-Fei, L., 2015. ImageNet Large Scale Visual Recognition Challenge. International Journal of Computer Vision (IJCV) 115, 211--252. doi:10.1007/s11263-015-0816-y.
- Révolo-Acevedo et al. (2023) Révolo-Acevedo, R.H., Quispe-Reymundo, B.J., Rodríguez-Cerrón, M., Quispe-Quezada, U.R., Quispe-Quezada, L.P., Solano-Velarde, Z., Paredes-Atoche, V., 2023. Analyzing solid waste landfills using satellite imagery and designing new landfill reception areas. Journal of Applied and Natural Science 15, 732–740. URL: https://journals.ansfoundation.org/index.php/jans/article/view/4456, doi:10.31018/jans.v15i2.4456.
- Salleh and Tsudagawa (2002) Salleh, J.B., Tsudagawa, M., 2002. Classification of industrial disposal illegal dumping site images by using spatial and spectral information together, in: IMTC/2002. Proceedings of the 19th IEEE Instrumentation and Measurement Technology Conference (IEEE Cat. No. 00CH37276), IEEE. pp. 559--563.
- Seror and Portnov (2018) Seror, N., Portnov, B.A., 2018. Identifying areas under potential risk of illegal construction and demolition waste dumping using gis tools. Waste management 75, 22--29.
- Shaker et al. (2011) Shaker, A., Faisal, K., Yan, W.Y., 2011. Integration between ground-based and space-based measurements for monitoring landfill sites. Geomatics Technologies in the City .
- Shaker and Yan (2010) Shaker, A., Yan, W.Y., 2010. Trail road landfill site monitoring using multitemporal landsat satellite data. Department of civil engineering, Ryerson University, Toronto, Ontario .
- Silvestri and Omri (2008) Silvestri, S., Omri, M., 2008. A method for the remote sensing identification of uncontrolled landfills: formulation and validation. International Journal of Remote Sensing 29, 975--989.
- Simonyan and Zisserman (2015) Simonyan, K., Zisserman, A., 2015. Very deep convolutional networks for large-scale image recognition. arXiv:1409.1556.
- Song et al. (2023) Song, H., Wei, C., Yong, Z., 2023. Efficient knowledge distillation for remote sensing image classification: a cnn-based approach. International Journal of Web Information Systems ahead-of-print. URL: https://doi.org/10.1108/IJWIS-10-2023-0192, doi:10.1108/IJWIS-10-2023-0192.
- Sumbul et al. (2019) Sumbul, G., Charfuelan, M., Demir, B., Markl, V., 2019. Bigearthnet: A large-scale benchmark archive for remote sensing image understanding, in: IGARSS 2019 - 2019 IEEE International Geoscience and Remote Sensing Symposium, pp. 5901--5904. doi:10.1109/IGARSS.2019.8900532.
- Sun et al. (2023) Sun, X., Yin, D., Qin, F., Yu, H., Lu, W., Yao, F., He, Q., Huang, X., Yan, Z., Wang, P., Deng, C., Liu, N., Yang, Y., Liang, W., Wang, R., Wang, C., Yokoya, N., Hänsch, R., Fu, K., 2023. Revealing influencing factors on global waste distribution via deep-learning based dumpsite detection from satellite imagery. Nature Communications 14, 1444. URL: https://doi.org/10.1038/s41467-023-37136-1, doi:10.1038/s41467-023-37136-1.
- Taggio et al. (2022) Taggio, N., Aiello, A., Ceriola, G., Kremezi, M., Kristollari, V., Kolokoussis, P., Karathanassi, V., Barbone, E., 2022. A combination of machine learning algorithms for marine plastic litter detection exploiting hyperspectral prisma data. Remote Sensing 14. URL: https://www.mdpi.com/2072-4292/14/15/3606, doi:10.3390/rs14153606.
- Torres and Fraternali (2021) Torres, R.N., Fraternali, P., 2021. Learning to identify illegal landfills through scene classification in aerial images. Remote Sensing 13, 4520.
- Torres and Fraternali (2023) Torres, R.N., Fraternali, P., 2023. Aerialwaste dataset for landfill discovery in aerial and satellite images. Scientific Data 10, 63. URL: https://doi.org/10.1038/s41597-023-01976-9, doi:10.1038/s41597-023-01976-9.
- Troschinetz and Mihelcic (2009) Troschinetz, A.M., Mihelcic, J.R., 2009. Sustainable recycling of municipal solid waste in developing countries. Waste Management 29, 915--923. URL: https://www.sciencedirect.com/science/article/pii/S0956053X08001669, doi:https://doi.org/10.1016/j.wasman.2008.04.016.
- Ulloa-Torrealba et al. (2023) Ulloa-Torrealba, Y.Z., Schmitt, A., Wurm, M., Taubenböck, H., 2023. Litter on the streets - solid waste detection using vhr images. European Journal of Remote Sensing 56, 2176006. URL: https://doi.org/10.1080/22797254.2023.2176006, doi:10.1080/22797254.2023.2176006, arXiv:https://doi.org/10.1080/22797254.2023.2176006.
- Vambol et al. (2019) Vambol, S., Vambol, V., Sundararajan, M., Ansari, I., 2019. The nature and detection of unauthorized waste dump sites using remote sensing. Ecological Questions 30, 43--55.
- Vaswani et al. (2017) Vaswani, A., Shazeer, N., Parmar, N., Uszkoreit, J., Jones, L., Gomez, A.N., Kaiser, L., Polosukhin, I., 2017. Attention is all you need, in: Guyon, I., von Luxburg, U., Bengio, S., Wallach, H.M., Fergus, R., Vishwanathan, S.V.N., Garnett, R. (Eds.), Advances in Neural Information Processing Systems 30: Annual Conference on Neural Information Processing Systems 2017, December 4-9, 2017, Long Beach, CA, USA, pp. 5998--6008. URL: https://proceedings.neurips.cc/paper/2017/hash/3f5ee243547dee91fbd053c1c4a845aa-Abstract.html.
- Viezzoli et al. (2009) Viezzoli, A., Edsen, A., Auken, E., Silvestri, S., 2009. The use of satellite remote sensing and helicopter tem data for the identification and characterization of contaminated, in: Near Surface 2009-15th EAGE European Meeting of Environmental and Engineering Geophysics, EAGE Publications BV. pp. cp--134.
- Wang et al. (2023) Wang, D., Zhang, J., Du, B., Xia, G.S., Tao, D., 2023. An empirical study of remote sensing pretraining. IEEE Transactions on Geoscience and Remote Sensing 61, 1--20. doi:10.1109/TGRS.2022.3176603.
- Wen et al. (2023) Wen, C., Hu, Y., Li, X., Yuan, Z., Zhu, X.X., 2023. Vision-language models in remote sensing: Current progress and future trends. CoRR abs/2305.05726. URL: https://doi.org/10.48550/arXiv.2305.05726, doi:10.48550/ARXIV.2305.05726, arXiv:2305.05726.
- Xia et al. (2017) Xia, G.S., Hu, J., Hu, F., Shi, B., Bai, X., Zhong, Y., Zhang, L., Lu, X., 2017. Aid: A benchmark data set for performance evaluation of aerial scene classification. IEEE Transactions on Geoscience and Remote Sensing 55, 3965–3981. URL: http://dx.doi.org/10.1109/TGRS.2017.2685945, doi:10.1109/tgrs.2017.2685945.
- Yailymova et al. (2022) Yailymova, H., Mikava, P., Kussul, N., Krasilnikova, T., Shelestov, A., Yailymov, B., Titkov, D., 2022. Neural network model for monitoring of landfills using remote sensing data, in: 2022 IEEE 3rd International Conference on System Analysis & Intelligent Computing (SAIC), IEEE. pp. 1--4.
- Yan et al. (2014) Yan, W.Y., Mahendrarajah, P., Shaker, A., Faisal, K., Luong, R., Al-Ahmad, M., 2014. Analysis of multi-temporal landsat satellite images for monitoring land surface temperature of municipal solid waste disposal sites. Environmental monitoring and assessment 186, 8161--8173.
- Yang et al. (2022) Yang, K., Zhang, C., Luo, T., Hu, L., 2022. Automatic identification method of construction and demolition waste based on deep learning and gaofen-2 data. The International Archives of the Photogrammetry, Remote Sensing and Spatial Information Sciences XLIII-B3-2022, 1293--1299. URL: https://isprs-archives.copernicus.org/articles/XLIII-B3-2022/1293/2022/, doi:10.5194/isprs-archives-XLIII-B3-2022-1293-2022.
- Yang and Newsam (2010) Yang, Y., Newsam, S., 2010. Bag-of-visual-words and spatial extensions for land-use classification, in: Proceedings of the 18th SIGSPATIAL International Conference on Advances in Geographic Information Systems, Association for Computing Machinery, New York, NY, USA. p. 270–279. URL: https://doi.org/10.1145/1869790.1869829, doi:10.1145/1869790.1869829.
- Yin (2023) Yin, D., 2023. Global dumpsite test data. URL: https://doi.org/10.57760/sciencedb.07187, doi:10.57760/sciencedb.07187.
- Zhou et al. (2023) Zhou, L., Rao, X., Li, Y., Zuo, X., Liu, Y., Lin, Y., Yang, Y., 2023. Swdet: Anchor-based object detector for solid waste detection in aerial images. IEEE Journal of Selected Topics in Applied Earth Observations and Remote Sensing 16, 306--320. doi:10.1109/JSTARS.2022.3218958.