High resolution optical spectra of the dormant LBV star P Cyg
Abstract
High resolution optical spectra (R = 60 000) of the LBV star P Cyg beyond outburst
were obtained on the 6-meter BTA telescope in the wavelength range 477–780 nm. We
perform a detailed identification of different types lines (photospheric absorptions,
permitted and forbidden emissions, components of lines with P Cyg type profiles),
and studied the variability of their profiles and radial velocities.
The average radial velocity from positions of forbidden emissions ([N II] 5754.64,
[FeII] 5261.62, [FeII] 7155.14 and [NiII] 7377.83 Å) is accepted as the system
velocity Vsys= km/s. About a dozen photospheric absorptions of CNO triad ions
and Si III are found, their stable position, Vr(abs)= km/s, shifted relative
to at km/s, indicates that these absorbtions are formed in the pseudophotosphere
region. The high-excitation emissions ([OI] 5577, 6300, 6363 Å, [OIII] 4959 and
5007 Å, as well as HeII 4686 Å) are absent in the spectra.
The radial velocity Vr(DIBs)=km/s according to the position of numerous DIBs
is consistent with the position of the interstellar components of the D-lines NaI and
KI forming in the galactic Perseus arm. A color excess E(B-V)=0.34+/-0.03 mag and
interstellar absorption Av=1.09 mag were determined by measurements of equivalent
widths of nine DIBs.
Keywords: massive stars, LBVs, circumstellar medium, optical spectra, variability
1 Introduction
This paper is dedicated to the detailed study of the optical spectrum of the blue supergiant P Cyg (Sp=B1–2 Ia–0ep). The history of P Cyg’s brightness behavior in the 17th–18th centuries, following a sudden increase in its brightness by 3 magnitudes, recorded in the early 1600s, is outlined in the extensive publication by de Groot de Groot (1969). The documented episode of active state over several years later led to the classification of P Cyg as the LBV (Luminous Blue Variable) star nearest to the solar system. The concept of “Luminous Blue Variable” and the abbreviature LBV were introduced by Conti (1984) in 1984. Photometric monitoring of P Cyg over the next 400 years shows that the star mostly remains in a quiet (“dormant”) state.
The detailed history of the photometric behavior of the first historically known and nearest LBV star, P Cyg, as well as a summary of the results of spectroscopy of this star, are presented by the authors in reviews Humphreys and Davidson (1994); Israelian and de Groot (1999). Spectroscopy of P Cyg began almost three centuries after its massive outburst in 1600. In 1895, Campbell, in his review Campbell (1895) dedicated to stars whose spectra contain both bright and dark hydrogen lines, proposed selecting stars with intense emissions shifted to the short-wavelength region of absorptions as a separate type. The Pulkovo astronomer A. Belopol’sky Belopolsky (1899), who obtained spectra of P Cyg in 1899 with a prism spectrograph covering the wavelength range between H and H and identified several details, did not observe significant changes between spectra taken from September 21 to October 1, 1899. However, variability in the spectrum of P Cyg was noted in the early 20-th century Merrill (1913). Later, Adams and Merrill Adams and Merrill (1957) found variations in intensity and structure of absorptions in the star spectrum.
High mass loss rates and eruptive events, driven by the high luminosity-to-mass ratio of stars, lead to the formation of gas nebulae in the circumstellar environment of massive stars. As a result of these processes, the surface of such stars is heavy obscured, and their observed features (primarily the character of profiles of specific spectral details and their variability) mostly reflect manifestations of unstable processes in their envelopes. The authors of the article Jager and Israelian (2003) emphasize that for stars of this type, parameters are not related to the stellar photosphere, but pertain to the wind region. Often, the seemingly peculiar spectrum of these stars is complex, formed in the circumstellar environment, and may not contain details of the stellar atmosphere. The spectrum of the known star P Cyg falls into this category, and the SIMBAD mentions the presence of a complex emission nebula surrounding the star as one of the fundamental pieces of information about star.
By studying a sample of P Cyg spectra obtained in 1942–1964 on various telescopes, de Groot de Groot (1969) gathered data on line profiles and radial velocities for major spectral features (H I, He I, C II, N II, Si II, S II, Fe II, Fe III, and other ions). Analyzing the variability of their short-wavelength absorption components, the author concluded that they form in the expanding circumstellar environment. In the same work, an estimate of a high mass loss rate of year was made, and pulsation was indicated as the cause of the star’s brightness variability. In a subsequent study, authors Najarro et al. (1997), through modeling optical and IR spectroscopy data, determined a set of key parameters for P Cyg, calculated theoretical profiles of H I and He I lines, and significantly reduced the mass loss rate to year.
The primary characteristics of the optical spectrum of P Cyg were identified in the 1980s based on photographic spectra: powerful emissions of H I, He I with structured absorption components [11]. A spectral atlas was created by Markova and Kolka (1988) based on photographic spectra with a relatively low signal-to-noise ratio (S/N). Widely cited is another spectral atlas Stahl et al. (1993, 1994), based on echelle spectra covering a wide wavelength range, recorded using a CCD. The significance of this work lies in the detailed identification of the P Cyg spectrum within a broad wavelength range, around 500 nm. Analysis of data at moderate resolution (R=12 000) allowed the authors Stahl et al. (1994) to identify variability in emission intensity up to 30% and radial velocity (3050 km/s) on a timescale of several months. It is important to note that these authors found no clear correlation in the behavior of spectral and photometric features. They also did not observe the splitting of absorptions found earlier Markova and Kolka (1988). It should be noted that the atlas Stahl et al. (1993) is based on data obtained by averaging spectra taken on different dates from 1989 to 1991 with spectrographs at various observatories to enhance S/N. For a star with a variable spectrum, the averaging procedure can lead to the loss of some information about the behavior of line profiles and radial velocities.
Currently, P Cyg is a full-fledged prototype of hot, highly luminous, unstable stars (LBV). Its location on the Hertzsprung–Russell diagram near the luminosity limit in the instability strip of LBV stars is illustrative (see, for example, the informative Figure 3 in the review Weis and Bomans (2001)). The main parameters of the star are presented in the Turner et al. (2001) and compared with the parameters of related LBV stars and LBV candidates in the article Mahy et al. (2022), Table 1). Among related LBV stars, P Cyg stands out for two reasons. Firstly, along with Car, it belongs to the two stars in our Galaxy for which significant brightness changes have been recorded in the past. Secondly, P Cyg has an optical spectrum saturated with intense variable emission-absorption profiles of H I, He I, N II, S II, Fe II, and other ions, indicating matter outflow due to effective and variable wind. This feature of P Cyg profiles led to the recognition of the well-known now spectral phenomenon – the P Cygni-type profile (or inverse P Cyg). The richness of P Cyg spectrum with emissions of different origins requires detailed spectroscopy for its study. It is worth noting that in the early work of de Groot de Groot (1969), the terms “P Cyg-type profile” and “stars of the P Cyg type” were introduced into spectroscopy practice. Later, Lamers Lamers (1986) expanded the circle of objects with P Cyg type profile features and introduced the concept of the “astrophysical phenomenon of P Cyg-type profiles”.
The combination of observed photometric and spectral specificities of P Cyg is presented in the article de Gent and Lamers (1986) based on the extensive observations we already mentioned as de Groot (1969). An important result of the study de Gent and Lamers (1986) is the conclusion about the absence of any certain period of parameters changes: long-term data of weak photometric variability indicate a possible period range from 0.5 days to 18 years.
To date, several works have been published based on spectra of P Cyg obtained at various times, and even fewer high-resolution spectral data are available. The significance of the work Jager and Israelian (2003), based on a sample of high-resolution spectra (R=80 000) and high S/N ratio, obtained during the nights of May 28 to June 4, 1999, is evident. The authors of this work concluded that there are two periods of variability: one matching the photometric period of 17.3 days, and a longer one of about 100 days. Clearly, observations over a week are insufficient to study spectral variability. As noted by the authors Jager and Israelian (2003), the search for variability in the parameters of such a star is a “tricky task”.
The lack of spectral data of the required quality and volume has prompted us to initiate long-term spectroscopy of P Cyg to provide the search for variability in the profiles of spectral details and the velocity field based on homogeneous high-quality spectral data. This task will require multiple and possibly multiyear spectroscopy with high spectral resolution across a wide wavelength range. In this article, we present the results of the first stage of the work conducted to refine the identification of spectrum details, measure radial velocities, and identify spectral variability based on observations of P Cyg in 2021–2022. Section 2 of this paper briefly describes the methods of observations and data analysis. Section 3 presents the obtained results, while Sections 4 and 5 provide a discussion of our results and their comparison with previously published works, along with the main conclusions.
2 ECHELLE SPECTROSCOPY at BTA
The spectra used in this study were obtained with the echelle spectrograph NES Panchuk et al. (2017), permanently installed at the Nasmyth focus of the 6-m BTA telescope. The observation dates for the star are presented in Table 1. The spectrograph is equipped with a CCD matrix with a number of elements 46082048, and each element has a size of 0.01350.0135 mm; the readout noise is 1.8e-. Monitoring of P Cyg is conducted in the wavelength range nm. To minimize flux losses at the entrance slit, the echelle spectrograph NES is equipped with a star image slicer. With the use of the slicer, each spectral order is repeated three times. The spectral resolution of NES is R=60 000. In the spectra of P Cyg, the signal-to-noise ratio, S/N, varies by several orders of magnitude, from the continuum level to the peaks of the strongest emissions. In the continuum near 5000 Å, the ratio S/N=300360 for different observation dates.
Extraction of one-dimensional spectra from two-dimensional echelle frames was performed using a modified ECHELLE context in the ESO MIDAS package, accounting for the geometry of the echelle frame. All details of the procedure are described by authors Yushkin and Klochkova (2005). Cosmic ray traces were removed using the standard method–by median averaging a pair of sequentially obtained spectra. Th-Ar lamp was used for wavelength calibration. All subsequent steps in processing one-dimensional spectra were carried out using the current version of the DECH package Galazutdinov (2022).
The systematic error of heliocentric radial velocity measurements based on a set of numerous telluric details and interstellar lines of the Na I doublet does not exceed 0.25 km/s for a single line. For the averaged velocity values in Table 1, the errors of the mean depend on the type and number of measured lines.
Identification of features in the P Cyg spectra was performed using line lists from articles based on spectroscopy at BTA + NES of related hot, high-luminosity stars, including stars with the B[e] phenomenon Chentsov et al. (2010); Klochkova and Chentsov (2016); Miroshnichenko et al. (2022); Klochkova et al. (2022). Additionally, information from the VALD database (see Kupka et al. (1999) and references therein) was used for the identification of several spectral details.
| Vr, km/c | |||
|---|---|---|---|
| Type of features | 26.10.2021 | 08.09.2022 | 09.09.2022 |
| Pure absorbtions | (13) | (12) | (13) |
| Pure emis permit | (23) | (27) | (30) |
| Pure emis forb | (8) | (8) | (7) |
| P Cyg em HI HeI | (9) | (8) | (8) |
| P Cyg ab HI HeI | (10) | (10) | (10) |
| P Cyg other em | (23) | (19) | (25) |
| P Cyg other ab | (29) | (29) | (29) |
| DIBs | (20) | (31) | (24) |
3 RESULTS
3.1 Main Properties of the Spectrum
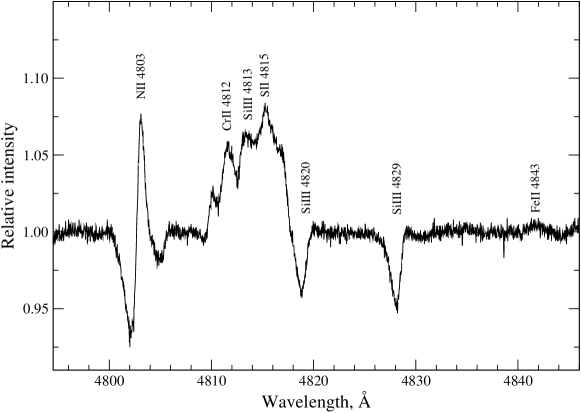
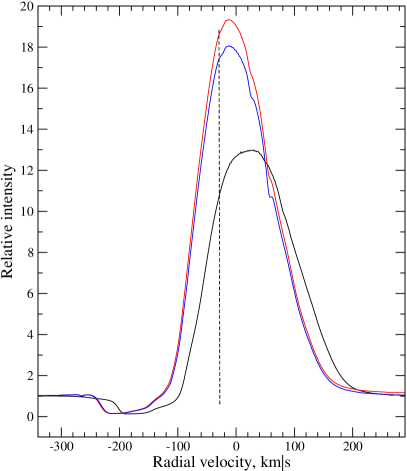
Figures 1, 2, and 3 with fragments of the P Cyg spectrum obtained in 2021 characterize the optical spectrum of P Cyg as a combination of diverse emissions. Primarily, these are lines of neutral hydrogen and helium with intense profiles of the classical P Cyg type. All figures in the text are based on P Cyg spectra obtained with the NES spectrograph. In Fig. 4, the relative intensity of the H emission is I/Icont14 in 2021 and reaches I/Icont18 in the 2022 spectrum.
The profiles of HI and HeI lines in spectra from different dates, as shown in Figs. 4 and 5, indicate variability in the intensity of peak emission and absorption components. As indicated in Table 1, the positions of the emission components of HI and HeI differ and noticeably change over time. The differences in the positions of absorption components are much higher: the standard deviation exceeds 10 km/s for the available dates.
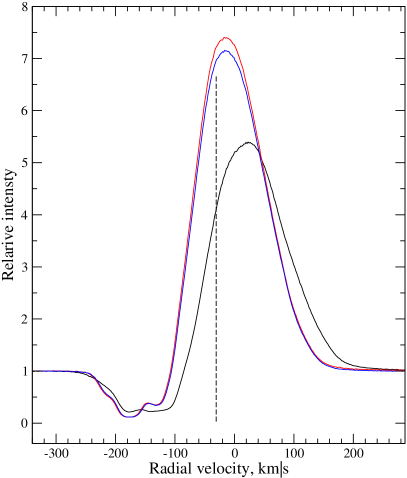
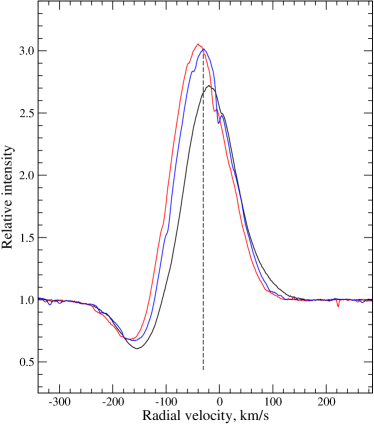
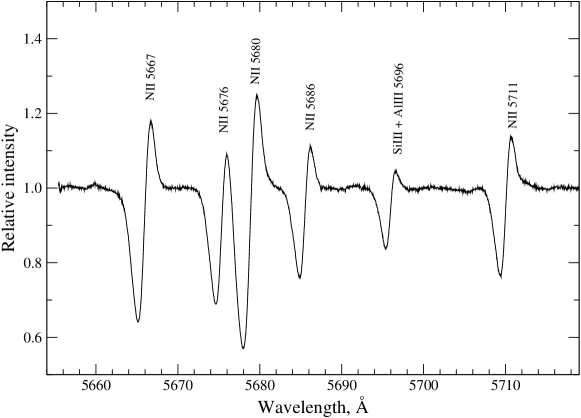
It is evident that the dominant contribution to the high velocity dispersion of wind absorptions is not measurement errors, but the real variability of this velocity and the presence of structure in these components. A quantitative study of this variability will be carried out in the future as the necessary collection of star spectra accumulates. From the data in the penultimate row of Table 1, the stability of the positions of emissions of the P Cyg type profiles for other elements (about three dozen emissions of NII, CII, Si II, Al III, [FeII]) is evident. As shown in Figs. 2, 3, and 6, the peak emissions of this series of lines also significantly exceed the continuum level. It is the radiation pressure caused by the plenty of such emissions in the Balmer and Lyman continuum that is the cause of the effective stellar wind according to Lamers (1986).
The earliest studies on P Cyg spectroscopy noted the presence of separate wind components in the absorptions of H I and He I, caused by recurrent matter dumps. These so-called DACs (Diffuse Absorptional Components) were termed “splitting” in the early papers by Markova Markova (2000). Markova noted the presence of this effect in the lines of H I and He I and she expected splitting even in Fe III emissions. Interestingly, the atlas Stahl et al. (1994) notes the complete absence of this effect, presumably due to low spectral resolution. Our observational data reliably record up to three separate wind components in the radial velocity interval of Vr km/s only in the H and H profiles presented in Fig. 4. The splitting effect is especially clearly seen in the H profiles, where the intensity difference between the peak values of emission and wind absorptions is many times smaller than in the H profiles.
We should emphasize that there is no splitting of profiles for lines of other elements in P Cyg spectra. This is illustrated, in particular, in Fig. 2, showing a fragment of the P Cyg spectrum containing a set of intense and unblended N II lines with P Cyg type profiles, as well as in Fig. 6 with the variable profile of one of these lines, NII 5666 Å, in spectra from different dates of our observations. The P Cyg spectrum also lacks forbidden emissions for nebulae [OI] 5577, 6300, 6363 Å, [OIII] 4959 and 5007 Å. There is also no emission of HeII 4686 Å, the absence of which in the P Cyg spectrum was emphasized by O. Struve Struve (1935), who identified numerous lines of NII, OII, Si III, SII, FeII in the optical range. In our spectra, we did not see forbidden emissions [CaII] 7291 and 7324 Å, which in the spectra of selected high-luminosity stars indicate the presence of a circumstellar disk. Spectra of the extremely luminosity star MWC 314 Miroshnichenko et al. (1998) or yellow hypergiant V1302 Aql Klochkova and Chentsov (2016) are excellent examples.
Powerful emissions of H I and He I in the P Cyg spectrum are combined with numerous weak emissions of NII, CII, Si II, Si III, FeII, FeIII, etc., having a wind absorption component. These permitted emissions coincide by 30% with the lines from the list in the paper Markova and de Groot (1997). Figure 2 well represents the features of this line sample: the intensity of these envelope emissions rarely exceeds 15–20% above the local continuum level. Average velocities are given in Table 1 for the positions of emission (P Cyg other em) and absorption (P Cyg other abs) components of these lines. The absorption component of these lines is shifted by less than km/s. The features of this type lines are well illustrated in Fig. 6, which shows the profile of a typical and sufficiently intense NII 5666 Å line.
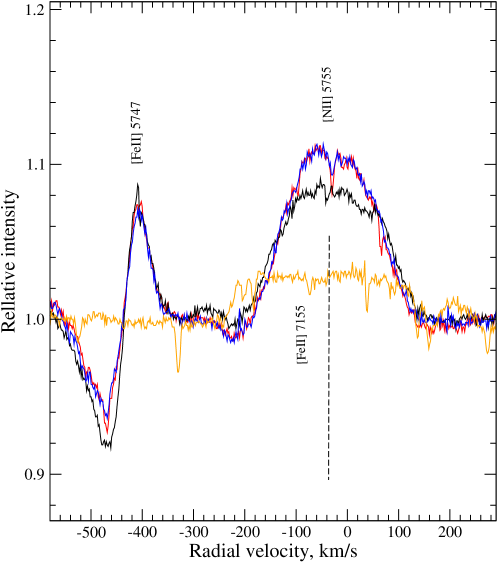
The intensity of forbidden emissions is even lower, the most noticeable of which is the forbidden nitrogen line [NII] 5755 Å (see Fig. 7). This emission is a crucial marker, the presence of which in the spectrum allows a priori assigning a high-luminosity star to the small family of LBV stars. The forbidden emission [NII] 6583 Å, close in origin to the emission [NII] 5755 Å, is absent in the P Cyg spectrum or blended with the CII 6582.9 Å emission.
3.2 Radial Velocity Pattern
The high S/N ratio in our P Cyg spectra allowed to identify additional details compared to the photographic spectrum in the atlas Markova and Zamanov (1995). A complicating factor in detailed identification of the emission spectrum is the low intensity of permitted emissions of metal ions, except for NII lines. The nebula in the P Cyg system belongs to a rarely observed peculiar type: the authors of Nota et al. (1995) indicated that this faint spherical Weis and Bomans (2001) nebula consists of individual clumps with a size of 2–3 arcsec, distributed along an enevelope with a diameter of about 20 arcsec. This nebula is also characterized by an extremely small mass of ionized gas, 0.00092 Barlow et al. (1994). The small volume of the gaseous envelope manifests itself in a combination of weak permitted and forbidden emissions of various origin. The emission profiles presented in Figs. 4, 5, and 8 demonstrate significant differences in the peak intensities of emission and absorption components while coinciding in the range of their Vr values.
Forbidden emissions. Figure 7 illustrates the constancy of the position of the forbidden emission [N II] 5755 Å, allowing us to adopt the radial velocity value Vr(5755) as the systemic velocity Vsys= km/s. The authors of Smith and Hartigan (2006) determined Vsys= km/s (LSR km/s), based on a sample of forbidden emissions in the IR spectrum of P Cyg. The systemic velocity value, LSR km/s, corresponds to the location of P Cyg in the Perseus arm Vallo (2005) and is consistent with the star’s distance according to the current value of its parallax.
A close position (Vr km/s) in P Cyg spectra is occupied by a broad, Å, emission at a wavelength of 7155 Å with a flat top and low intensity, about 3% above the continuum level. The profile of this forbidden emission is also shown in Fig. 7. In the atlas Stahl et al. (1993), this detail is identified as the forbidden emission [FeII] 7155 Å, and in the spectral atlas of MWC 314 and V1302 Aql Chentsov et al. (1999), the refined wavelength of the emission [FeII] 7155.14 Å is given. It is noteworthy that in the spectra of these two peculiar hypergiants, MWC 314 and V1302 Aql, the relative intensity of the [FeII] 7155 Å emission is substantially higher than in the P Cyg spectrum: I/Icont.
For all dates of our observations, we recorded two additional broad emissions with flat tops in the P Cyg spectrum. One of them at a wavelength of 7377 Å, its position corresponds to a velocity of Vr= km/s. In the atlas Chentsov et al. (1999), an unidentified feature is also found at this wavelength, I/Icont. Earlier, such a feature in the P Cyg spectrum was identified by the authors Stahl et al. (1993) as the forbidden line [Ni II] 7380 Å. The peak of the emission profile at 7377 Å is not entirely flat; the profile is overall similar to the profiles of forbidden [FeII] lines in the IR spectrum of P Cyg, presented by Mizumoto et al. (2018). Due to the high S/N ratio, we also identified a weak, I/Icont, emission of [FeII] 5261.62 Å, its position is Vr= km/s and its width is Å.
It should be emphasized that the profile shapes of [FeII] 7155 and [NiII] 7377 Å emissions significantly differ from the profile of [NII] 5755 Å and remind us of numerous emissions with “rectangular” profiles in the spectrum of B[e] star CI Cam (see, e.g., Miroshnichenko et al. (2002)). The distinguished positions of these four forbidden emissions allow us to speak about the stratification of the circumstellar environment, due to the presence of low-density structure, detectable both kinematically and in terms of physical conditions.
We identified a total of 8 forbidden emissions in the P Cyg spectra, and the averaged Vr values (and the error of the average) corresponding to their positions in the spectra for our nights is indicated in the 3rd row of Table 1. From this data, it follows that forbidden emissions, on average, are formed above the Vsys level. The mechanisms of excitation of forbidden emissions (fluorescent excitation due to UV radiation from the star itself and impact collisions) in nebulae, including the circumstellar environment of P Cyg, are discussed in Smith and Hartigan (2006); Lucy (1991).
Photospheric absorptions. A crucial task in studying spectra of high-luminosity stars, filled with circumstellar emissions, is the search and identification of absorptions formed in the star’s atmosphere (or in the pseudophotosphere). In the spectrum of P Cyg, we identified only a small set of unblended absorptions of several ions: Figure 1 contains two absorptions, Si III 4819.71 and 4828.95 Å, from this sample. All identified absorptions listed in Table 2 are very faint, with depths less than 4–5 continuum level. Moreover, some lines (marked in the list with a colon) may be blends. The line OII 6721.388 Å is free from blending, its depth is 0.025, and its corresponding velocity is close to the Vr values from other absorptions in the list. Overall, the data in Tables 1 and 2 indicate a stable velocity value for the identified photospheric absorptions. The averaged velocity value, Vr(abs)= km/s, shifted relative to Vsys by km/s, suggests that these absorptions are formed in the pseudophotosphere. The stability of Vr(abs) allows for a preliminary conclusion about the absence of a stellar companion in the P Cyg system.
| Vr, km/s | |||
|---|---|---|---|
| Absorbtions | 26.10.2021 | 08.09.2022 | 09.09.2022 |
| 4699.218 OII | -75.66 | -68.38 | |
| 4705.346 OII | -73.27 | -82.46 | -73.27 |
| 4819.712 SiIII | -73.31 | -66.68 | -72.80 |
| 4828.951 SiIII | -73.42 | -70.04 | -67.65 |
| 4943.005 OII: | -85.20 | -82.90 | -77.78 |
| 5002.703 NII | -67.02 | -61.24 | -61.50 |
| 5010.621 NII: | -84.85 | -82.83 | -81.95 |
| 5032.120 OII | -77.21 | -79.81 | -80.05 |
| 5044.900 CII: | -75.42 | -76.20 | -75.01 |
| 5133.282 CII | -72.61 | -68.25 | -76.72 |
| 5145.165 CII | -77.85 | -77.75 | -77.32 |
| 5452.000 NII: | -70.23 | -64.76 | -65.51 |
| 6721.388 OII | -75.29 | -74.93 | -70.96 |
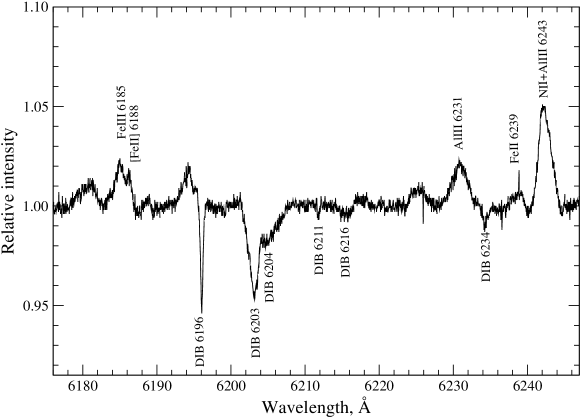
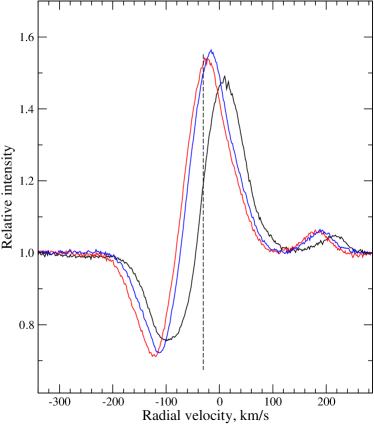
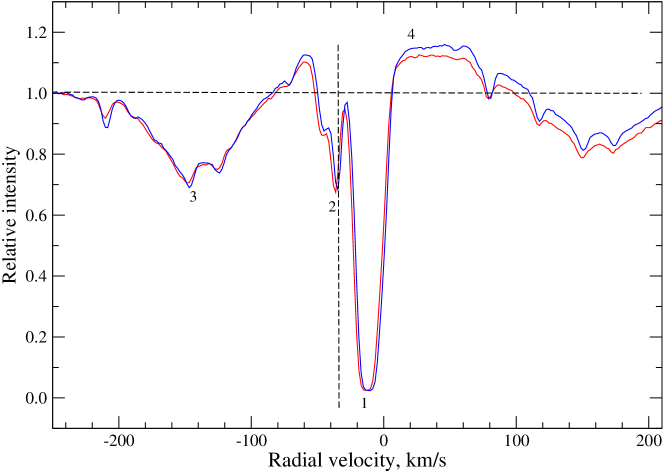
Interstellar features. The spectrum of P Cyg contains numerous absorptions formed in the interstellar medium: components of Na I D-lines, interstellar absorption of KI 7697 Å, and several Diffuse Interstellar Bands (DIBs). To illustrate, Figure 9 shows the profile of the NaI 5890 Å line. This multi-component profile includes: interstellar line “1”, short-wavelength absorptions “2” and “3”, and a broad emission “4”. The position of the interstellar absorption “1” agrees with the radial velocity from the positions of interstellar DIBs (see the bottom row of Table 1). The radial velocity value Vr(KI)= km/s from measurements of the position of the interstellar line KI 7697 Å, shown in Fig. 9 with a short vertical line, also agrees with the velocity of the interstellar component “1”. Weak absorption “2”, almost unshifted relative to Vsys, is evidently formed in the extended gas envelope of P Cyg. The most interesting components of the profile are the redshifted emission “4” and the broad absorption “3”, the velocity range of which from to km/s allows us to consider the pair of features “3–4” as a complex P Cyg-type profile of the NaI 5890 Å line. The presence of a P Cyg-type profile in the NaI D-lines in the spectrum of this star was previously identified Markova (2000). However, with higher-quality spectra, we identified the regions of formation for all components “1–4”.
A similar anomaly of NaI D-line profiles was previously recorded Klochkova et al. (2008) in the spectra of the F-supergiant V2324 Cyg (a central star of the IR source IRAS 20572+4919) with an unclear evolutionary status. The H line in the spectrum of this star has a time-variable P Cyg-type profile. Both NaI D-lines have P Cyg-type profiles and contain deep interstellar absorptions (see Fig. 2 in Klochkova et al. (2008)). Moreover, in the spectra of V2324 Cyg, whose Galactic coordinates are close to those of P Cyg, the position of NaI interstellar absorptions and DIBs, Vr=13) km/s, agrees with the position of these interstellar features in the spectra of P Cyg. It is also noted that in the spectrum of V2324 Cyg, both NaI D-lines have a significantly shifted (by Vr=225) km/s for different observation times of this star) wind absorption. Clearly, such a fast wind is incompatible with the belonging of V2324 Cyg to low-mass post-AGB supergiants.
| Å | Wλ,mÅ | |
|---|---|---|
| 4963.850 | 6 | 0.25 |
| 5780.632 | 179 | 0.42 |
| 5797.274 | 58 | 0.3 |
| 5849.869 | 10 | 0.2 |
| 6196.063 | 22 | 0.3 |
| 6203.192 | 60 | 0.5 |
| 6269.884 | 24 | 0.3 |
| 6284.198 | 364 | 0.4 |
| 6613.766 | 44 | 0.25 |
| 6660.815 | 19 | 0.4 |
By measuring the equivalent widths of DIBs listed in Table 3 and applying the calibration dependences of versus from Kos and Zwitter (2013), we obtained an average color excess of mag for 10 interstellar bands. Using the standard ratio R=3.2, we estimate the interstellar absorption to be Av=1.09 mag.
4 DISCUSSION OF THE RESULTS
P Cyg is an unique LBV star due to its giant outburst in 1600, which resulted in an inflated envelope – a rare and historic event. In addition, its proximity to the Sun allows for detailed, high-quality observations across various wavelength regions, providing crucial insights into the physics and evolution of massive stars.
The optical spectrum of P Cyg, besides the mentioned features, is notably rich in nitrogen features. This includes numerous lines of N II ions with P Cyg-type profiles, several N II photospheric absorptions, and forbidden emission [N II] (see Figs. 6 and 7). The nitrogen enrichment in the spectrum of this evolved massive star is naturally explained by the accumulation of nitrogen in preceding stages of massive star evolution and subsequent ejection of freshly synthesized chemical elements into the circumstellar environment. Excess nitrogen content has also been found in the atmosphere of the above mentioned evolved massive star V1302 Aql. As demonstrated by the authors Klochkova et al. (1997), the equivalent widths of N II absorptions in the spectrum of V1302 Aql are much higher than for the same lines in the spectrum of the supergiant HD 13476 with similar parameters. Analogous saturation by nitrogen features is revealed by Klochkova et al. (2022) in the optical spectrum of the LBV candidate Schulte 12 in the Cyg OB2 association.
Several identified details in the spectrum of P Cyg allow for a comparison with the star MWC 314, which, due to its extremely high luminosity, was considered a LBV candidate Miroshnichenko et al. (1998). However, subsequent studies of its high resolution spectra revealed variability in radial velocity and emission profile shapes Frasca et al. (2016). These results led the authors Frasca et al. (2016) to classify MWC 314 as a binary system, including a supergiant with a B[e] phenomenon. The results of this study confirm the particular significance of high resolution spectroscopy in fixation the evolutionary status of evolved massive stars. Moreover, the solution to this task is complicated by the spectral mimicry of supergiants, as detailed by the authors Klochkova and Chentsov (2018).
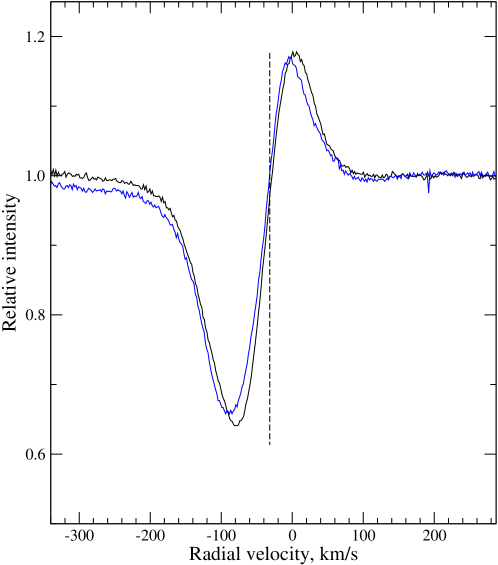
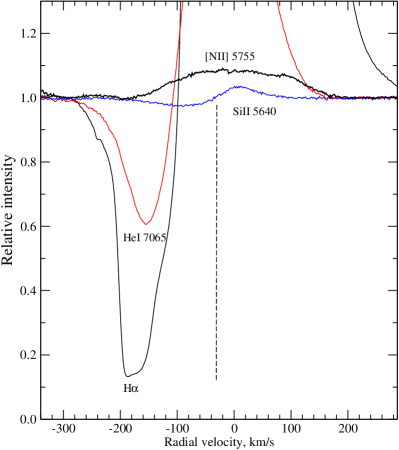
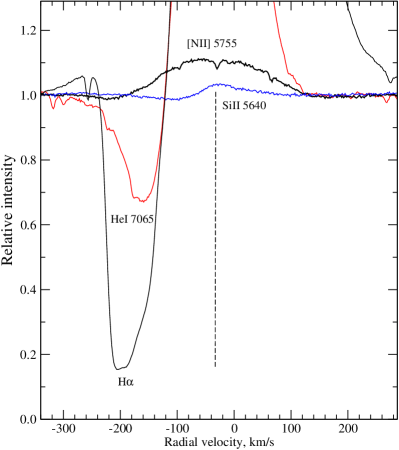
The set of spectral features of different natures in the spectrum of P Cyg provides a considerable diversity of observed profiles. This diversity is illustrated in the figures presented in the text, particularly Figs. 6 and 7, as well as Fig. 8, which compares profiles of selected lines in the spectra of P Cyg obtained on October 26, 2021 (left panel) and September 9, 2022 (right panel): the lower part of the H line (thin black curve), HeI 7065 Å (red curve), [N II] 5755 Å (bold black curve), SiII 5640 Å (blue curve).
Clearly, the high luminosity near the Humphreys-Davidson limit (see the data in the review Weis and Bomans (2001), specific behaviors of P Cyg’s photometric parameters over a time span of over 400 years (see Fig. 4 in Lamers (1986)), and the richness of emissions of various natures in its optical spectrum, including forbidden and permitted lines, serve as indisputable grounds for classifying P Cyg as an LBV star currently in a dormant state.
5 Coclusions
As evident from the publications listed in the Introduction, it is challenging to expect the detection of spectral variability in the P Cyg spectrum with only three nights of observations. Nevertheless, we have managed to derive several new conclusions. The key outcomes of our study include the following:
-
•
due to the high spectral resolution in P Cyg’s spectra, the majority of spectral details of various types have been identified, encompassing photospheric absorptions of CNO triad ions, pure metal emissions, forbidden emissions (particularly [N II], [S II], [NiII]), and lines with P Cyg-type profiles featuring wind absorption positions in a broad range of radial velocities, km/s.
-
•
the systemic velocity is fixed at Vsys= km/s based on the stable positions of four forbidden emissions, including [N II] 5755 Å.
-
•
no forbidden emissions, such as [O I] 5577, 6300, 6363 Å, [OIII] 4959 and 5007 Å, as well as high excitation HeII 4686 Å emission, were detected.
-
•
the stability of the position of revealed photospheric absorptions, with an average velocity, Vr(abs)= km/s, lower than Vsys by km/s suggests that these absorptions form in the pseudophotosphere. This result, indicating the absence of a companion in the P Cyg system, requires further observations for confirmation.
-
•
DACs were observed only in the profiles of H I and He I lines.
-
•
variability of the intensity of peak emission values, V/R ratios, and their positions was observed for all features with P Cyg-type profiles.
-
•
the regions of formation for all four components of Na I D-line profiles are identified.
-
•
interstellar absorption, Av=1.09 mag, was determined based on the intensities of a set of DIBs.
The results obtained in the initial stage of spectral monitoring of P Cyg allow us to assert the effectiveness of our approach in addressing the task of searching and studying the variability of the star’s complex spectrum. The extremely rare reocurrence of giant outbursts indicates the need for prolonged spectral monitoring with high spectral resolution across a broad wavelength range.
ACKNOWLEDGMENTS
This study used information from astronomical databases SIMBAD, VALD, SAO/NASA ADS, and Gaia DR3.
FUNDING
Observations on the 6-m telescope of the Special Astrophysical Observatory of the Russian Academy of Sciences were supported by the Ministry of Science and Higher Education of the Russian Federation.
References
- de Groot (1969) M. de Groot, Bull. Astron. Inst. Netherland, 20 225 (1969).
- Conti (1984) P.S. Conti, In: Observational Tests of the Stellar Evolution Theory, Geneva, Switzerland, September 12–16, 1983, Ed. by A. Maeder and A. Renzini, Proc. IAU Symp. 105, 233 (1984).
- Humphreys and Davidson (1994) R.M. Humphreys and K. Davidson, Publ. Astron. Soc. Pacif. 106 1025 (1994).
- Israelian and de Groot (1999) G. Israelian and M. de Groot, Space Sci. Rev. 90 493 (1999).
- Campbell (1895) W.W. Campbell, Astrophys. J. 2 177 (1895).
- Belopolsky (1899) A.A. Belopolsky, Astrophys. J. 10 319 (1899).
- Merrill (1913) P.W. Merrill, Lick Observ. Bull. 8 24 (1913).
- Adams and Merrill (1957) W.S. Adams and P.W. Merrill, Astrophys. J. 125 102 (1957).
- Jager and Israelian (2003) C. de Jager and G. Israelian, New Astron. 8 475 (2003).
- Najarro et al. (1997) F. Najarro, D.J. Hillier, and O. Stahl, Astron. Astrophys. 326 1117 (1997).
- Markova and Kolka (1989) N. Markova and I. Kolka, An Atlas of Spectral Line Profiles of P Cygni in 1981–1983 (Valgus, Tallinn, 1989) [in Russian].
- Stahl et al. (1993) O. Stahl, H. Mandel, B. Wolf, Th. Gaeng, A. Kaufer, R. Kneer, Th. Szeifert, and F. Zhao, Astron. Astrophys. Suppl. Ser. 99 167 (1993).
- Stahl et al. (1994) O. Stahl, B. Wolf, Th. Gaeng, A. Kaufer, H. Mandel, Th. Szeifert, and F. Zhao, Astron. Astrophys. Suppl. Ser. 107 1 (1994).
- Markova and Kolka (1988) N. Markova and I. Kolka, Astrophys. Space Sci. 141 45 (1988).
- Weis and Bomans (2001) K. Weis and D. Bomans, Galaxies 8 20 (2020).
- Turner et al. (2001) D.G. Turner, A. Horsford, M. Heysmour, and W. Feibelman, J. AAVSO 29 73 (2001).
- Mahy et al. (2022) L. Mahy, C. Lanthermann, D. Hutsemekers, J. Kluska, et al., Astron. Astrophys. 657 A4 (2022).
- Lamers (1986) H.G.L.M. Lamers, In: Luminous Stars and Associations in Galaxies, Proc. IAU Symp. 116 157 (1986).
- de Gent and Lamers (1986) R.H. de Gent and H.G.L.M. Lamers, Astron. Astrophys. 158 335 (1986).
- Panchuk et al. (2017) V.E. Panchuk, V.G. Klochkova, and M.V. Yushkin, Astron. Rep. 61 820 (2017).
- Yushkin and Klochkova (2005) M.V. Yushkin and V.G. Klochkova, Preprint SAO No. 206 (2005).
- Galazutdinov (2022) G.A. Galazutdinov, Astrophys. Bull. 77 519 (2022).
- Chentsov et al. (2010) E.L. Chentsov, V.G. Klochkova, and A.S. Miroshnichenko, Astrophys. Bull. 65 150 (2010).
- Klochkova and Chentsov (2016) V.G. Klochkova and E.L. Chentsov, Astrophys. Bull. 71 33 (2016).
- Miroshnichenko et al. (2022) A.S. Miroshnichenko, V.G. Klochkova, E.L. Chentsov, V.E. Panchuk, M.V. Yushkin, and N. Manset,mMon. Not. R. Astron. Soc. 507 879 (2022).
- Klochkova et al. (2022) V.G. Klochkova, E.S. Islentieva, and V.E. Panchuk, Astron. Rep. 66 998 (2022).
- Kupka et al. (1999) F. Kupka, N. Piskunov, and T. Ryabchikova, Astron. Astrophys. Suppl. Ser. 138 119 (1999).
- Markova (2000) N. Markova, Astron. Astrophys. Suppl. Ser. 144 391 (2000).
- Struve (1935) O. Struve, Astrophys. J. 81 66 (1935).
- Miroshnichenko et al. (1998) A.S. Miroshnichenko, Y. Fremat, L. Houziaux, Y. Andrillat, E.L. Chentsov, and V.G. Klochkova, Astron. Astrophys. Suppl. Ser. 131 469 (1998).
- Markova and de Groot (1997) N. Markova and M. de Groot, Astron. Astrophys. 326 1111 (1997).
- Markova and Zamanov (1995) N. Markova and R. Zamanov, Astron. Astrophys. Suppl. Ser. 111 499 (1995).
- Nota et al. (1995) A. Nota, M. Livio, M. Clampin, and R. Schulte-Ladbeck, Astrophys. J. 448 788 (1995).
- Barlow et al. (1994) M.J. Barlow, J.E. Drew, J. Meaburn, and R.M. Massey, Mon. Not. R. Astron. Soc. 268 L29 (1994).
- Smith and Hartigan (2006) N. Smith and P. Hartigan, Astrophys. J. 638 1045 (2006).
- Vallo (2005) J.P. Vallo, Astron. J. 135 1301 (2005).
- Chentsov et al. (1999) E.L. Chentsov, V.G. Klochkova, and N.S. Tavolganskaya, Astrophys. Bull. 48 25 (1999).
- Mizumoto et al. (2018) M. Mizumoto, N. Kobayashi, S. Hamano, Y. Ikeda, et al., Mon. Not. R. Astron. Soc. 481 793 (2018).
- Miroshnichenko et al. (2002) A. S. Miroshnichenko, V. G. Klochkova, K. S. Bjorkman, and V. E. Panchuk, Astron. Astrophys. 390 627 (2002).
- Lucy (1991) L.B. Lucy, Astron. Astrophys. 294 555 (1995).
- Klochkova et al. (2008) V.G. Klochkova, E.L. Chentsov, and V.E. Panchuk, Astrophys. Bull. 63 112 (2008).
- Kos and Zwitter (2013) J. Kos and T. Zwitter, Astrophys. J. 774 72 (2013).
- Klochkova et al. (1997) V.G. Klochkova, E.L. Chentsov, and V.E. Panchuk, Mon. Not. R. Astron. Soc. 292 19 (1997).
- Frasca et al. (2016) A. Frasca, A.S. Miroshnichenko, C. Rossi, M. Friedjung, E. Marilli, G. Muratorio, and I. Busá, Astron. Astrophys. 585 A60 (2016).
- Klochkova and Chentsov (2018) V.G. Klochkova and E.L. Chentsov, Astron. Rep. 62 19 (2018).