The invisible black widow PSR J1720-0534: implications for the electron density towards the North Polar Spur
Abstract
Radio emission from pulsars can be used to map out their distances through dispersion measure (DM), which quantifies the amount of radio pulse dispersion. However, this method relies on accurately modeling the free electron density in the line of sight. Here, we present a detailed study of the multi-wavelength emission from PSR J1720-0534, a black widow compact binary millisecond pulsar discovered in 2021, which the latest electron density model of the Galaxy (YMW16; Yao et al., 2017) places at only 191 pc. We obtained and analyzed deep multi-wavelength observations in the -ray (Fermi-LAT, 2008-2022), optical (LCO, 2.7-h), near-infrared (NOT, 3.5-h) and X-ray (Swift-XRT, 10 ksec) bands. We found no significant detection of -ray, optical, near-infrared, or X-ray counterparts around the radio-timing position of PSR J1720-0534, which we thus nickname ‘the invisible black widow’. Employing the most constraining near-infrared limit ( mag), we established a lower limit on the source distance, kpc, assuming conservative properties for the black widow companion star. This distance lower limit differs drastically (by a factor of more than five) from the YMW16 DM distance estimate. We attribute this difference to the inclusion in the YMW16 model of a large and dense component towards the North Polar Spur. Considering our results and recent parallax distances to other pulsars in this direction, we argue that such a local and large component in the electron density model of the Galaxy is unnecessary.
keywords:
Galaxy: local interstellar matter – pulsars: general – pulsars: individual: PSR J1720-0534 – stars: distances – stars: neutron1 Introduction
The radio sky outside the Galactic plane exhibits several prominent emission features, with large radio loops dominating the high-latitude sky (e.g., Berkhuijsen et al., 1971; Haslam et al., 1971). The North Polar Spur (NPS) stands out as the most significant among these features (Hanbury Brown et al., 1960). This structure has been recognized as part of the Loop I configuration known since the 1950s (Baldwin, 1955). The NPS is a particularly bright streak of radio emission perpendicular to the Galactic plane, spanning from , up to Galactic latitudes of . The prevailing explanation for the existence of these large loops involves one or more supernova remnants that originated in close proximity to the Solar system, within a few tens of parsecs, which occurred relatively recently, within the past years (e.g., Spoelstra, 1973; Salter, 1983).
Several radio filaments exist within Loop I towards the Galactic center, and not all of them are thought to be associated with nearby structures. A notable example are the Fermi bubbles, which form a double-lobed feature centered on the Galactic center, detected at gamma-ray energies (Su et al., 2010) and microwave wavelengths (Dobler et al., 2010). The northern bubble extends to a latitude of and has a width of in longitude. The likely origin of the Fermi bubbles is attributed to either relatively recent AGN-type activity at the Galactic center involving a remnant of a jet ejection event or a bipolar Galactic wind from starburst activity (Su et al., 2010). In addition, recent studies have questioned the local origin of NPS/Loop I (Predehl et al., 2020; Ryoji et al., 2023), with some earlier works also suggesting a distant origin (e.g., Sofue, 2000), pointing towards much larger, Galactic-scale structures. From our viewpoint inside the Galaxy, a mixture of nearby and galactocentric radio structures can likely explain the produced radio loops and filaments (Lallement, 2023).
PSR J1720-0534 is an eclipsing compact binary millisecond pulsar (CBMP) located at the Galactic coordinates and in the direction of NPS/Loop I/Fermi Bubbles, and was discovered in 2021 using the Chinese Five-hundred-meter Aperture Spherical Telescope (FAST). Wang et al. (2021) and Miao et al. (2023) reported a rotational period of ms for this pulsar orbiting a M⊙ brown dwarf companion in a 3.16-hour orbit. The light mass of the companion places the source in the CBMP sub-category of black widows (BWs; Fruchter et al., 1988), which typically have semi-degenerate brown dwarf companions with masses of M⊙. Using the most recent electron density model of Yao et al. (2017, hereafter YMW16), PSR J1720-0534 was estimated to be at a distance of pc, making it the nearest BW known so far. However, using the older electron distribution model from Cordes & Lazio (2002, hereafter NE2001), the source distance is estimated to be much farther at 1.3 kpc.
In this paper, we present a detailed -ray, near-infrared, optical and X-ray analysis of the region around PSR J1720-0534 (Section 2). We do not find a significant detection of the counterpart in any of the studied wavelengths (Section 3). Our deep limiting near-infrared magnitude can place constraints on the source distance, assuming that the companion star is not atypically small or cold (Section 3.2). We discuss the implication for the large and dense component representing the NPS/Loop I in YMW16 (Section 4.1). We argue that the DM of PSR J1720-0534 is mostly due to the Galactic thick disk component, which results in a likely distance of 3.1 kpc (Section 4.2). We conclude and summarize in Section 5.
2 Observations and Data Analysis
2.1 Optical
We observed PSR J1720-0534 using the MuSCAT3 multi-channel optical imager mounted on the 2-m Las Cumbres Observatory (LCO) telescope on May 28, 2022. The exposures, lasting 10 minutes each, were simultaneously taken using the g’, r’, i’ and zs camera channels in a field-of-view around our target. We gathered a total of hours of observations, with a full width at half maximum (FWHM) ranging from 0.9" to 1.6" across the images.
We processed the data using the banzai data-processing pipeline.111https://lco.global/documentation/data/BANZAIpipeline/, which included tasks such as bad-pixel masking, bias subtraction and flat field correction. Additionally, we combined the images into a single deep image for each of the four optical bands g’, r’, i’ and zs, to enhance source detection sensitivity.
2.2 Near-infrared
We observed PSR J1720-0534 with the NOTCam near-infrared instrument at the Nordic Optical Telescope (NOT) on June 13, 2023. We utilized the imaging mode and the J-band filter. The observations comprised 24 sequences of 9-point dither images, shifted in a 33 grid pattern around the source with a step size of 10". Each dither image was taken in ramp-sampling mode, with ten readouts every six seconds during a 60-second integration time. Thus, the total integration time per single dither sequence was 540 seconds, resulting in a total observation time of 3.6 hours. The FWHM measured in the J-band images ranged from 0.54" to 0.8" over the observation.
We processed the data using the NOTcam quicklook v.2.6 reduction package.222 http://www.not.iac.es/instruments/notcam/guide/observe.html The reduction process included creating a differential master flat, implementing linearity corrections and bad pixel masking, performing sky subtraction, and stacking the dithered images. Additionally, we stacked the combined dither images to create a single deep image to search for the infrared counterpart of PSR J1720-0534.
2.3 X-rays
We reduced and analyzed the X-ray Telescope data of PSR J1720-0534 from the Neil Gehrels Swift Observatory (Swift/XRT, Burrows et al., 2005). We obtained a target-of-opportunity observation on January 24, 2023, with a net exposure of approximately 10 ksec. Using xselect v2.5 in HEASoft 6.31.1, we extracted an image in the 0.3–10 keV band derived from the cleaned photon counting mode event data (obtained by running xrtpipeline v0.13.6). Source detection in the generated image was performed using the detect algorithm with no significantly detected sources in the image. The upper limit estimation was carried out using the sosta algorithm in the HEASoft’s X-ray image analysis package Ximage v4.5.1 at the location of PSR J1720-0534 using source half-box size of 5 pixels and rectangular background annulus with the inner half-box size of 20 pixels and outer half-box size 38 pixels. The resulting 3- upper limit is 0.0015 cts/s.
2.4 -rays
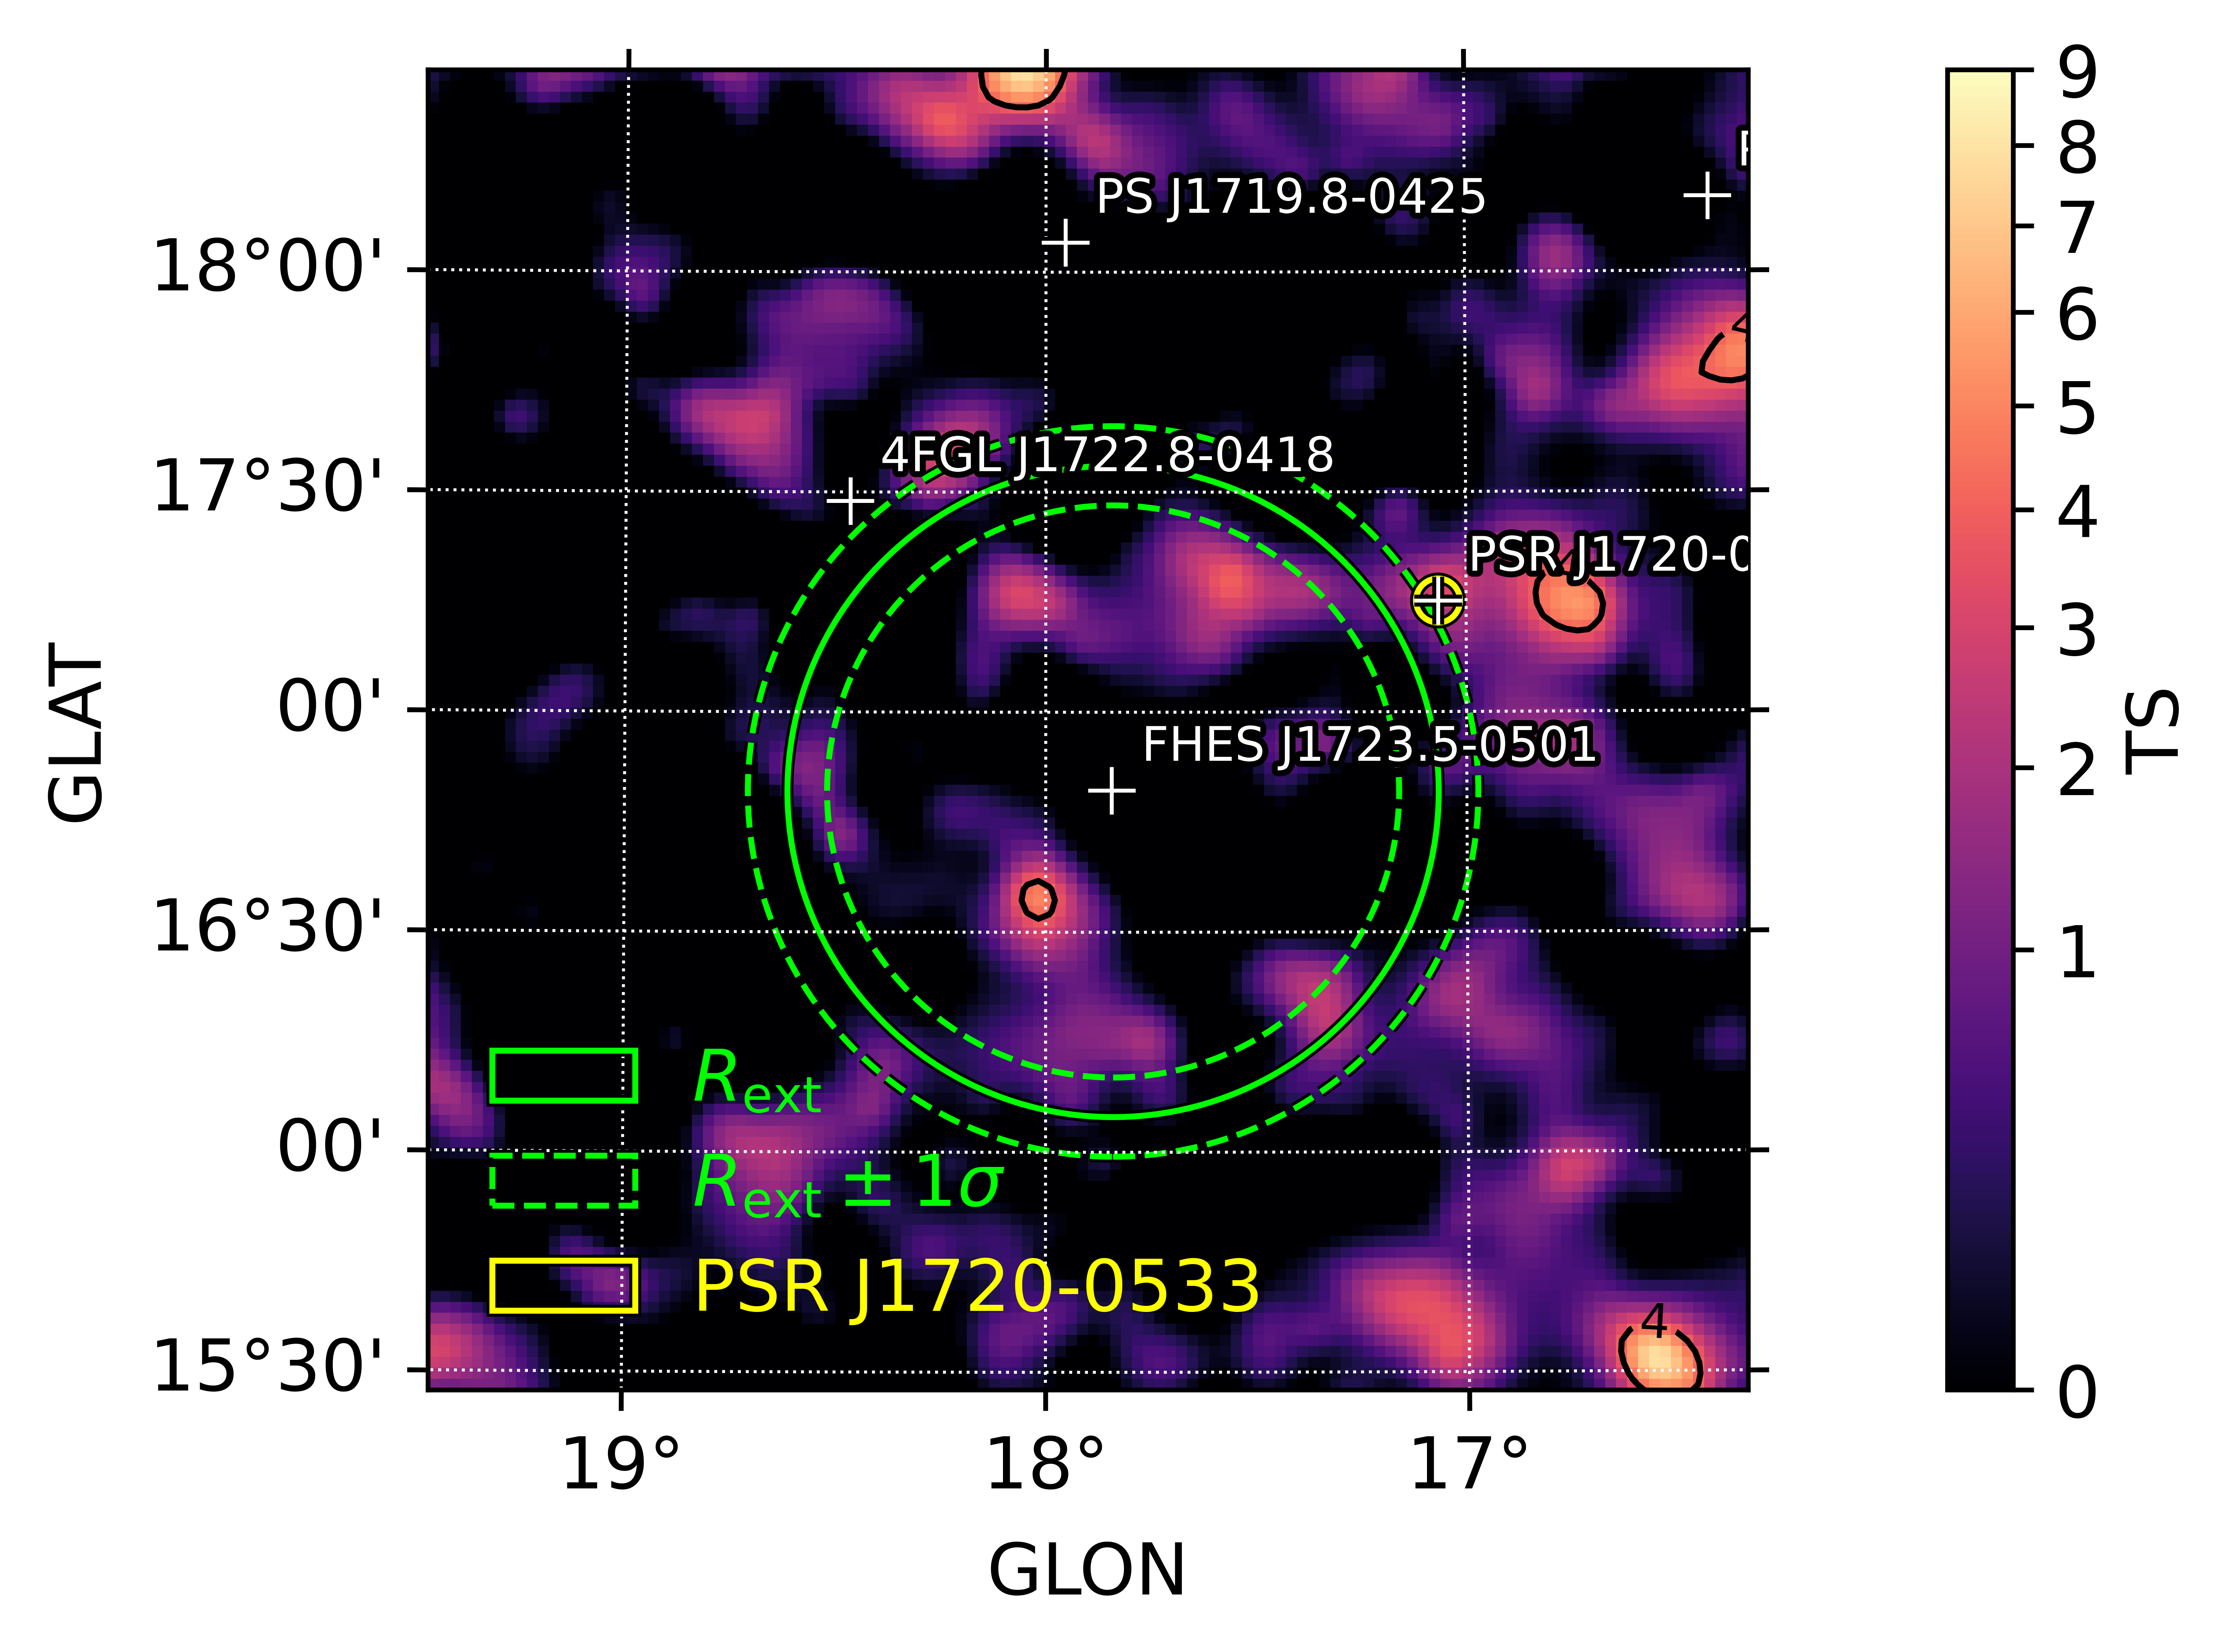
We conducted a search for continuous -ray emission from PSR J1720-0534 using Fermi/LAT data covering the time range from August 4, 2008, to September 26, 2022. To achieve this, we utilized the Pass 8 SOURCE class of Fermi/LAT events, focusing on the energy range of GeV, with a maximum zenith angle of . The data were centered around the position of the extended Fermi/LAT source FHES J1723.5-0501 (4FGL J1723.5-0501e; Ackermann et al. 2018), associated with a type 1a supernova remnant (G17.8+16.7; Araya et al. 2022). The central coordinates of this extended source are only away from the radio location of PSR J1720-0534 (see Appendix A). We included data within of the central position of FHES J1723.5-0501 for our analysis.
A joint likelihood analysis of the data was conducted using evtype=32 and evtype=28, where the former represents the set of events in the best quartile of the point spread function (PSF) partition, and the latter is the joint set of the three worst quartiles. The data were binned with an angular pixelation of and divided into eight energy bins per decade. The configuration of the data selection and analysis is summarized in Table 2.
To optimize the nearby extended source FHES J1723.5-0501, we employed an optimization algorithm based on the work of Ackermann et al. (2018). Here, we utilized the 4FGL-DR3 catalog sources (Abdollahi et al., 2022) along with the gll_iem_v07 and iso_P8R3_SOURCE_V3_v1 background models for the Galactic and isotropic background radiation, respectively. These models are provided by the Fermi-LAT collaboration333See https://fermi.gsfc.nasa.gov/ssc/data/access/lat/BackgroundModels.html.
The spectral parameters of the model sources are fitted using the newminuit minimization algorithm (James, 1994), which is implemented within the Fermi Science Tools version 2.2.0. To apply the tools to the data, we utilized the fermipy python package version 1.2. Similar to Ackermann et al. (2018), we constrained the region of interest (ROI) to a box, while including 4FGL catalog sources up to a region. However, in contrast to their analysis, we kept the spectral parameters of the sources outside the ROI fixed to their catalog values throughout the entire optimization algorithm. Further details of the ROI optimization algorithm can be found in Appendix A.
3 Results
3.1 Optical
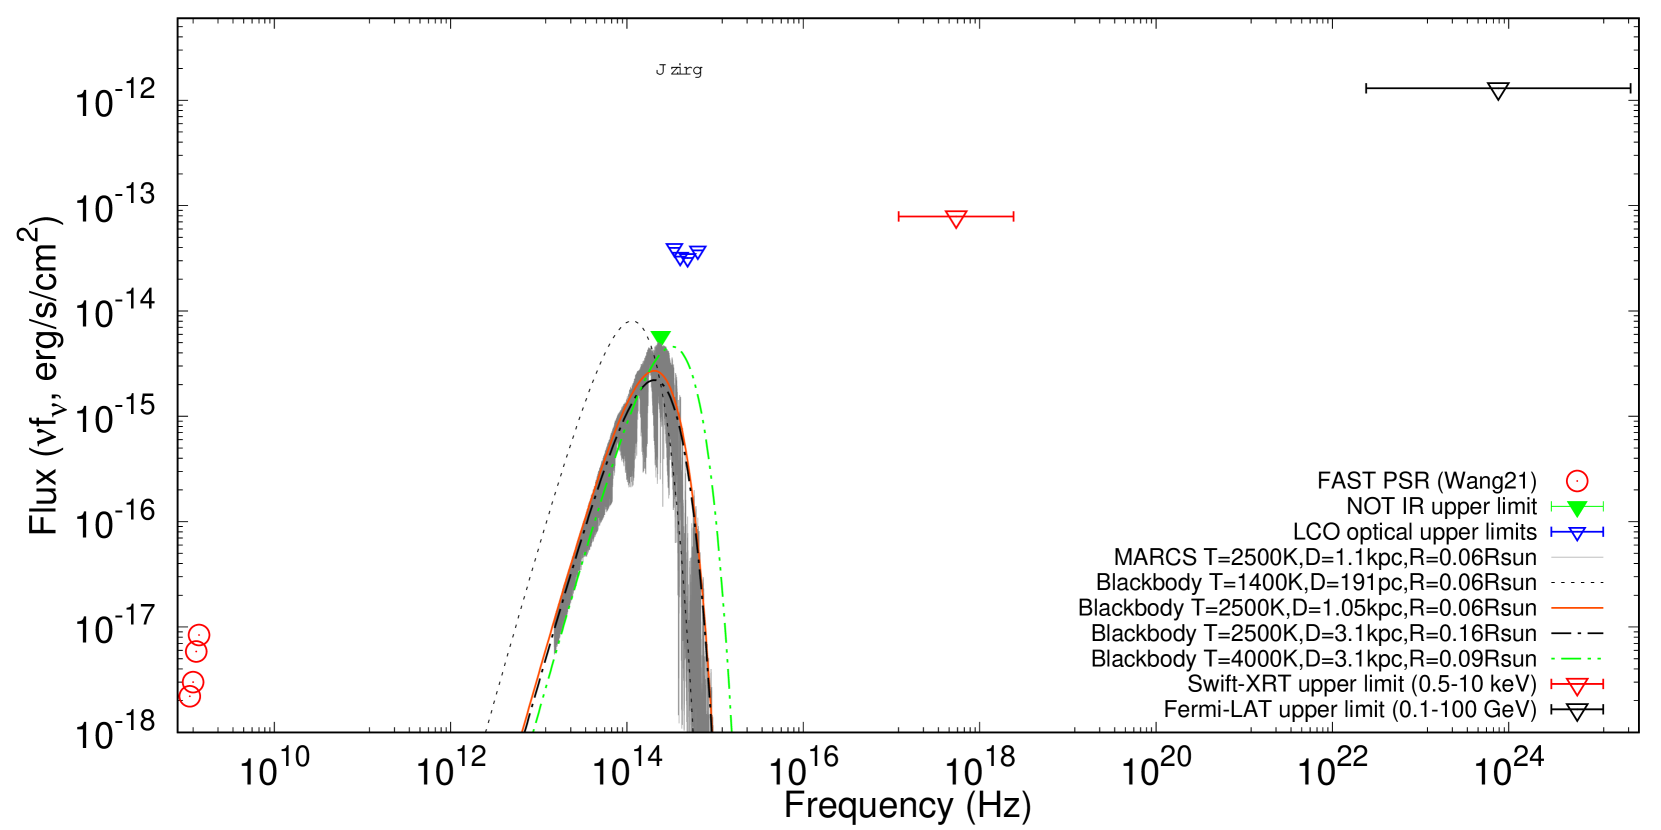
We searched for the optical counterpart of PSR J1720-0534 at its radio location (RA: 17:20:54.506, Dec: -05:34:23.822; Miao et al., 2023) in our combined optical images but did not find any nearby sources (within 7"). The weakest sources found in the combined optical images have magnitudes mag, mag, mag, and mag.
Given that the companion stars in BW systems are cool, with non-irradiated nightside effective temperatures ranging from 1000 K to 3000 K (Draghis et al., 2019; Mata Sánchez et al., 2023; Turchetta et al., 2023), this positions the peak emission wavelength of the companion star at approximately 1–1.5 microns (J-band). Consequently, we expect the BW companions to be brighter at near-infrared wavelenghts.
3.2 Near-infrared
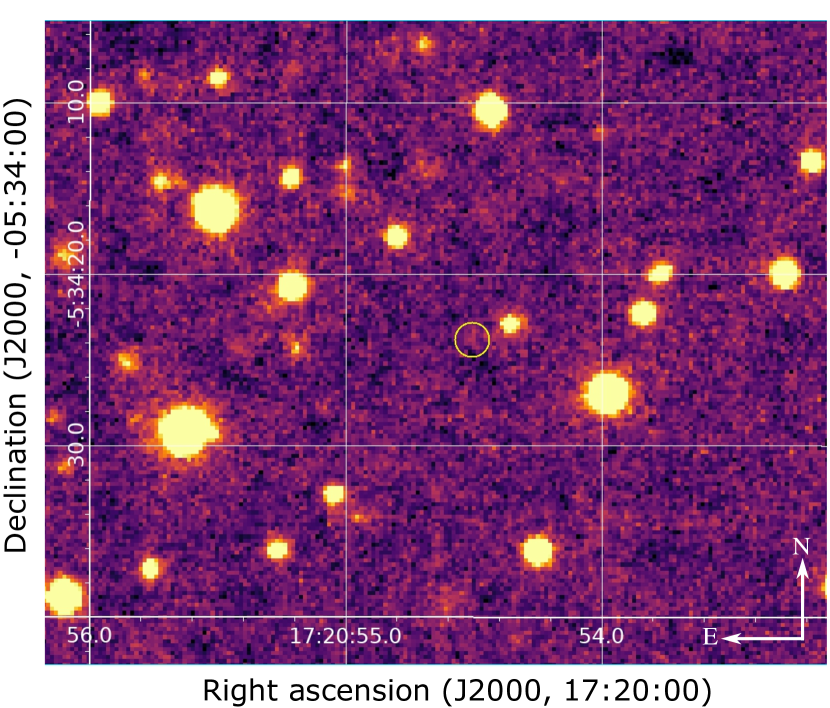
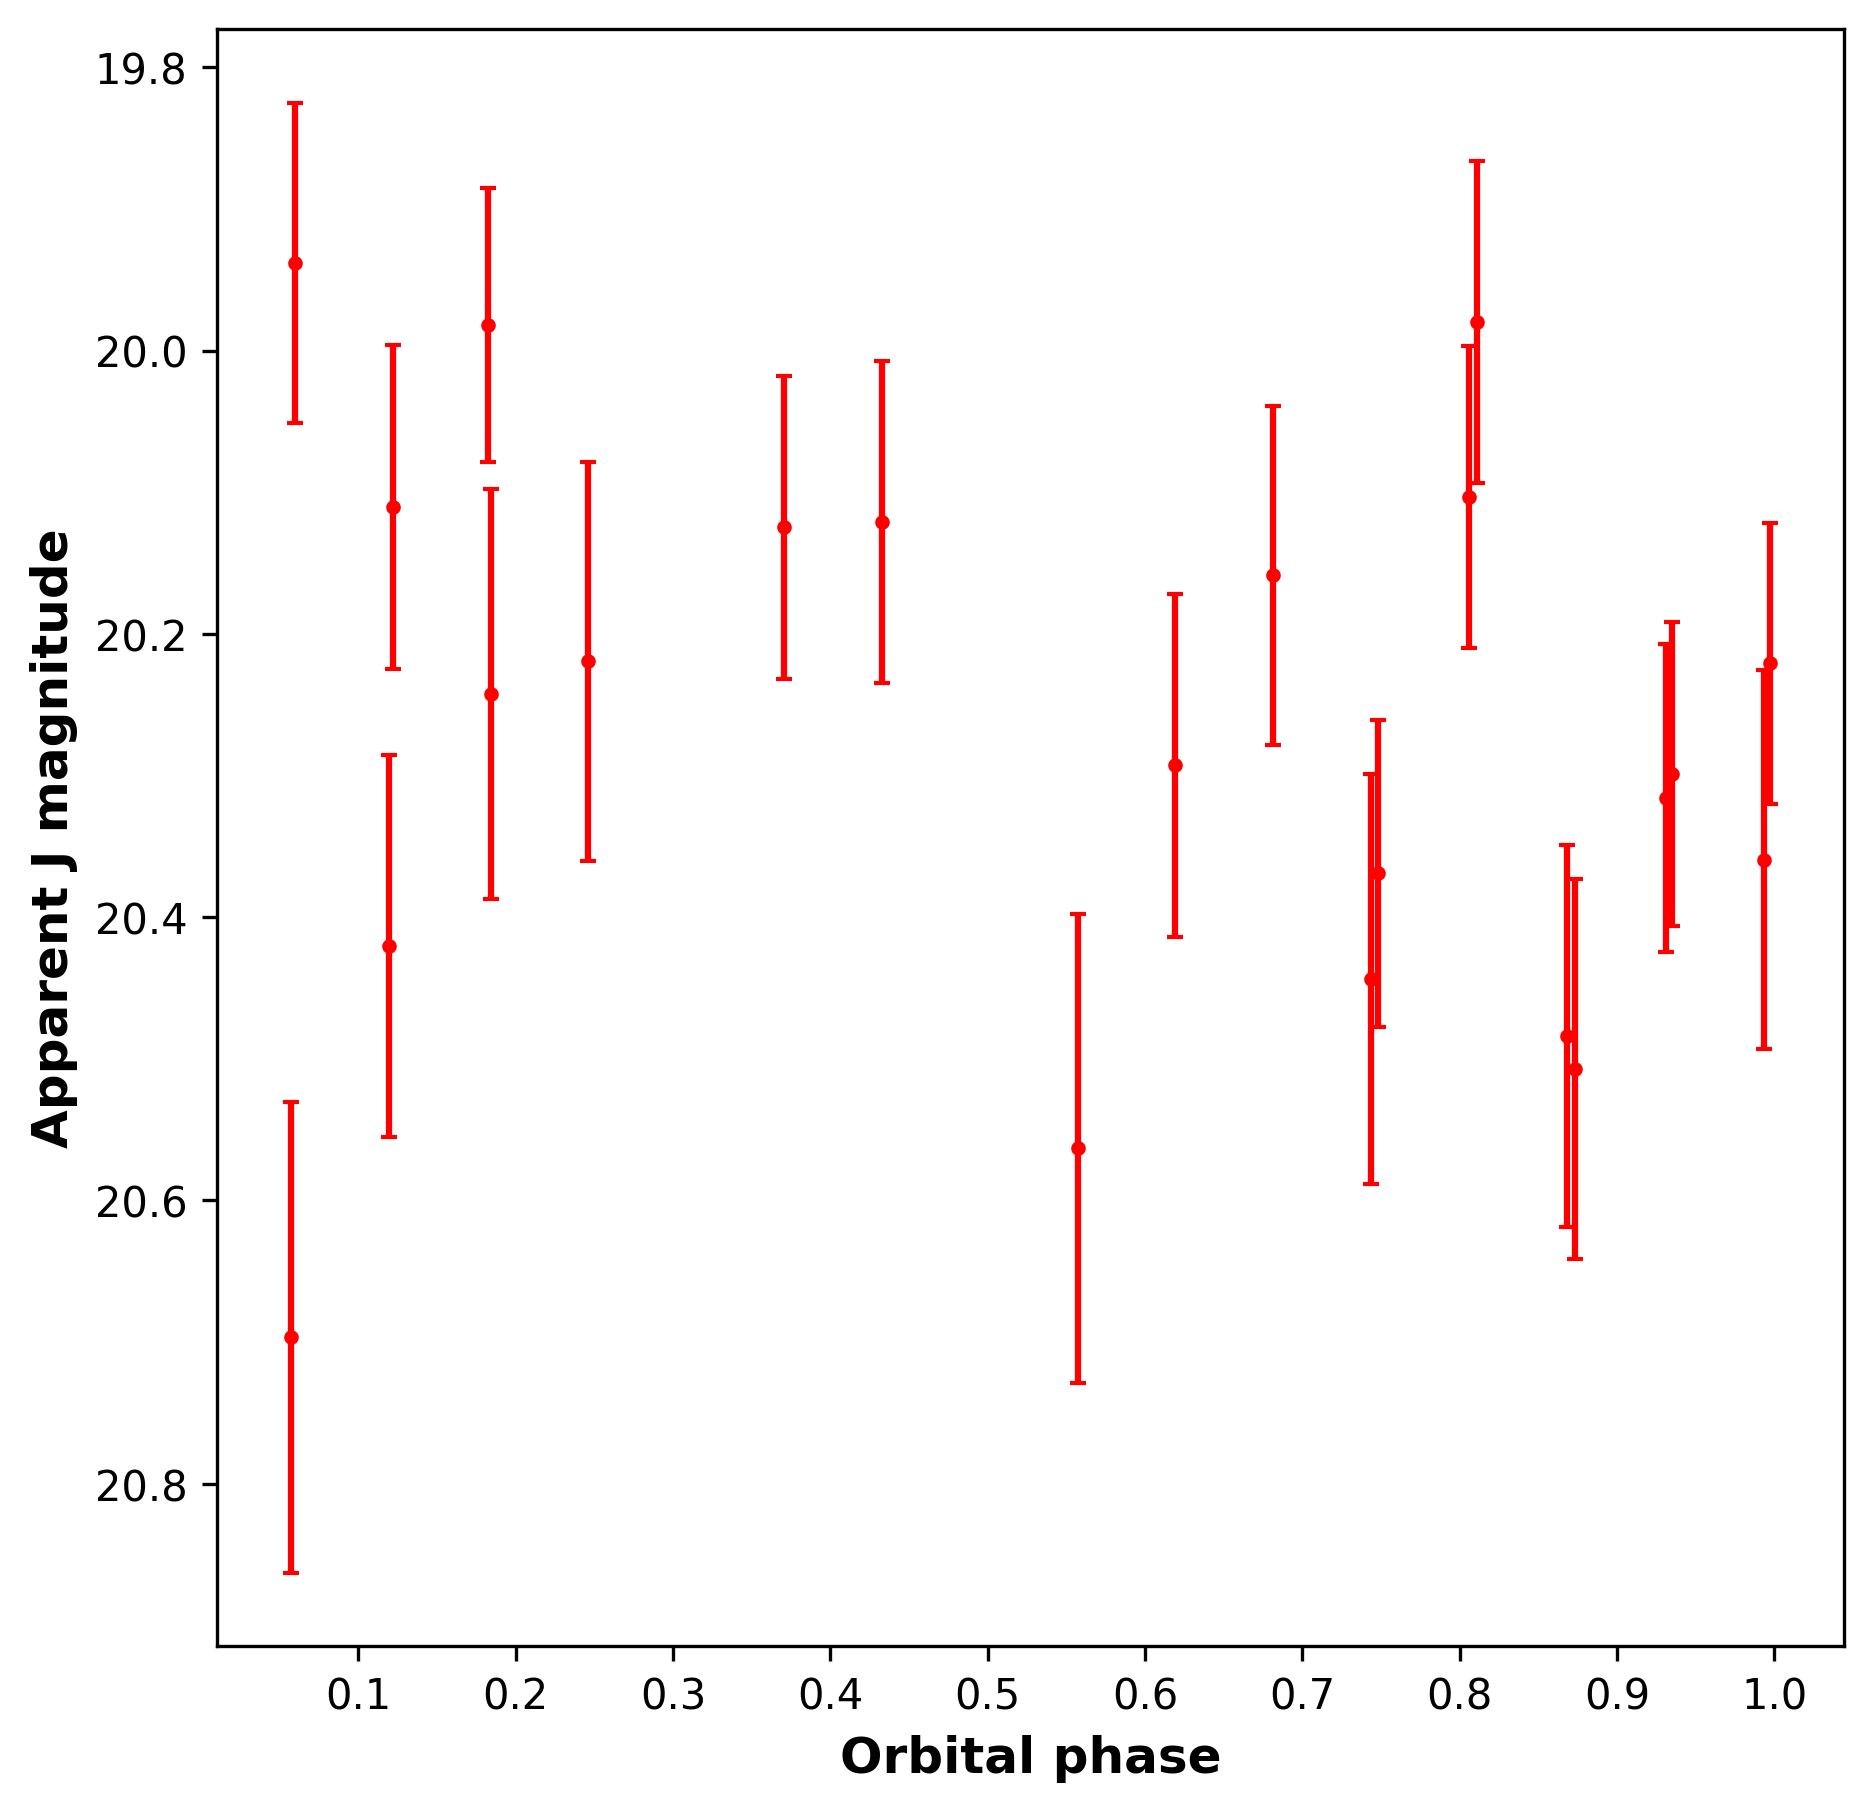
Surprisingly, no infrared source was detected at the radio location of PSR J1720-0534 (Fig. 1) either in the individual J-band images or in the combined image. The nearest source to PSR J1720-0534 is located 2.5" northwest, with an apparent J-band magnitude of approximately 20.2. However, it does not exhibit significant orbital variability (Appendix B).
The time difference between the radio reference epoch and our NOTCam observations is 3.06 years. If the nearest source had moved from the radio location to the observed one, it would imply a proper motion exceeding 800 mas/year. While the radio timing solution of Miao et al. (2023) does not include an estimate for the proper motion, the highest measured proper motion for a pulsar is 375 mas/year (PSR B1133+16, ATNF catalog, v. 1.70; Brisken et al., 2002; Deller et al., 2019). Therefore, given the large angular distance and the absence of orbital variability, we conclude that the nearest source is not the infrared counterpart of PSR J1720-0534.
Since the dimmest sources found in the combined J-band image have magnitudes up to 23.4, this provides a conservative lower limit for the magnitude of the near-infrared counterpart of PSR J1720-0534. To place a lower limit on the distance to the system, we employ the most conservative properties for the companion star from the currently known population: the smallest known radius and the lowest known average temperature of a BW companion; and K, respectively (Mata Sánchez et al., 2023). Since our observations cover a full orbit and all known BW companions are irradiated (see Section 4.2), we use the average between day- and night-side temperatures.
We estimated the J-band extinction at the location of PSR J1720-0534 as =0.44 utilizing the 3D dust map bayestar19 (Green et al., 2019). We can now place a lower limit on the distance to PSR J1720-0534 using a stellar spectrum for the above temperature from MARCS synthetic stellar spectral library (Gustafsson et al., 2008)444Specifically, we use one with K, , and Solar abundances. The lowest available temperature in the library is K. While the abundances of the BW companions are relatively little known, first studies show a departure from Solar values (Shahbaz et al., 2022). However, using higher abundances or surface gravities has very little effect on the flux at less than 10% level, and would increase it at near-infrared wavelengths., and scaling it according to the minimum radius and a given distance (Fig. 2, grey lines). We find that the distance corresponding to our J-band limiting magnitude is 1.05 kpc, and thus we can place a conservative distance lower limit to the source as pc.555In a similar fashion, distance lower limits using the optical limiting magnitudes and appropriate extinction values (, , , ) can be derived, although they are much less constraining: pc, pc, pc, pc. If the companion star fills or is close to filling its Roche Lobe, which is the case in many BW systems (60%; Mata Sánchez et al., 2023), with a volume-equivalent radius of (Eggleton, 1983) calculated using the orbital parameters from Miao et al. (2023), it would correspond to a distance lower limit of kpc (Fig. 2, black dot-dashed line). On the other hand, if the close distance estimate of YMW16 ( pc) is the assumed distance, it would require a very low average temperature of K (Fig. 2, black dotted line).
3.3 X-rays
We did not detect any X-ray source at the radio location of PSR J1720-0534 in the 10 ksec Swift/XRT image. We can place a conservative 3- upper limit on the source flux in the 0.5–10 keV band using an X-ray power law photon index of (lowest value among BWs; Swihart et al., 2022) and a line-of-sight Galactic hydrogen column density of atoms/cm2 (HI4PI Collaboration et al., 2016) resulting in erg/s/cm2.
On the other hand, the lowest X-ray efficiency (the ratio of the X-ray luminosity to spin-down power; ) measured for a BW is for PSR J0636+5129: (Spiewak et al., 2016, although we note that this depends on the DM distance that has a large uncertainty). Similar minimum efficiencies are measured for other pulsars with thermal X-ray spectra (e.g., Kargaltsev et al., 2012; Posselt et al., 2012; Vahdat et al., 2022). Since the spin-down power of PSR J1720-0534 is known from radio timing observations ( erg/s; Miao et al., 2023), this would imply a minimum X-ray luminosity of erg/s. Convolving this with the above flux upper limit places a lower limit for the distance of PSR J1720-0534: pc. However, this limit does not include the correction from the Shklovskii effect (Shklovskii, 1970) since the proper motion of the source is not known. It also assumes isotropic emission. In any case, because some BWs have very low X-ray luminosity ( erg/s; Swihart et al., 2022), this non-detection of PSR J1720-0534 is not surprising.
3.4 -rays
After optimizing the ROI with the extended source, we added a point source at the position of PSR J1720-0534. We modeled the pulsar’s spectral shape with a power law with a super-exponential cutoff (PLSEC) given by
| (1) |
This is a common way to model the spectral shapes of millisecond pulsars (Abdo et al., 2013). For PSR J1720-0534, we used the cutoff energy GeV and spectral index , which are the best-fit values reported by Xing & Wang (2016) for a sample of 39 millisecond pulsars from the Second Fermi/LAT Catalog for -ray pulsars (2PC; Abdo et al. 2013). We set as there is no evidence to suggest a sub-exponential cutoff for PSR J1720-0534, and we also set the scale factor to GeV.
After introducing the point source to the model, we fitted its normalization together with all spectral parameters of all other model sources inside the ROI. From this final fit, we found for PSR J1720-0534, resulting in a detection significance of and thus a non-detection of -rays from the pulsar. Figure 3 presents the local TS-map around the pulsar using a test source with a PLSEC spectral model with and GeV, and the map shows no significant peaks in the vicinity of the pulsar’s position. For the TS-peak around away from the pulsar position, we found a maximum TS-value of (), which is not a significant detection either.
For the spectral properties assumed above, we found a 95% upper limit on the -ray energy flux in the GeV band of erg cm-2 s-1. Compared to X-rays, the minimum -ray efficiencies for pulsars are higher, at around 1% level (e.g., Kargaltsev et al., 2012; Smith et al., 2023), which for the spin-down power for PSR J1720-0534 would mean a minimum -ray luminosity of erg/s. Convolving this with the above flux upper limit places a lower limit for the distance of PSR J1720-0534: pc. Similar to X-rays, this limit does not include the correction from the Shklovskii effect and assumes isotropic emission.
4 Discussion
The quality of an electron density model is determined by comparing the resulting DM distances to independently measured pulsar distances, typically obtained through parallax measurements. YMW16 represents an enhancement over the NE2001 model by incorporating more recent data and updating information on known systematic effects (e.g., Lorimer et al., 2006; Chatterjee et al., 2009). YMW16 also removes small-scale voids and clumps from the electron density model to prevent issues of overfitting. However, it retains certain local structures, such as the Gum Nebula, the Local Bubble, and the NPS/Loop I.
Further comparisons of the electron density models have been conducted by Deller et al. (2019) and Price et al. (2021). Deller et al. (2019) compared a sample of pulsar distances using radio-timing parallax from the PSR survey, concluding that while YMW16 provides more accurate distances for high-latitude pulsars in the sample, both models do not agree with parallax distances for a few sources, and overall the pulsar distances are underestimated. A similar underestimation was observed when using Gaia parallax distances for a sample of CBMPs (Koljonen & Linares, 2023).
The largest differences between the DMs of YMW16 and NE2001 are found at the location of small-scale clumps in NE2001 and at larger features at low Galactic latitudes, such as the Gum Nebula, Local Bubble, or NPS/Loop I, and NE2001’s low-density region (Price et al., 2021). Notably, two pulsars, PSR J1735-0724 and PSR J1741–0840 (located close to PSR J1720-0534), have particularly poorly estimated DM distances in YMW16. The discrepancy appears to be due to excess electron density within 200 pc, attributed to the contribution of the NPS/Loop I component in the model. This suggests that either the electron density of NPS/Loop I is overestimated and/or that the actual location is different from the modeled one.
In addition, the lower limits on the distance of PSR J1720-0534, particularly the one derived from our near-infrared observations, contradict the distance estimate based on the DM using the electron density model of YMW16 (191 pc) at least by a factor of five. Instead, they align more closely with the distance estimate from NE2001 (1.3 kpc). In the following, we discuss the implications of our distance limits for PSR J1720-0534 and several other pulsars with parallax-based distances in the same direction for the electron density models.
4.1 Is the NPS/Loop I component needed in YMW16?
| Pulsar | a | a | DMa | b | b | b | c | Method | Refd | ||
| Name | (deg) | (deg) | (cm-3 pc) | (kpc) | (kpc) | (kpc) | (kpc) | (kpc) | ( cm-3) | ||
| J1645-0317 | 14.114 | 26.062 | 35.7 | 1.29 | 2.4 | 3.4 | 1.1 | 4.0 | 8.9 | 1 | |
| J1657-0406B | 15.137 | 23.076 | 43.4 | 0.77 | 3.0 | 4.4 | 1.7 | 5.07 | 8.6 | GC | 2 |
| J1720-0534 | 17.067 | 17.252 | 36.8 | 0.191 | 1.5 | 3.1 | 1.3 | 1.05 | 35.0 | IR | 3 |
| J1735-0724 | 17.271 | 13.284 | 73.5 | 0.213 | 4.6 | 7.2 | 2.3 | 6.7 | 11.0 | 1 | |
| J1741-0840 | 16.955 | 11.304 | 74.9 | 0.222 | 3.9 | 6.8 | 2.2 | 3.6 | 20.8 | 1 | |
| J1640+2224 | 41.051 | 38.271 | 18.43 | 1.49 | 1.50 | 1.59 | 1.16 | 1.4 | 7.7 | 4 | |
| J1643-1224 | 5.669 | 21.218 | 62.3 | 0.78 | 5.7 | –e | 2.4 | 0.95 | 84.3 | 4 | |
| J1713+0747 | 28.751 | 25.223 | 15.99 | 0.92 | 0.92 | 1.29 | 0.92 | 1.05 | 13.6 | 5 | |
| J1721-1936 | 4.857 | 9.738 | 75.7 | 3.0 | 3.1 | 6.8 | 1.9 | 8.0 | 9.5 | GC | 2 |
| J1738+0333 | 27.721 | 17.742 | 33.8 | 1.45 | 1.45 | 2.8 | 1.43 | 1.74 | 23.0 | 4 | |
| J1741+1351 | 37.885 | 21.641 | 24.21 | 1.35 | 1.35 | 1.98 | 0.90 | 1.8 | 22.4 | 6 | |
| J1744-1134 | 14.794 | 9.180 | 3.14 | 0.148 | 0.221 | 0.270 | 0.41 | 0.44 | 7.9 | 6 | |
| J1801-0857A | 19.225 | 6.762 | 182.56 | 6.5 | 13.9 | –e | 4.8 | 9.2 | 19.8 | GC | 2 |
| J1804-0735 | 20.792 | 6.773 | 186.32 | 8.0 | 14.8 | –e | 5.0 | 8.2 | 22.7 | GC | 2 |
| J1807-0847 | 20.061 | 5.587 | 112.38 | 2.72 | 3.8 | 9.2 | 2.73 | 1.5 | 74.9 | H I | 7 |
| J1820-0427 | 25.456 | 4.733 | 84.44 | 2.96 | 3.15 | 6.5 | 1.94 | 0.3 | 281.5 | H I | 7 |
| J1823+0550 | 34.987 | 8.859 | 66.78 | 3.1 | 3.1 | 5.5 | 1.8 | 2.0 | 33.4 | H I | 7 |
| a We collected the up-to-date Galactic coordinates and DMs from the Australia Telescope National Facility (ATNF psrcat v1.70; https://www.atnf.csiro.au/research/pulsar/psrcat). | |||||||||||
| b We calculated the distance estimates from the DM using PSRdist (Bartels et al., 2018). | |||||||||||
| c We calculated the distance estimates from the DM using PyGEDM (Price et al., 2021). | |||||||||||
| d References: 1) Deller et al. (2019), 2) Baumgardt & Vasiliev (2021) 3) This work, 4) Ding et al. (2023), 5) Chatterjee et al. (2009) 6) Arzoumanian et al. (2018), 7) Frail & Weisberg (1990). | |||||||||||
| e The DM distance is not constrained. | |||||||||||
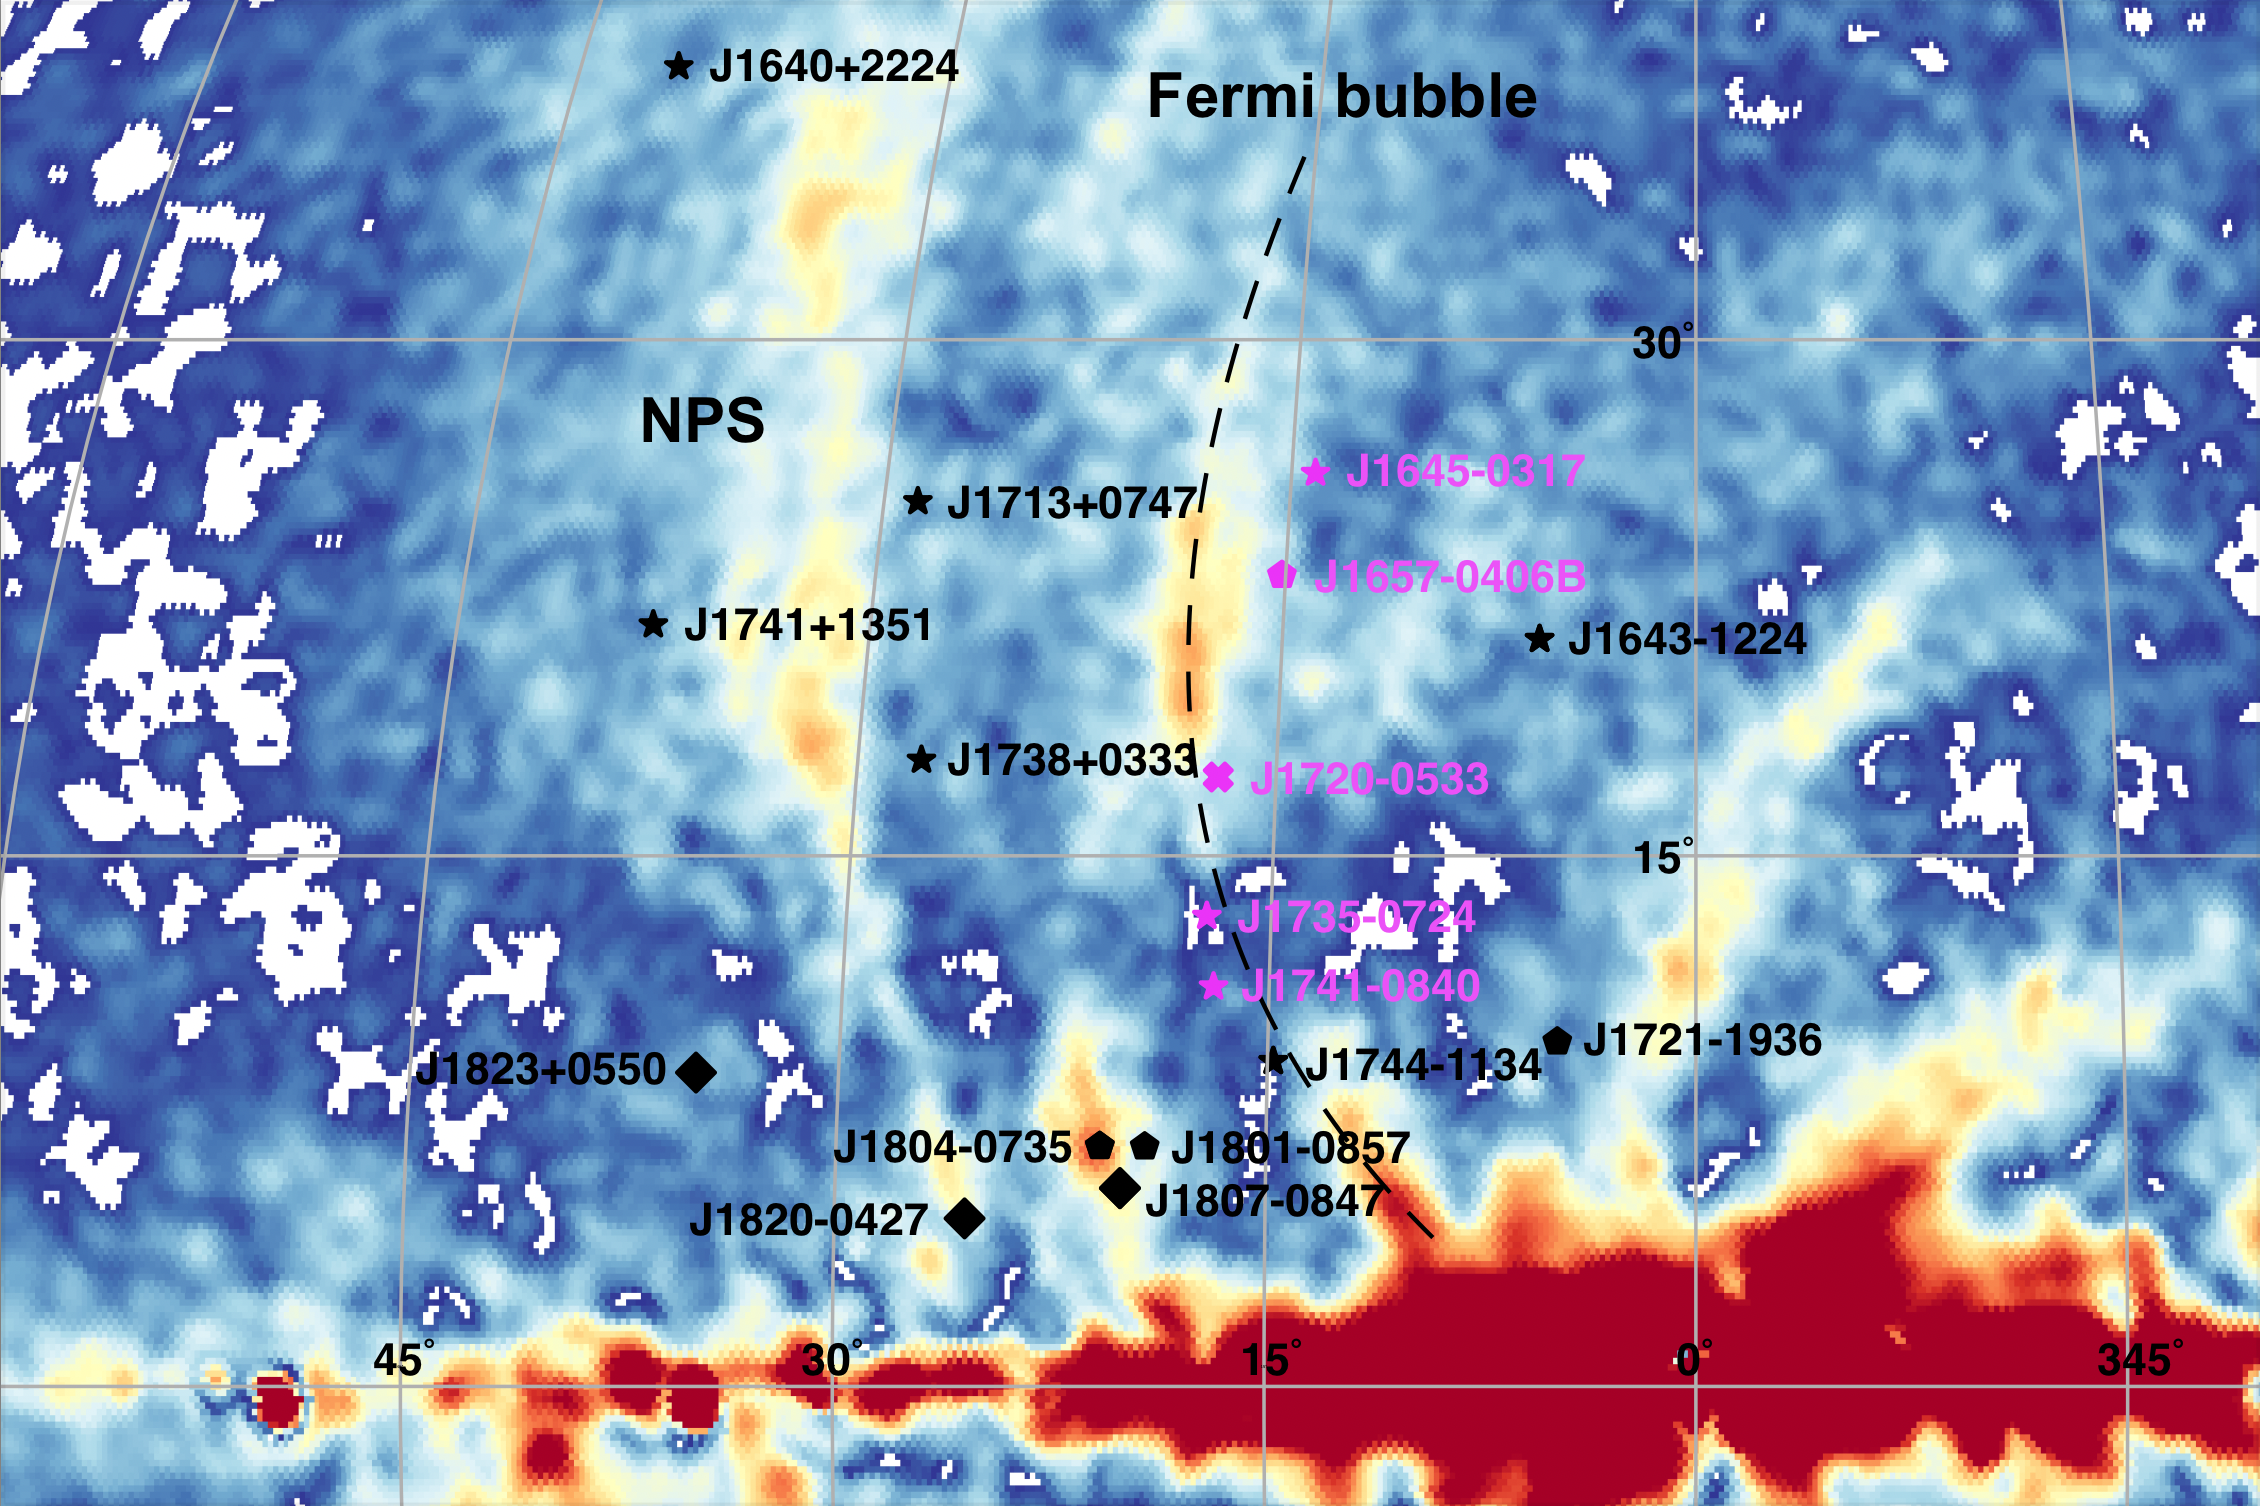
The NPS/Loop I component was included by YMW16 to improve the model fit in the region of the sky roughly encompassing the area that contained pulsars with overestimated distances. Yao et al. (2017) modeled this component with a hemispherical cap centered 195 pc from the Sun. However, only eleven pulsars drive the fit in this direction. Their best-fit solution resulted in eight pulsars having a good match with independent distance measurements, and three pulsars with under- or overpredicted DM distances. Only one of the eleven pulsars (PSR J1643-1224) is located at higher latitudes (), where more than half of the dispersing component lies. Furthermore, out of the eight pulsars with matching distances, four are situated in the Galactic plane (), and three are in close proximity to it ().
Consequently, PSR J1643-1224, positioned at higher latitudes, likely influences the overall shape chosen for the entire component. Only the electron density of this large hemispherical cap representing the NPS/Loop I was allowed to vary in the model fits of YMW16, resulting in a high value (1.9 cm-3; see their Table 2 and sections 3.7 and 5.1). Also, it is worth noting that the location of this component (restricted to ) does not coincide with the brightest part of NPS/Loop I (, ) which supposedly would be the densest region. Instead, its position is more consistent with the Fermi Bubbles.
Thus, we conclude that the large and dense NPS/Loop I component in the YMW16 model can severely underestimate the distances to some pulsars in that direction. We find that in the case of PSR J1720-0534, YMW16 underestimates its distance at least by a factor of five.
We tested the necessity of the NPS/Loop I component in YMW16 by excluding it from the model and reevaluating the DM distances for PSR J1720-0534 and a sample of pulsars in the direction of NPS/Loop I (see Table 1). Recently discovered pulsars are listed in the upper part of the table, while those included in YMW16 are listed in the lower part. We limited our analysis to sources with Galactic latitudes to avoid complications arising from features near the Galactic plane, such as an increasing number of clumps and voids in the local interstellar medium along the line of sight.
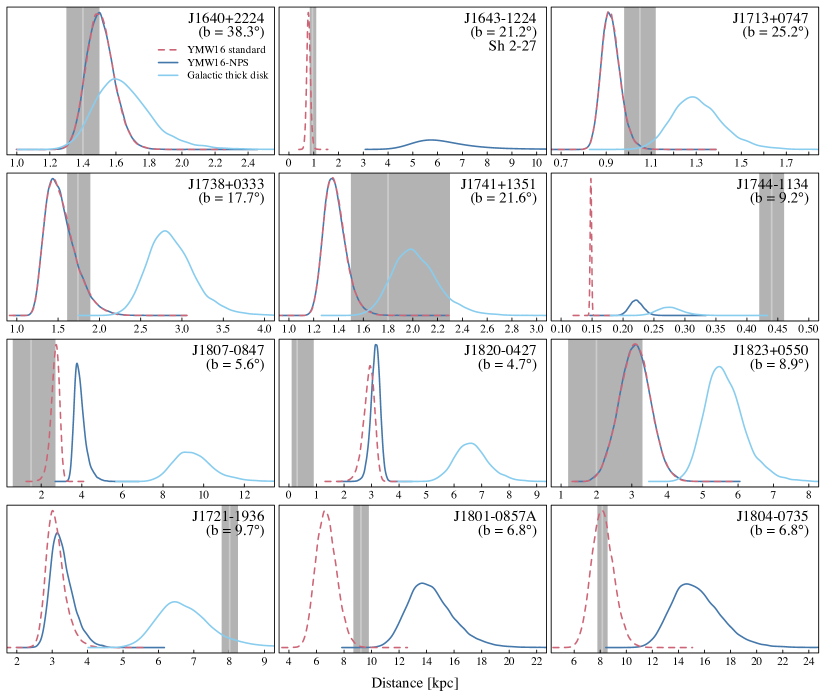
Figs. 4 and 5 display the distance posteriors of pulsar DM distances using the YMW16 model, both with and without the NPS/Loop I component (depicted as red and dark blue curves, respectively). Independent distance measurements are represented by solid vertical lines, with 1- errors indicated by grey bands in Figs. 4 and 5, and tabulated in Table 1.
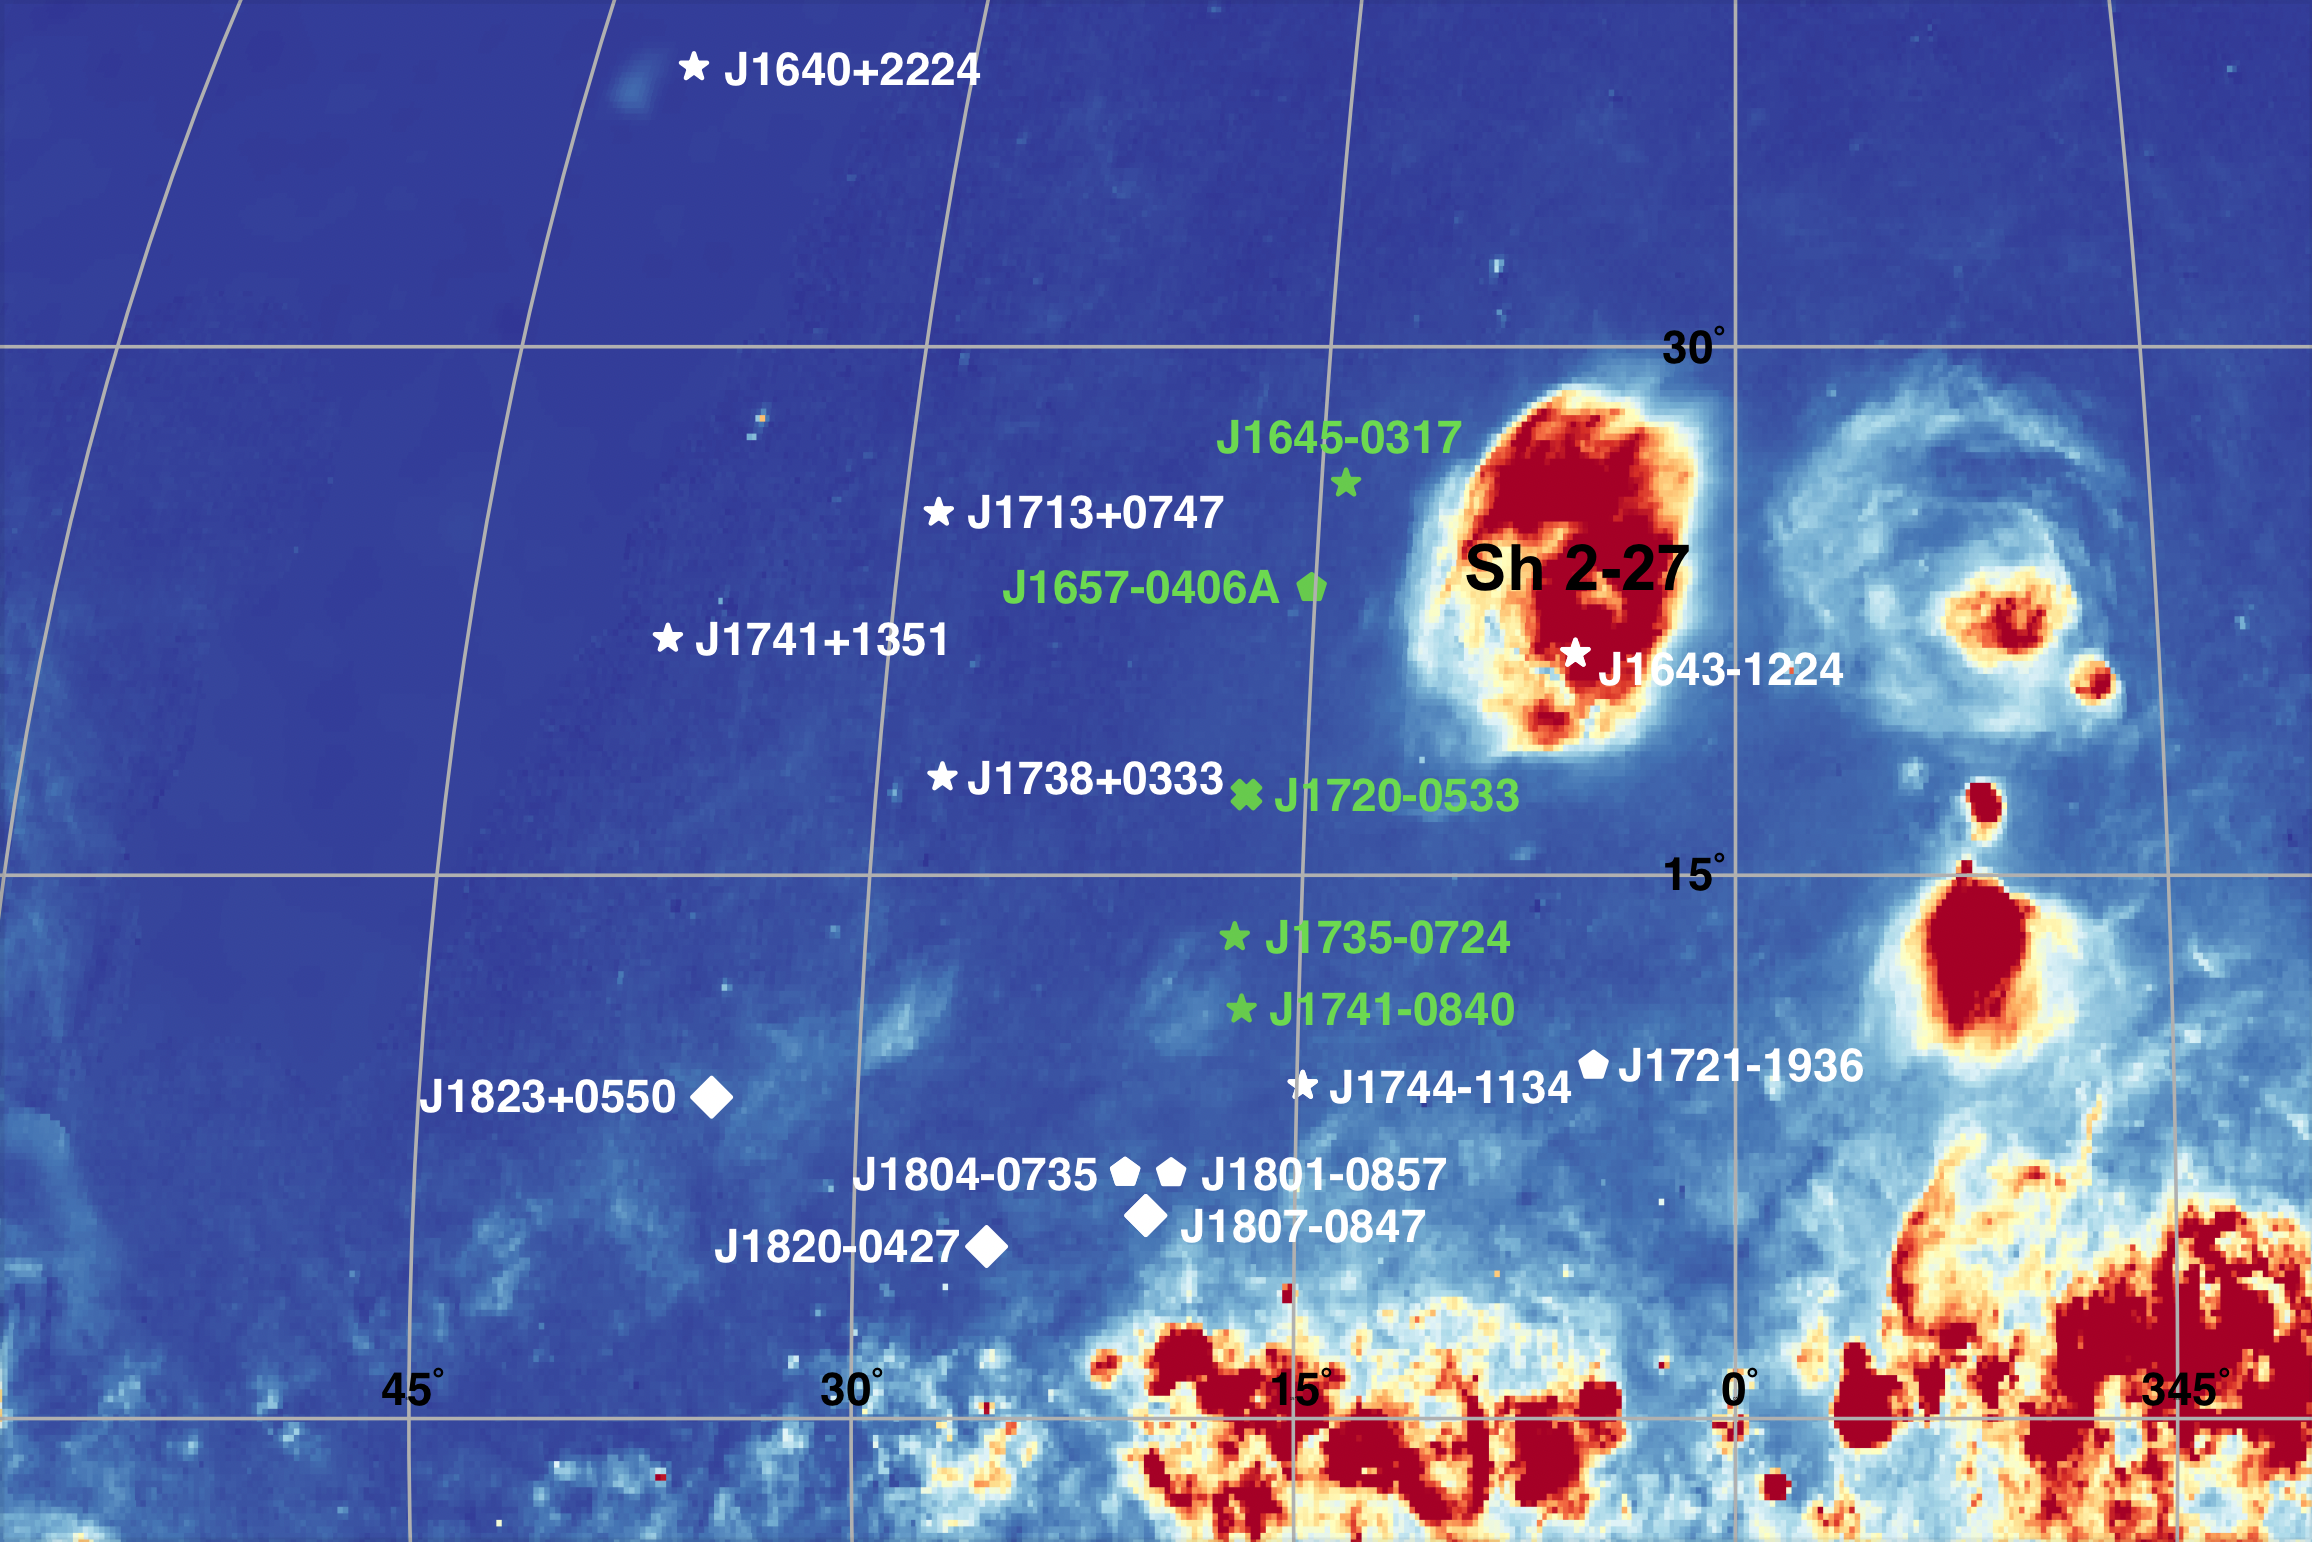
Pulsars PSR J1804-0735, PSR J1807-0847, and PSR J1643-1224 (Fig. 4) exhibit a need for increased electron density modeled with the NPS/Loop I component to align with independent distance measurements. While the former two are in proximity to the Galactic plane () and may experience additional dispersion from the Galactic thin disk, spiral arms, and/or fluctuations in line-of-sight electron densities, PSR J1643-1224 is situated at much higher Galactic latitudes (). However, this region of the sky hosts a robust H II region (Sh 2-27; Gvaramadze et al., 2012, see also Fig. 6), originating from the -Oph O9.5 V star positioned at a distance of 112 pc (van Leeuwen, 2007). This H II region has an almost circular shape with a radius of 5∘ or 10 pc at the star’s distance, and an average electron number density of 3 cm-3 (Gull & Sofia, 1979). Consequently, the additional density observed towards PSR J1643-1224 can be attributed to this intervening H II region (Mall et al., 2022; Ocker et al., 2020), obviating the need to invoke NPS/Loop I.
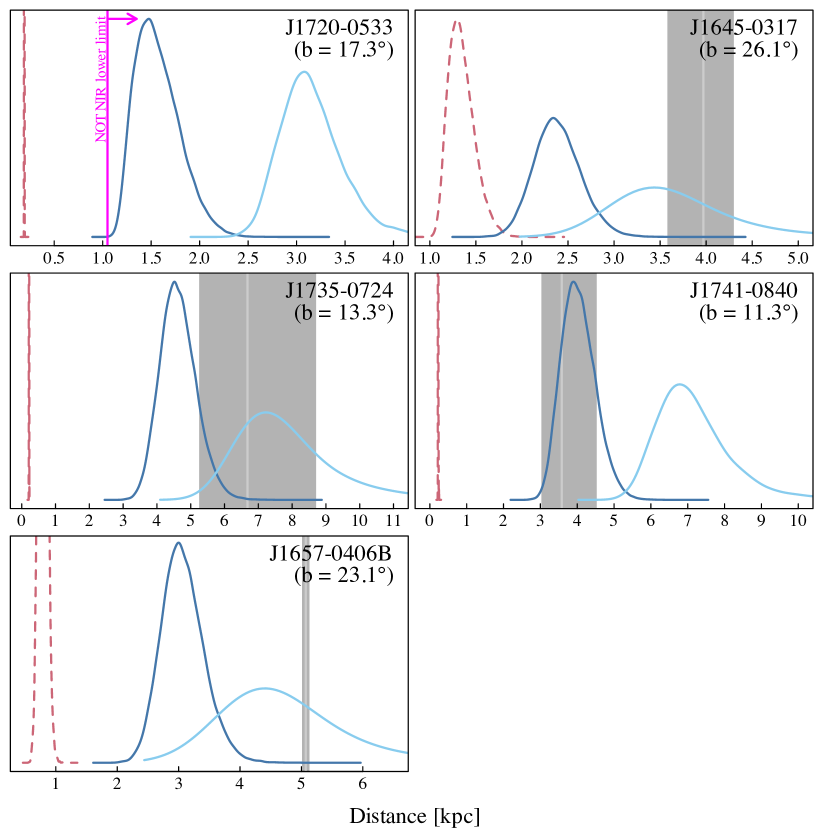
Considering the more recently discovered pulsars, excluding the NPS/Loop I component brings the resulting DM distances closer to the independent distance measurements in all cases (Fig. 5). For PSR J1735-0724 and PSR J1741-0840, the DM distance posteriors overlap with the parallax distances. However, for other sources, the distances are still underestimated. In addition, the DM distance for PSR J1720-0534 changes from 0.19 kpc to 1.5 kpc.
Based on our analysis of pulsar distances towards the NPS/Loop I component in YMW16, we conclude that the removal of this component overall improves the DM distance estimates in this region of the sky, especially for sources not too close to the Galactic plane. However, there are still discrepancies, and many pulsars still have underpredicted DM distances compared to parallax distances. This suggests that the free electron densities in the YMW16 model towards the NPS/Loop I region are still in many cases too high.
Since the publication of the YMW16 electron density model, there has been an update on the Galactic thick disk parameters (density, scale height) by Ocker et al. (2020) that differ from the values used in YMW16. We note, however, that the functions used to model the disk differ slightly between Ocker et al. (2020) and Yao et al. (2017), where the former uses an exponential, and the latter uses a hyperbolic secant function. Using values closely matching the exponential function in Ocker et al. (2020), we update the corresponding mid-plane electron density using the hyperbolic secant function to cm-3 (YMW16 used cm-3) while the scale height remains the same as for YMW16: kpc. Using only the Galactic thick disk component in the electron dispersion model places the DM distances to pulsars at the high Galactic latitudes () more in line with the independent distance estimates (depicted by light blue lines in Figs. 4 and 5), with the exception of PSR J1643-1224, PSR J1738+0333, and PSR J1741-0840. PSR J1738+0333 is located close to the brightest radio polarization region in NPS (see Fig. 6) and could imply an intervening dense region towards the brightest component of NPS/Loop I. PSR J1741-0840, having relatively low Galactic latitude (), is likely affected by other Galactic components, as exemplified by the matching YMW16 DM distance with the NPS/Loop I component removed (Fig. 5). Assuming just the thick disk component in the electron dispersion model moves the DM distance of PSR J1720-0534 to 3.1 kpc.
4.2 Implications for the distance to PSR J1720-0534
Taking the YMW16 distance at face value would demand very exceptional properties for both the companion and the emission mechanisms of the neutron star in PSR J1720-0534, considering our upper limits, especially in the infrared and -rays (Section 3, Fig. 2). Based on radio timing observations, all derived properties are typical of BW CBMPs (Miao et al., 2023, e.g., erg/s, hr, ).
Considering first the companion star, the average temperature over the orbit would need to be less than 1400 K to accommodate the infrared non-detection and the YMW16 distance, which is already 900 K less than the lowest known average temperature of a BW companion in the literature (Mata Sánchez et al., 2023). Given the short orbital period and fairly average spin-down power, irradiation of the companion star by the pulsar wind and heating of the stellar surface facing the pulsar is expected (Turchetta et al., 2023). To estimate the strength of irradiation, we can use the pulsar spin-down to companion flux ratio at the location of the companion star (Turchetta et al., 2023):
| (2) |
where we have used the above values for the spin-down power and orbital period of PSR J1720-0534. Thus, for the low companion effective base temperatures required by the close distance ( K), the companion star would exhibit strong irradiation (100) and subsequently a much higher average temperature, resulting in higher luminosities that would be observable. In this case we would also detect the bright/irradiated side of the companion in at least some of the near-infrared images, but we do not (Section 3.2).
Secondly, considering the YMW16 distance with the -ray flux upper limit would imply a -ray efficiency well below 1%, which is unprecedented in the millisecond pulsar population. This would require an intrinsic spin-down power lower than the -ray death line ( erg/s; Kalapotharakos et al., 2018) and subsequently high transverse proper motion to lower the measured spin-down power below this value through Shklovskii correction. On the other hand, an unfavorable viewing angle, which places our line of sight outside the -ray beam of the pulsar, could result in -ray non-detection as well.
Therefore, we conclude that instead of being a very exceptional BW, the non-detections from PSR J1720-0534 can be understood by placing the source at a much larger distance than what the YMW16 model implies. This requires the modification of the electron density model of YMW16 by removing the NPS/Loop I component and updating the Galactic thick disk parameters. Making these changes in the YMW16 model also aligns with the comparison of parallax distances to DM distances in other nearby pulsars to PSR J1720-0534 (taking into account the caveats mentioned in Section 4.1 about intervening H II regions and sources close to the Galactic plane).
Given a likely distance of 3.1 kpc to PSR J1720-0534, it is possible to accommodate a Roche lobe filling stellar companion () with an average temperature of 2500 K below the infrared limiting magnitude (see Fig. 2). On the other hand, if the radius of the companion is smaller (), subsequently the average temperature could be higher, 4000 K, that is close to the global average (Mata Sánchez et al., 2023). Nevertheless, the likely J-band magnitude of the companion should be on the order of 24–25 mag, which would be still observable with 2-m size telescopes. However, in the optical, due to higher extinction and spectral curvature, the estimated magnitudes are higher, 25 mag, depending strongly on the used filter and the temperature of the companion star. For X-rays, typical BW X-ray luminosities of 1030–1031 erg/s correspond to fluxes [0.6–6] erg/s/cm2 for a distance of 3.1 kpc and using the hydrogen column density from Section 3.3, which is detectable, e.g., with XMM-Newton.
5 Conclusions
In this paper, we conducted an extensive multiwavelength analysis of the region around PSR J1720-0534, a compact binary millisecond pulsar located in the direction of the North Polar Spur (NPS). Despite thorough investigations using 14 years of Fermi/LAT data, 2.7-hour optical and 3.5-hour near-infrared observations with the Las Cumbres Observatory and the Nordic Optical Telescope, and Swift/XRT pointing observations, no significant counterparts were detected in gamma-ray, optical, near-infrared, or X-ray wavelengths.
Our near-infrared observations provided a deep upper limit on the magnitude of the potential counterpart, leading to a conservative lower limit for the distance of PSR J1720-0534: 1.05 kpc. This constraint challenges the close distance estimate from the DM using the electron density model of Yao et al. (2017, YMW16).
Furthermore, our analysis of pulsar distances indicates that the inclusion of a dense component in the electron density distribution towards the NPS in the YMW16 model likely contributes to this discrepancy. Removing this component improves the accuracy of DM distance estimates in this region, especially for sources not too close to the Galactic plane. However, discrepancies still persist, indicating that the electron density distribution in this region is still overestimated in the model likely arising from the parameters of the thick disk and other Galactic components such as spiral arms, the Galactic thin disk, and complex small-scale structures in the line of sight close to the Galactic plane. We suggest that the electron distribution models in the future should include prominent H II regions, possibly reinstate small-scale structure in the local interstellar medium, and update the parameters for the large-scale Galactic components. Our study highlights the importance of refining electron density models for a more accurate understanding of pulsar distances in the Galaxy.
Acknowledgements
The authors would like to thank Michael Unger for discussions on H maps and their connection to dispersion measure. This project has received funding from the European Research Council (ERC) under the European Union’s Horizon 2020 research and innovation programme (grant agreement No. 101002352). The observations were conducted using the Nordic Optical Telescope, owned in collaboration by the University of Turku and Aarhus University, and operated jointly by Aarhus University, the University of Turku and the University of Oslo, representing Denmark, Finland and Norway, the University of Iceland and Stockholm University at the Observatorio del Roque de los Muchachos, La Palma, Spain, of the Instituto de Astrofisica de Canarias. This work also makes use of observations from the Las Cumbres Observatory global telescope network, and is based on observations obtained with Planck (http://www.esa.int/Planck), an ESA science mission with instruments and contributions directly funded by ESA Member States, NASA, and Canada. This research has made use of data and/or software provided by the High Energy Astrophysics Science Archive Research Center (HEASARC), which is a service of the Astrophysics Science Division at NASA/GSFC. In particular, we acknowledge the use of public data from the Swift data archive. We gratefully acknowledge the use of PSRdist, available at https://github.com/tedwards2412/PSRdist and PyGEDM, available at https://apps.datacentral.org.au/pygedm.
Data Availability
The data underlying this article are available in the Fermi-LAT data server at https://fermi.gsfc.nasa.gov/ssc/data/access/. Fermi-LAT analysis results as well as the NOT near-infrared and LCO optical data can be shared upon reasonable request from the authors. The Swift X-ray data are available at HEASARC (https://heasarc.gsfc.nasa.gov). The Planck polarization map is available at the Planck Legacy Archive (http://pla.esac.esa.int/pla). The H map is available at https://faun.rc.fas.harvard.edu/dfink/skymaps/halpha.
References
- Abdo et al. (2013) Abdo A. A., et al., 2013, ApJS, 208, 17
- Abdollahi et al. (2022) Abdollahi S., et al., 2022, ApJS, 260, 53
- Acero et al. (2016) Acero F., et al., 2016, ApJS, 224, 8
- Ackermann et al. (2018) Ackermann M., et al., 2018, ApJS, 237, 32
- Araya et al. (2022) Araya M., Hurley-Walker N., Quirós-Araya S., 2022, MNRAS, 510, 2920
- Arzoumanian et al. (2018) Arzoumanian Z., et al., 2018, ApJS, 235, 37
- Baldwin (1955) Baldwin J. E., 1955, MNRAS, 115, 684
- Bartels et al. (2018) Bartels R. T., Edwards T. D. P., Weniger C., 2018, MNRAS, 481, 3966
- Baumgardt & Vasiliev (2021) Baumgardt H., Vasiliev E., 2021, MNRAS, 505, 5957
- Berkhuijsen et al. (1971) Berkhuijsen E. M., Haslam C. G. T., Salter C. J., 1971, A&A, 14, 252
- Brisken et al. (2002) Brisken W. F., Benson J. M., Goss W. M., Thorsett S. E., 2002, ApJ, 571, 906
- Burrows et al. (2005) Burrows D. N., et al., 2005, Space Sci. Rev., 120, 165
- Chatterjee et al. (2009) Chatterjee S., et al., 2009, ApJ, 698, 250
- Cordes & Lazio (2002) Cordes J. M., Lazio T. J. W., 2002, arXiv e-prints, pp astro–ph/0207156
- Deller et al. (2019) Deller A. T., et al., 2019, ApJ, 875, 100
- Ding et al. (2023) Ding H., et al., 2023, MNRAS, 519, 4982
- Dobler et al. (2010) Dobler G., Finkbeiner D. P., Cholis I., Slatyer T., Weiner N., 2010, ApJ, 717, 825
- Draghis et al. (2019) Draghis P., Romani R. W., Filippenko A. V., Brink T. G., Zheng W., Halpern J. P., Camilo F., 2019, ApJ, 883, 108
- Eggleton (1983) Eggleton P. P., 1983, ApJ, 268, 368
- Finkbeiner (2003) Finkbeiner D. P., 2003, ApJS, 146, 407
- Frail & Weisberg (1990) Frail D. A., Weisberg J. M., 1990, AJ, 100, 743
- Fruchter et al. (1988) Fruchter A. S., Stinebring D. R., Taylor J. H., 1988, Nature, 333, 237
- Green et al. (2019) Green G. M., Schlafly E., Zucker C., Speagle J. S., Finkbeiner D., 2019, ApJ, 887, 93
- Gull & Sofia (1979) Gull T. R., Sofia S., 1979, ApJ, 230, 782
- Gustafsson et al. (2008) Gustafsson B., Edvardsson B., Eriksson K., Jørgensen U. G., Nordlund Å., Plez B., 2008, A&A, 486, 951
- Gvaramadze et al. (2012) Gvaramadze V. V., Langer N., Mackey J., 2012, MNRAS, 427, L50
- HI4PI Collaboration et al. (2016) HI4PI Collaboration et al., 2016, A&A, 594, A116
- Hanbury Brown et al. (1960) Hanbury Brown R., Davies R. D., Hazard C., 1960, The Observatory, 80, 191
- Haslam et al. (1971) Haslam C. G. T., Kahn F. D., Meaburn J., 1971, A&A, 12, 388
- James (1994) James F., 1994, MINUIT Function Minimization and Error Analysis: Reference Manual Version 94.1, https://cds.cern.ch/record/2296388/files/minuit.pdf
- Kalapotharakos et al. (2018) Kalapotharakos C., Brambilla G., Timokhin A., Harding A. K., Kazanas D., 2018, ApJ, 857, 44
- Kargaltsev et al. (2012) Kargaltsev O., Durant M., Pavlov G. G., Garmire G., 2012, ApJS, 201, 37
- Koljonen & Linares (2023) Koljonen K. I. I., Linares M., 2023, MNRAS, 525, 3963
- Lallement (2023) Lallement R., 2023, Comptes Rendus Physique, 23, 1
- Lorimer et al. (2006) Lorimer D. R., et al., 2006, MNRAS, 372, 777
- Mall et al. (2022) Mall G., et al., 2022, MNRAS, 511, 1104
- Mata Sánchez et al. (2023) Mata Sánchez D., et al., 2023, MNRAS, 520, 2217
- Miao et al. (2023) Miao C.-C., et al., 2023, Research in Astronomy and Astrophysics, 23, 105005
- Ocker et al. (2020) Ocker S. K., Cordes J. M., Chatterjee S., 2020, ApJ, 897, 124
- Planck Collaboration et al. (2016) Planck Collaboration et al., 2016, A&A, 594, A25
- Posselt et al. (2012) Posselt B., Pavlov G. G., Manchester R. N., Kargaltsev O., Garmire G. P., 2012, ApJ, 749, 146
- Predehl et al. (2020) Predehl P., et al., 2020, Nature, 588, 227
- Price et al. (2021) Price D. C., Flynn C., Deller A., 2021, Publ. Astron. Soc. Australia, 38, e038
- Ryoji et al. (2023) Ryoji I., Jun K., Yoshiaki S., 2023, arXiv e-prints, p. arXiv:2310.10007
- Salter (1983) Salter C. J., 1983, Bulletin of the Astronomical Society of India, 11, 1
- Shahbaz et al. (2022) Shahbaz T., González-Hernández J. I., Breton R. P., Kennedy M. R., Mata Sánchez D., Linares M., 2022, MNRAS, 513, 71
- Shklovskii (1970) Shklovskii I. S., 1970, Soviet Ast., 13, 562
- Smith et al. (2023) Smith D. A., et al., 2023, arXiv e-prints, p. arXiv:2307.11132
- Sofue (2000) Sofue Y., 2000, ApJ, 540, 224
- Spiewak et al. (2016) Spiewak R., et al., 2016, ApJ, 822, 37
- Spoelstra (1973) Spoelstra T. A. T., 1973, A&A, 24, 149
- Su et al. (2010) Su M., Slatyer T. R., Finkbeiner D. P., 2010, ApJ, 724, 1044
- Swihart et al. (2022) Swihart S. J., Strader J., Chomiuk L., Aydi E., Sokolovsky K. V., Ray P. S., Kerr M., 2022, arXiv e-prints, p. arXiv:2210.16295
- Turchetta et al. (2023) Turchetta M., Linares M., Koljonen K., Sen B., 2023, MNRAS, 525, 2565
- Vahdat et al. (2022) Vahdat A., Posselt B., Santangelo A., Pavlov G. G., 2022, A&A, 658, A95
- Wang et al. (2021) Wang S. Q., et al., 2021, ApJ, 922, L13
- Xing & Wang (2016) Xing Y., Wang Z., 2016, ApJ, 831, 143
- Yao et al. (2017) Yao J. M., Manchester R. N., Wang N., 2017, ApJ, 835, 29
- van Leeuwen (2007) van Leeuwen F., 2007, A&A, 474, 653
Appendix A The extended Fermi-LAT source FHES J1723.5-0501
A.1 Data analysis
| Selection | Criterion |
|---|---|
| Observation period | August 4, 2008, to September 26, 2022 |
| Mission Elapsed Time (MET) | 239557417 to 685859961 |
| Central coordinates | , |
| Radius | |
| Energy range | GeV |
| Zenith angle | |
| Event types | and |
| Event class | evclass = 128 |
| Data quality cut | DATA_QUAL == 1 |
| LAT_CONFIG == 1 |
We model the extended Fermi-LAT source using a ROI optimization algorithm based on the algorithm presented in Ackermann et al. (2018), where the authors presented the first Fermi High-Latitude Extended Sources Catalog (FHES) and reported the discovery of 19 new extended sources, including FHES J1723.5-0501 (4FGL J1723.5-0501e). The data selection and configuration used to analyze the ROI are explained in Section 2 and summarized in Table 2. The analysis starts from a baseline source model with the Galactic and isotropic background models, together with the 4FGL catalog sources within a region centered at the position of FHES J1723.5-0501. The extended source is then removed from the source model. Next, we change the spectral model of all catalog sources with modeled with the power law (PL) spectral parameterization to a log-parabola (LP). We do this to ensure accurate modeling of background sources with undetected spectral curvature. As PL is a special case of LP (), this comes without loss of generality.
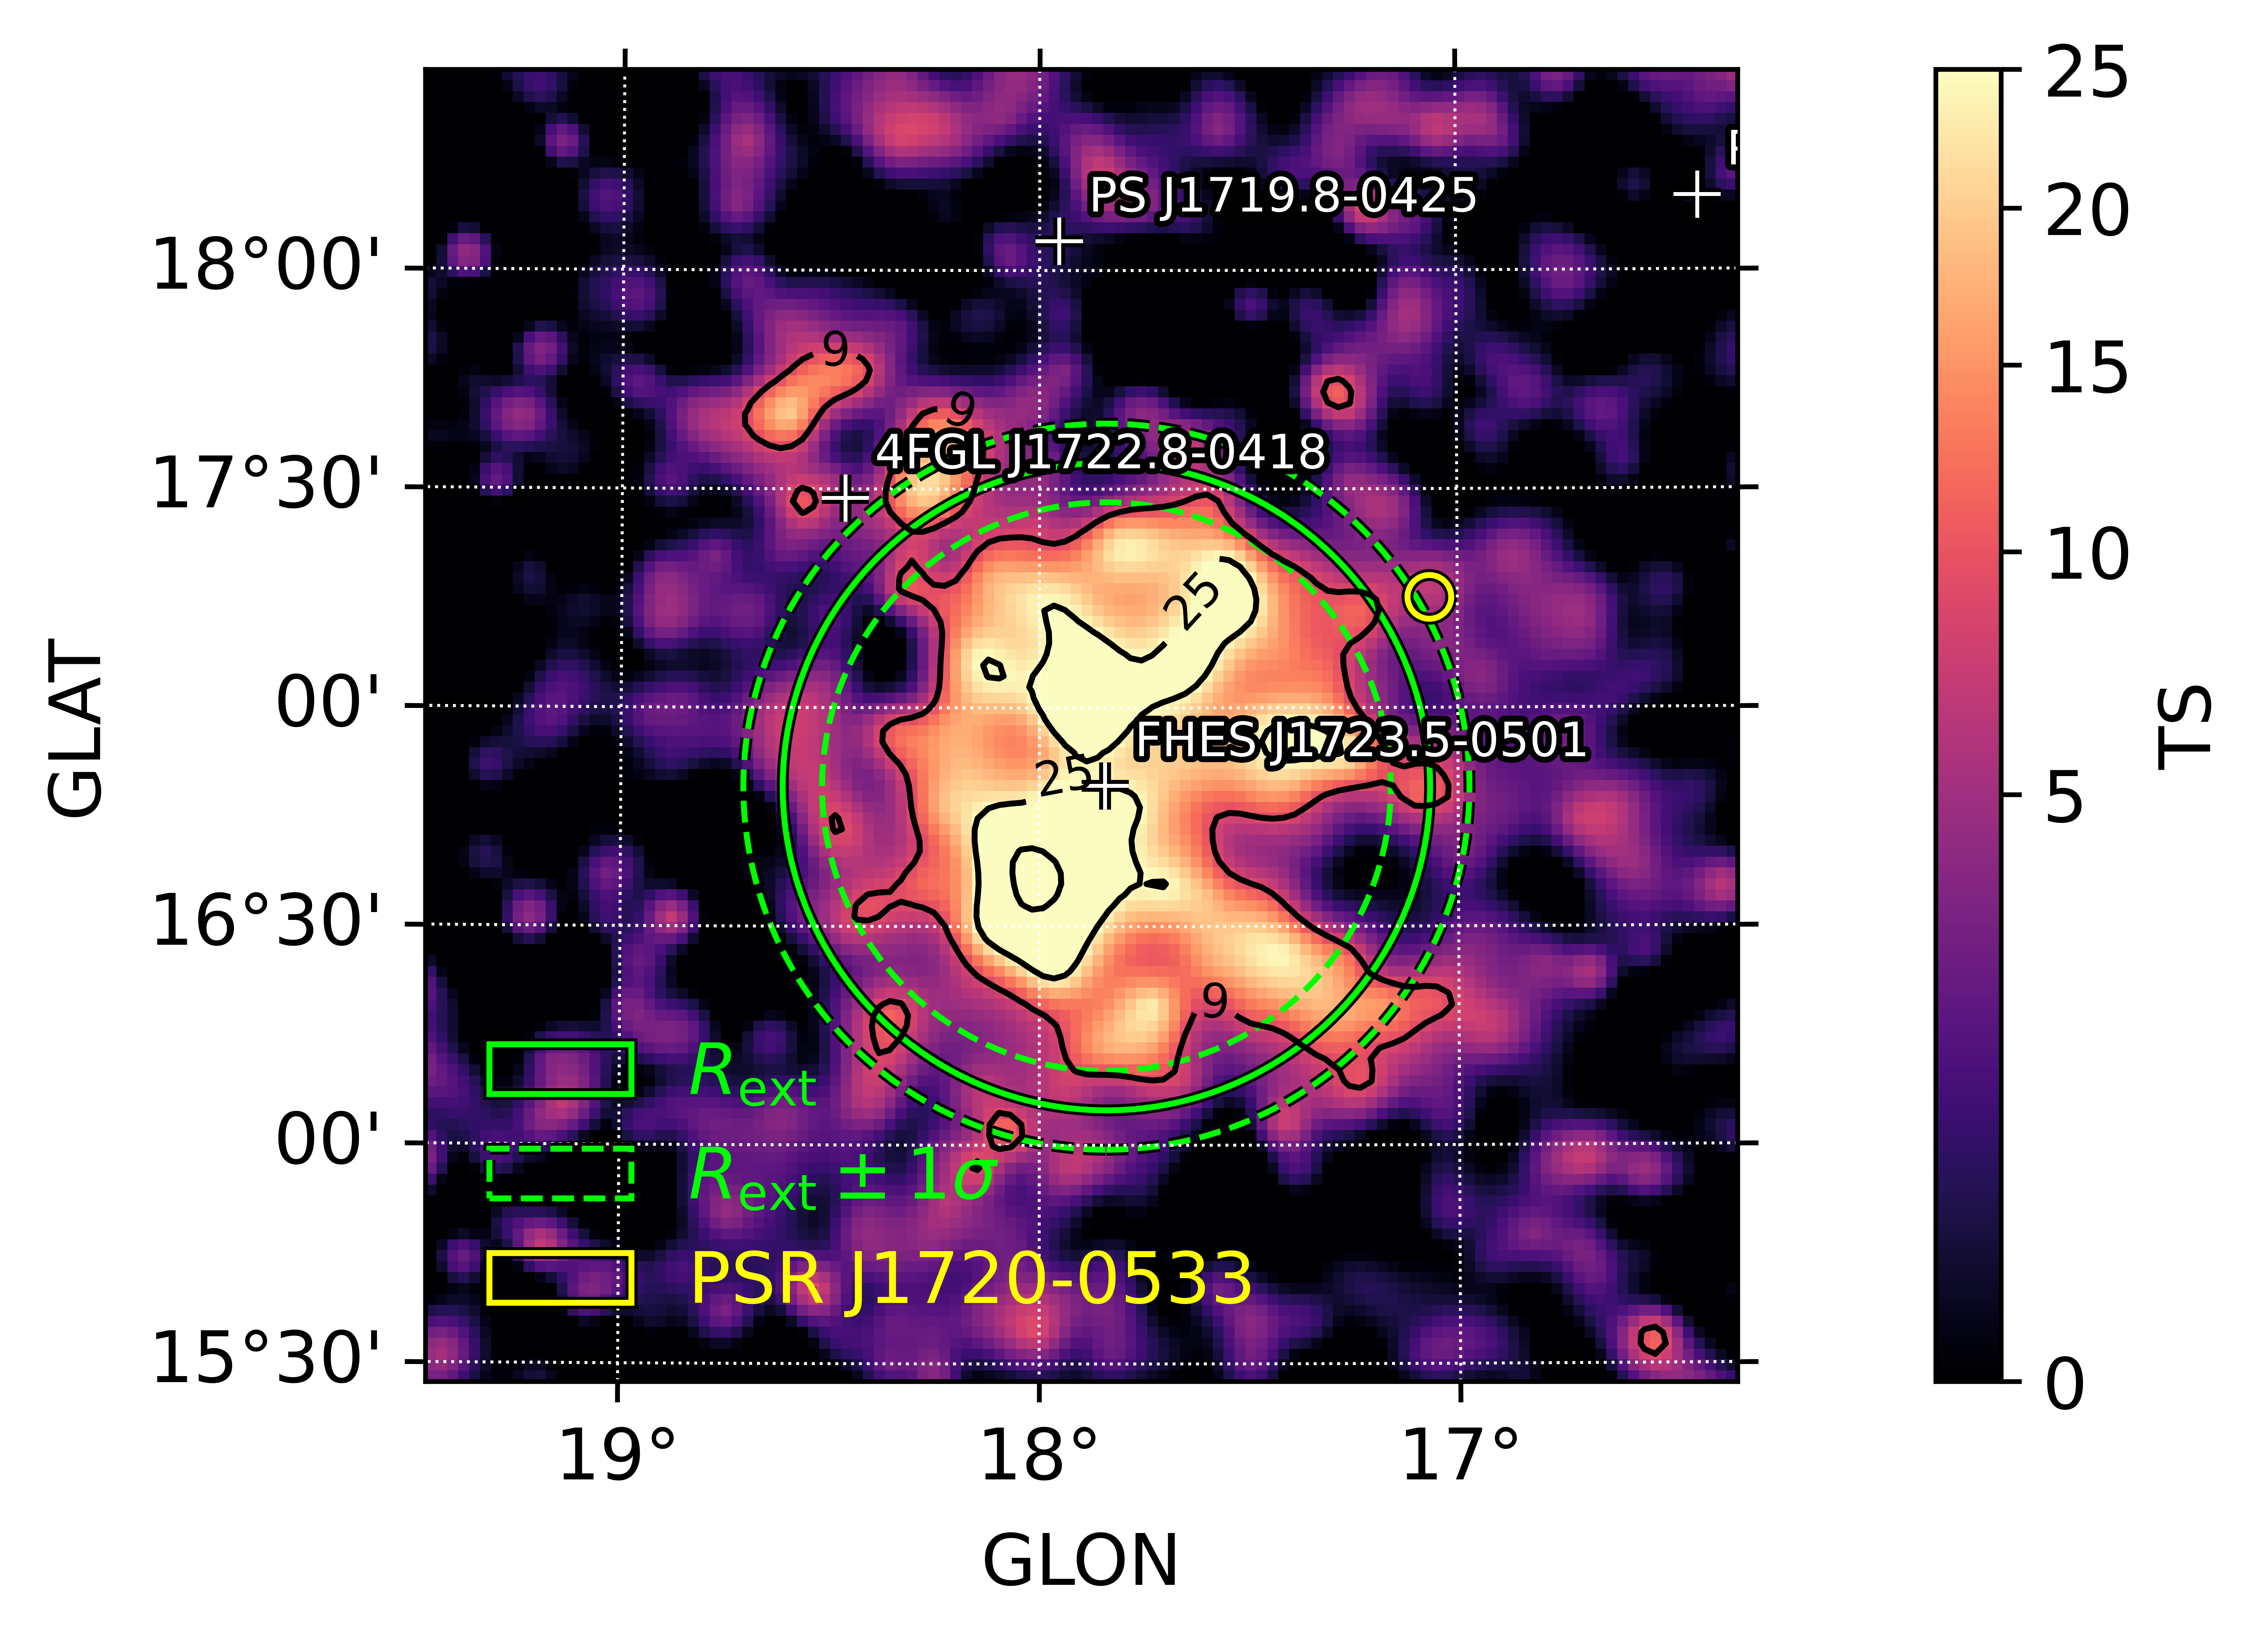
Once all baseline model sources are configured, we perform a spectral fit of the flux normalization and spectral shape of the Galactic diffuse emission model, and all point sources with at least one predicted photon () from the catalog parameters. Next, we re-localize the sources inside the ROI with a distance of at least from the ROI boundary to their local TS-peak and refit their normalizations simultaneously. Finally, we refit the spectral parameters of all model components inside the ROI to complete the optimization of the baseline model.
The analysis then proceeds iteratively by looking for new candidate point sources. First, we investigate sources in the outer ROI defined by , where . Candidates are identified by creating a TS-map for a test source with a PL spectral model with index . Starting from the peak with the highest TS-value, we add candidate point sources with to the model, as long as the new candidate is at least away from an existing candidate source with a higher TS-value. To ensure that the source is bright enough to detect the spectral curvature parameters in the LP case, we only model candidate sources with a LP spectral shape for sources with , and otherwise they are modeled with a PL. When the candidate sources are added to the model, we simultaneously fit their spectral shapes and normalizations. Once all candidate sources fulfilling our criteria are added to the model, a new TS-map is generated and new candidate sources are added in the same way. This procedure continues until there are no candidate sources left located at with . Finally, we refit the normalizations and spectral shapes of all model components to complete the optimization of the outer ROI.
In the final part of the analysis in Ackermann et al. (2018) they optimize the inner ROI by carefully looking for new point source candidates while they test the central source for extension. However, as there are no significant candidate point sources with within for this ROI, the final steps are not necessary.
The detection significance of extended emission is quantified by
| (3) |
which is the likelihood ratio between a model with an extended central component and a model with a central point source. Ackermann et al. (2018) classify the sources as extended if , corresponding to a detection. For FHES J1723.5-0501 we obtain . Therefore, we update our model with the extended central source by performing an extension fit. Then, we refit the normalization and spectral shape of all model components. Finally, we consider the ROI to be fully optimized by running a new extension fit of the central source and once again refit all spectral parameters of the model components. The extension fit finds, among other things, the best-fit position of the extension, together with the extension radius which is parameterized by the intrinsic 68% containment radius of the source. The TS-map of FHES J1723.5-0501 after the optimization of the ROI is presented in Figure 7.
| Analysis | TS | a | b | |||||
|---|---|---|---|---|---|---|---|---|
| Ackermann et al. (2018) | 17.90 | 16.96 | 89.5 | 52.9 | - | |||
| Araya et al. (2022) | - | - | 153.2 | 65.6 | - | |||
| This work | 17.84 | 16.82 | 133.8 | 114.7 |
-
-ray photon flux in units of in the energy band.
-
-ray energy flux in units of in the energy band.
A.2 Discussion
Ackermann et al. (2018) reported an unclassified radio shell engulfed by the extended emission, suggesting its association with a type 1a SNR or a PWN. In a recent study, Araya et al. (2022) classified FHES J1723.5-0501 as a type 1a SNR, naming it G17.8+16.7, and estimating its distance to be in the range of , using the characteristic radio luminosity range for SNRs and SNR evolutionary models. In their analysis of this radio emission, they calculate a two-point spectral index from the and radio flux densities of for , and conclude that this is consistent with non-thermal emission from a synchrotron-emitting shell SNR.
Our analysis results in a best-fit position of and , with the extension radius of and . We find a -ray photon flux of , a -ray energy flux of , and a PL spectral index of . These values are fully consistent with the results from Ackermann et al. (2018) and Araya et al. (2022). However, Araya et al. (2022) obtain a larger TS-value compared to this work, but their value is only 57% of ours. We suspect our larger value to originate from the use of a joint likelihood analysis with the PSF partition. The results from the extension fit of FHES J1723.5-0501 for this work compared to the two mentioned analyses are summarized in Table 3. Figure 8 shows the LAT spectrum of the extended source.
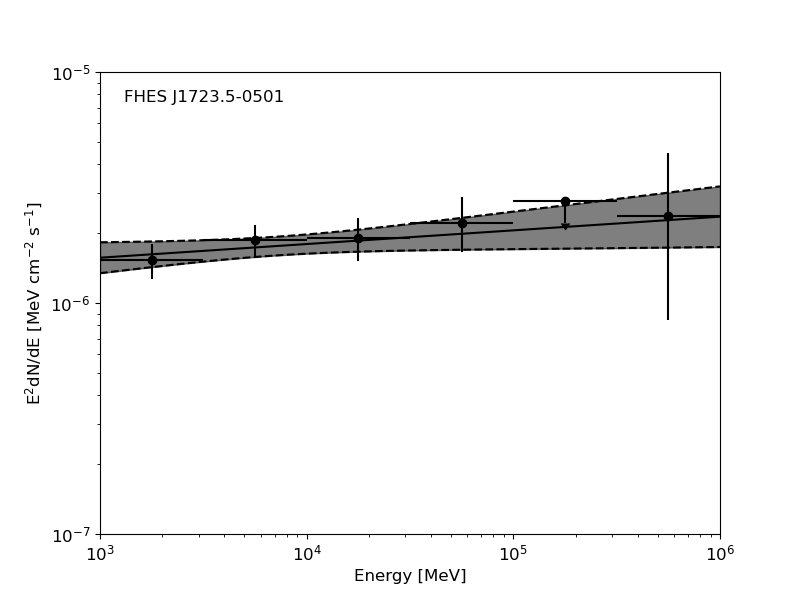
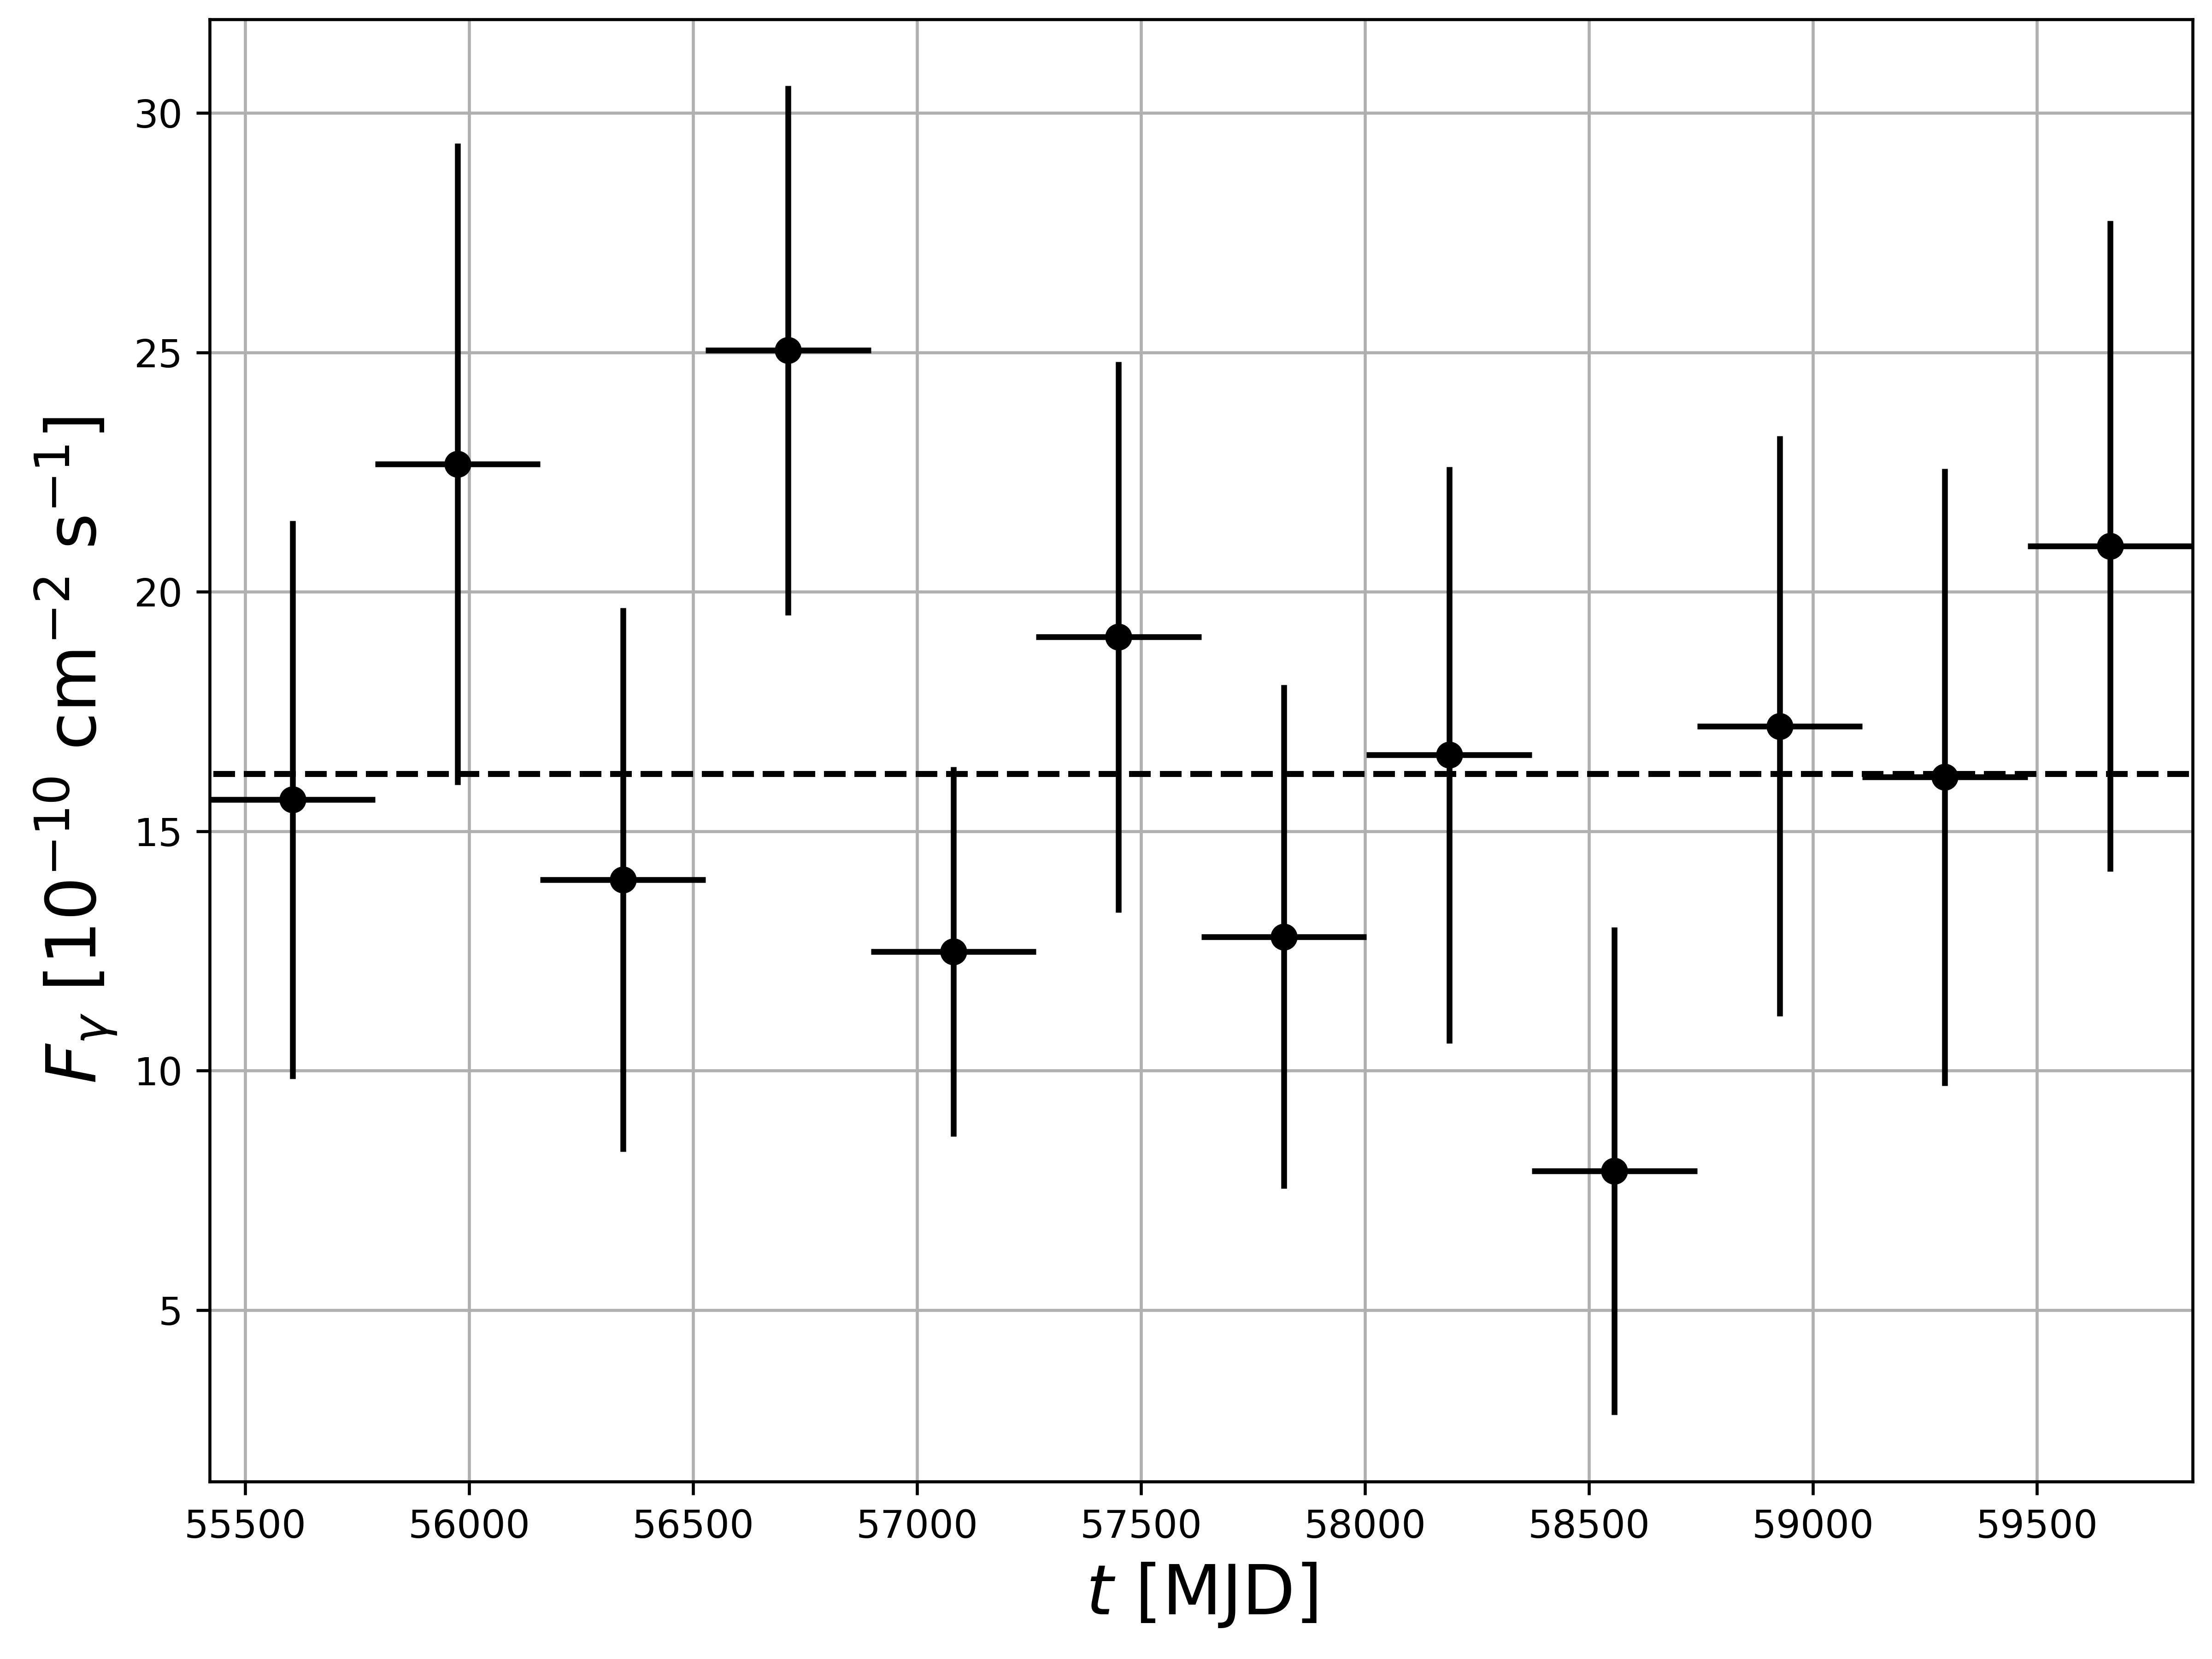
Based on our observed -ray energy flux in the energy band and the distance estimate range of from Araya et al. (2022), we calculate the -ray luminosity of FHES J1723.5-0501 to be in the range of which places it among the brightest SNR -ray luminosities observed, as can be seen in Figure 13 in the First Fermi-LAT Supernova Remnant Catalog (1SC) Acero et al. (2016). The calculated spectral index of places this potential -ray emitting SNR among the SNRs with the hardest reported spectral indices (see Figure 8 in 1SC). Finally, we extracted the long-term LAT light curve of this extended source and find it is consistent with a constant flux over 12 years (Figure 9).
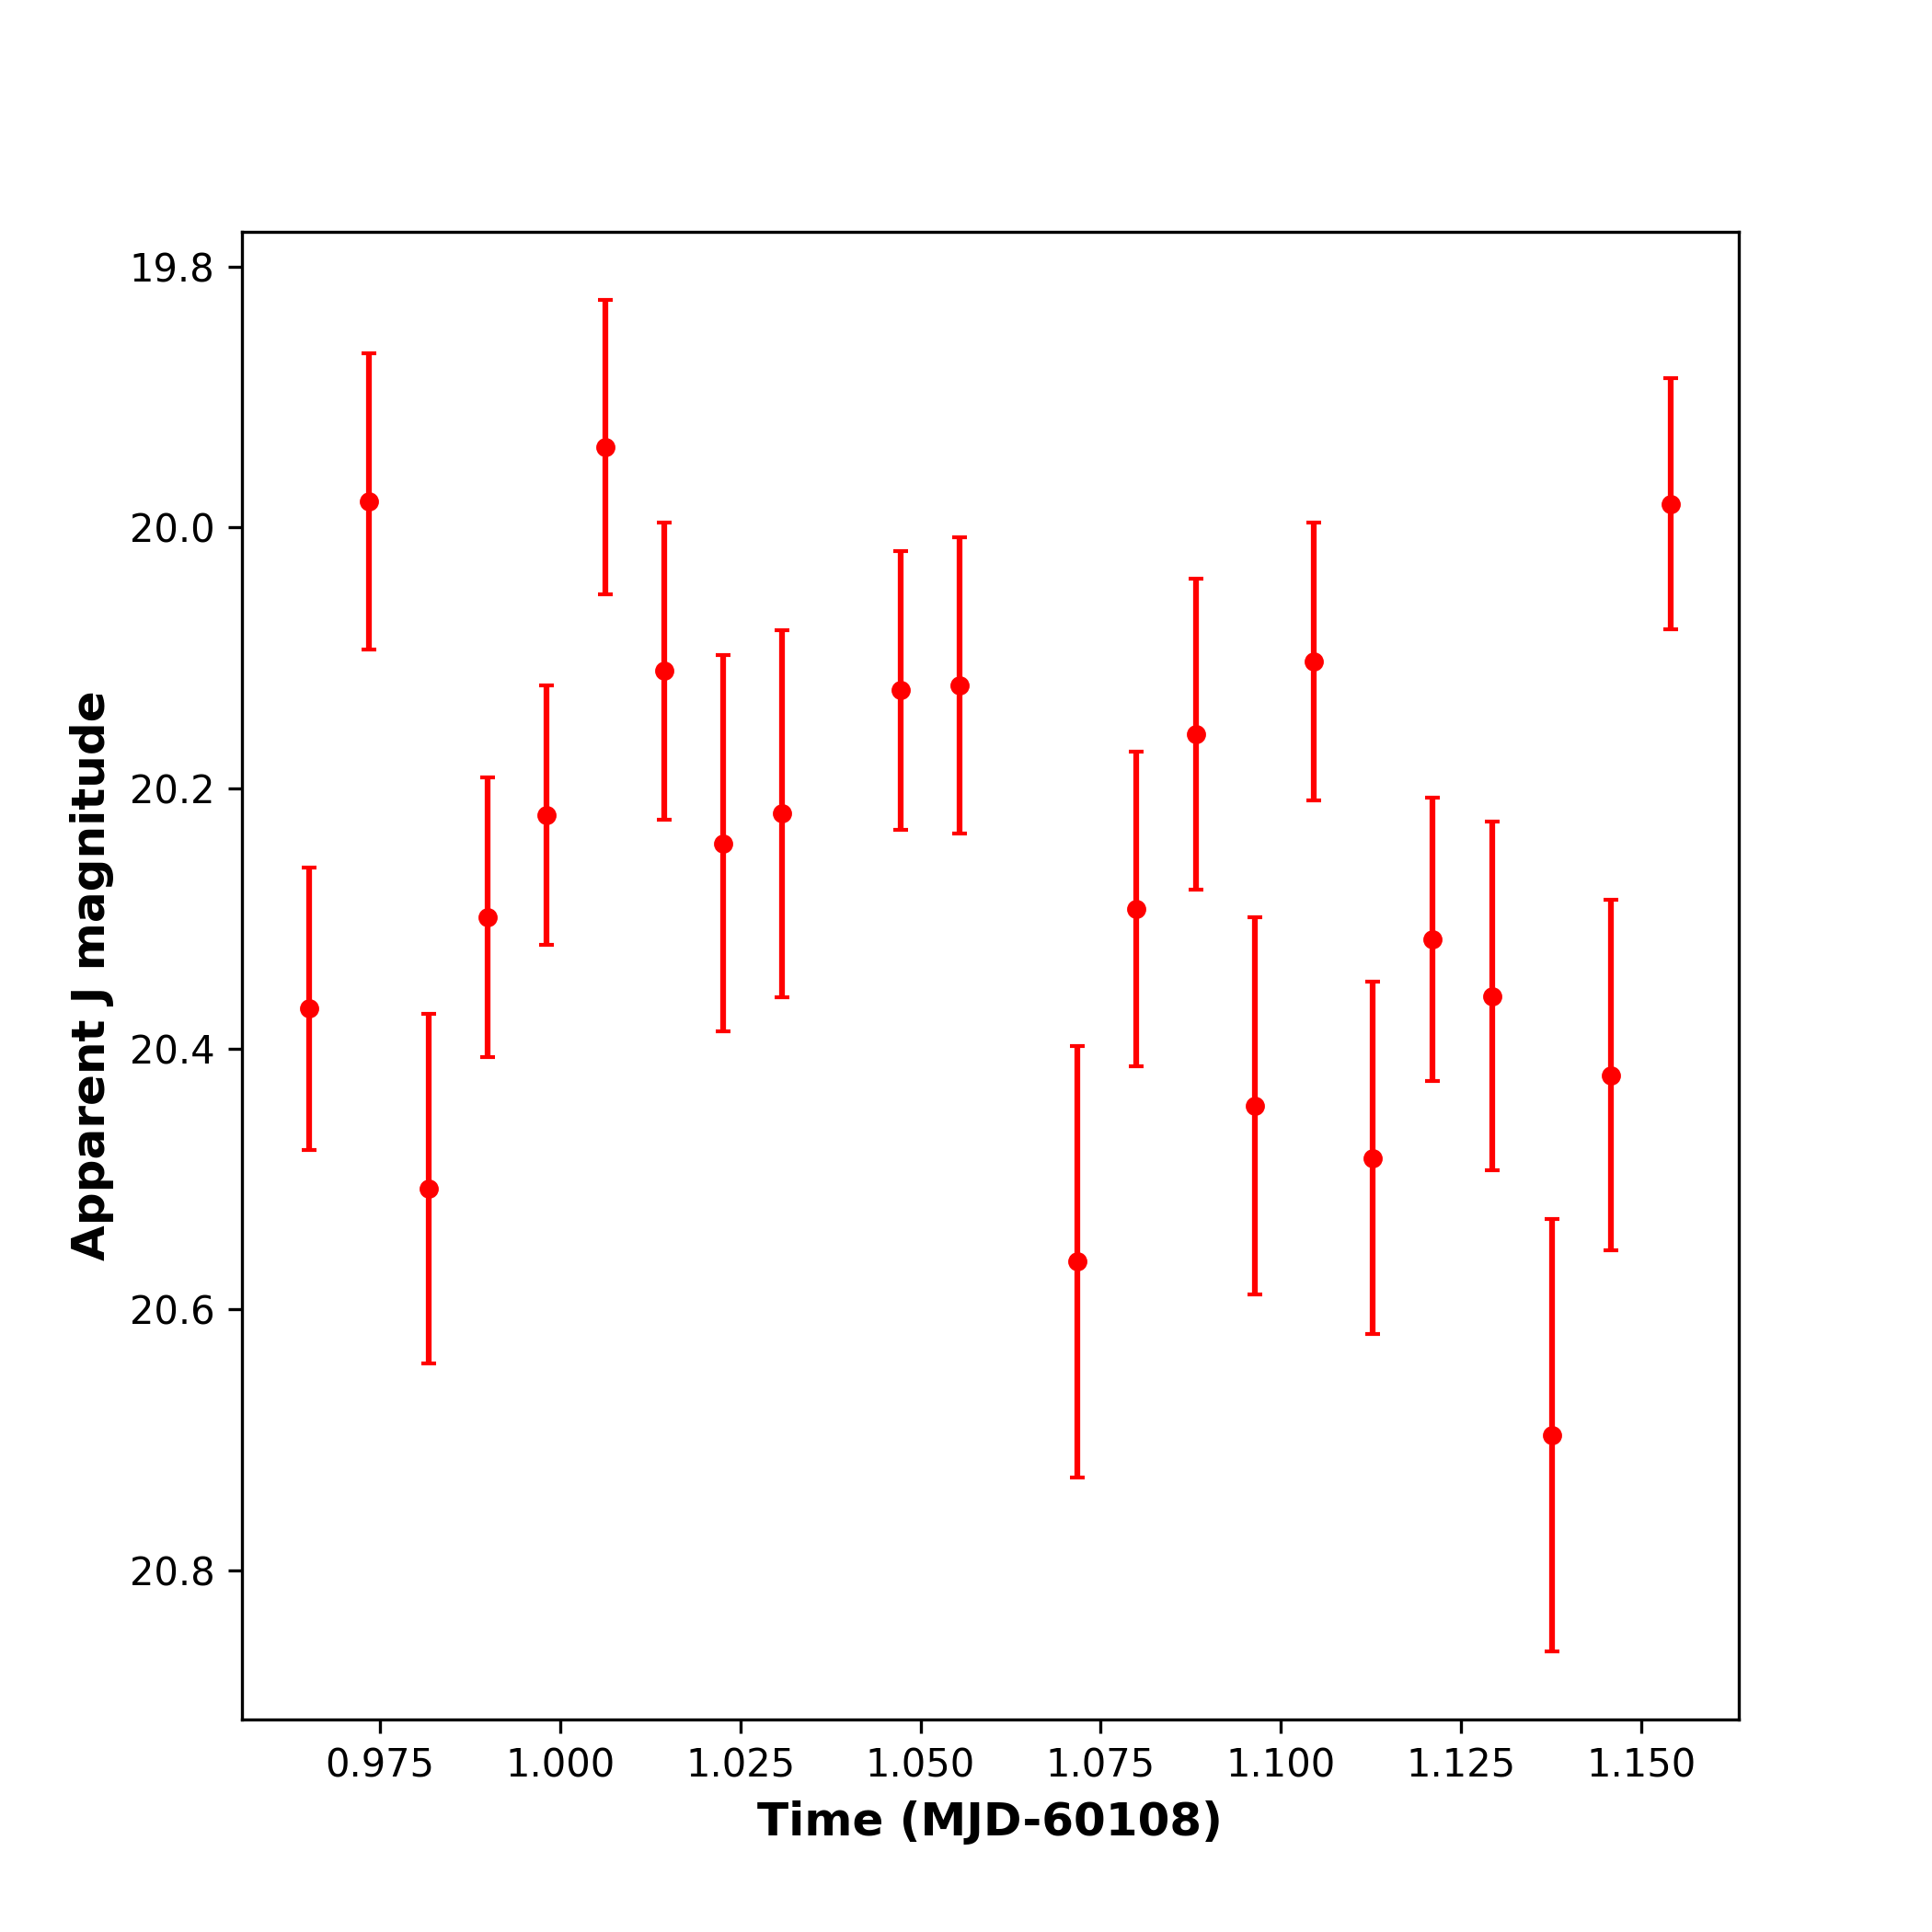
Appendix B Near-infrared study of the nearby source to PSR J1720-0534
Fig. 10 shows the light curve of the nearest infrared source to the radio location of PSR J1720-0534 at the coordinates of RA: 260.2265 DEC: -5.573. The measurements are consistent with a constant source with the average J-band magnitude of 20.25 and a scatter of 0.05 mag. The same light curve is folded with the known orbital period in Fig. 11 with no evident orbital variability.