Confidence-aware Fine-tuning of Sequential Recommendation Systems via Conformal Prediction
Abstract.
In Sequential Recommendation Systems, Cross-Entropy (CE) loss is commonly used but fails to harness item confidence scores during training. Recognizing the critical role of confidence in aligning training objectives with evaluation metrics, we propose CPFT, a versatile framework that enhances recommendation confidence by integrating Conformal Prediction (CP)-based losses with CE loss during fine-tuning. CPFT dynamically generates a set of items with a high probability of containing the ground truth, enriching the training process by incorporating validation data without compromising its role in model selection. This innovative approach, coupled with CP-based losses, sharpens the focus on refining recommendation sets, thereby elevating the confidence in potential item predictions. By fine-tuning item confidence through CP-based losses, CPFT significantly enhances model performance, leading to more precise and trustworthy recommendations that increase user trust and satisfaction. Our extensive evaluation across five diverse datasets and four distinct sequential models confirms CPFT’s substantial impact on improving recommendation quality through strategic confidence optimization. Access to the framework’s code will be provided following the acceptance of the paper.
1. Introduction
Sequential recommendation systems (SRecsys) (Kang and McAuley, 2018; Zhou et al., 2020; Zhang et al., 2019; Hou et al., [n. d.]) have been witnessed as a crucial component within personalized recommendation engines in recent years. These systems excel at predicting the next item of interest for a user from their past interactions, leveraging the abundant data and advanced machine learning techniques available today. Their utility spans a broad spectrum of applications, from e-commerce to social media, enhancing user engagement and satisfaction while driving business value.
In SRecsys, Cross-Entropy (CE) loss (Kang and McAuley, 2018; Zhou et al., 2020; Sun et al., 2019) is crucial for predicting users’ next interactions based on their past behaviors. However, despite its effectiveness in highlighting the ground truth item, CE loss does not account for the confidence level of its predictions. For example, there’s a significant difference between a model predicting a user will purchase red headphones with 99% confidence versus 30% confidence. High confidence suggests that the model is well-acquainted with similar patterns, whereas low confidence, even for a top-scored recommendation like the red headphones, indicates uncertainty about the user’s preferences. This highlights the importance of measuring model’s confidence, as lower confidence levels increase prediction risk (McNee et al., 2003).
Conformal Prediction (CP) (Vovk et al., 2005; Angelopoulos and Bates, 2021) offers a robust method for assessing recommendation confidence by considering the size of the ”prediction set” - the list of suggested items. These sets represent the model’s understanding of user preferences, informed by their sequential interaction history. The set size serves as a confidence metric, with larger sets (or inefficiency) indicating greater predictive uncertainty. CP, traditionally used in inference to provide statistically valid prediction sets, can also be adapted as a loss function to evaluate the quality of the entire prediction set (Stutz et al., 2021; Huang et al., 2023a), not just the ground truth item. By integrating CP-based loss with CE loss, we can address the limitations of CE by ensuring that the recommendation set is not only accurate but also reflective of how confident the model is in recommending items to the user. We believe CP is well-suited for recommendation tasks where users are presented with ranked items. By optimizing for conformal efficiency (minimizing the prediction set size) during training, we can refine the model’s candidate selection, ensuring a high likelihood of capturing the true next item of interest.
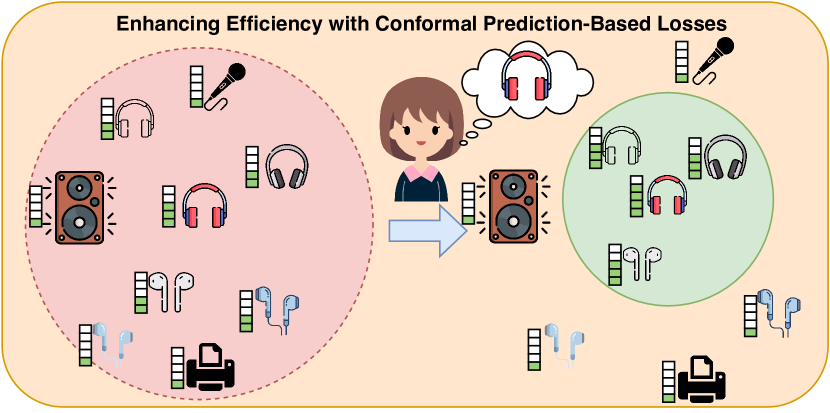
In this study, we present two novel CP-based losses to enhance SRecsys: the Conformal Prediction Set Size (CPS) loss, which aims to reduce the prediction set size, and the Conformal Prediction Set Distance (CPD) loss, designed to minimize the distance between top-ranked items and the ground truth. We find that CPD loss is particularly crucial for addressing scenarios where high-error-rate conformal prediction set may not encompass the ground truth, by drawing the set closer to the ground truth and, in turn, increasing the confidence of nearby items to improve efficiency, as depicted in Fig. 1. Furthermore, we integrate these CP losses as regularizers with the standard cross-entropy (CE) loss during the fine-tuning phase of SRecsys, named CPFT. This strategy is chosen for two primary reasons: First, our losses aim to enhance efficiency, a model-agnostic goal, making it more practical to fine-tune an already trained model rather than starting from scratch. Second, since conventional CP (Vovk et al., 2005) is typically applied at the inference stage and presupposes a pre-trained model, integrating CP directly into the training phase complicates the computation of inefficiency.
The motivation of using CP-loss in SRecsys has four points: (1) Enhancement of Recommendation Precision: While CE loss effectively prioritizes the ground truth item by aiming to place it at the top of the recommendation list, CP-loss contributes by refining the entire set of potential recommendations. It leverages the confidence scores of items to carefully select and organize the items in a set that not only aims to include the ground truth item, ensuring high relevance across all suggested items. (2) Holistic Confidence Optimization: CP-loss complements CE loss by broadening the focus from maximizing the confidence of just the ground truth item to optimizing the confidence across all items within the prediction set. This holistic optimization ensures a more consistent and reliable recommendation quality, addressing the variability in item relevance and user preferences. (3) Adaptive Fine-tuning: The prediction sets constructed for hard samples can contain much more items than the those of the easy samples. This adaptive nature helps CP-loss to squeeze the confidence among few items for the easy samples while spreading confidence among a large set of potential items for hard samples to avoid false negative. (4) Utilization of Unlabeled Data: CP-loss can be computed on unlabeled data, substantially enlarging the pool of data usable for model fine-tuning. In our data splitting strategy, we integrate validation data into the fine-tuning phase. This approach not only enhances model performance but also maintains the functionality of early stopping.
Our contributions can be outlined as follows: (1) We pioneer the integration of conformal prediction-based loss into Sequential Recommendation Systems (SRecsys), marking a novel approach in this field. (2) Our work is the first to systematically utilize the validation dataset during the model training phase, enhancing the training process. (3) Proposing model-agnostic CP-losses, offering a versatile plug-in solution applicable to any sequential model. (4) We demonstrate the effectiveness of our proposed CP-losses across five real-world datasets, using four distinct types of SRecsys.
2. Related Work
2.1. Sequential Recommendation
Sequential recommendation systems (SRecsys) aim to understand users’ evolving preferences by analyzing their interaction history as a sequence. These systems typically employ a sequential encoder, drawing on methodologies either from Markov chains (Rendle et al., 2010; He and McAuley, 2016) or Recurrent Neural Networks (RNNs) (Hidasi et al., 2015; Ma et al., 2019).
The advent of the Transformer architecture has significantly impacted SRecsys, notably for its ability to handle complex item-to-item transitions and its scalability. SASRec (Kang and McAuley, 2018) was the first to apply Transformers in SRecsys, effectively modeling complex sequential patterns. Following this, BERT4Rec (Sun et al., 2019) introduced bidirectional attention by masking certain items in the input sequences and predicting these based on the context provided by adjacent items. CoSeRec (Liu et al., 2021a) furthered this innovation by employing contrastive self-supervised learning, creating varied data views through techniques like sequence masking, cropping, reordering, substituting, and inserting. Additionally, ASReP (Liu et al., 2021b) enhanced sequence representation by reversely pre-training the Transformer model. However, the introduction of synthetic noise through self-supervised methods is non-negligible and might inadvertently detract from model performance.
2.2. Confidence in Recommendation Systems
In Recommender Systems (RecSys), confidence refers to the system’s assurance in the relevance and accuracy of its recommendations to users. Confidence is crucial for ensuring user trust and satisfaction, as it reflects the system’s ability to make reliable suggestions based on users’ preferences and interaction histories. By incorporating confidence metrics, RecSys can better align recommendations with user expectations, thereby enhancing the overall user experience. One study (McNee et al., 2003) discusses an experiment that assesses how incorporating a confidence metric into a recommender system impacts user satisfaction and behavior, highlighting that user experience and training significantly influence the effectiveness of such features. Other research (Naghiaei et al., 2022) introduces a confidence-aware re-ranking algorithm that balances calibration, relevance, and diversity in recommendations while considering the confidence level based on user profile size. It highlights the importance of calibration confidence in delivering diverse yet user-aligned recommendations. Another research (Gohari et al., 2018) proposes a Confidence-Based Recommendation (CBR) approach that integrates trust and certainty into collaborative filtering, emphasizing the role of confidence derived from both user opinions’ trustworthiness and certainty. Additionally, a method (Azadjalal et al., 2017) employing leverages Pareto dominance and confidence concepts to enhance recommendation accuracy and coverage by identifying influential users through implicit trust statements, underscoring the significance of trust and confidence in mitigating the sparsity challenge in RecSys. Diverging from existing methods, we introduce a novel approach: Confidence-aware Fine-tuning of Sequential Recommendation Systems via Conformal Prediction. This method focuses on refining the size of the prediction set to elevate model confidence, thereby augmenting model performance.
2.3. Conformal Prediction
The primary focus of this paper is on split conformal prediction (Papadopoulos et al., 2002), which is considered the most common and straightforward variant of conformal prediction (CP) (Gammerman et al., 1998; Vovk et al., 2005). With exchangeable calibration and test data, models calibrated using split CP are statistically assured to provide prediction sets that encompass the true test labels at any predetermined level of confidence. Due to its model-agnostic and distribution-free property, CP has been widely applied to different domains and tasks for inference, such as image classification (Angelopoulos et al., 2020), drug discovery (Alvarsson et al., 2021), and question answering (Fisch et al., 2020).
While maintaining its statistical guarantee, the mean size of test sets should be minimized to provide informative predictions. Improving from (Sadinle et al., 2019), a series of works redesign (non)conformity scores to enhance efficiency (Romano et al., 2020; Angelopoulos et al., 2020; Wang et al., 2023; Huang et al., 2023b). Recently, (Stutz et al., 2021) blazes a novel trail, which directly optimizes a combination of classification loss and CP-based inefficiency loss in the training process. Similarly, (Huang et al., 2023a) assumes that inefficiency emerges after a few training iterations, and trains the prediction model using classification loss in the initial neural network layers and fine-tuning it solely with the inefficiency loss in the final layer. However, despite the reduction in average set size, there is a slight decrease in prediction accuracy compared to baselines in both works.
To the best of our knowledge, the only work that applies CP to Recsys is by (Angelopoulos et al., 2023), where CP is utilized within a learning-to-rank context to enhance diversity and manage false discovery rates. However, this methodology is specifically designed for inference purposes and does not extend to model fine-tuning.
3. Preliminaries
This section first outlines sequential recommendation systems, then reviews traditional loss functions like Cross-Entropy (CE) loss, and finally introduces the concept of conformal prediction.
3.1. Sequential Recommendation Systems
In the context of sequential recommendation systems, the essential elements are defined as follows. Let represent the set of users, where each is a unique user. Similarly, the item set is denoted as , with each being a distinct item.For the -th user , their interactions with items over time are captured as a sequence , where denotes the item user interacts at time step, and is the total number of items in user ’s sequence. The primary goal of the system is to predict the probability of each item to be the next interaction item by user , given their interaction history . Formally, for user , the system would output
| (1) |
Each item is encoded into a vector representation within the embedding matrix , where represents the -dimension embedding vector for item .
In the inference stage, the recommendation model uses the sequence before the time step to predict the interaction item at the step. The output of the recommendation model for -th user’s sequence is denoted as . With T denoting a transpose of the vector, the relevance score between any item and the user interactions is computed through the matrix factorization (MF) layer and defined as
| (2) |
3.2. Cross-Entropy (CE) Loss
The CE loss function is employed to assess the probability that a given item is the next item in a user’s sequence. For a user and their sequence , the CE loss is calculated by comparing the predicted probability distribution over all possible items with the actual next item . The loss in the training process for user at time step is defined as:
| (3) |
where in -th time step, is the indicator (1 if item is the actual next item, otherwise 0), and is the predicted probability of item being the next item in the sequence.
3.3. Conformal Prediction
We formalize conformal prediction (CP) in the context of sequential recommendation systems with our established notations. For a user with an interaction sequence , conformal prediction aims to generate a set of potential next items at any pre-determined error rate. We denote this set as , where represents the error rate. This means the ground truth of the next item should fall out of the set at a probability of at most .
The split CP involves splitting labeled data into training and calibration sets, where the model is only trained on the training set. Calibration data is used to calculate the nonconformity scores , assessing the incompatibility between the next item and the prediction outcome derived from the model . A higher score indicates a weaker agreement between the next item and the model’s prediction. Utilizing the scores obtained from calibration data, the -quantile value is computed, empirically the smallest value that is greater than percentage of scores. Finally, this quantile is employed to construct the prediction set for the -th user. The prediction set includes all possible items for which the corresponding nonconformity score between model prediction and this candidate item is smaller than :
| (4) |
The split CP possesses a desirable guarantee for prediction results when calibration and test data satisfy the exchangeability assumption. Exchangeability ensures that the distribution of calibration data remains unchanged after swapping the test score with the score of any sample in the calibration data. Under this assumption, the set contains items from such that the ground truth next item is within this set at least confidence level:
| (5) |
In SRecsys, this method allows for generating recommendations not as single items, but as a set of items with a guarantee of covering the true next item with a specified level of confidence. This approach improves the robustness and reliability of the recommendations and adapts well to the inherent uncertainty in the prediction of user behavior.
4. Methodology
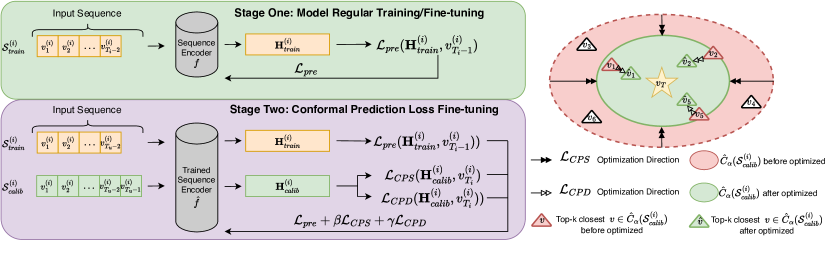
In this section, we outline our methodology for enhancing the performance of an initially trained sequential model, denoted as , through a conformal prediction-based fine-tuning process that does not require additional data or labels. Our method begins with an innovative data-splitting strategy that is essential for the effective integration of our novel CP-based losses, Conformal Prediction Set Size (CPS) and Conformal Prediction Set Distance (CPD), during the fine-tuning phase. We proceed to explain how the conformal prediction set is calculated within the sequential model. The CPS loss aims to optimize the size of the prediction set for increased efficiency, while the CPD loss fine-tunes the model by minimizing the distance between the top recommendations and the ground truth. These components work together within our fine-tuning framework to refine the model’s predictions, ensuring they are not only accurate but also confident. The architecture and interaction of these elements are depicted in Figure 2, offering a comprehensive overview of our conformal prediction-based fine-tuning approach.
4.1. Data Splitting
In our framework, a key advantage is the enhancement of model performance without the need for additional data. Instead, our objective is to extract more valuable information from the existing dataset. To this end, our proposed fine-tuning approach using conformal prediction-based losses operates in a semi-supervised manner. Typically, the validation dataset in sequential recommendation systems is used for early stopping to prevent model overfitting. However, we posit that the validation dataset, referred to as the calibration sequence in our framework, can provide more insightful information for optimizing model parameters.
More specifically, for each user in a batch of training data, we introduce two distinct input sequences. The first is the user’s training sequence, , used for calculating the standard prediction loss as in the original sequential model. The second is the user’s calibration sequence, , which is analogous to the validation sequence but recalculated at each step. While is used for supervised prediction loss calculation, is used to calculate our conformal prediction-based losses. We denote the collections of training and calibration sequences as and , respectively. In parallel, the sequence representations for training and calibration are specified as and . Notably, in the loss computation process, the ground-truth item from the calibration data is not explicitly factored into the loss calculation. Instead, it offers indirect, albeit significant, insights that enrich the model’s learning.
This approach addresses potential overfitting issues associated with supervised learning in prediction loss calculation. By including an additional time step in the calibration sequence, we enhance the model’s generalization capabilities. For example, as illustrated in Fig. 2, using only the prediction loss calculation would limit the learning to predicting and testing on . In contrast, by applying our proposed losses, the model is exposed to semi-supervised learning about , thus improving its ability to generalize when tested on .
4.2. Conformal Prediction for SRecsys
In our framework, the core component is the conformity score function utilized by the sequence model , trained on the training set . The confidence of model for item to be the next item refers to its soft-max probability: , where exp is the exponential function. Inspired by (Sadinle et al., 2019), the nonconformity function in this paper for predicting is defined as = = . In other words, this nonconformity score measures how uncertain the model is about the ground truth item . For a specified error rate , we calculate the quantile , representing the -th quantile of the empirical distribution of scores of calibration set . In the next step, we calculate the nonconformity score of the same model between item and the next unknown ground-truth calibration item :
| (6) | ||||
Under exchangeability of nonconformity scores of predicting and , i.e., and , the prediction set constructed with Eq. 4 would cover the next time for at least of the time.
The size of this conformal prediction set inversely reflects the uncertainty of the model in its predictions: a larger set indicates lower confidence and encompasses a wider array of items, while a smaller set suggests higher confidence and more targeted predictions. Understanding this relationship is pivotal in our design of the following two Conformal Prediction-Based Losses, leveraging the size of the prediction set as a key indicator of model performance.
Inspired by the traditional application of CP in inference, we have innovatively adapted its principles to design two new loss functions for sequential recommendation (SRecsys) systems: Conformal Prediction Set Size (CPS) and Conformal Prediction Set Distance (CPD). Although CP traditionally quantifies the confidence of the prediction in the inference stage, in CPS and CPD, we utilize it in the training phase. CPS aims to optimize the size of this set for increased precision and confidence, and CPD focuses on minimizing the closest ranking distance within the prediction set.
To well adapt CP for SRecsys, we carefully selected and designed its implementation. We chose the CP version by Sadinle (Sadinle et al., 2019) for its computational efficiency, avoiding the need for differentiable ranking or sorting required by other methods (Romano et al., 2020; Huang et al., 2023b). Given the inherent distribution shifts in SRecsys as a time series, where models are more confident in near-future predictions, we observed stronger distribution shifts during training. Therefore, according to (Barber et al., 2023), the lower bound of coverage rate on test data would decrease. To prevent the coverage rate from vanishing, we relax Eq. 4 as:
| (7) |
where is a uniform random variable independently generated for each . This gives a second chance for items with confidence below the threshold to be included in the prediction set. Next, we will explain how this design facilitates learning for SRecsys.
4.3. Conformal Prediction-Based Losses
Our conformal prediction-based losses adopt a semi-supervised approach, which means that the ground truth of the validation data, , is not directly used for loss calculation. Instead, each loss is designed to extract valuable information from different perspectives to improve the model’s performance.
4.3.1. Conformal Prediction Set Size (CPS)
In the realm of conformal prediction, the mean size of the prediction set , often referred to as inefficiency, plays a pivotal role. A smaller set size indicates lower inefficiency, signifying higher confidence in the model’s predictions. Therefore, the objective of CPS is to minimize the average size of , denoted as . By minimizing , the set would gradually contain fewer items with higher confidence, meanwhile decreasing the confidence of excluded items. The confidence, defined in Eq. 6, could be viewed as the relative distance from the prediction embedding . In other words, our construction of sets pushes away the items that are less likely to contain ground truth items and draws the possible set closer to the model prediction. Notably, the ground truth item in the validation data remains untouched in the loss calculation.
Let represent the batch data during the training, and is the batch size. CPS in the batch training is calculated as
| (8) |
4.3.2. Conformal Prediction Set Distance (CPD)
While the CPS focuses on reducing the prediction set size to boost model confidence, the Conformal Prediction Set Distance (CPD) loss adopts a different yet complementary approach.
CPD loss is designed to address the inherent difficulty of the recommendation task, which can be likened to a multi-classification problem with a vast number of items but only one correct answer (the ground truth). Due to this complexity, even a conformal prediction set generated with a high error rate might not always encompass the ground truth. In such scenarios, CPD loss comes into play by drawing the conformal prediction set closer to the ground truth, based on the top-k nearest items to the ground truth within the set. This process effectively ’pulls’ the prediction set closer to the actual user preference, thus enhancing the model’s ability to make more accurate predictions. If the conformal prediction set already includes the ground truth, CPD loss assists in shrinking the size of this set. By ensuring that the closest items are aligned with the ground truth, CPD indirectly contributes to reducing the prediction set size, thereby enhancing the precision of the recommendations.
For each user in the batch , identify the top- items closest to the ground truth in the conformal prediction set. Denote this as:
| (9) |
where TopKClosest is an algorithm that finds the top- closest items. Then we compute the distance between each top- item and the ground truth, using cosine similarity (denoted as CosSim). The CPD loss can be expressed as:
| (10) |
The CPD loss aims to minimize the cosine similarity distance between the top- closest items in the CP set and the ground truth, enhancing recommendation precision by ensuring items are not only selected with confidence (as with CPS) but also closely match user preferences. By pulling the nearest possible recommendations closer to the actual user choice, CPD loss enhances the recommendation system’s ability to make precise and relevant suggestions, addressing one of the core challenges in sequential recommendation systems. While cosine similarity is used for its effectiveness in vector space alignment, other distance metrics may also be applicable based on the model or context.
In the fine-tuning stage of our conformal prediction-based framework, the total loss function is an amalgamation of traditional recommendation losses and our novel conformal prediction-based losses. To achieve a balanced and effective fine-tuning, we combine these elements as follows:
| (11) |
Here, represents the traditional recommendation losses, such as Cross-Entropy (CE), which are fundamental to the initial training of the model. The hyperparameters and control the influence of CPS and CPD losses within the total loss function.
5. Experiments
In this section, we conduct a comprehensive empirical evaluation of our proposed conformal prediction-based fine-tuning losses across five real-world datasets using four distinct models.
5.1. Experimental Setup
5.1.1. Dataset
To rigorously evaluate the performance of our proposed methodology, we conducted experiments on five datasets with four sequential models. Key statistics of the preprocessed datasets are summarized in Tab. 1. Specifically, we use five publicly available real-world datasets from the Amazon Review Dataset111https://jmcauley.ucsd.edu/data/amazon/: Scientific, Pantry, Instruments, and Arts and Office. These datasets have been widely used in previous recommendations system studies (Hou et al., [n. d.], 2022; Wang et al., 2021).
5.1.2. Evaluation Protocol
In our study, we adopt the widely accepted leave-one-out (LOO) evaluation methodology to assess the effectiveness of our fine-tuning losses. This method involves using the most recent interaction of a user as the test item, while the penultimate interaction is designated as the validation item. To evaluate the performance of our model, we focus on its ability to accurately rank the test item amidst a collection of negative items—items that have not been interacted with by the user. Consistent with established methodologies in the field, as referenced in works like SASRec (Kang and McAuley, 2018) and UnisRec (Hou et al., [n. d.]), we employ a full-ranking technique. This involves assessing the model’s ability to rank all items that a user has not interacted with, for each individual user. Since our primary interest lies in top-N item recommendation, we utilize normalized discounted cumulative gain (NDCG@10,50) and Hit-Rate (HR@10,50) as our key evaluation metrics.
5.1.3. Baselines
In our comprehensive evaluation of conformal prediction-based fine-tuning for sequential recommendation systems, we compare our approach against a diverse range of models to establish its effectiveness. Among these, SASRec (Kang and McAuley, 2018), -Rec (Zhou et al., 2020), and FDSA (Zhang et al., 2019) are categorized as single-domain models. SASRec employs directional self-attention to capture item correlations within sequences effectively. -Rec, on the other hand, utilizes a bidirectional Transformer encoder during its pretraining stage, enabling it to capture multi-view correlations. FDSA enhances item representation by concatenating item features with item ID embeddings. To further analyze the model-agnostic capabilities of our fine-tuning losses, we include UnisRec (Hou et al., [n. d.]) in our set of baseline models. UnisRec stands out as a pre-trained universal sequence representation model, known for its efficiency in transferring to new recommendation domains or platforms with minimal parameter adjustments. In summary, our baseline models encompass a broad spectrum: SASRec, which is an ID-based single-domain model; -Rec, a single-domain model that integrates pre-training and fine-tuning; FDSA, which combines item features and ID information; and UnisRec, a versatile model for universal sequence representation. This selection enables a thorough examination of the performance of our fine-tuning losses across varied model architectures and recommendation scenarios.
5.1.4. Hyper-parameters and Grid Search
To guarantee fairness and ensure the reliability of our experimental results, we integrated our proposed framework with RecBole (Zhao et al., 2021). In the case of SASRec, Rec, and FDSA, we implemented on a comprehensive hyper-parameter optimization process. This involved experimenting with various learning rates (0.001, 0.0005, 0.0001), setting the embedding dimension to 300, and testing different configurations for the number of layers (1, 2, 4) and heads (1, 2, 4). We standardized the batch size across these models at 512. For UnisRec, we adhered to the default settings as prescribed by RecBole. Additionally, we utilized the pre-trained checkpoints provided by the original authors of UnisRec to ensure consistency and leverage the model’s full potential.
| Scientific | Pantry | Instruments | Arts | Office | |
|---|---|---|---|---|---|
| #Users | 8,443 | 13,102 | 24,963 | 45,487 | 87,347 |
| #Items | 4,386 | 4,899 | 9,965 | 21,020 | 25,987 |
| #Inters | 50,985 | 113,861 | 183,964 | 349,664 | 597,491 |
| #Avg.U | 6.039 | 8.691 | 7.370 | 7.687 | 6.841 |
| #Avg.I | 11.683 | 23.246 | 18.483 | 16.643 | 23.080 |
5.2. Overall Performance
| Scientific | Pantry | Instruments | Arts | Office | ||||||||||||||||
|---|---|---|---|---|---|---|---|---|---|---|---|---|---|---|---|---|---|---|---|---|
| R@10 | N@10 | R@50 | N@50 | R@10 | N@10 | R@50 | N@50 | R@10 | N@10 | R@50 | N@50 | R@10 | N@10 | R@50 | N@50 | R@10 | N@10 | R@50 | N@50 | |
| SASRec | 0.1073 | 0.0555 | 0.2078 | 0.0767 | 0.0511 | 0.0226 | 0.1391 | 0.0416 | 0.1127 | 0.0697 | 0.2024 | 0.0891 | 0.1066 | 0.0595 | 0.1978 | 0.0794 | 0.1159 | 0.0783 | 0.1763 | 0.0915 |
| SASRec | 0.1138 | 0.0577 | 0.2228 | 0.0813 | 0.0543 | 0.0237 | 0.1494 | 0.0441 | 0.1188 | 0.0703 | 0.2183 | 0.0918 | 0.1122 | 0.0630 | 0.2073 | 0.0836 | 0.1183 | 0.0806 | 0.1816 | 0.0944 |
| -Rec | 0.0695 | 0.0373 | 0.1597 | 0.0567 | 0.0410 | 0.0196 | 0.1357 | 0.0399 | 0.0984 | 0.0576 | 0.1893 | 0.0754 | 0.0830 | 0.0553 | 0.1593 | 0.0720 | 0.1036 | 0.0750 | 0.1601 | 0.0872 |
| -Rec | 0.0711 | 0.0385 | 0.1623 | 0.0581 | 0.0431 | 0.0204 | 0.1376 | 0.0431 | 0.1055 | 0.0596 | 0.1938 | 0.0787 | 0.0941 | 0.0526 | 0.1827 | 0.0719 | 0.1066 | 0.0733 | 0.1652 | 0.0861 |
| FDSA | 0.0879 | 0.0592 | 0.1709 | 0.0769 | 0.0388 | 0.0216 | 0.1070 | 0.0362 | 0.1080 | 0.0812 | 0.1930 | 0.0995 | 0.1006 | 0.0725 | 0.1784 | 0.0894 | 0.1131 | 0.1663 | 0.0882 | 0.0997 |
| FDSA | 0.0951 | 0.0611 | 0.1847 | 0.0804 | 0.0441 | 0.0242 | 0.1263 | 0.0418 | 0.1149 | 0.0843 | 0.1999 | 0.1027 | 0.1046 | 0.0738 | 0.1866 | 0.0916 | 0.1139 | 0.1697 | 0.0883 | 0.1001 |
| UnisRec | 0.1233 | 0.0639 | 0.2361 | 0.0898 | 0.0723 | 0.0327 | 0.1883 | 0.0569 | 0.1258 | 0.0718 | 0.2358 | 0.0956 | 0.1195 | 0.0662 | 0.2252 | 0.0892 | 0.1276 | 0.0822 | 0.2000 | 0.0986 |
| UnisRec | 0.1285 | 0.0695 | 0.2522 | 0.0966 | 0.0758 | 0.0345 | 0.1916 | 0.0595 | 0.1314 | 0.0760 | 0.2442 | 0.1005 | 0.1282 | 0.0711 | 0.2413 | 0.0958 | 0.1296 | 0.0843 | 0.2019 | 0.1001 |
We evaluated our proposed method against baseline models across five real-world datasets, integrating CE loss with our proposed CPS and CPD losses for fine-tuning. The comparative results are detailed in Tab. 2. Across all datasets and baseline methods, our fine-tuning framework achieved an average improvement of 4.551% across all metrics. Notably, the Recall metrics saw the most significant enhancement, aligning with our objective to boost recall by enhancing efficiency while maintaining a certain level of confidence. On the other hand, Our CP loss in the form of sets also contributes to the improvement of NDCG metrics. Furthermore, our fine-tuning framework demonstrated improvements across all datasets and models, underscoring its versatility. Each model, with its distinct training approach—such as SASRec’s use of self-attention for learning item representations, and UnisRec’s fixed item representations with adaptable mapping to new spaces. This versatility confirms the model-agnostic nature of our framework.
5.3. Further Analysis
5.3.1. Ablation Study
| Scientific | Office | |||||||
|---|---|---|---|---|---|---|---|---|
| Loss Config | R@10 | N@10 | R@50 | N@50 | R@10 | N@10 | R@50 | N@50 |
| [CE] | 0.1073 | 0.0555 | 0.2078 | 0.0767 | 0.1159 | 0.0783 | 0.1763 | 0.0915 |
| [CPS] | 0.0309 | 0.0173 | 0.0957 | 0.0309 | 0.0244 | 0.0108 | 0.0657 | 0.0197 |
| [CE,CPS] | 0.1111 | 0.0575 | 0.2135 | 0.0797 | 0.1174 | 0.0790 | 0.1771 | 0.0921 |
| [CPS,CPD] | 0.0336 | 0.0185 | 0.1156 | 0.0359 | 0.0272 | 0.0119 | 0.0775 | 0.0229 |
| [CE,CPS,CPD] | 0.1138 | 0.0577 | 0.2228 | 0.0813 | 0.1182 | 0.0796 | 0.1830 | 0.0928 |
In Table 3, we examine the impact of our proposed losses on overall performance by testing five different fine-tuning loss configurations: (1) [CE] employing only CE loss, (2) [CPS] using solely CPS loss, (3) [CE, CPS] a combination of CE and CPS losses, (4) [CPS, CPD] applying both our proposed losses, and (5) [CE, CPS, CPD] incorporating all three losses for fine-tuning. Given that CPD builds upon the set generated by CPS and serves as its complement, it is not utilized independently during the fine-tuning phase. The analysis reveals that each proposed component contributes positively to enhancing recommendation performance. However, it’s important to note that our losses are not standalone solutions but are designed to work in conjunction with CE loss. While CE directly targets recommendation accuracy, our losses function as regularizers, bolstering prediction confidence.
5.3.2. Validating Confidence Enhancement Effectiveness
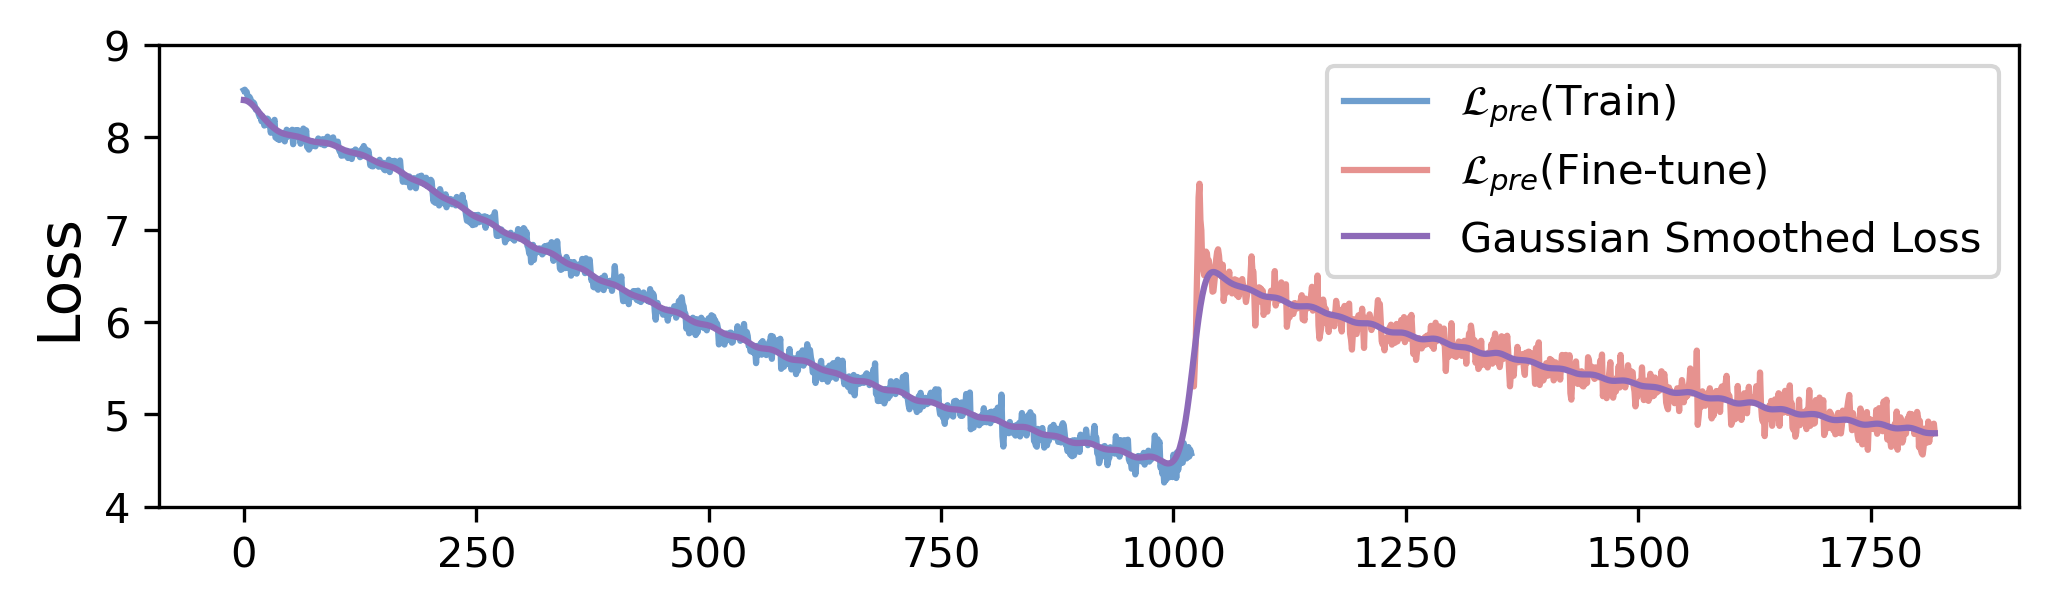
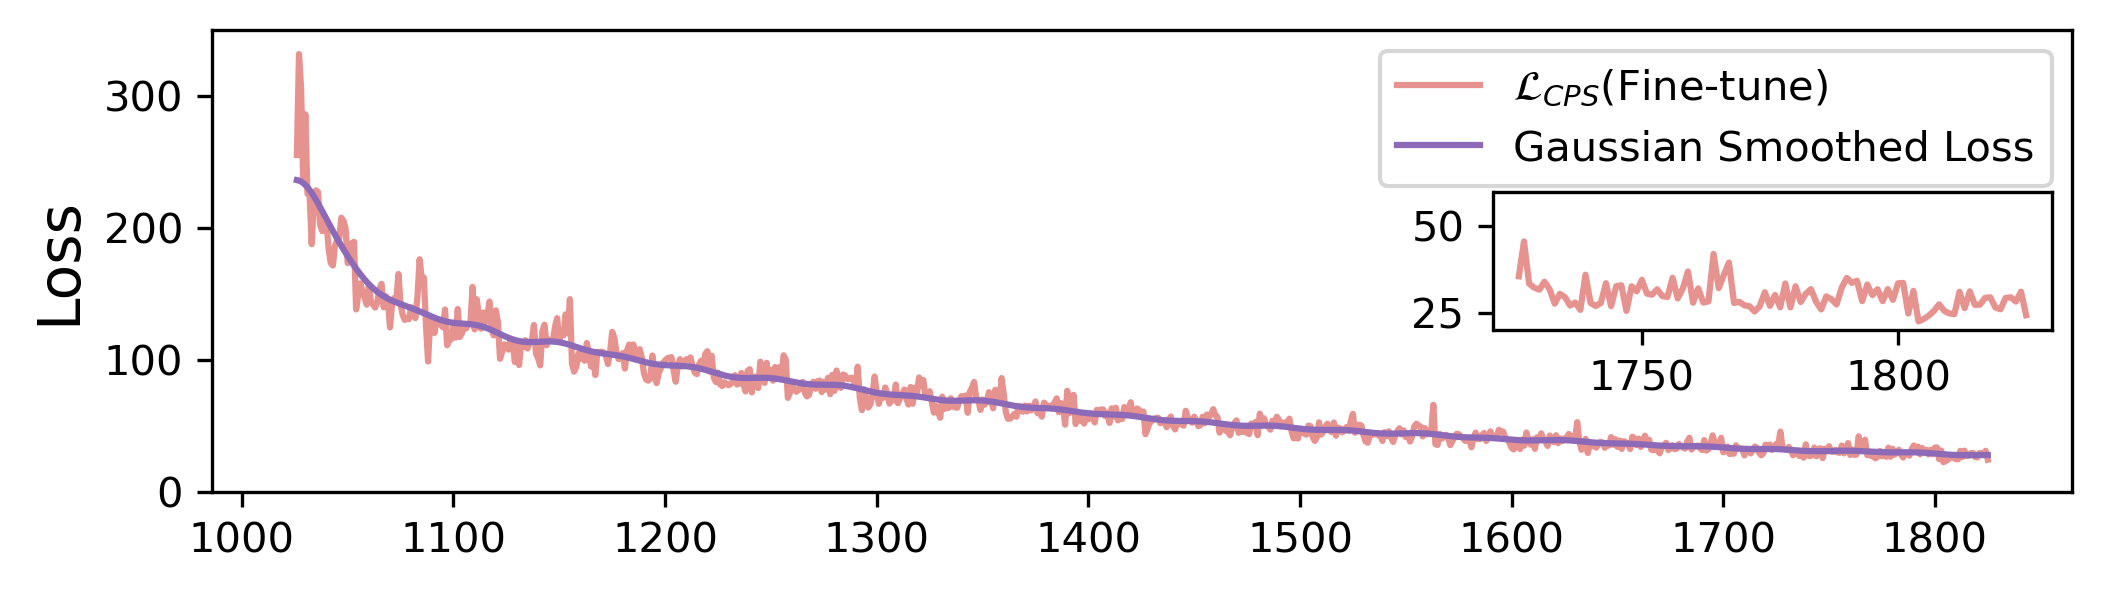
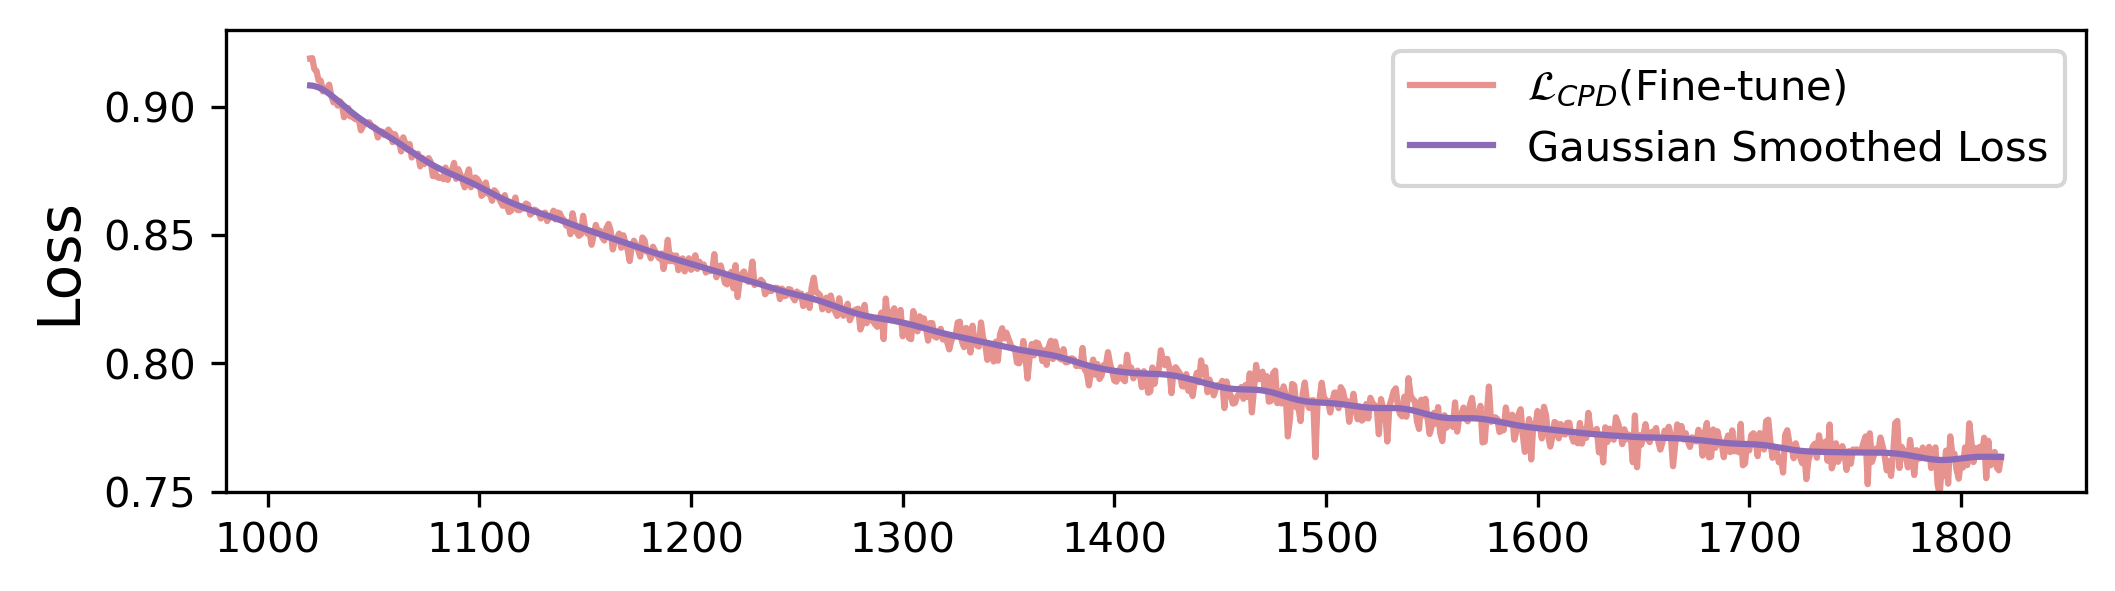
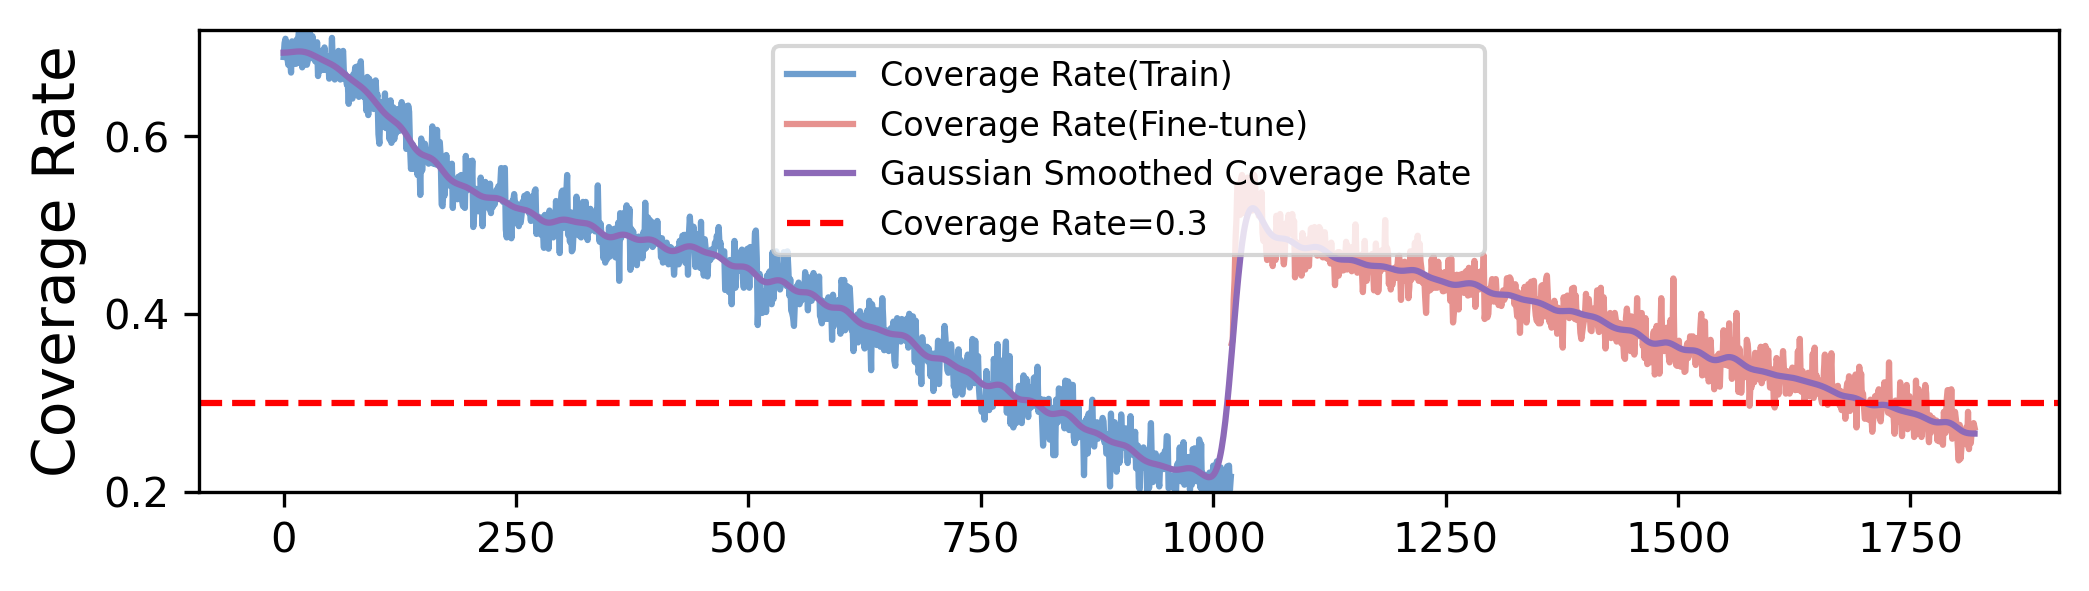
To assess the efficacy of our framework in boosting model confidence, we tracked metrics throughout the training and fine-tuning phases. Figure 3 illustrates the progression of , , , and the coverage rate. Figure 3(b) reveals that the size of the prediction set diminishes from over 300 to approximately 25 during training, indicating a more focused set of predictions. As confidence is normalized, higher confidence levels among top items prevent other items with lower confidence from surpassing the threshold and being included in the prediction set. Therefore, a reduction in prediction set size is associated with the confidence levels of the top items predicted by the model, supported by our case study in Tab. 5. Conventionally, only under the same coverage rate, a smaller set size indicates higher confidence (Angelopoulos and Bates, 2021; Huang et al., 2023a). Interestingly, as shown in Figure 3(d), along with the increased confidence, the coverage rate decreases and converges at around the predefined level. This is because CPS is co-trained with CE, which aims to lift the confidence in predicting training items with ground truth labels, reflected by an increased threshold. Therefore, even with increased confidence, calibration items are compared with a stricter threshold, leading to a decreasing coverage rate. We believe this adapting threshold is beneficial for the overall training in SRecsys, though the exchangeability is not strictly satisfied.
5.3.3. Integrating Validation Data in CPFT
In our CP-based losses fine-tuning approach, we successfully integrate validation data into the training phase without compromising the efficacy of early stopping. This is primarily because the CPS loss operates independently of validation data labels. While the CPD loss does involve calculating the average distance between the ground truth and the top-k nearest neighbors within the prediction set, the selection of the prediction set itself is an unsupervised process. Hence, this indirect utilization of validation ground truth does not lead to model overfitting. The effectiveness of this strategy is further corroborated by our experimental results in Table 2.
5.3.4. Hyper-parameter Sensitivity
| Error Rate | TopKClosest | |||||||
|---|---|---|---|---|---|---|---|---|
| HP | 0.1 | 0.3 | 0.5 | 0.7 | 1 | 10 | 20 | 50 |
| R@10 | 0.1059 | 0.1138 | 0.1097 | 0.1104 | 0.1086 | 0.1138 | 0.1128 | 0.1123 |
| N@10 | 0.0549 | 0.0577 | 0.0552 | 0.0554 | 0.0553 | 0.0577 | 0.0572 | 0.0571 |
| Size Weight | Distance Weight | |||||||
| HP | 0.1 | 1 | 10 | 20 | 0.1 | 1 | 2 | 5 |
| R@10 | 0.1078 | 0.1098 | 0.1138 | 0.1104 | 0.1115 | 0.1138 | 0.1122 | 0.1108 |
| N@10 | 0.0553 | 0.0568 | 0.0577 | 0.0557 | 0.057 | 0.0577 | 0.0576 | 0.0574 |
In Tab. 4, we explore the sensitivity of individual hyper-parameters for CP-based losses using the SASRec model on the Scientific dataset, with key parameters from the main study (Tab. 2) highlighted in bold. Our findings indicate that optimally suits SRecsys tasks. The impact of TopKClosest diminishes for values beyond 20, aligning with typically narrowing the prediction set size to 20-30. For , the size weight significantly influences model performance, whereas , the hyper-parameter for , shows minimal effect.
5.3.5. Case Study
| GT | Herbal Tea, Raspberry Zinger | |||
|---|---|---|---|---|
| CE Train, prediction set size=48 | CP Fine-tune, prediction set size=27 | |||
| Rank | Title | Score | Title | Score |
| No.1 | Herbal Tea | 0.0058 | Herbal Tea | 0.0466 |
| No.2 | Purified Water | 0.0008 | Apple & Eve 100% Juice | 0.0346 |
| No.3 | Pop-Tarts Frosted | 0.0008 | Gatorade Thirst Quencher | 0.0286 |
| No.4 | Hellmann’s Mayonnaise | 0.0007 | San Francisco Bay OneCup | 0.0250 |
| No.5 | Apple & Eve 100% Juice | 0.0006 | Lay’s Kettle Cooked Sea Salt | 0.0219 |
In our case study, we delve into the prediction sets by juxtaposing the top-5 ranked items from CE training with those from CP-based losses fine-tuning, as detailed in Tab. 5. The comparison reveals that while both CE training and CP fine-tuning accurately predict the ground truth as the top-ranked item, the confidence score associated with CP fine-tuning is significantly higher than that of CE training. Furthermore, the prediction set generated by CP fine-tuning is almost half the size of that from CE training, indicating a stronger model confidence in its recommendations. Notably, CP fine-tuning adeptly selects four items closely related to the ground truth, all within the beverage category, demonstrating its relevance-awareness. In contrast, the CE training method selects less related items with lower confidence scores, underscoring the enhanced precision and confidence brought about by CP-based losses fine-tuning.
6. Conclusion
In conclusion, our research presents CPFT, a novel framework that enriches Sequential Recommendation Systems (SRecsys) with Conformal Prediction (CP)-based losses, including CPS and CPD losses, to elevate recommendation accuracy and reliability. This model-agnostic solution seamlessly integrates with traditional Cross-Entropy (CE) loss for effective fine-tuning of existing models, eliminating the need for extra data. Through extensive testing on diverse datasets and SRecsys models, we’ve demonstrated that CP-based losses significantly refine prediction sets and align recommendations with user preferences, boosting model confidence and enhancing recommendation quality.
References
- (1)
- Alvarsson et al. (2021) Jonathan Alvarsson, Staffan Arvidsson McShane, Ulf Norinder, and Ola Spjuth. 2021. Predicting with confidence: using conformal prediction in drug discovery. Journal of Pharmaceutical Sciences 110, 1 (2021), 42–49.
- Angelopoulos and Bates (2021) Anastasios N Angelopoulos and Stephen Bates. 2021. A gentle introduction to conformal prediction and distribution-free uncertainty quantification. arXiv preprint arXiv:2107.07511 (2021).
- Angelopoulos et al. (2020) Anastasios Nikolas Angelopoulos, Stephen Bates, Michael Jordan, and Jitendra Malik. 2020. Uncertainty Sets for Image Classifiers using Conformal Prediction. In International Conference on Learning Representations.
- Angelopoulos et al. (2023) Anastasios N Angelopoulos, Karl Krauth, Stephen Bates, Yixin Wang, and Michael I Jordan. 2023. Recommendation systems with distribution-free reliability guarantees. In Conformal and Probabilistic Prediction with Applications. PMLR, 175–193.
- Azadjalal et al. (2017) Mohammad Mahdi Azadjalal, Parham Moradi, Alireza Abdollahpouri, and Mahdi Jalili. 2017. A trust-aware recommendation method based on Pareto dominance and confidence concepts. Knowledge-Based Systems 116 (2017), 130–143.
- Barber et al. (2023) Rina Foygel Barber, Emmanuel J Candes, Aaditya Ramdas, and Ryan J Tibshirani. 2023. Conformal prediction beyond exchangeability. The Annals of Statistics 51, 2 (2023), 816–845.
- Fisch et al. (2020) Adam Fisch, Tal Schuster, Tommi S Jaakkola, and Regina Barzilay. 2020. Efficient Conformal Prediction via Cascaded Inference with Expanded Admission. In International Conference on Learning Representations.
- Gammerman et al. (1998) Alex Gammerman, Volodya Vovk, and Vladimir Vapnik. 1998. Learning by transduction. Proceedings of the Fourteenth Conference on Uncertainty in Artificial Intelligence (1998).
- Gohari et al. (2018) Faezeh Sadat Gohari, Fereidoon Shams Aliee, and Hassan Haghighi. 2018. A new confidence-based recommendation approach: Combining trust and certainty. Information Sciences 422 (2018), 21–50.
- He and McAuley (2016) Ruining He and Julian McAuley. 2016. Fusing similarity models with markov chains for sparse sequential recommendation. In 2016 IEEE 16th International Conference on Data Mining (ICDM). IEEE, 191–200.
- Hidasi et al. (2015) Balázs Hidasi, Alexandros Karatzoglou, Linas Baltrunas, and Domonkos Tikk. 2015. Session-based recommendations with recurrent neural networks. arXiv preprint arXiv:1511.06939 (2015).
- Hou et al. (2022) Yupeng Hou, Zhankui He, Julian J. McAuley, and Wayne Xin Zhao. 2022. Learning Vector-Quantized Item Representation for Transferable Sequential Recommenders. CoRR abs/2210.12316 (2022). https://doi.org/10.48550/arXiv.2210.12316 arXiv:2210.12316
- Hou et al. ([n. d.]) Yupeng Hou, Shanlei Mu, Wayne Xin Zhao, Yaliang Li, Bolin Ding, and Ji-Rong Wen. [n. d.]. Towards Universal Sequence Representation Learning for Recommender Systems. In KDD ’22: The 28th ACM SIGKDD Conference on Knowledge Discovery and Data Mining.
- Huang et al. (2023b) Jianguo Huang, Huajun Xi, Linjun Zhang, Huaxiu Yao, Yue Qiu, and Hongxin Wei. 2023b. Conformal Prediction for Deep Classifier via Label Ranking. arXiv preprint arXiv:2310.06430 (2023).
- Huang et al. (2023a) Kexin Huang, Ying Jin, Emmanuel Candes, and Jure Leskovec. 2023a. Uncertainty quantification over graph with conformalized graph neural networks. Advances in Neural Information Processing Systems (2023).
- Kang and McAuley (2018) Wang-Cheng Kang and Julian J. McAuley. 2018. Self-Attentive Sequential Recommendation. In IEEE International Conference on Data Mining, ICDM 2018, Singapore, November 17-20, 2018. IEEE Computer Society, 197–206. https://doi.org/10.1109/ICDM.2018.00035
- Liu et al. (2021a) Zhiwei Liu, Yongjun Chen, Jia Li, Philip S Yu, Julian McAuley, and Caiming Xiong. 2021a. Contrastive self-supervised sequential recommendation with robust augmentation. arXiv preprint arXiv:2108.06479 (2021).
- Liu et al. (2021b) Zhiwei Liu, Ziwei Fan, Yu Wang, and Philip S Yu. 2021b. Augmenting sequential recommendation with pseudo-prior items via reversely pre-training transformer. In Proceedings of the 44th international ACM SIGIR conference on Research and development in information retrieval. 1608–1612.
- Ma et al. (2019) Chen Ma, Peng Kang, and Xue Liu. 2019. Hierarchical gating networks for sequential recommendation. In Proceedings of the 25th ACM SIGKDD international conference on knowledge discovery & data mining. 825–833.
- McNee et al. (2003) Sean M McNee, Shyong K Lam, Catherine Guetzlaff, Joseph A Konstan, and John Riedl. 2003. Confidence Displays and Training in Recommender Systems.. In INTERACT, Vol. 3. Citeseer, 176–183.
- Naghiaei et al. (2022) Mohammadmehdi Naghiaei, Hossein A Rahmani, Mohammad Aliannejadi, and Nasim Sonboli. 2022. Towards confidence-aware calibrated recommendation. In Proceedings of the 31st ACM International Conference on Information & Knowledge Management. 4344–4348.
- Papadopoulos et al. (2002) Harris Papadopoulos, Kostas Proedrou, Volodya Vovk, and Alex Gammerman. 2002. Inductive confidence machines for regression. In Machine Learning: ECML 2002: 13th European Conference on Machine Learning Helsinki, Finland, August 19–23, 2002 Proceedings 13. Springer, 345–356.
- Rendle et al. (2010) Steffen Rendle, Christoph Freudenthaler, and Lars Schmidt-Thieme. 2010. Factorizing personalized markov chains for next-basket recommendation. In Proceedings of the 19th international conference on World wide web. 811–820.
- Romano et al. (2020) Yaniv Romano, Matteo Sesia, and Emmanuel Candes. 2020. Classification with valid and adaptive coverage. Advances in Neural Information Processing Systems 33 (2020), 3581–3591.
- Sadinle et al. (2019) Mauricio Sadinle, Jing Lei, and Larry Wasserman. 2019. Least ambiguous set-valued classifiers with bounded error levels. J. Amer. Statist. Assoc. 114, 525 (2019), 223–234.
- Stutz et al. (2021) David Stutz, Krishnamurthy Dj Dvijotham, Ali Taylan Cemgil, and Arnaud Doucet. 2021. Learning Optimal Conformal Classifiers. In International Conference on Learning Representations.
- Sun et al. (2019) Fei Sun, Jun Liu, Jian Wu, Changhua Pei, Xiao Lin, Wenwu Ou, and Peng Jiang. 2019. BERT4Rec: Sequential recommendation with bidirectional encoder representations from transformer. In Proceedings of the 28th ACM international conference on information and knowledge management. 1441–1450.
- Vovk et al. (2005) Vladimir Vovk, Alexander Gammerman, and Glenn Shafer. 2005. Algorithmic learning in a random world. Vol. 29. Springer.
- Wang et al. (2021) Chen Wang, Yueqing Liang, Zhiwei Liu, Tao Zhang, and Philip S. Yu. 2021. Pre-training Graph Neural Network for Cross Domain Recommendation. In Third IEEE International Conference on Cognitive Machine Intelligence, CogMI 2021, Atlanta, GA, USA, December 13-15, 2021. IEEE, 140–145. https://doi.org/10.1109/CogMI52975.2021.00026
- Wang et al. (2023) Fangxin Wang, Lu Cheng, Ruocheng Guo, Kay Liu, and S Yu Philip. 2023. Equal Opportunity of Coverage in Fair Regression. In Thirty-seventh Conference on Neural Information Processing Systems.
- Zhang et al. (2019) Tingting Zhang, Pengpeng Zhao, Yanchi Liu, Victor S Sheng, Jiajie Xu, Deqing Wang, Guanfeng Liu, Xiaofang Zhou, et al. 2019. Feature-level Deeper Self-Attention Network for Sequential Recommendation.. In IJCAI. 4320–4326.
- Zhao et al. (2021) Wayne Xin Zhao, Shanlei Mu, Yupeng Hou, Zihan Lin, Yushuo Chen, Xingyu Pan, Kaiyuan Li, Yujie Lu, Hui Wang, Changxin Tian, Yingqian Min, Zhichao Feng, Xinyan Fan, Xu Chen, Pengfei Wang, Wendi Ji, Yaliang Li, Xiaoling Wang, and Ji-Rong Wen. 2021. RecBole: Towards a Unified, Comprehensive and Efficient Framework for Recommendation Algorithms. In CIKM. ACM, 4653–4664.
- Zhou et al. (2020) Kun Zhou, Hui Wang, Wayne Xin Zhao, Yutao Zhu, Sirui Wang, Fuzheng Zhang, Zhongyuan Wang, and Ji-Rong Wen. 2020. S3-rec: Self-supervised learning for sequential recommendation with mutual information maximization. In Proceedings of the 29th ACM International Conference on Information & Knowledge Management. 1893–1902.
Appendix A Method Details
A.1. Split Conformal Prediction
A classical version of Split Conformal Prediction is detailed with Algorithm 1.