TOP-20-006
TOP-20-006
Differential cross section measurements for the production of top quark pairs and of additional jets using dilepton events from collisions at
Abstract
Differential cross sections for top quark pair (\ttbar) production are measured in proton-proton collisions at a center-of-mass energy of 13 TeV using a sample of events containing two oppositely charged leptons. The data were recorded with the CMS detector at the CERN LHC and correspond to an integrated luminosity of 138 \fbinv. The differential cross sections are measured as functions of kinematic observables of the \ttbarsystem, the top quark and antiquark and their decay products, as well as of the number of additional jets in the event. The results are presented as functions of up to three variables and are corrected to the parton and particle levels. When compared to standard model predictions based on quantum chromodynamics at different levels of accuracy, it is found that the calculations do not always describe the observed data. The deviations are found to be largest for the multi-differential cross sections.
0.1 Introduction
Measurements of top quark pair (\ttbar) production play a crucial role in testing the validity of the standard model (SM) and in searching for new phenomena [1]. The large data set of proton-proton () collisions delivered during Run 2 at the CERN LHC in the years 2016 through 2018 enables precision studies of \ttbardifferential production cross sections as functions of kinematic variables of various objects produced in the events. The differential measurements provide sensitivity to many new physics scenarios for which the \ttbarevent topologies and kinematical distributions are different from those in the SM. The present analysis focuses on events in the \ttbardilepton decay channel, shown in Fig. 1, where both \PWbosons decay into a charged lepton and a neutrino. Kinematic observables of the following objects are studied in the analysis: the \ttbarsystem, the top quark (\PQt) and antiquark (\PAQt), the charged leptons ( and ) and bottom quarks (\PQband \PAQb) produced in the decay chain, and the additional jets in the event. Electrons and muons produced directly in the \PWboson decays are considered as signal, while \PGtleptons are not. The bottom quarks are experimentally accessible through the associated \PQbjets.
In the SM context, the measured cross sections can be used to check predictions of perturbative quantum chromodynamics (pQCD) and electroweak theory. During the last decade, a variety of next-to-next-to-leading order (NNLO) predictions [2, 3, 4, 5, 6, 7] have become available for kinematic observables of the \ttbarsystem, top quark and antiquark, and recently also of the final-state leptons and \PQbjets [8]. The situation is different for \ttbarevents with additional energetic jets in the final state, which, at LHC energies, contribute a large fraction to the total \ttbarcross section. The NNLO corrections are not yet established for these high multiplicity radiative processes; nevertheless, a comparison of the available pQCD models to data provides an important benchmark test.

Differential cross sections for \ttbarproduction have been measured previously in collisions at the LHC at [9, 10, 11, 12, 13], 8\TeV [13, 14, 15, 16, 17, 18, 19, 20], and 13\TeV [21, 22, 23, 24, 25, 26, 27, 28, 29, 30, 31], in the channels with either both, one, or neither of the \PWbosons emitted in the decays of \PQtand \PAQtdecaying leptonically. The nominal predictions of modern pQCD calculations generally fail to describe several kinematic distributions. For instance, most theoretical models predict a spectrum for the transverse momentum \ptof the top quark, that is harder than observed [26, 25].
We present measurements of differential \ttbarcross sections in collisions at using data taken with the CMS detector during the Run-2 operation of the LHC. The analysis is based on an integrated luminosity of 138 \fbinv, where 36.3 \fbinvwere recorded in 2016, 41.5 \fbinvin 2017, and 59.7 \fbinvin 2018. The dilepton decay channel has a relatively small branching fraction and significantly lower background compared to other \ttbardecay channels. As a consequence of the excellent lepton energy resolution, the precise measurement of kinematic observables based on lepton pairs is unique to the dilepton channel. However, because of the presence of two neutrinos in the final state, the measurement of top quark kinematic observables in the dilepton channel requires specialized kinematic reconstruction techniques.
The analysis follows the procedures and strategies of Refs. [26, 27] for which only the 2016 data were used. All measurements are compared to predictions from Monte Carlo (MC) generators with next-to-leading order (NLO) accuracy in QCD at the matrix element level interfaced to parton shower simulations. Selected cross section measurements are also compared to a variety of predictions with precision beyond NLO.
The distributions studied in this paper are of basic kinematic observables including the \pt, and pseudorapidities or rapidities of single objects, \eg and , or of compound systems, \eg and . Distributions of invariant masses of compound objects are also investigated, \eg, as well as the azimuthal or rapidity differences between two objects, \eg, , and , where is the azimuthal angle in radians. Cross sections are measured at the particle level in a fiducial phase space that is close to that of the detector acceptance. In addition, we extract cross sections for kinematic observables of the top quark and antiquark and the \ttbarsystem defined at the parton level in the full phase space, which allows a comparison to a larger set of higher-order pQCD calculations. Both absolute and normalized differential cross sections are presented. The latter are obtained by dividing the former by the sum of the cross sections measured in the differential bins, leading to a reduction of systematic uncertainties. Cross sections are measured as functions of one kinematic variable (single-differential), or multi-differentially as functions of two or three variables (double- or triple-differential). The improvements of this analysis compared to Refs. [26, 27] fall into two categories:
-
1.
Measurements are expanded by considering new kinematic observables, using refined binnings and extending the phase space range. An example of a new kinematic observable is the ratio , revealing interesting details of the \ttbarproduction dynamics. A finer binning and extended phase space range is used, in particular for the kinematic distributions of leptons and \PQbjets. For measurements with additional jets in the events, a systematic survey of the correlations of the top quark and \ttbarkinematic variables with the number of additional jets in the events is performed in the dilepton channel for the first time.
-
2.
The statistical and systematic uncertainties of the measurements are generally reduced by a factor of about two, the latter profiting from the following improvements: using refined procedures and algorithms, such as for identifying \PQbjets and measuring their \pt; applying precise calibrations determined separately for each year of data taking, such as for the jet energy scale; having better estimates for some important background process contributions using in situ constraints from data; exploiting MC simulated samples with reduced statistical uncertainties to correct the data for detector effects and for assessing systematic uncertainties.
The paper is structured as follows: Section 0.2 provides a brief description of the CMS detector. Details of the event simulation are given in Section 0.3. The event selection is detailed in Section 0.4, followed by a description of the kinematic reconstruction in Section 0.5 where comparisons between data and simulations are shown. The signal extraction and unfolding procedure are explained in Section 0.6, together with the definitions of the parton and particle level phase spaces. The method to extract the differential cross sections is discussed in Section 0.7, and the assessment of the systematic uncertainties is presented in Section 0.8. Results and comparisons to theoretical predictions are shown in Section 0.9. Finally, Section 0.10 provides a summary. Tabulated results can be found in HEPData [32].
0.2 The CMS detector
The central feature of the CMS apparatus is a superconducting solenoid of 6\unitm internal diameter, providing a magnetic field of 3.8\unitT. Within the solenoid volume are a silicon pixel and strip tracker, a lead tungstate crystal electromagnetic calorimeter (ECAL), and a brass and scintillator hadron calorimeter (HCAL), each composed of a barrel and two endcap sections. Forward calorimeters extend the coverage provided by the barrel and endcap detectors. Muons are measured in gas-ionization detectors embedded in the steel flux-return yoke outside the solenoid. Events of interest are selected using a two-tiered trigger system [33]. The first level (L1), composed of custom hardware processors, uses information from the calorimeters and muon detectors to select events at a rate of around 100\unitkHz within a time interval of less than 4\mus. The second level, known as the high-level trigger (HLT), consists of a farm of processors running a version of the full event reconstruction software optimized for fast processing, and reduces the event rate to around 1\unitkHz before data storage. A more detailed description of the CMS detector, together with a definition of the coordinate system used and the relevant kinematic variables, can be found in Ref. [34].
0.3 Event simulation
Simulations of physics processes are performed with MC event generators for three main purposes. First, to obtain representative predictions of \ttbarproduction cross sections to be compared to the measurements. Second, to determine corrections for the effects of hadronization, reconstruction, and selection efficiencies, as well as resolutions. These corrections are obtained by passing generated \ttbarsignal events through a detector simulation, and are applied for the unfolding of the data. Last, to obtain predictions for the backgrounds by passing generated background events through the detector simulation. All MC programs used in this analysis perform the event generation in several stages: matrix element (ME) level, parton showering matched to ME, hadronization, and the underlying event (UE), including multi-parton interactions (MPIs). For all simulations, the proton structure is described by the NNPDF3.1 NNLO set [35, 36] of parton distribution functions (PDFs), unless stated otherwise. For all simulations with top quark production, the value of the top quark mass parameter is fixed to . The \ttbarsignal process is simulated with ME calculations at NLO in QCD. For the nominal signal simulation, the \POWHEG(version 2) [37, 38, 39, 40] generator is taken. The parameter of \POWHEG, which regulates the damping of real emissions in the NLO calculation when matching to the parton shower, is set to [41]. The \PYTHIAprogram (version 8.230) [42] with the CP5 tune [41] is used to model parton showering, hadronization, and the UE. This setup, referred to as \POWHEG+\PYTHIA8, is used for the detector corrections of the \ttbarsignal process in the data, with appropriate variations for assessing the theoretical model uncertainties, described in Section 0.8.2. The generator-level cross sections of \POWHEG+\PYTHIA8 are also used as theoretical predictions that are compared in Section 0.9 to the measured \ttbarcross sections, as well as the predictions from two other models. The first alternative model is based on the \MGvATNLO(version 2.4.2) [43] generator, interfaced with \PYTHIAusing the CP5 tune. At the ME level, up to two extra partons are included at NLO. The events are matched to \PYTHIAusing the FxFx prescription [44], and MadSpin [45] is used to model the decays of the top quarks, while preserving their spin correlation. The whole setup is referred to as MG5_amc@nlo[FxFx]+\PYTHIA8. The second alternative model is \POWHEGinterfaced to \HERWIG7 [46] using the CH3 tune [47] and is referred to as \POWHEG+\HERWIG7.
The main background contributions originate from single top quarks produced in association with a \PW boson (), bosons produced with additional jets (), \PW boson production with additional jets (), and diboson (, , and ) events. Other backgrounds are negligible.
For all background samples, parton showering, hadronization, and the UE are simulated with \PYTHIA. For single top quark production, the -channel and processes are simulated at NLO with \POWHEG [48, 49, 50], and the -channel process at LO with \MGvATNLO. In all three cases the \PYTHIA8 CP5 tune is used. For all other background samples discussed in the following, the CP5 tune is applied for the 2017 and 2018 samples, and the CUETP8M1 tune [51, 52, 53] for the 2016 samples. For the latter, the PDF set NNPDF3.0 [54] is used with the order (\egNLO) of the respective simulation. The process is simulated at NLO using MG5_amc@nlo[FxFx]with up to two additional partons at the ME level. The process is simulated at leading order (LO) using \MGvATNLOwith up to four additional partons at the ME level and matched to \PYTHIAusing the MLM prescription [55, 56]. Diboson events are simulated at LO with \PYTHIA.
Predictions are normalized based on their inclusive theoretical cross sections and the integrated luminosity of the data sample. For - and -channel single top quark production, the cross sections are calculated at NLO with Hathor (version 2.1) [57]. For single top quark production in the channel, the approximate NNLO calculations from Ref. [58] are used. For and processes, NNLO predictions obtained with \FEWZ [59] are taken, and for diboson production the NLO calculations from Ref. [60] are applied. The \ttbarsimulation is normalized to a cross section of calculated with the \TOPpp(version 2.0) program [61] at NNLO, including resummation of next-to-next-to-leading logarithm (NNLL) soft-gluon terms [62, 63, 64, 65, 66, 67], and assuming a top quark pole mass of 172.5\GeV.
The CMS detector response is simulated using \GEANTfour [68]. The effect of additional interactions within the same or nearby bunch crossings (pileup) is taken into account by adding simulated minimum-bias interactions to the simulated data. Events in the simulation are then weighted to reproduce the pileup distribution in the data, which is estimated from the measured bunch-to-bunch instantaneous luminosity and assuming a total inelastic cross section of 69.2\unitmb [69]. Separate simulations are employed for the data taken in the three years 2016–2018, in order to match the varying detector performance and data-taking conditions. At every step of the analysis, the simulated samples from different years are added together and used as one single sample, both at the detector and the generator levels.
Correction factors described in Sections 0.6 and 0.8, subsequently referred to as scale factors, are used to reconcile the number of expected events from simulation with what is observed in data. They are applied, for example, to correct a detector efficiency in the simulation to match the one observed in data, or to scale a background prediction.
0.4 Event selection
The event selection closely follows that of Ref. [26]. Events are selected corresponding to the decay chain where both top quarks decay into a \PW boson and a bottom quark, and each of the \PW bosons decays directly into an electron or a muon and a neutrino. This specification defines the signal process, while all other \ttbarevents, including those with at least one electron or muon originating from the decay of a \PGtlepton, are treated as background which is taken into account, as detailed in Section 0.6. The signal includes three distinct channels: two same-flavor channels corresponding to two electrons () or two muons (), and the different-flavor channel corresponding to one electron and one muon (). Results are obtained by combining the three channels and adding, at every step of the analysis, the samples from the years 2016–2018.
At the HLT level, events are selected either by single-lepton or dilepton triggers. The former require the presence of at least one electron or muon, and the latter the presence of either two electrons, two muons, or an electron and a muon. For all employed triggers, the leptons are required to fulfill isolation criteria that are looser than those applied later in the offline analysis. For the single-electron triggers, a \ptthreshold of 27 (32)\GeVis applied in 2016 (2017–2018), while for single-muon triggers the \ptthreshold is 24 (27)\GeVin 2016/2018 (2017). The dilepton triggers select events based on the leptons with the highest (leading) and second-highest (trailing) \ptin the event. The same-flavor dilepton triggers require either an electron pair with (12)\GeVfor the leading (trailing) electron or a muon pair with (8)\GeVfor the leading (trailing) muon. The different-flavor dilepton triggers require either an electron with \GeVand a muon with \GeV, or a muon with \GeVand an electron with \GeV. The analysis mainly relies on the dilepton triggers, while the single-lepton triggers help to improve the overall trigger efficiency by about 10%.
The particle-flow (PF) algorithm [70] aims to reconstruct and identify each individual particle with an optimized combination of information from the various elements of the CMS detector. The energy of muons is obtained from the curvature of the corresponding track. The energy of electrons is inferred from a combination of the electron momentum at the primary interaction vertex as determined by the tracker, the energy of the corresponding ECAL cluster, and the energy sum of all bremsstrahlung photons spatially compatible with originating from the electron track. The energy of photons is directly obtained from the ECAL measurement. The energy of charged hadrons is determined from a combination of their momentum measured in the tracker and the matching ECAL and HCAL energy deposits, corrected for the response function of the calorimeters to hadronic showers. Finally, the energy of neutral hadrons is obtained from the corresponding corrected ECAL and HCAL energies.
The measurements presented in this paper depend on the reconstruction and identification of electrons, muons, jets, and missing transverse momentum \ptvecmissassociated with neutrinos. Electrons and muons are selected if they are compatible with originating from the primary interaction vertex. The primary vertex (PV) is taken to be the vertex corresponding to the hardest scattering in the event, evaluated using tracking information alone, as described in Section 9.4.1 of Ref. [71].
For both electrons and muons, the “tight” identification criteria as described in Refs. [72, 73] are applied. Reconstructed electrons [72] are required to have (20)\GeVfor the leading (trailing) candidate and . Electron candidates with ECAL clusters in the transition region between the ECAL barrel and endcap, , are excluded since the reconstruction of an electron object in this region is not optimal. A relative isolation is defined as the \ptsum of all neutral and charged hadrons, and photon candidates within a distance of 0.3 from the electron in - space, divided by the \ptof the electron candidate. A maximum value of is allowed, in the range 0.05–0.10, depending on the \ptand of the electron candidate. Further electron identification requirements are applied to reject misidentified electron candidates and candidates originating from photon conversions. Reconstructed muons [73] are required to have (20)\GeVfor the leading (trailing) candidate and . An isolation requirement of is applied, including particles within a distance of 0.4 in - space from the muon candidate. Furthermore, muon identification requirements are applied to reject misidentified muon candidates and muons originating from in-flight decays. For both electron and muon candidates, is corrected for residual pileup effects. Finally, for the targeted prompt leptons in the \ttbardilepton decay channel, the total selection efficiencies are about 90% for muons and 70% for electrons.
Jets are reconstructed by clustering the PF candidates using the anti-\ktjet algorithm [74, 75] with a distance parameter of 0.4. The jet energies are corrected following the procedures described in Ref. [76]. After correcting for all residual energy deposits from charged and neutral particles from pileup, \pt- and -dependent jet energy adjustments are applied to correct for the detector response. Jets are required to have and and a distance in - space of at least 0.4 to the closest selected lepton.
The \PQbjets are identified with the deep neural network algorithm DeepCSV [77], based on tracking and secondary vertex information. The chosen working point of the network discriminator has a \PQb-jet tagging efficiency of –90% and a mistagging efficiency of for jets originating from gluons, as well as \PQu, \PQd, or \PQsquarks, and –40% for jets originating from \PQc quarks. The energy measurement of the \PQb-tagged jets is improved using a deep neural network estimator [78] that performs a regression after all other jet energy corrections have been applied.
The \ptvecmissis computed as the negative vector sum of the transverse momenta of all the PF candidates in an event, and its magnitude is denoted as \ptmiss [79]. The \ptvecmissis updated when accounting for corrections to the energy scale of reconstructed jets in the event. The pileup per particle identification algorithm [80] is applied to reduce the pileup dependence of the \ptvecmissobservable. The \ptvecmissis computed from the PF candidates weighted by their probability to originate from the primary interaction vertex [79].
Events are selected offline if they contain exactly two isolated, oppositely charged electrons or muons, (, , ) and at least two jets, with at least one of these jets being \PQb tagged. Events with an invariant mass of the lepton pair below 20\GeVare removed in order to suppress contributions from resonance decays and low-mass Drell–Yan processes. Backgrounds from processes in the and channels are further reduced by requiring or , and .
In this analysis, the \ttbarproduction cross section is also measured as a function of the extra jet multiplicity . Extra jets (also referred to as additional jets) are jets arising primarily from hard QCD radiation and not from the top quark decays. At the reconstruction level, the extra jets are defined in dilepton \ttbarcandidate events as jets with and that are isolated from the leptons and from the \PQb jets originating from the top quark decays. The extra jet is considered isolated when having a distance to the leptons in - space of at least 0.4, and a distance to each \PQb jet of at least 0.8. The requirements on \ptand isolation of extra jets largely eliminate the expected contributions from gluons radiated off \PQbquarks produced in the top quark decays.
0.5 Kinematic reconstruction of the \ttbar system
The four-momenta of the top quark and antiquark are determined from the four-momenta of their decay products using a kinematic reconstruction method referred to as the “full kinematic reconstruction” [14]. In this reconstruction, the two pairs consisting of a lepton and a \PQbjet from the decay are identified, and the top quark (antiquark) is associated with the pair containing the lepton with positive (negative) charge. The three-momenta of the neutrino () and antineutrino () are reconstructed using algebraic equations deduced from the following six kinematic constraints: the conservation of the total \ptin the event, and the masses of the \PW bosons and of the top quark and antiquark. The mass values used in the constraints are 172.5\GeVfor the top quark and antiquark, and 80.4\GeVfor the \PW bosons. The \ptvecmissin the event is assumed to originate solely from the two neutrinos. An ambiguity can arise due to multiple algebraic solutions of the constraint equations for the neutrino momenta, which is resolved by taking the solution with the smallest invariant mass of the \ttbarsystem [81]. The reconstruction is performed 100 times. Each time, the measured energies and directions of the reconstructed leptons and jets are randomly smeared in accordance with their resolutions. This procedure recovers events that initially yield no solution because of measurement fluctuations. The three-momenta of the two neutrinos are determined as a weighted average over all smeared solutions. For each solution, the weight is calculated based on the expected true spectrum of the invariant mass of the lepton and the \PQbjet originating from the decay of a top quark and taking the product of the two weights for the top quark and antiquark decay chains. All possible lepton-jet combinations in the event that satisfy the requirement are considered. Combinations are ranked based on the presence of \PQb-tagged jets in the assignments, \iea combination with both leptons assigned to \PQb-tagged jets is preferred over those with one or no \PQb-tagged jet. Among assignments with an equal number of \PQb-tagged jets, the one with the highest sum of weights is taken. Events with no solution after smearing are rejected. The efficiency of the full kinematic reconstruction is defined as the number of events for which a solution is found divided by the total number of selected \ttbarevents after the full event selection described in Section 0.4. Consistent results are observed in data and simulation. The efficiency for signal events is about 90%. After applying the complete event selection and the full kinematic reconstruction, about 1.2 million events are observed, with shares of 56, 14, and 30% for the , , and channels, respectively. Combining all decay channels, the estimated signal fraction in data is about 80%.
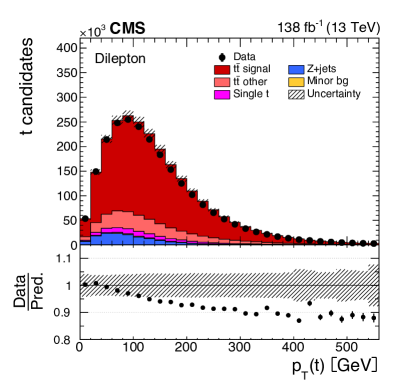
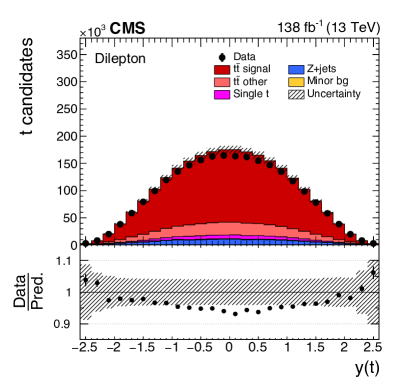
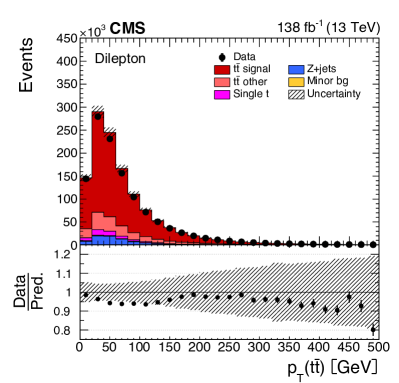
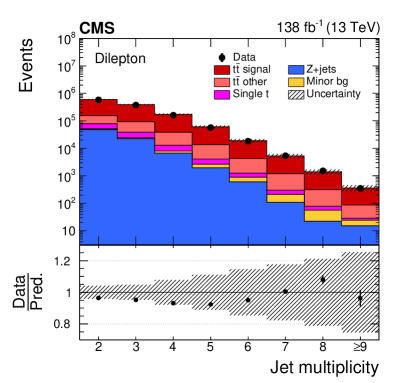
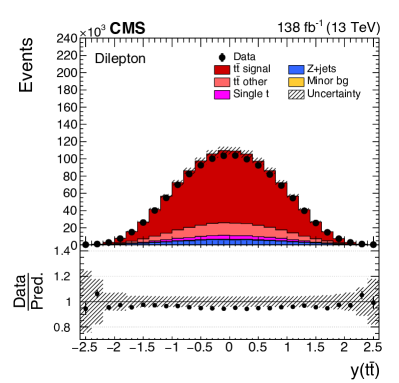
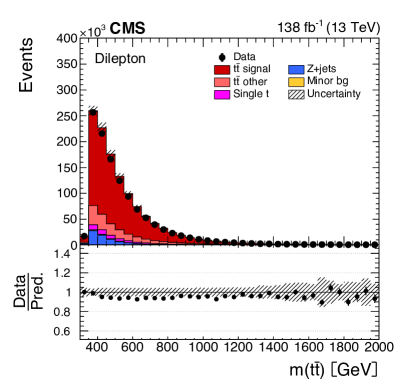
Distributions of the reconstructed top quark and \ttbarkinematic variables, obtained with the full kinematic reconstruction, are shown in Fig. 2 and the upper plots in Fig. 3. Furthermore, the multiplicity of jets in the events is presented in Fig. 2. The and spectra include contributions from both the top quark and antiquark. The expected signal and background contributions are estimated as described in Section 0.6, using the MC simulations for the various processes introduced in Section 0.3. The expected events labeled as “Minor bg” constitute minor background contributions from diboson and processes. In general, the data are reasonably well described by the simulation that overestimates, however, the total number of events by about 5%. Some trends are visible, in particular for , where the simulation predicts a somewhat harder spectrum than that observed in data, as seen in previous differential \ttbarcross section measurements [14, 17, 19, 21, 25, 24, 26].
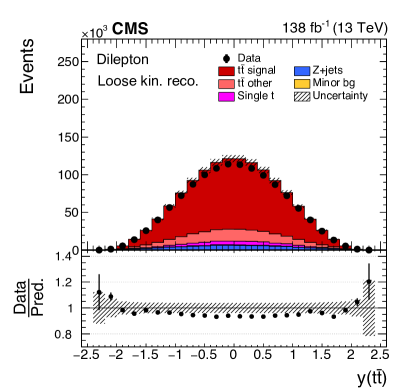
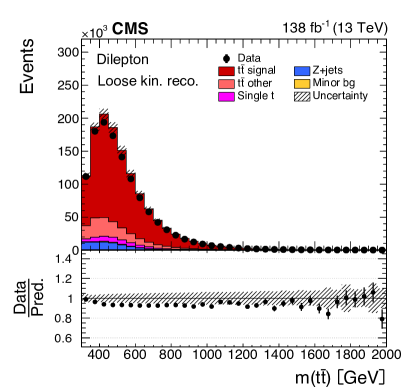
The value obtained using the full kinematic reconstruction described above is sensitive to the value of the top quark mass used as a kinematic constraint. An alternative algorithm is employed that reconstructs the \ttbarkinematic variables without using the top quark mass constraint. This algorithm is referred to as the “loose kinematic reconstruction”. It is used in this analysis for measuring differential \ttbarcross sections as a function of , in order to preserve the sensitivity of the data for a future top quark mass extraction, as performed in Ref. [27]. In contrast to the full kinematic reconstruction, this algorithm tackles the reconstruction of the system as a whole. The \PQbpairs are selected and ranked as described for the full kinematic reconstruction. Among combinations with equal number of \PQb-tagged jets, the ones with the leading and trailing \ptjets are chosen. The kinematic variables of the system are obtained as follows: its \ptvecis set equal to \ptvecmissand its unknown longitudinal momentum and energy are set equal to the values of the lepton pair. Additional constraints are applied on the invariant mass of the neutrino pair, , and on the invariant mass of the \PW bosons, . These constraints have only minor impact on the performance of the reconstruction. This method yields \ttbarkinematic resolutions and reconstruction efficiency similar to those of the full kinematic reconstruction. As in the case of the full kinematic reconstruction, events with no valid solution for the loose kinematic reconstruction are excluded from further analysis. The presence of a solution for the full kinematic reconstruction in an event is also required for the cross section measurements as functions of lepton and \PQbjet kinematic variables discussed in Section 0.9.2. Figure 3 (lower row) displays the distributions of the reconstructed \ttbarinvariant mass and rapidity using the loose kinematic reconstruction. These distributions are similar to the ones obtained with the full kinematic reconstruction, shown in the upper row, except for in the threshold region that is smeared out due the omission of the top quark mass constraint.
The loose kinematic reconstruction is used for a subset of measurements presented in Section 0.9, namely, for single-differential cross sections as functions of , and for all multi-differential cross sections composed of combinations of with , , or . For all other cross sections as functions of kinematic observables of the \ttbarsystem or of the top quark and antiquark, the full kinematic reconstruction is used.
0.6 Signal extraction and unfolding
The number of signal events is obtained for each histogram bin by subtracting the expected number of background events from the observed number of events.
The expected background contribution from single top quark, , and diboson processes are taken directly from the MC simulations. The contribution is also estimated from the MC simulation, but corrected by global normalization scale factors, which are determined from a binned template fit to the data, using the method described in Ref. [82], as implemented in the TFractionFitter class in ROOT [83]. In this procedure, the event fraction of process and of the sum of all other contributions are fitted to the distributions in the data, within the \PZboson peak signal region . The template distributions are obtained from the MC-simulated samples. Separate normalization scale factors are fitted for the simulations of the process in the and channels and the scale factor for the channel is calculated as the geometric mean of these factors. The nominal scale factors are determined for a data selection with relaxed requirements, omitting those on \ptmiss, the number of \PQb-tagged jets, and the presence of a solution for the kinematic reconstruction, in order to have a clean sample of events. The scale factors are compatible, within a few percent, with unity. The window chosen for the fits ensures that there is no overlap with the sample used for the analysis and is still large enough to provide a good separation of from the other processes. As a cross-check, the template fits are performed over a wider range, starting at 20\GeVand extending to values much above the \PZboson peak signal region, and only small scale factor variations are observed of the order of one percent.
After the subtraction of non-\ttbarbackgrounds, the resulting event yields are corrected for the contributions from \ttbarfinal states other than the signal, dominated by events with one or both of the \PW bosons decaying into \PGtleptons with subsequent decay into electrons or muons. These events arise from the same \ttbarproduction process as the signal and thus the normalization of this background is fixed to that of the signal. For each bin, the number of events obtained after the subtraction of all other background sources is multiplied by the ratio of the number of selected \ttbarsignal events to the total number of selected \ttbarevents (\iethe signal and all other \ttbarevents) in simulation.
The numbers of signal events are obtained by adding together the event yields in the , , and channels, subtracting the background, and correcting for detector effects using the TUnfold package [84]. The addition of the three channels before applying detector corrections is justified by the fact that background levels are small in all channels and kinematic resolutions are comparable. The measurements in the separate channels yield consistent results.
In the unfolding procedure the response matrix plays an important role. An element of this matrix specifies the probability for an event originating from one bin of the true distribution to be observed in a specific bin of the reconstructed observables. The response matrix models the effects of acceptance, detector efficiencies, and resolutions in a given phase space. It is calculated for each measured distribution using the \ttbarsignal simulation, and is defined either at the particle level in a fiducial phase space or at the parton level in the full phase space, using the corresponding generator-level definitions discussed in Section 0.6.1. At the detector level, the number of bins used per kinematic variable is typically two times larger than the number of bins used at the generator level. In TUnfold, the distribution of unfolded event numbers is extracted from the measured distribution at the detector level by performing a fit. An additional term is included representing Tikhonov regularization [85], based on second-order derivatives and using the nominal \ttbarsimulation as the bias vector. The regularization reduces unphysically large high-frequency components of the unfolded spectrum. The regularization strength that minimizes the global correlation coefficient [86] is chosen.
0.6.1 Generator-level definitions
The definitions of the generator level that are used in the construction of the response matrices follow, to a large extent, those applied in Refs. [26, 27, 87].
For the parton-level results, the momenta of the parton-level top quarks are defined after QCD radiation, but before the top quark decays. The unfolded signal event numbers are corrected for the branching fractions . The parton-level results are extrapolated to the full phase space using the default \ttbarsimulation. The extrapolation is implicitly performed by counting each simulated event in the response matrix that enters a specific parton-level bin of a differential cross section.
For the particle-level results, the generator-level objects are defined by the stable particles (\iethose with lifetime s) in the simulation. The selection of these objects is intended to match as closely as possible the detector-level requirements used to select \ttbarevents. It is described together with the generator-level top quark kinematic reconstruction procedure in Refs. [26, 87], and is summarized below.
-
•
All simulated electrons and muons, including those from \PGtlepton decays, but not originating from the decay of a hadron, are corrected (“dressed”) for bremsstrahlung effects by adding the momentum of a photon to that of the closest lepton if their separation in - space is . Leptons are required to have and .
-
•
Only neutrinos originating from nonhadronic decays (\ieprompt neutrinos) are used.
-
•
Jets are clustered using the anti-\ktjet algorithm [74, 75] with a distance parameter of 0.4. All stable particles, with the exception of the dressed leptons and prompt neutrinos, are clustered. Jets with and are selected if there is no electron or muon, as defined above, within a distance of 0.4 in - space.
-
•
jets are defined as those jets that contain a hadron using the ghost-matching technique [88]: as a result of the short lifetime of hadrons, only their decay products are considered for the jet clustering. However, to allow their association with a jet, the hadrons are also included with their momenta scaled down to a negligible value. This preserves the information of their directions, but removes their impact on the jet clustering.
-
•
The following additional event-level requirements are applied to define the fiducial phase space region in which the particle-level cross sections are measured: we require that the \PWbosons produced from decays of the top quark and antiquark in a \ttbarevent themselves decay to an electron or a muon; we reject events where these \PWbosons decay to \PGtleptons; we require exactly two selected lepton candidates with opposite charges, , and at least two \PQbjets.
-
•
The top quark reconstruction at the particle level proceeds as follows. Prompt neutrinos are combined with the dressed leptons to form \PWboson candidates. We take the permutation of neutrinos and leptons that minimizes the sum of the absolute values of the differences between the mass of each neutrino-lepton pair and the nominal \PWboson mass of 80.4\GeV. Subsequently, the \PWboson candidates are combined with \PQbjets to form particle-level top quark candidates by minimizing the sum of the absolute values of the differences between the mass of each pair and the nominal top quark mass of 172.5\GeV.
Due to the finite detector resolution, events that are outside the fiducial phase space region at the generator level can be measured inside the accepted region at the detector level. These events are subtracted, before the unfolding, by a fractional correction of the observed number of events after subtracting all other backgrounds. The correction, performed separately for each detector-level bin, is defined as the number of events in the \ttbarsignal simulation that pass both the detector- and particle-level selection criteria, divided by the number of all events fulfilling the detector-level requirements.
When measuring the differential cross sections as functions of (see Section 0.9.3), the top quark and antiquark are measured either at the parton level in the full phase space or at the particle level in a fiducial phase space, as described above, while the additional jets are measured at the particle level only. The definition of these extra jets differs slightly from the one given above: they have to be isolated from the charged leptons (\Peor \PGm) and \PQbquarks originating from the top quark decays, as represented by the corresponding particle level leptons and \PQbjets, with a minimal distance to these leptons (\PQbquarks) of 0.4 (0.8) in - space. The larger distance to the \PQbquarks is required to avoid selecting jets coming from gluon radiation from the \PQbquarks as additional jets. In addition, the additional jets are required to have and . Specifically for the measurements of the top quark and antiquark at the parton level, two more differences in the definition of the extra jets are introduced [27]. The neutrinos from decays of hadrons are excluded in the clustering of these jets, and the charged leptons and \PQbquarks used in the jet isolation are taken directly after the \PWboson and top quark decays, respectively.
0.7 Cross section measurement
For a given variable , the absolute differential \ttbarcross section is extracted via the relation
| (1) |
where \lumiis the integrated luminosity, is the number of unfolded signal events observed in bin , and is the bin width. The numbers are calculated with respect to the \ttbarparton or particle generator levels defined in Section 0.6.1. The normalized differential cross section is obtained by dividing the absolute differential cross section by the measured total cross section in the same phase space, which is evaluated by summing the binned cross section measurements over all bins of the observable . For differential cross sections measured simultaneously as functions of two or three variables, the following criteria are adopted for optimizing their display. The measured cross sections are divided by the bin width of the variable that is chosen as the last one. They present single-differential cross sections as functions of the last variable in different ranges of the first, or first and second variables, and are referred to as double- or triple-differential cross sections, respectively.
The bin widths are chosen based on the resolutions of the kinematic variables, such that the purity and the stability of each bin are generally above 30% for single-differential cross sections and above 20% for double- or triple-differential cross sections. For a given bin, the purity is defined as the fraction of events in the \ttbarsignal simulation that are generated and reconstructed in the same bin with respect to the total number of events reconstructed in that bin. To evaluate the stability, the number of events in the \ttbarsignal simulation that are generated and reconstructed in a given bin are divided by the total number of reconstructed events generated in the bin.
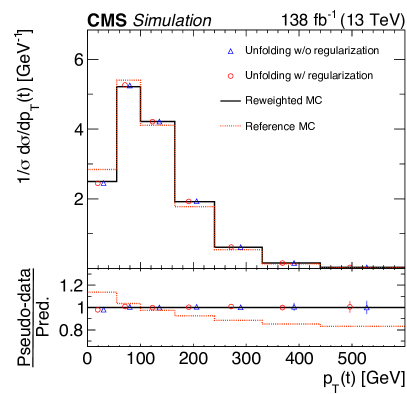
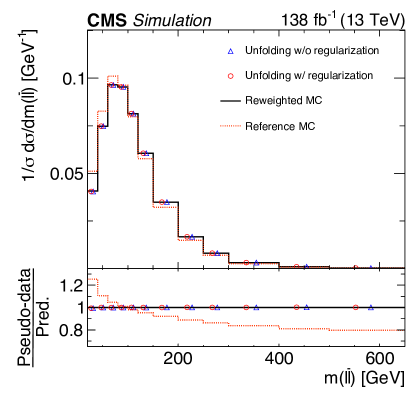
The cross section measurement based on the signal extraction and unfolding procedure described in Section 0.6 is validated with closure tests. Large numbers ( 1000) of pseudo-data sets are generated from the \ttbarsignal MC simulations and analyzed as if they were real data. The unfolded differential cross sections are found to be unbiased and to provide proper 68% confidence intervals within estimated standard deviation uncertainties. A second test is performed by unfolding pseudo-data sets, generated using reweighted \ttbarsignal simulations, with the response matrix and bias vector taken from the nominal simulation. The reweighting is performed as a function of the differential cross section kinematic observables at the generator level and is used to introduce controlled shape variations, \eg, making the spectrum harder or softer. This test probes the robustness of the unfolding procedure with respect to the underlying physics model in the simulation, which impacts both the response matrix and the regularization bias vector. Figure 4 shows two examples of these tests, performed for cross sections as functions of and . The applied reweightings follow approximately parabolic functions and lead to shape distortions of about at thresholds and end points of the kinematic spectra, comprising the differences observed between data and the nominal simulation (as shown by figures in Section 0.9). The unfolding is performed with the standard regularization procedure and alternatively with switching it off; the obtained cross sections are found to deviate at most by a few permille, showing that biases induced by the regularization are small. The unfolded cross sections vary visibly from the true values only in the kinematic threshold regions, with maximum differences of the order of 1%. Effects of similar size are also seen for other single- and multi-differential cross sections and demonstrate an overall good robustness of the unfolding procedure. The simple reweighting approach discussed here is not suitable for quantifying the measurement uncertainty from the underlying physics model; this is done, instead, by the dedicated set of variations applied to the \ttbarsignal simulation detailed in Section 0.8.2.
0.8 Systematic uncertainties
The systematic uncertainties in the measured differential cross sections are grouped into three categories: experimental uncertainties from the imperfect modeling of the detector response, theoretical uncertainties from the modeling of the signal, and the uncertainties in the numbers of events from background processes. The systematic uncertainty is assessed source by source by changing in the simulation the corresponding efficiency, resolution, or scale by its uncertainty, following largely the prescriptions used in Refs. [26, 27]. For each change made, the cross section is recalculated, which for most sources involves a repetition of the full analysis with the varied simulations. The difference with respect to the nominal result in each bin is taken as the systematic uncertainty.
Separate simulations are employed for the data taken in the three years 2016, 2017, and 2018, in order to match the varying detector performance and data-taking conditions. The correlations of systematic uncertainties among the measurements in the different periods must be specified. For theoretical uncertainties we assume a 100% correlation, as the same theoretical models and variations are used for all periods. For experimental uncertainties we use either uncorrelated, partial, or full correlations. For the case of partial correlations we make use of the varied and nominal simulations for each year. The correlated part of the uncertainty is assessed by using the varied simulations for all three years, but rescaling the resulting systematic uncertainty by a factor , where specifies the level of correlation, \eg50%. For the uncorrelated part, we separately vary the simulation for each year, keeping the nominal simulation for the other two years, and add the resulting uncertainties in quadrature, after rescaling them by a factor .
0.8.1 Experimental uncertainties
The following sources are considered:
- •
-
•
The uncertainty in the amount of pileup is assessed by varying the value of the total inelastic cross section, which is used to estimate the mean number of additional interactions, by its measurement uncertainty of [69], leading to a 100% correlated uncertainty among the three years.
-
•
The efficiencies for the dilepton and single-lepton triggers are measured with independent triggers based on a \ptmissrequirement. Scale factors are calculated in bins of lepton \pt, independently for the years 2016, 2017, and 2018. They agree with unity typically within 1%. The scale factors are varied within their uncertainties. The uncertainties are assumed to be uncorrelated among the years.
-
•
Lepton identification and isolation efficiencies are determined using the “tag-and-probe” method with event samples [92, 93]. The efficiencies are assessed in two-dimensional bins of lepton and \pt. The corresponding scale factors typically agree with unity within 10% for electrons and 3% for muons. The scale factors are varied within their calibration uncertainties and a 100% correlation among the years is assumed. An implicit assumption made in the analysis is that the scale factors derived from the sample are applicable to the \ttbarsamples, where the efficiency for lepton isolation is reduced due to the typically larger number of jets present in the events. An additional uncertainty of 1% (0.5%) is added for electrons (muons) to take into account a possible violation of this assumption. This uncertainty is verified with studies of \ttbar-enriched samples using a similar event selection as for the present analysis [94]. In these studies, the lepton isolation criteria are relaxed for one lepton and the efficiency for passing the criteria is measured both in data and simulation.
-
•
The uncertainty arising from the jet energy scale (JES) is assessed by varying the individual sources of JES uncertainty in bins of \ptand and taking the quadrature sum of the effects [76]. The JES uncertainties also include several minor sources related to pileup. The JES variations are also propagated to the uncertainties in \ptvecmiss. The correlation among the years is evaluated separately for each source.
-
•
The uncertainty from the jet energy resolution (JER) is evaluated by the variation of the simulated JER by standard deviation in different regions [76]. An additional uncertainty in the calculation of \ptvecmissis estimated by varying the energies of reconstructed particles not clustered into jets. Both sources of uncertainty are assumed to be uncorrelated among the different years.
-
•
During the 2016–2017 data-taking periods, a gradual shift in the timing of the inputs of the ECAL L1 trigger in the forward endcap region () led to a particular trigger inefficiency. A correction for this effect was determined using an unbiased data sample and is found to be relevant in events containing high-\ptjets pointing to the most forward ECAL region (). While no reconstructed objects at this pseudorapidity enter the measurements, the systematic variation of 20% in this correction for affected events nevertheless leads to a small measurement uncertainty.
-
•
Scale factors for the \PQbtagging efficiency of individual \PQbjets and the mistagging efficiencies of \PQcquark, and light-flavor and gluon jets are measured using dedicated calibration samples [77]. The factors are parameterized as functions of jet \ptand . For the systematic uncertainty evaluation the scale factors are varied within their estimated uncertainties [77]. The variations for \PQband \PQcjets are treated as fully correlated and uncorrelated to those applied for light jets. The statistical uncertainties in the scale factors are uncorrelated among the years and the uncertainties for light jets are also assumed to be uncorrelated among these periods. All other \PQbtagging uncertainties are treated as fully correlated among the years.
0.8.2 Theoretical uncertainties
The uncertainties in the modeling of the \ttbarevents, comprising signal and other final states, are assessed with appropriate variations of the nominal simulation based on \POWHEG+\PYTHIA8 and the CP5 tune, introduced in Section 0.3:
-
•
The uncertainty arising from missing higher-order terms in the simulation of the signal process at the ME level is estimated by varying the renormalization and factorization scales (denoted as and , respectively) in the \POWHEGsimulation up and down by factors of two with respect to the nominal values. The nominal scales are defined in the \POWHEGsample as . Here, denotes the \ptof the top quark in the \ttbarrest frame. In total, six variations are applied: two with fixed, two with fixed, and two with both scales varied in the same direction (up or down). For each measurement bin, the maximum of the resulting measurement variations is taken as the final uncertainty.
-
•
For the parton shower simulation, uncertainties are separately assessed for initial- and final-state radiation, by varying the respective scales up and down by factors of two.
-
•
The uncertainty originating from the scheme used to match the ME-level calculation to the parton shower simulation is derived by varying the parameter in \POWHEGfrom its nominal value of 1.379 to 0.8738 and 2.305 , according to the tuning results of Ref. [41].
-
•
The uncertainty from the choice of PDFs is assessed by reweighting the \ttbarsignal simulation according to the standard deviation along the directions of the 100 eigenvectors of the NNPDF3.1 error PDF sets [36] and adding the resulting measurement variations in quadrature. In addition, the value of the strong coupling \alpSis independently varied within its uncertainty in the PDF set.
-
•
The dependence of the measurement on the assumed top quark mass is estimated by varying in the \ttbarsimulation by around the nominal value of 172.5\GeV.
-
•
The uncertainty related to modeling of the UE is estimated by varying the CP5 tune parameters within their uncertainties determined in the tuning process [41].
-
•
The nominal \PYTHIAsetup includes a model of color reconnection (CR) based on MPIs with early resonance decays switched off. The analysis is repeated with three other CR models within \PYTHIA: the MPI-based scheme with early resonance decays switched on, a gluon-move scheme [95], and a QCD-inspired scheme [96]. The total CR related uncertainty is taken to be the maximum deviation from the nominal result.
-
•
The \PQbjet energy response is different for semileptonic decays of \PQb hadrons and thus their branching fractions are varied within world average uncertainties [1]. The parton level cross sections are corrected for the branching fractions for which are taken from Ref. [1] and varied according to their uncertainty of 1.5%.
The uncertainties associated with the values of , , and the CR treatment are evaluated using separate \ttbarsimulations incorporating the varied values, while all other theoretical uncertainties are assessed by applying appropriate event weights in the nominal simulations.
0.8.3 Background uncertainties
The contributions from non-\ttbarbackground processes are overall at the level of a few percent, and the uncertainties are treated as global normalization uncertainties in the MC simulated processes. The uncertainty in the background normalization is assessed by repeating the template fits to distributions, described in Section 0.4, with varied event selections. The nominal fits are performed with a selection dropping all requirements on \ptmiss, the number of \PQb-tagged jets, and the \ttbarkinematic reconstruction. In the first varied scenario, the requirement is switched on again for the and channels, in the next one it is additionally required to have at least one \PQb-tagged jet in the event, and in the last one the criterion of finding a solution to the full kinematic reconstruction is imposed. The variations are studied separately for each channel ( and ) and each year. The maximum scale factor variation observed among all channels, years, and event selections is used to derive a systematic uncertainty in the normalization.
For the single top quark, , and diboson backgrounds, a normalization uncertainty of is taken, following the prescription from our previous analyses [26, 27]. This value is confirmed for the background (dominant contribution among these processes) by investigating the ratio of the number of events with one and two \PQb-tagged jets in the sample, which is higher for the process than for \ttbarevents.
0.8.4 Summary of uncertainties
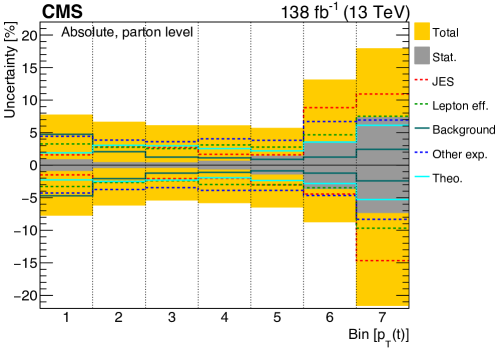
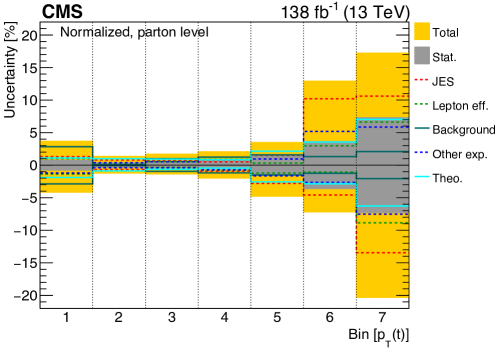
The total systematic uncertainty in each measurement bin is assessed by adding all contributions described above in quadrature, separately for positive and negative cross section variations. If a systematic uncertainty leads to two cross section variations of the same sign, the largest one is taken and the opposite variation is set to zero. The total uncertainties for the measured cross sections range 2–20%, depending on the observable and the bin. They are dominated by the systematic uncertainties.
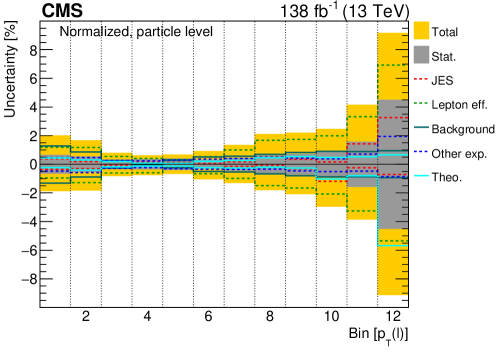
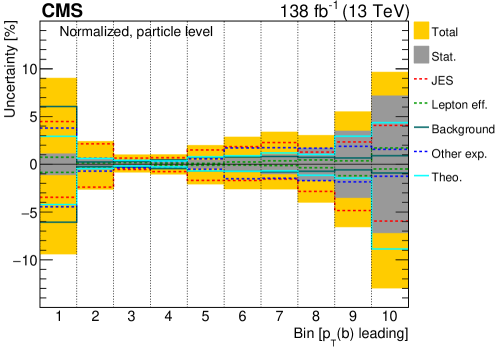
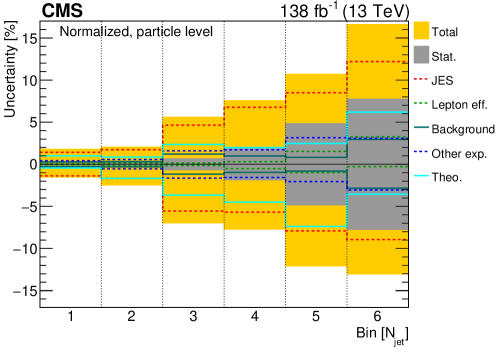
The uncertainties are illustrated in Figs. 5–6, showing the relative contributions from the various sources for selected differential cross sections. Individual sources affecting a particular uncertainty (\egJES) are added in quadrature and shown as a single component. Additional experimental systematic uncertainties and all contributions from theoretical uncertainties are also added in quadrature, respectively, and shown as single components. For most bins in a majority of the distributions, the JES is the dominant systematic uncertainty. Important contributions arise from other experimental sources, as well as from theoretical and background uncertainties. Among the significant experimental sources of uncertainties are the lepton and \PQbtagging efficiencies, and for measurements of absolute cross sections, the integrated luminosity. For the theoretical uncertainties, the following sources contribute significantly, with relative magnitudes depending on the observables and phase space region: ME level and final-state radiation scales, parameter, top quark mass, underlying event, and CR.

0.9 Results
Cross sections for \ttbarand top quark kinematic variables are discussed in Section 0.9.1, for lepton and \PQbjet variables in Section 0.9.2, and for events with additional jets in Section 0.9.3. The three predictions based on MC simulations introduced in Section 0.3: \POWHEG+\PYTHIA8 (‘POW+PYT’), \POWHEG+\HERWIG7 (‘POW+HER’), and MG5_amc@nlo[FxFx]+\PYTHIA8 (‘FxFx+PYT’), are used for comparisons to data. The POW+PYT and POW+HER theoretical predictions differ by the parton-shower method, hadronization and event tune (\pt-ordered parton showering, string hadronization model, and CP5 tune in POW+PYT, or angular ordered parton showering, cluster hadronization model, and CH3 tune in POW+HER), while the POW+PYT and FxFx+PYT predictions adopt different matrix elements (inclusive \ttbarproduction at NLO in POW+PYT, or \ttbarwith up to two extra partons at NLO in FxFx+PYT) and different methods for matching with parton shower (correcting the first parton shower emission to the NLO result in POW+PYT, or subtracting from the exact NLO result its parton shower approximation in FxFx+PYT). In Section 0.9.4, several theoretical calculations with beyond-NLO precision are introduced and their predictions compared to the data for a subset of the measured cross sections. Finally, a study of the sensitivity of the normalized cross sections to the PDFs is presented in Section 0.9.5. For each data-to-theory comparison, a statistic and the number of degrees of freedom (dof) are reported. One statistic, denoted in the following as “standard ”, probes directly the quality of the nominal predictions. It takes all measurement uncertainties into account, including bin-to-bin correlations, but neglects the uncertainties in the theoretical predictions. Additional values that include prediction uncertainties are also provided for a subset of the models: for POW+PYT, the full set of uncertainties discussed in Section 0.8.2 is applied to the generator-level predictions, and for the beyond NLO models, the theory scale uncertainties discussed in Section 0.9.4 are considered; these prediction uncertainties are also shown in the corresponding result figures. The exact definition of the values is given in Appendix .11. Normalized cross sections and tables providing the values are presented in this section, while absolute cross sections and corresponding tables are summarized in Appendix .12. The -values denoting the probability for finding a of equal or larger size than observed are tabulated, for all results, in Appendix .13.
0.9.1 Results for top quark and \ttbarkinematic observables at the parton and particle levels
The studies presented in this subsection aim to provide a comprehensive survey of the kinematic spectra of the top quark and antiquark, the \ttbarsystem, and their correlations.
Single-differential cross sections
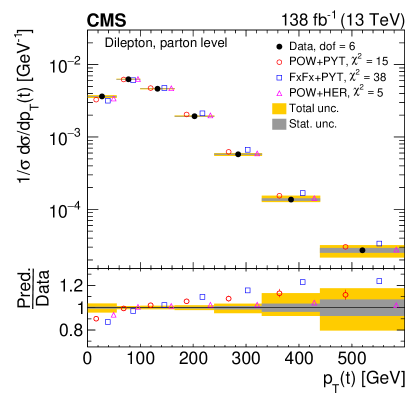
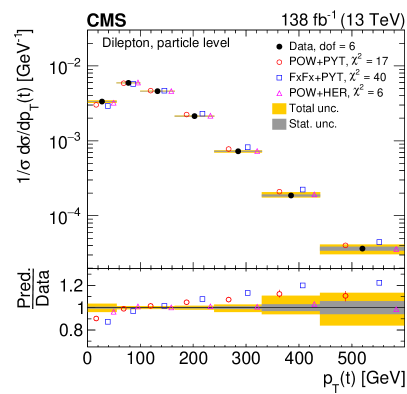
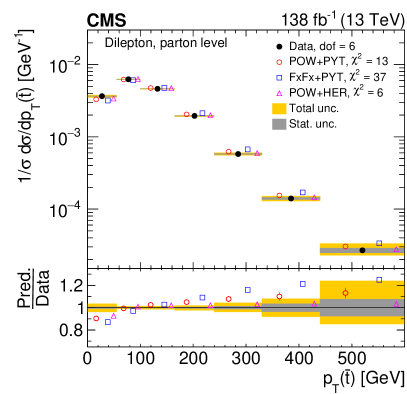
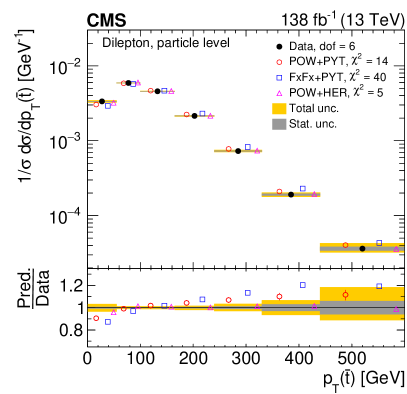
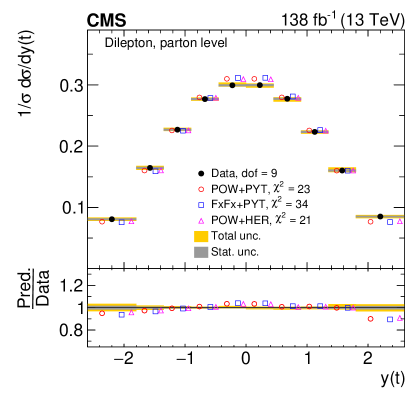
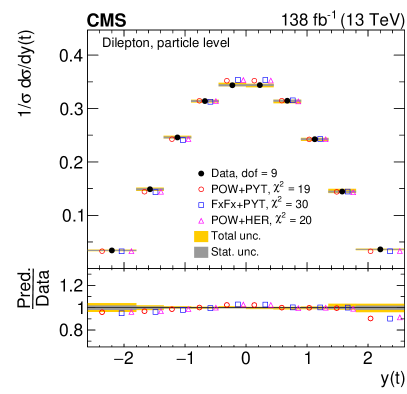
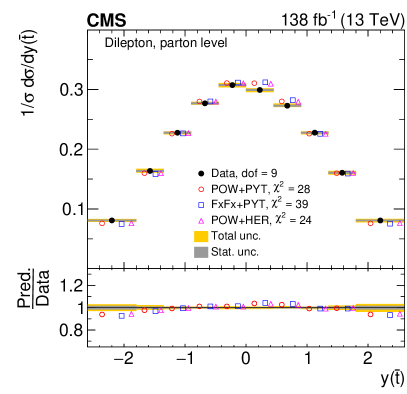
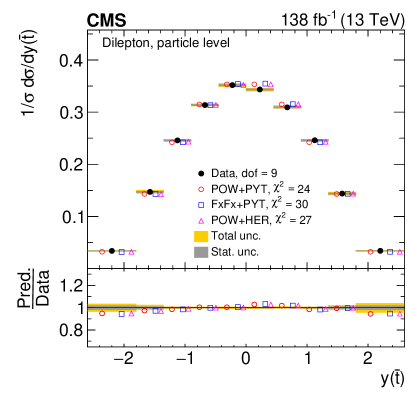
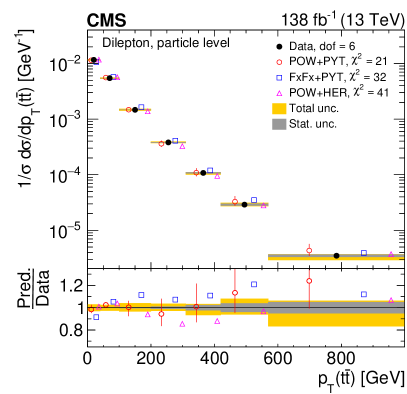
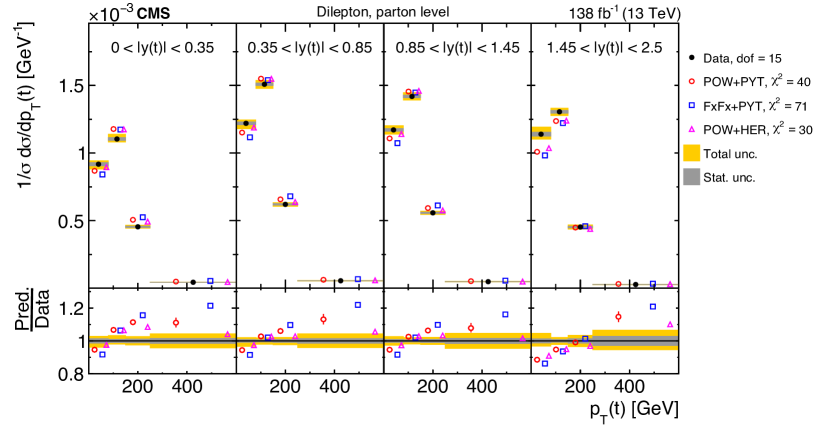
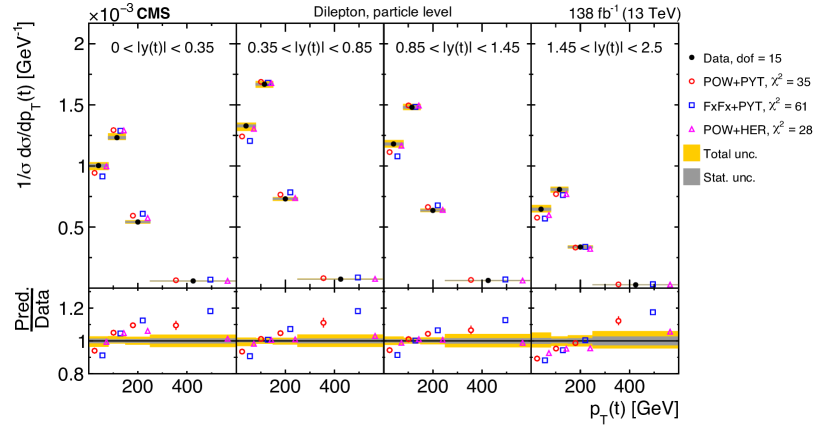
The single-differential cross sections are shown in Figs. 7–12. The values of the model-to-data comparisons are listed in Tables 0.9.1–0.9.1, and the corresponding -values in Tables .13–.13. First, we present measurements where the top quark and antiquark kinematics are studied. Figure 7 illustrates the distributions of and . Both the POW+PYT and, in particular, the FxFx+PYT models predict harder spectra than observed, while POW+HER provides a reasonable description of the data, as supported by the -value of the test. The discrepancy between POW+PYT and the data is smaller than what was observed in our previous analysis [26]. This reduction can be attributed to the use of the more-recent tune CP5 [41] for the \PYTHIApart of the calculation, whereas in the previous analysis the CUETP8M2T4 tune [51, 52, 53] was applied. Figure 8 depicts the and distributions. All models predict a slightly more central distribution than observed in data. One general observation can be made at this point: the comparisons of predictions and data for the cross sections at the parton and particle levels show similar patterns. This is also the case for most other cross sections presented in this paper; consequently, a separate discussion of the parton- and particle-level cross sections will be only given in case of significant differences.
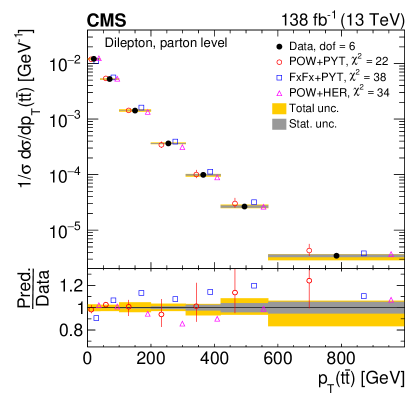
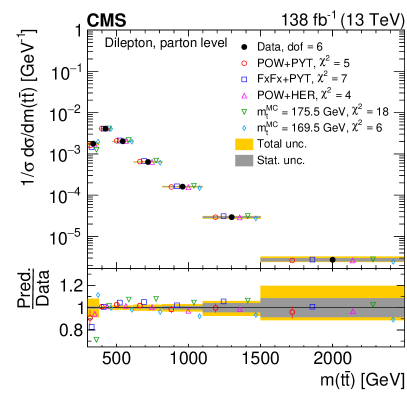
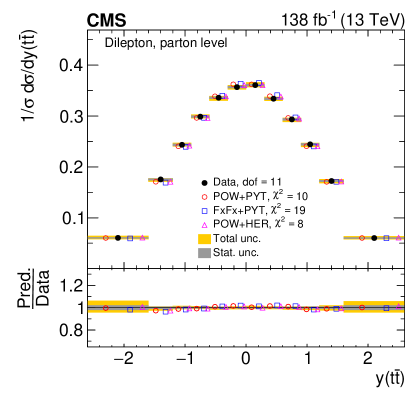
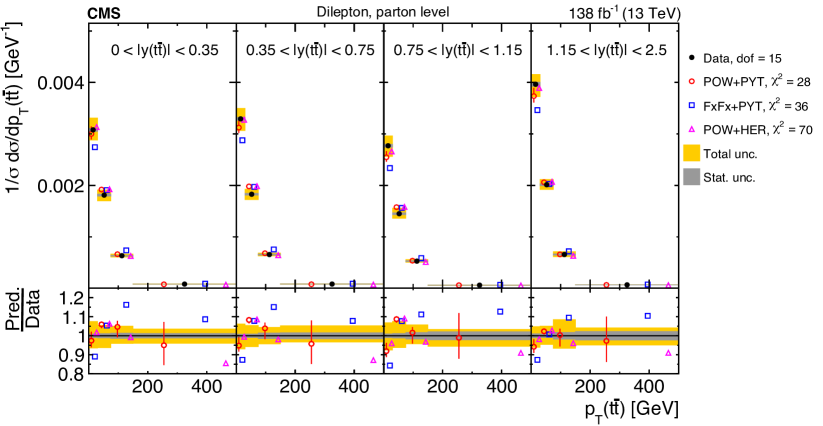
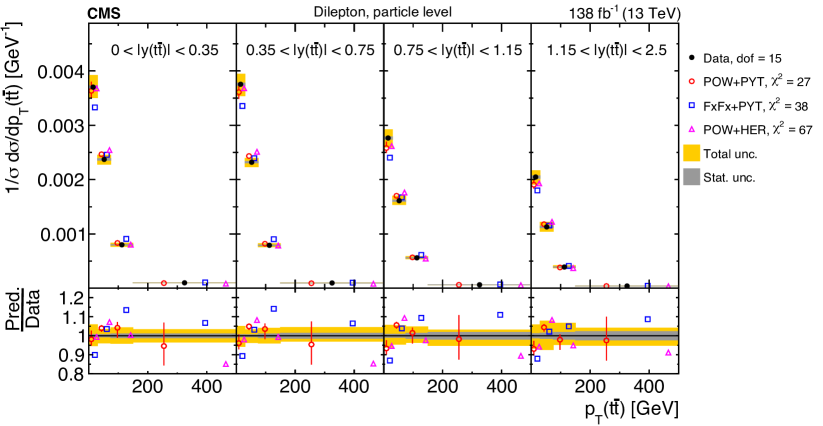
Figure 9 shows the distributions of the complete set of \ttbarkinematic observables: , , and . For , the phase space covered in our previous analysis [26] is extended up to 1\TeV. The description of the distribution is particularly difficult, since nonzero values indicate the presence of extra QCD radiation in the event recoiling against the \ttbarsystem, which directly probes higher-order processes in the calculation. The three MC models differ in the predicted shape of the distribution and none of them is able to describe the data accurately. The best description is provided by POW+PYT, which tends to overshoot the data only in the higher- range. The FxFx+PYT model predicts too many events in the intermediate ranges, while POW+HER predicts too few. The description by POW+HER is somewhat improved compared to what was observed in our previous analysis [26], which can also be attributed to using a newer version of the \HERWIGMC generator, \HERWIG7 [46], instead of \HERWIGpp [97]. It is interesting to note that also in two recent measurements [28, 25] by the ATLAS and CMS Collaborations, the distribution was found to be rather poorly described by several models. In the present analysis, the spectrum is overall reasonably well described by the models, with the exception of the first bin near the threshold where the predictions lie somewhat below the data. This region is known to be particularly sensitive to the value of the top quark mass assumed in the calculations. To investigate this discrepancy in more detail, the POW+PYT prediction is also shown for two other values of the top quark mass parameter, and , compared to the value of 172.5\GeVtaken in the nominal simulation. For the lower value, the cross section prediction moves up in the lowest bin by about 20% and the whole mass spectrum is a bit softer than in the data, however still providing a with a good -value. Using the higher value, the resulting predicted spectrum is clearly harder than what is observed in data. This discrepancy is also reflected by an increase of the value of about 13 units compared to using the central mass value, proving the high sensitivity of the distribution to the top quark mass value, as explored in the CMS analysis [98]. The distribution of the data is described reasonably well by all models.
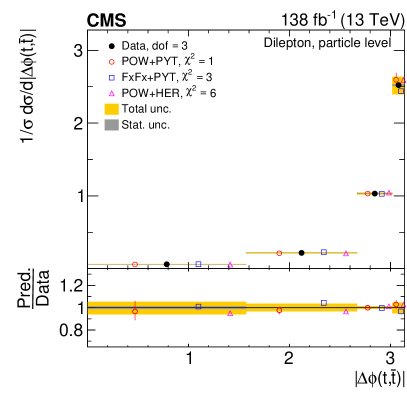
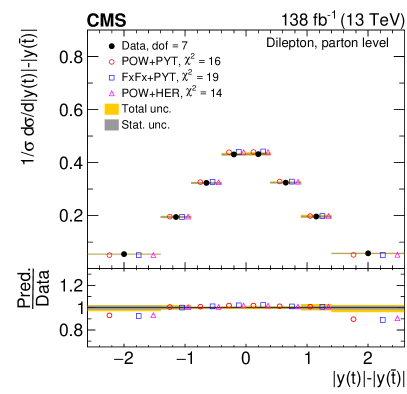
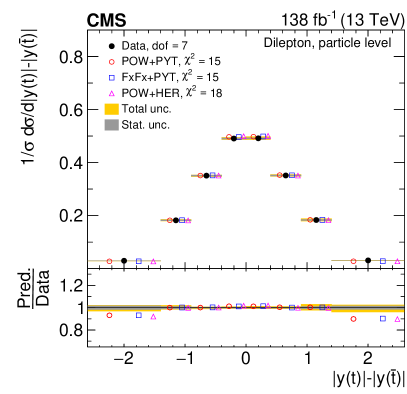
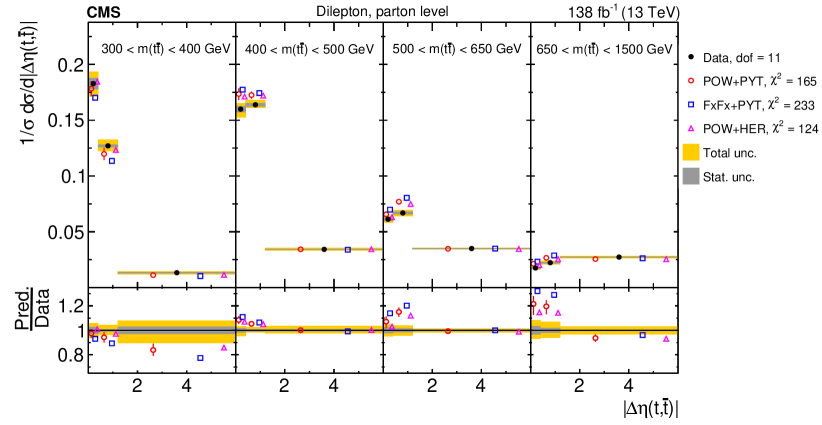
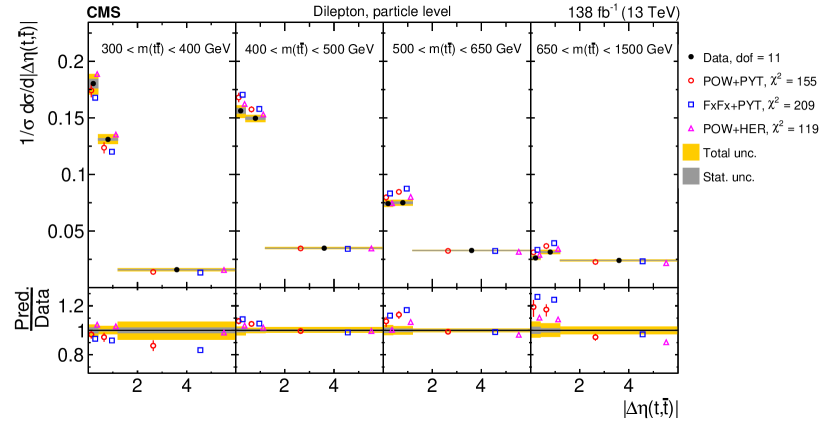
Moving on to studies of kinematic correlations between top quark and antiquark, we show in Fig. 10 the distribution of the absolute value of the azimuthal angle difference between the top quark and antiquark , and the difference of the absolute values of the top quark and antiquark rapidities , related to the charge asymmetry [99]. For , angles smaller than are directly sensitive to additional QCD radiation in the event. The models provide a good description of the data. The spectrum of the data is not perfectly described by the MC models, as they predict more events at small rapidity separations and fewer at larger values .
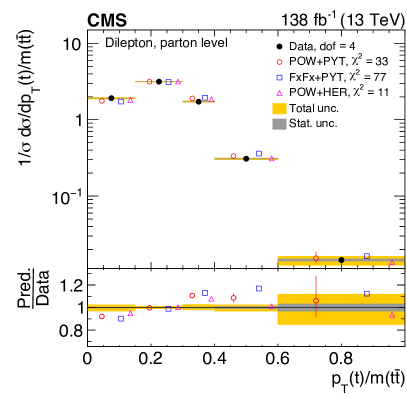
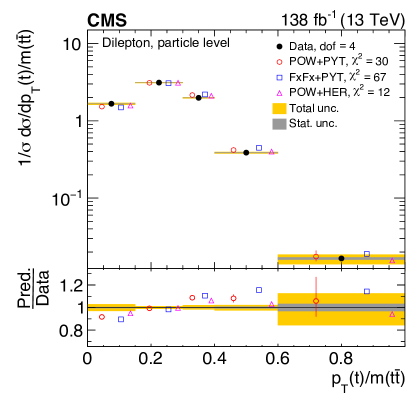
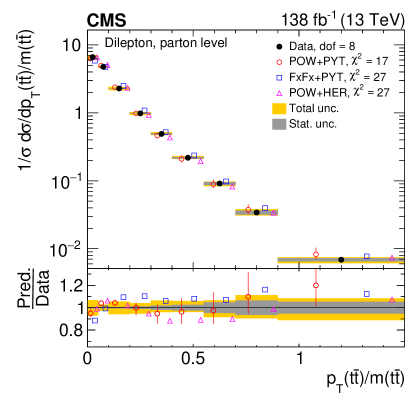
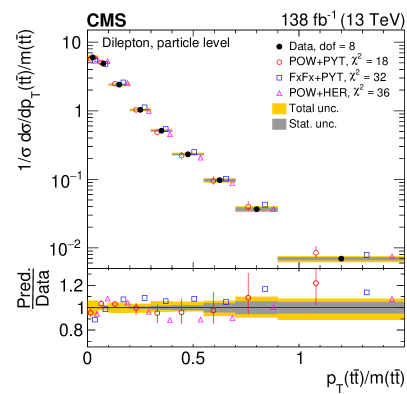
Figure 11 presents the distributions of two ratios: and . The study of the first quantity is inspired by the observation in Ref. [27] that at large the effect of the models predicting harder spectra is enhanced. Indeed, all three tested models predict a significantly harder spectrum for the ratio of the two variables and the values indicate a poor data description. The distribution of the second ratio, , is expected to be sensitive to \ptresummation effects. The description by the three models follows largely the trends observed for .
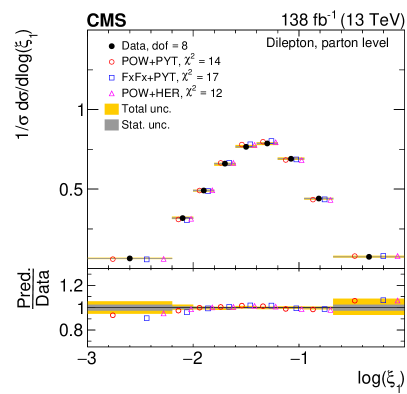
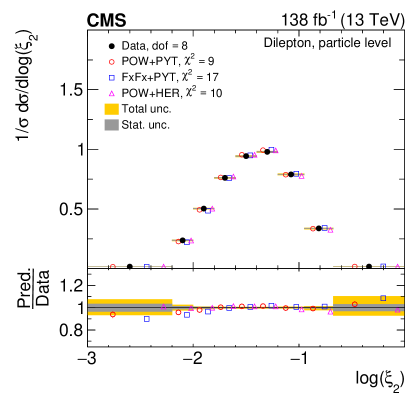
Finally, we study two observables and , defined as and , with denoting the proton beam energy, and the magnitude of the \ttbarmomentum along the beam axis. In the leading order pQCD picture of the process, these variables represent the proton momentum fractions of the two partons entering the hard interaction. Figure 12 depicts the and distributions. Overall, these PDF-sensitive distributions are reasonably well described by all the models. Of special interest is the last bin covering proton momentum fractions above 0.2, where the uncertainties in the PDFs, in particular for the gluon distribution, start to grow.
The description of the kinematic distributions of top quark, antiquark, and \ttbarsystem by the three MC models can be summarized as follows. The models tend to predict, for the individual quarks, harder \ptspectra and slightly more-central rapidity distributions than those observed in data. A reasonable description is provided for the \ttbarrapidity and invariant mass spectra. The latter is described less well by the POW+PYT simulation that uses a larger value of , as it predicts a harder spectrum than that observed in data. The distribution is modeled well, and smaller rapidity separations are predicted than observed in data on average. The FxFx+PYT model provides overall the least accurate description of the data, in particular by predicting harder \ptspectra for the top quark, antiquark, and the \ttbarsystem. Among all the models, POW+HER predicts the softest \ptspectra for the top quark, antiquark, and the \ttbarsystem, which matches the data well for the former two, but are too soft for the latter. The POW+PYT model provides the best description of the \ptdistribution of the \ttbarsystem. The standard values indicate a rather poor description of several distributions by some of the models, while the values that also include the prediction uncertainties (as for example, those evaluated for POW+PYT, see Tables 0.9.1–0.9.1) are found to be significantly smaller. Only for a few distributions, \eg, the -values of the remain too low for a reasonable description of the data, as is typically the case for those distributions with the largest visible discrepancies.


The values and dof of the measured normalized single-differential cross sections for \ttbarand top quark kinematic observables at the parton level are shown with respect to the predictions of various MC generators. The values are calculated taking only measurement uncertainties into account and excluding theory uncertainties. For POW+PYT, the values including theory uncertainties are indicated with the brackets (w. unc.). Cross section dof variables POW+PYT (w. unc.) FxFx+PYT POW+HER 6 15 (11) 38 5 6 13 (9) 37 6 9 23 (20) 34 21 9 28 (25) 39 24 6 22 (7) 38 34 11 10 (8) 19 8 6 5 (3) 7 4 3 1 (0) 5 7 7 16 (9) 19 14 4 33 (20) 77 11 8 17 (6) 27 27 8 14 (10) 17 12 8 10 (7) 23 7
The values and dof of the measured normalized single-differential cross sections for \ttbarand top quark kinematic observables at the particle level are shown with respect to the predictions of various MC generators. The values are calculated taking only measurement uncertainties into account and excluding theory uncertainties. For POW+PYT, the values including theory uncertainties are indicated with the brackets (w. unc.). Cross section dof variables POW+PYT (w. unc.) FxFx+PYT POW+HER 6 17 (12) 40 6 6 14 (9) 40 5 9 19 (16) 30 20 9 24 (20) 30 27 6 21 (7) 32 41 11 10 (7) 21 9 6 5 (3) 5 8 3 1 (0) 3 6 7 15 (10) 15 18 4 30 (20) 67 12 8 18 (7) 32 36 8 14 (9) 17 18 8 9 (6) 17 10
Multi-differential cross section measurements
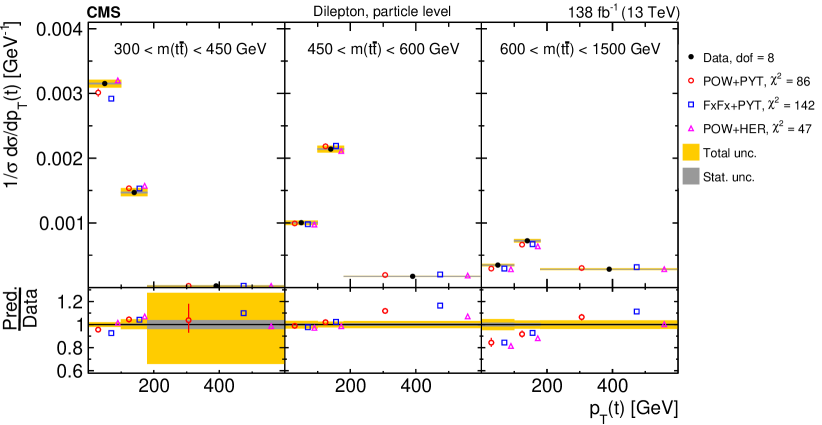
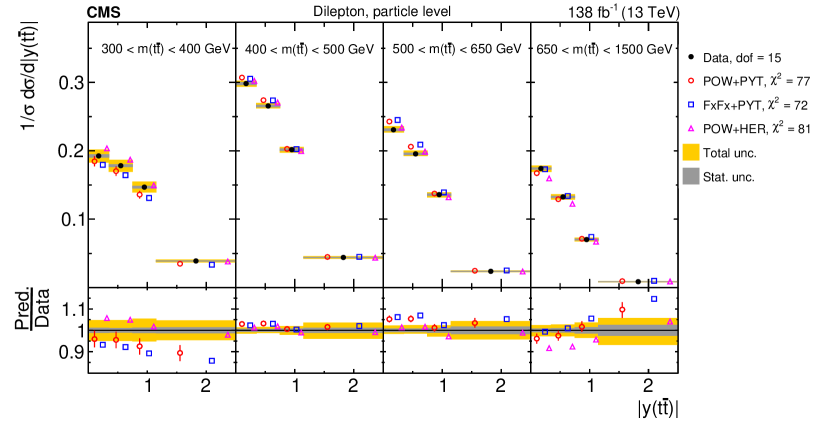
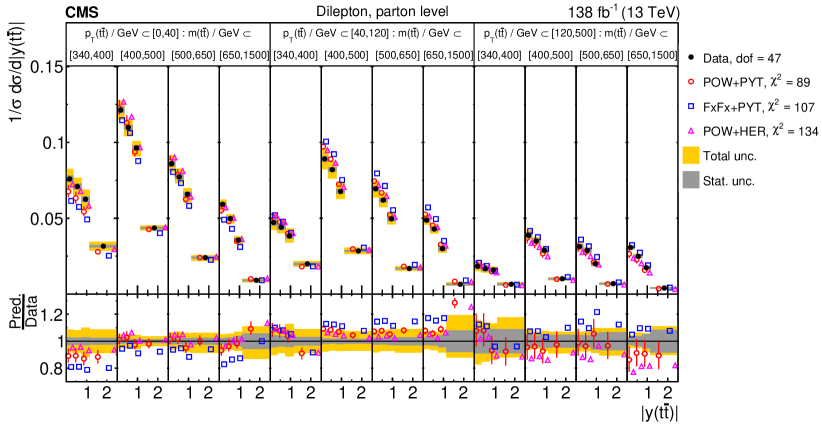
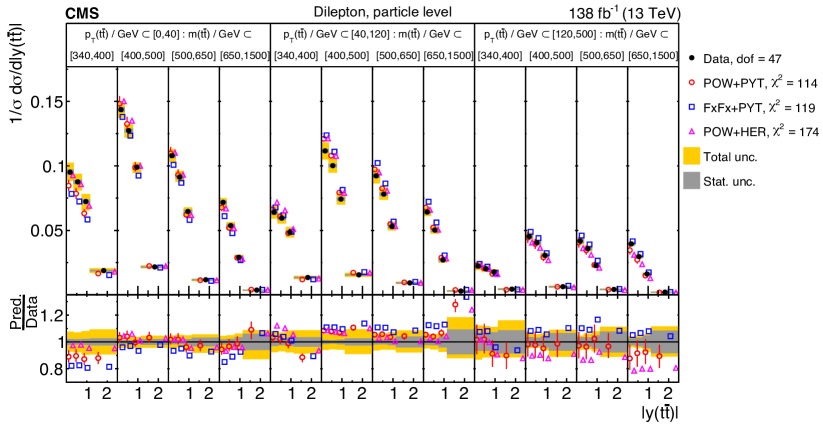
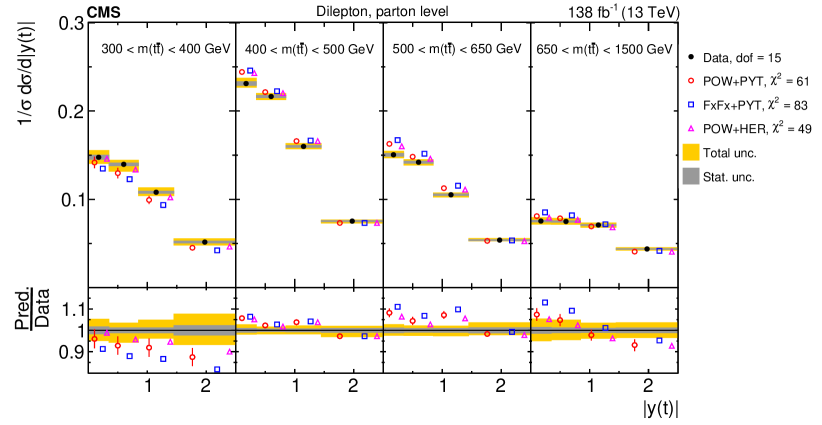
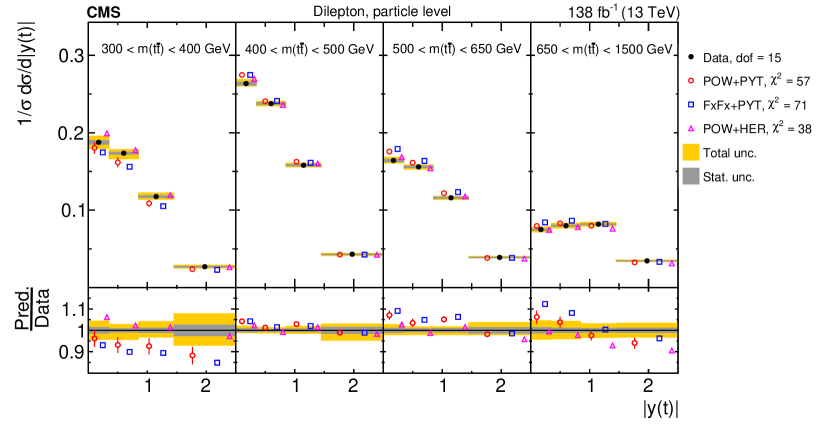
Studies of differential \ttbarcross sections performed as functions of several kinematic observables shed light on the details of the \ttbarproduction dynamics and can help to better understand the origin of model-to-data discrepancies seen in single-differential cross sections. The double-differential measurements performed in this analysis, \egas functions of and , are denoted in the following as , \etc, and an analogous notation is adopted for triple-differential cross sections. The cross section results are shown in Figs. 13–22. The upper and lower plots show the cross sections at the parton and particle levels, respectively. The values of model-to-data comparisons are listed in Tables 0.9.1–0.9.1, and the corresponding -values in Tables .13–.13.
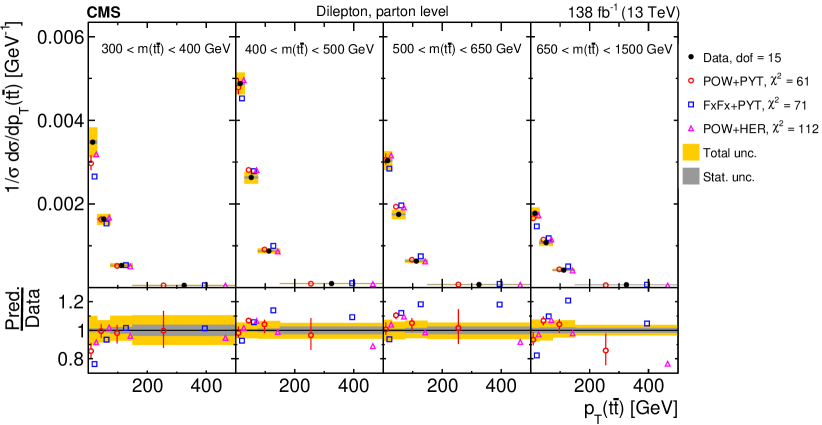
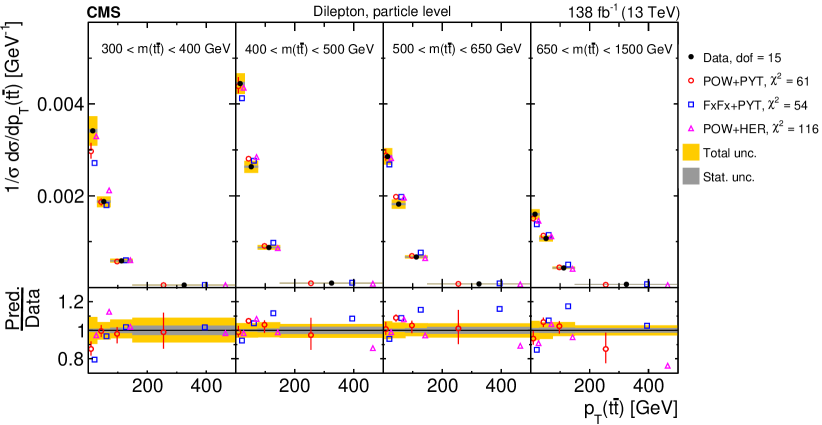
In the first set of studies, we investigate how the distribution is correlated with other event kinematic observables. In Fig. 13, the distribution is compared in different ranges of to predictions from the same three MC models discussed above. The data distribution is softer than that of the predictions over the entire range. The POW+HER prediction that gave a reasonable description of the single-differential cross section (Fig. 7), still provides the best description, but exhibits a stronger positive slope with respect to the data in the lowest and highest ranges. Figure 14 shows the distributions in different ranges. Similar to the result of the previous analysis [27], this is among the double-differential cross sections poorly described by the models. While the POW+HER model describes the distribution in the lowest range near threshold reasonably well, it joins POW+PYT and FxFx+PYT in a trend that grows with increasing to predict a spectrum that is harder than observed in the data. Figure 15 illustrates the spectrum in different ranges. Larger values can be kinematically correlated with higher values when the \ttbarsystem is recoiling against additional QCD radiation in the event. The FxFx+PYT model predicts a harder spectrum than observed in the data for all ranges. The POW+PYT and POW+HER predictions tend to overshoot the data in the higher ranges at the lower values.
Next we investigate the \ttbarkinematic observables. Figure 16 illustrates the distributions. Both variables are kinematically correlated with the observables and introduced above, and their combination is known to provide optimal information for constraining the PDFs [19]. For low- and medium- regions, the predictions are slightly more central than the data, though in the highest range the opposite effect is observed. In Fig. 17, the spectrum of is shown in bins of . These two observables are rather uncorrelated, and thus it is not surprising that the description of the distribution by the models is similar in all ranges. Figure 18 presents the distributions. This is an interesting observable combination since the phase space for QCD radiation that is driving the observable is increasing with higher . The trends observed in the single-differential distribution (see Fig. 9), namely, that FxFx+PYT (POW+HER) predicts a too hard (soft) spectrum, are somewhat enhanced in the higher ranges. Figure 19 shows the first simultaneous study of all three \ttbarkinematic observables: \pt, mass, and rapidity. Overall, POW+PYT provides a fairly reasonable description, though FxFx+PYT and POW+HER show deficiencies in specific and phase space regions, with mostly small or moderate dependencies on .
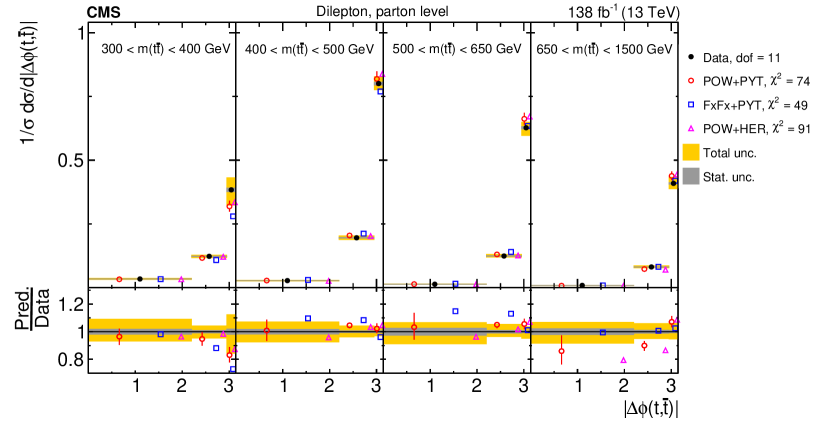
Finally, we perform several studies of , investigating its correlation to several other kinematic observables. Figure 20 illustrates the distributions of . The trend that the predictions exhibit a more-central rapidity distribution than the data increases slightly with higher . In Fig. 21, the distributions are shown, which are sensitive to the hard scattering dynamics. The data favor larger rapidity separations than predicted by the models, and the significance of this effect increases at larger . The disagreement is the strongest for FxFx+PYT. For a given value, larger are correlated with lower values on average. This gives a hint that the effects of the models predicting harder spectra and smaller distributions, which are enhanced in the higher ranges (Figs. 14 and 21), are related. Figure 22 depicts the distributions. At low , the data prefer a slightly more back-to-back distribution of the top quark and antiquark compared to the models, but in the highest range, the trend reverses. Of all models considered, the FxFx+PYT simulation provides the best description and POW+HER the worst.
The observations made with the multi-differential cross sections can be summarized as follows. The \ptof the top quark and \ttbar, and the \ttbarinvariant mass are, in general, mildly correlated with rapidity of the same objects, and also the quality of their description by the MC models is nearly independent of the rapidity. As expected, larger kinematical correlations are observed between \ptand the mass observables. The trends of harder top quark \ptspectra and smaller rapidity separations between top quark and antiquark, when comparing the models to the data, is clearly enhanced at higher . The tendency for FxFx+PYT (POW+HER) to predict \ptspectra for the \ttbarsystem that are too hard (soft) is also stronger at higher . In general, the -values associated with the standard values of the model-to-data comparisons are often much lower for the multi-differential \ttbarcross sections than for the single-differential results presented in the previous subsection. This result is in line with the observations in recent comparable \ttbardifferential cross section papers from the ATLAS and CMS Collaborations [25, 28]. Another interesting observation is that the values for both the single- and multi-differential \ttbarcross sections are, on average, significantly higher than those observed in the corresponding previous measurements [26, 27] based on the 2016 data set only, which can be attributed to a substantially improved measurement precision. The values that include the prediction uncertainties for the POW+PYT model (see Tables 0.9.1–0.9.1) are, in general, significantly lower than the standard ones. However, for several distributions such as , the values remain too high to indicate a good description of the data.


The values and dof of the measured normalized multi-differential cross sections for \ttbarand top quark kinematic observables at the parton level are shown with respect to the predictions of various MC generators. The values are calculated taking only measurement uncertainties into account and excluding theory uncertainties. For POW+PYT, the values including theory uncertainties are indicated with the brackets (w. unc.). Cross section dof variables POW+PYT (w. unc.) FxFx+PYT POW+HER 15 40 (31) 71 30 8 83 (35) 152 41 15 39 (21) 69 83 15 64 (42) 66 63 15 28 (15) 36 70 15 61 (43) 71 112 47 89 (64) 107 134 15 61 (37) 83 49 11 165 (31) 233 124 11 74 (47) 49 91
The values and dof of the measured normalized multi-differential cross sections for \ttbarand top quark kinematic observables at the particle level are shown with respect to the predictions of various MC generators. The values are calculated taking only measurement uncertainties into account and excluding theory uncertainties. For POW+PYT, the values including theory uncertainties are indicated with the brackets (w. unc.). Cross section dof variables POW+PYT (w. unc.) FxFx+PYT POW+HER 15 35 (25) 61 28 8 86 (36) 142 47 15 35 (19) 62 67 15 77 (40) 72 81 15 27 (18) 38 67 15 61 (36) 54 116 47 114 (68) 119 174 15 57 (26) 71 38 11 155 (30) 209 119 11 71 (42) 39 101
0.9.2 Results for lepton and \PQbjet kinematic variables at the particle level
In this subsection we present selected kinematic distributions of the leptons and \PQbjets produced in the decays of the top quark and antiquark, at the particle level in a fiducial phase space. These distributions are sensitive to both the dynamics of the \ttbarproduction and its decay. The kinematic observables of these objects are measured very precisely with the CMS detector. The single-differential cross sections studied at the particle level are shown in Figs. 23–25. The model-to-data and corresponding -values are listed in Tables 0.9.2 and .13, respectively.
First we investigate the lepton kinematic observables. Figure 23 shows the distributions of the \ptof the lepton (with negative charge), the ratio of the trailing and leading lepton \pt, and the ratio of the lepton and top antiquark \pt. As for the top antiquark (Fig. 7), the MC models predict a harder \ptspectrum for the leptons than observed, with FxFx+PYT exhibiting a stronger discrepancy. For the ratio of the trailing and leading lepton \pt, the models predict distributions that are slightly too soft, with FxFx+PYT again showing a more significant deviation than POW+PYT and POW+HER. The distribution of the ratio of the lepton and top quark \ptshows an interesting excess of data over the predictions for ratios above 0.8, which is an indication of a failure of the models to describe the dynamics of the top quark decay.
Next, we study three \PQbjet observables, as shown in Fig. 24. The leading (trailing) \PQbjet is defined as the \PQbjet from the decay of the \ttbarsystem with the higher (lower) \pt. The distributions of the leading and trailing \PQbjet \ptare reasonably well described by the POW+PYT and POW+HER models, while FxFx+PYT predicts a spectrum that is too hard. The third studied variable is the ratio between the sum of the \ptof the \PQband \PAQbjets over the sum of the \ptof the top quark and antiquark . All models predict a distribution that is somewhat too soft.
In the next set of studies, shown in Fig. 25, we analyze the invariant mass spectra of the lepton pair , of the \PQbjet pair , and of the combined system . We investigate whether the model descriptions for the mass spectra of these partial decay systems follow the good description observed for the full \ttbarsystem, (Fig. 9, middle plot). The distributions show a clear trend towards a somewhat harder spectrum in the model predictions compared to the data. The spectra are reasonably well described overall by all three predictions, with a small trend of the data overshooting the predictions near threshold and at large mass values. The distributions show a similar trend. Furthermore, we investigate the sensitivity of the different mass spectra to the value of the top quark mass assumed in the POW+PYT calculation, by showing the predictions for = 169.5 and 175.5\GeV, compared to the nominal prediction using a value of 172.5\GeV. It is clear that the predicted and spectra become harder with increasing , although the effects are diluted in the regions of small invariant masses compared to the distribution shown in Fig. 9. The distribution clearly exhibits a better sensitivity to the value in the small invariant mass region, comparable to the one observed for the spectrum.
Finally, we study additional dilepton distributions, whose kinematic obervables are among those in the present analysis that are reconstructed with highest precision. Figure 26 shows the and distributions. Overall, they are reasonably well described by the three MC models, with FxFx+PYT predicting a spectrum that is slightly too hard and an distribution that is a bit too central. Figures 27-29 show double-differential cross sections, illustrating the correlations between the dilepton kinematic observables. The distributions show that the tendency of the MC predictions to provide a spectrum that is harder than in data is a bit enhanced towards high values of . The spectra are well described by the POW+PYT and POW+HER models, while FxFx+PYT predicts distributions that are somewhat too hard at small values. For the distributions the spectra clearly become harder towards larger values of and this effect is a bit more pronounced in the MC models than in the data.
The observations made with the differential \ttbarcross sections as functions of charged lepton and \PQbjet kinematic observables can be summarized as follows. These measurements are the most accurate of all results presented in this document. Overall, the predictions from the MC models agree rather well with each other. The models predict harder distributions for the lepton \ptand the invariant mass of the lepton pair. The distributions of \ptof leading and trailing \PQbjets, and of are reasonably well described, except for FxFx+PYT, which predicts harder \ptspectra. Among the invariant mass spectra, the distribution clearly shows the strongest sensitivity to the value of the top quark mass used in the POW+PYT calculation. The single-differential \ptand distributions of the dilepton system are reasonably well described by the models overall, although for double-differential distributions, including also as a possible second variable, some tensions are visible, in particular for FxFx+PYT. The standard values indicate, in general, a poor quality in the description of the data by the nominal predictions. The inclusion of the prediction uncertainties for the POW+PYT model (see Table 0.9.2) results in tests with reasonable -values in most cases.
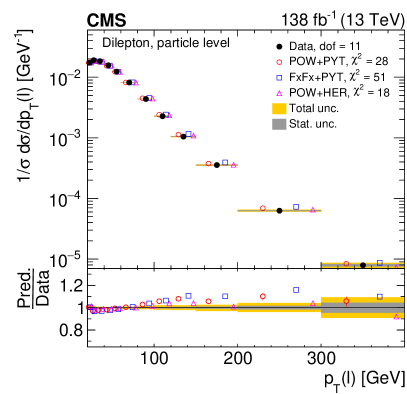
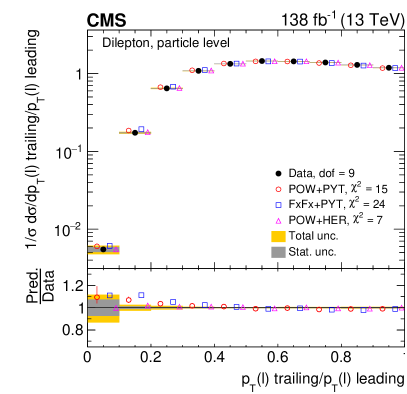
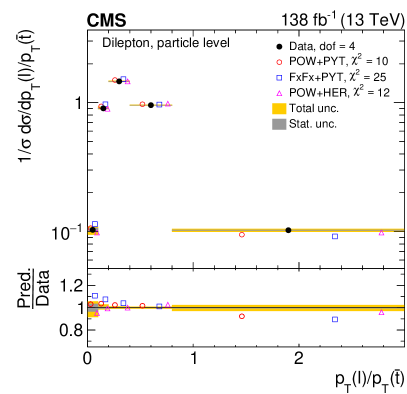
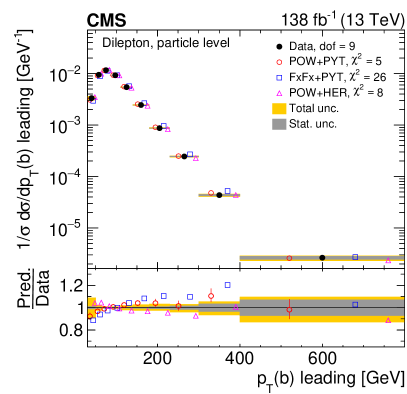
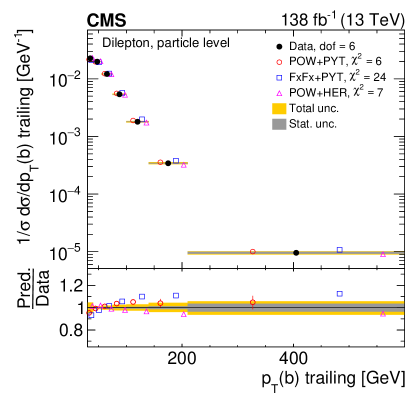
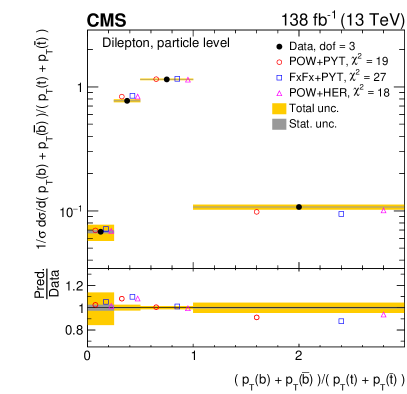
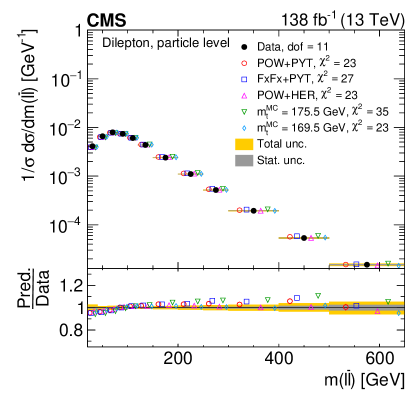
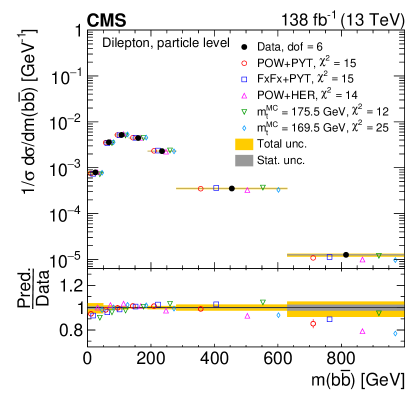
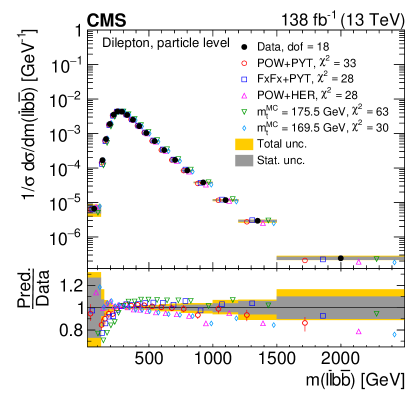
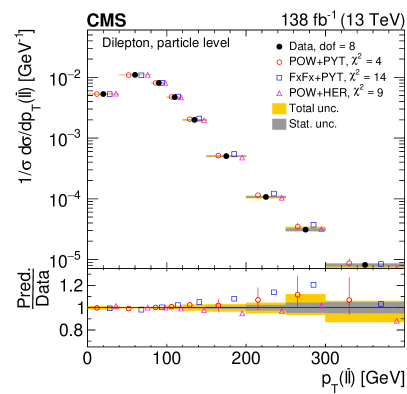
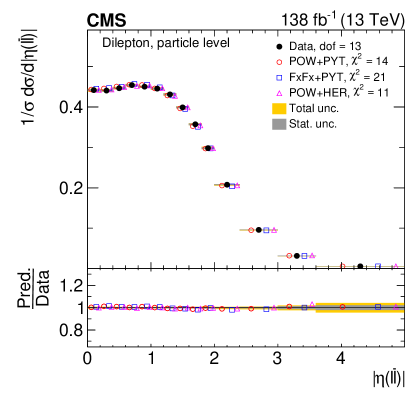
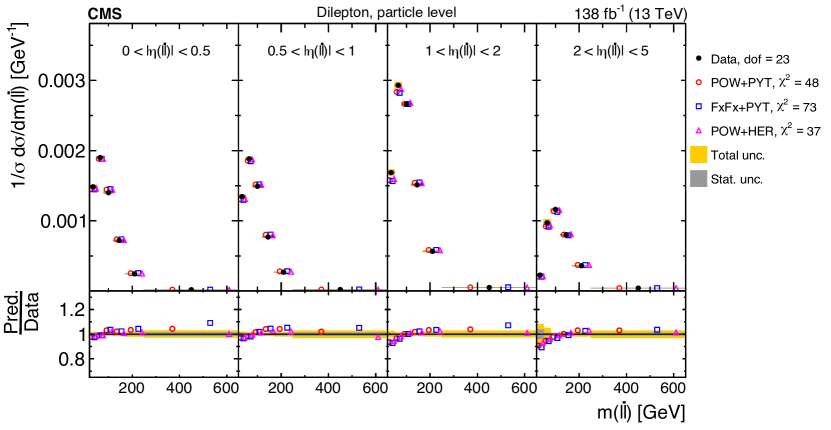
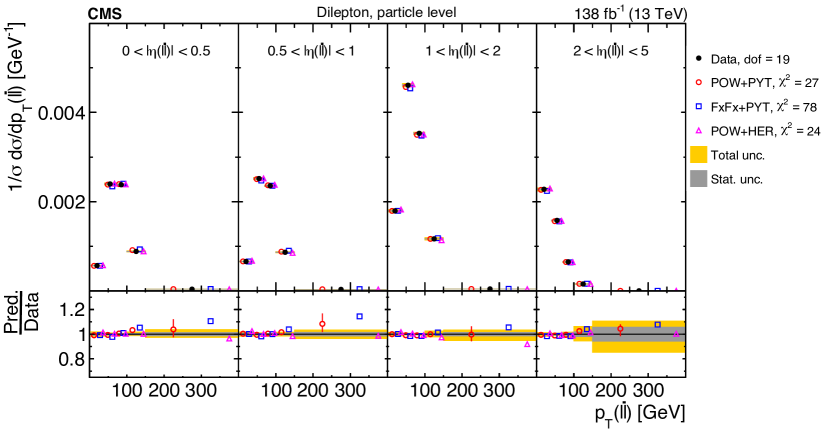
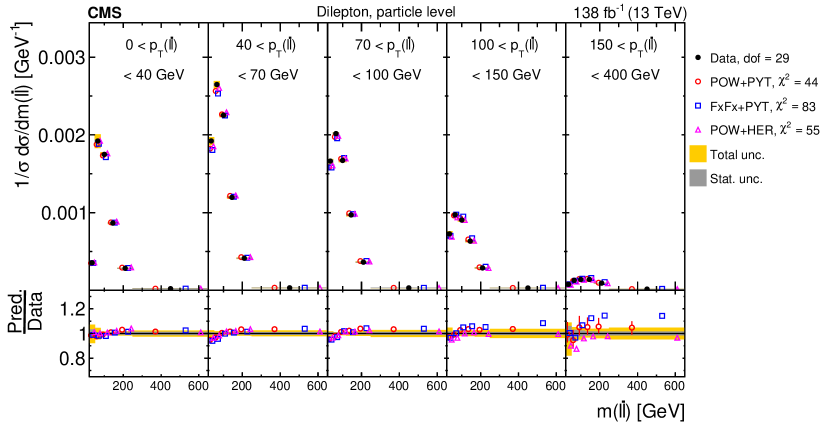
The values and dof of the measured normalized single-differential cross sections for lepton and \PQb-jet kinematic observables at the particle level are shown with respect to the predictions of various MC generators. The values are calculated taking only measurement uncertainties into account and excluding theory uncertainties. For POW+PYT, the values including theory uncertainties are indicated with the brackets (w. unc.). Cross section dof variables POW+PYT (w. unc.) FxFx+PYT POW+HER 11 28 (18) 51 18 trailing/ leading 9 15 (11) 24 7 / 4 10 (9) 25 12 leading 9 5 (4) 26 8 trailing 6 6 (4) 24 7 3 19 (15) 27 18 11 23 (20) 27 23 6 15 (12) 15 14 18 33 (18) 28 28 8 4 (3) 14 9 13 14 (9) 21 11 23 48 (28) 73 37 19 27 (14) 78 24 29 44 (37) 83 55
0.9.3 Results as a function of additional-jet multiplicity
In the final set of studies, we measure differential \ttbarproduction cross sections as a function of the multiplicity of additional jets in the events. These investigations provide an exemplary testing ground for the understanding of perturbative QCD. In particular, additional jets provide a second hard kinematic scale in the events, competing with the \ttbarinvariant mass, and thus give rise to a multiscale situation that provides a challenge for the perturbative expansion [100]. The definitions of the cross sections are given in Section 0.6.1. Additional jets are measured at the particle level, and the top quark and antiquark are either measured at the parton level in the full phase space or at the particle level in a fiducial phase space. The cross sections are shown in Figs. 30–39. The upper and lower plots in the figures depict the cross sections at the parton and particle levels, respectively. The values of model-to-data comparisons are listed in Tables 0.9.3–0.9.3 and the corresponding -values in Tables .13–.13.
We first discuss the additional-jet multiplicity distribution and its dependence on the minimum jet \ptrequirement. This distribution provides a direct view of the amount of higher-order QCD radiation in \ttbarevents. Figure 30 shows the cross section distributions for minimum \ptvalues of 40 and 100\GeV, respectively. The data are compared to the same three MC models as discussed above. The POW+PYT MC provides a good description of the distribution for the lower \ptvalue, though for the higher \ptvalue it starts to overshoot the data at larger jet multiplicities . The FxFx+PYT model exhibits a low accuracy, nearly independent of the \ptrequirement. Its cross section prediction is too low for and too high for , though it is reasonable for larger . The effect is underlined by large values. The description of the data by POW+PYT and FxFx+PYT is consistent for the parton- and particle-level cross sections, but for POW+HER a different picture emerges. This model clearly predicts too many extra jets for the parton-level cross section, but describes the data well at the particle level in a fiducial phase space. The parton level is defined for the full phase space. However, there might be a larger contribution from extra jets in POW+HER from events that are predominantly outside the particle-level fiducial phase space for the top quark and antiquark.
Next we investigate the top quark and \ttbarkinematics as a function of . This allows us to map the kinematic correlations to additional jets and to check whether description deficiencies seen, \egfor the top quark transverse momentum spectrum (Fig. 7), are associated with specific values. Figure 31 shows the distributions. For POW+PYT, the effect of a harder spectrum compared to that observed in data seems to be slightly enhanced in the lower two jet multiplicity bins , though a reasonable description is seen for higher multiplicities . The FxFx+PYT model predicts harder spectra, rather independent of . Among all considered predictions, POW+HER provides the best description of the distributions at the particle level, but fails at the parton level, where its large excess at is accompanied by a spectrum that falls too steeply. The distributions of are illustrated in Fig. 32. The data prefer slightly less-central distributions than the models, with weak dependence on . Figure 33 shows the distributions. The two variables are correlated since additional QCD radiation in the event leads to nonzero values of , as well as to values . For low jet multiplicities, , the POW+PYT model provides a reasonable description of the measured spectrum, though for it predicts a rise of the cross section that is too steep over the first three ranges from 0 to 100\GeV. The ratio of the FxFx+PYT model to the data always exhibits a positive slope over the first three ranges, irrespectively of . The POW+HER prediction mostly follows the POW+PYT model, except at high where it is a bit lower.
The distributions of are shown in Fig. 34. The shapes of these distributions are fairly well modeled by POW+PYT, for all ranges. The FxFx+PYT calculation clearly predicts much harder spectra for . The POW+HER provides a fair description at the \ttbarparticle level, but fails again at the parton level, where it predicts a much softer distribution for . Figure 35 displays the spectra. The shapes of these distributions are reasonably well described by the models, irrespectively of the range, but specific -dependent normalization problems remain for FxFx+PYT and POW+HER at the particle level. Figure 36 depicts the distributions. The description by the models is poor, which is also indicated by the large values with very small -values. For the first two bins there is a clear trend for the models to predict rapidity separations between top quark and antiquark that are too small, while in the last bin the trend is slightly reversed.
Figures 37–39 show triple-differential cross sections as functions of , , and . These cross sections were one of the highlights of our previous analysis [27], where it was demonstrated that they can be used for a simultaneous extraction of the top quark pole mass, \alpS, and the PDFs, with good precision. We measure the cross sections separately using two ( and ), three (, , and ), and four (, , and ) bins of for the particle-level jets. These cross sections are denoted as , , and , respectively. The cross sections are measured for the first time. A striking feature of the comparisons of the MC models to the data is a growing discrepancy when going from two to three and four bins of . The cross sections clearly exhibit the best power for distinguishing the models. Among all tested predictions, the POW+PYT model provides the overall best description. The FxFx+PYT calculation exhibits the same normalization problems versus that are visible in the spectrum (Fig. 30), coupled with a small trend to predict cross sections towards large that are too high, though the shapes are described reasonably well. The POW+HER model delivers a description at the particle level that is comparable to that of POW+PYT, but fails at the parton level where it overshoots the data for the and bins.
The comparisons of MC models and data can be summarized as follows. The POW+PYT calculation clearly provides the best description of the additional-jet multiplicity in \ttbarevents. The FxFx+PYT and POW+HER models fail, the former predicting too many events with and the latter too many events at the parton level in the full phase space with . There are rather weak kinematic correlations of the top quark and \ttbarrapidity spectra with , and the quality of the descriptions of the rapidity spectra by the models is rather independent of . As expected, there are larger kinematic correlations of top quark and \ttbartransverse momenta or \ttbarinvariant mass with , showing harder spectra for larger . All models exhibit different level of discrepancies for these distributions that depend on the jet multiplicity. For instance, there is an indication that the problem of harder distributions in the models is localized at small jet multiplicities. The theory-to-data values indicate a rather poor description of the data by the nominal model predictions for many of the discussed distributions. The values that include the prediction uncertainties for POW+PYT (see Tables 0.9.3–0.9.3) are significantly reduced, but the corresponding -values remain too small for a reasonable description of several measured observables.
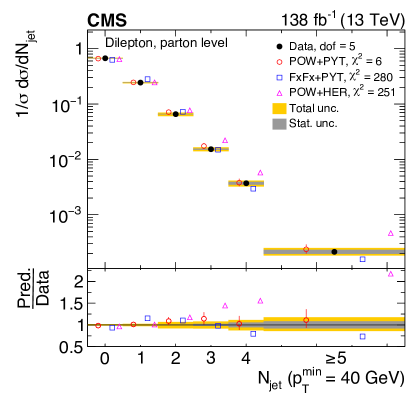
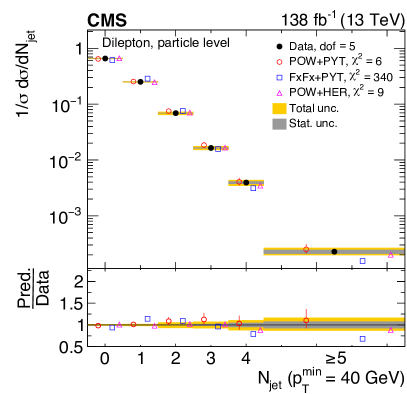
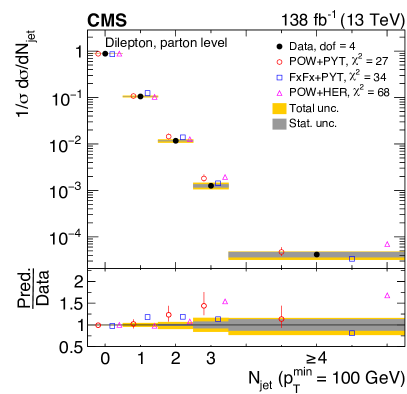

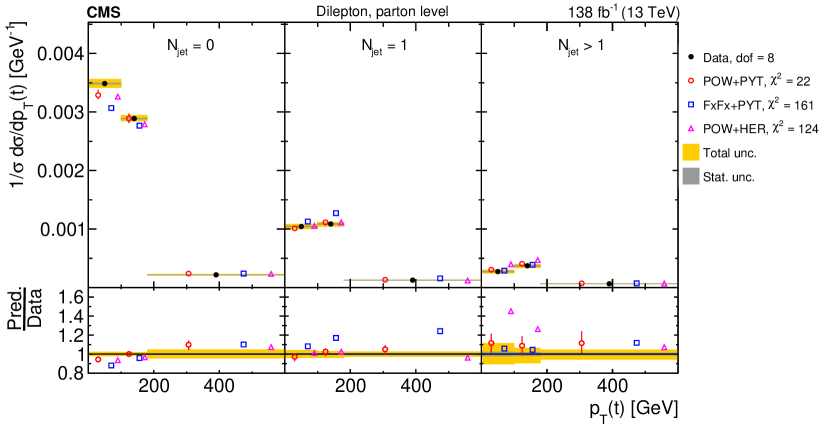
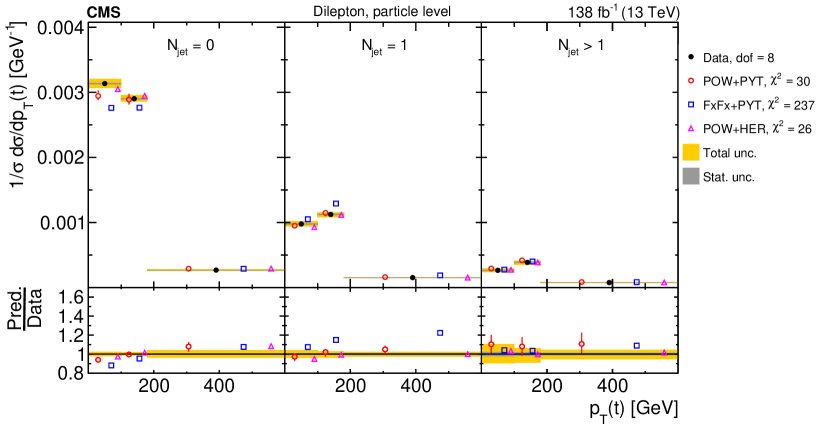
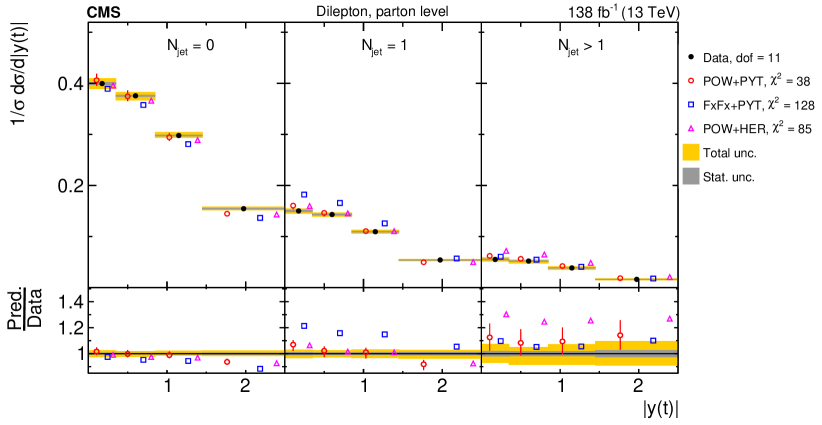

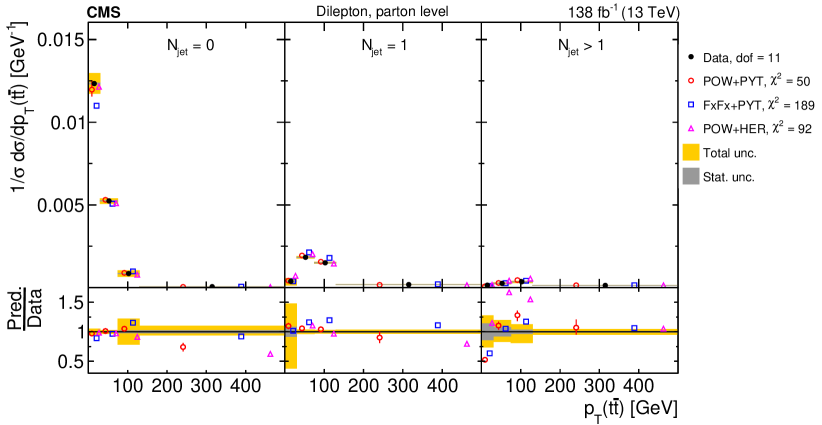
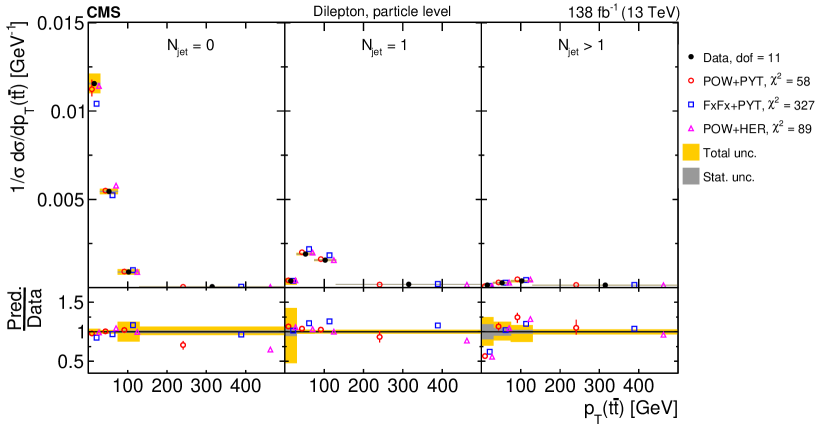
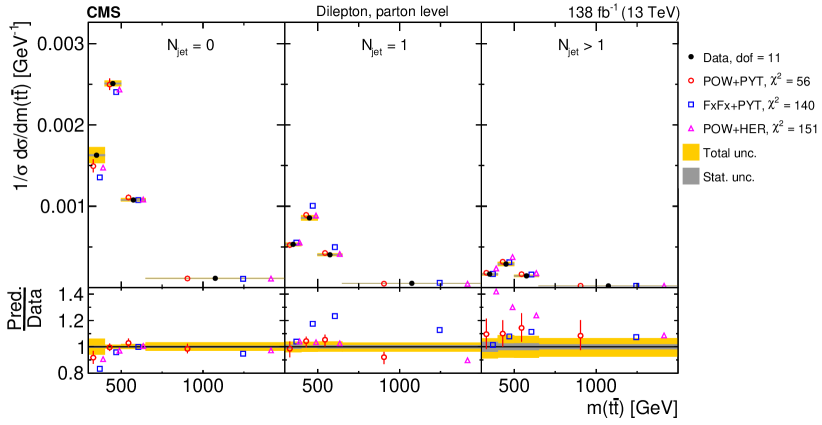
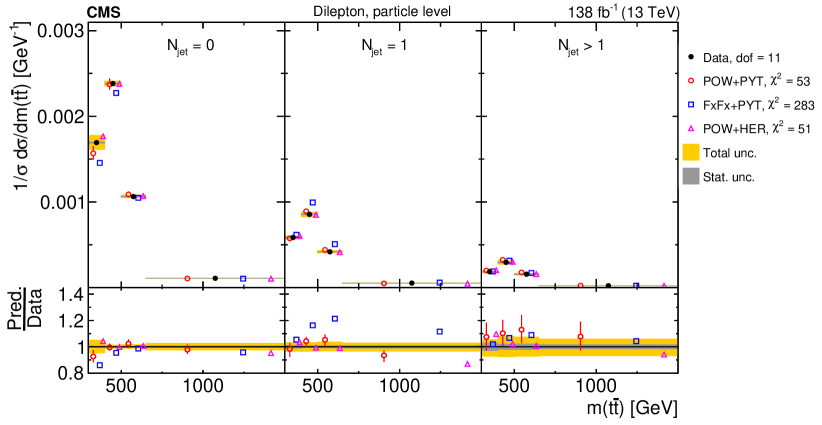

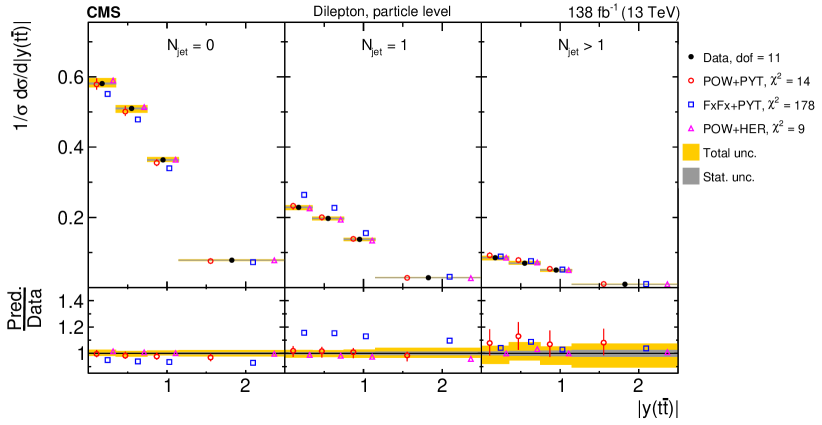

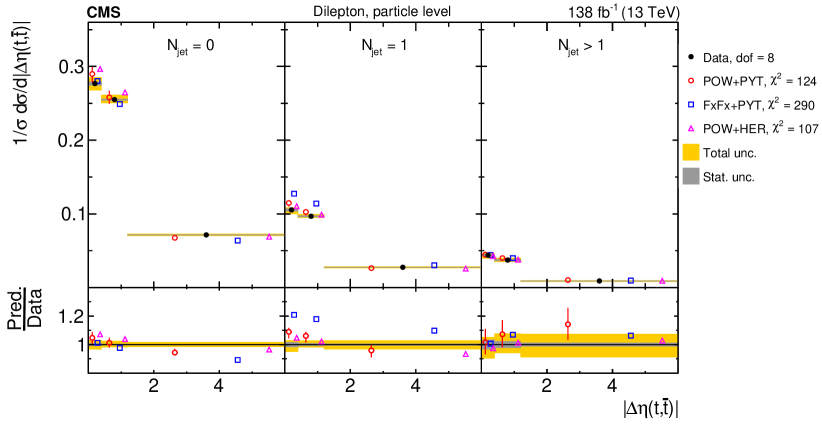
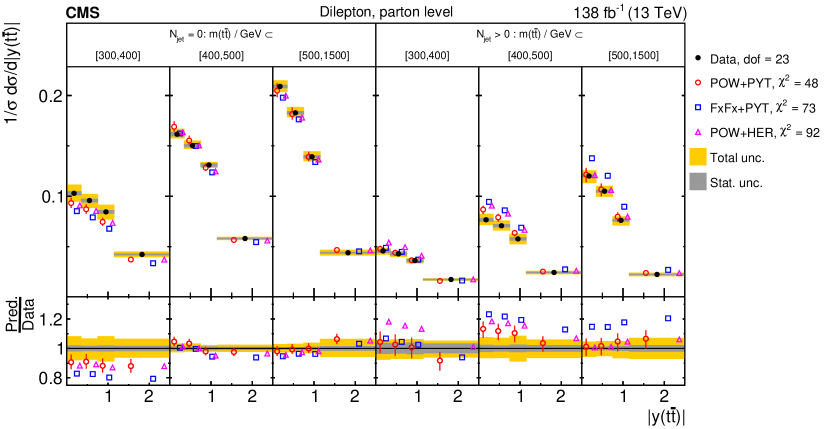
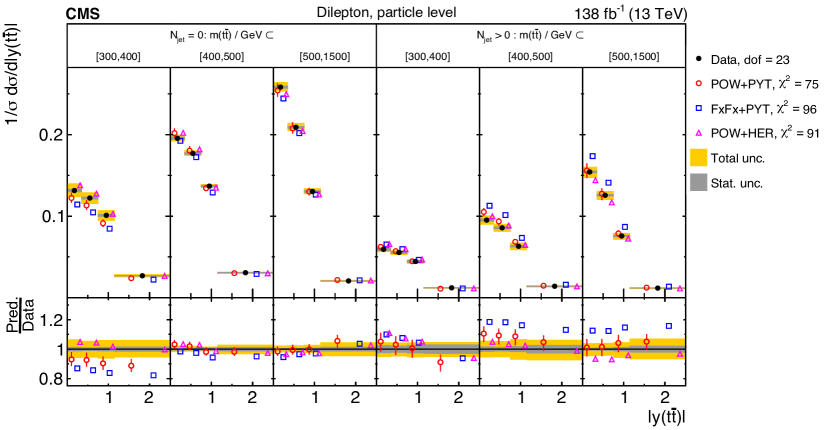
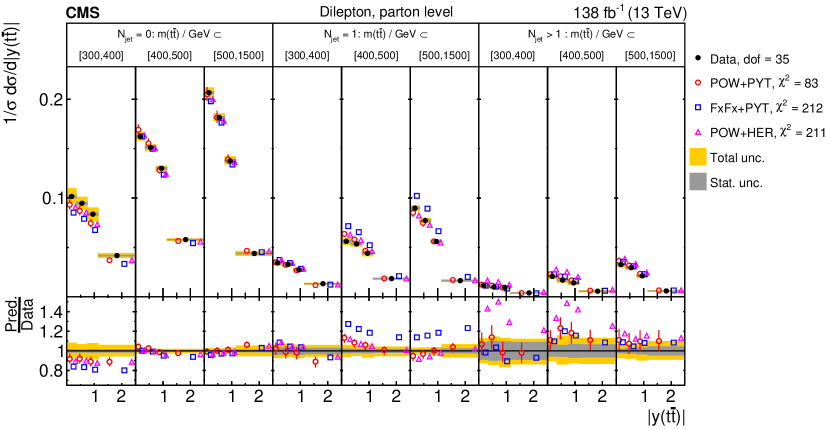
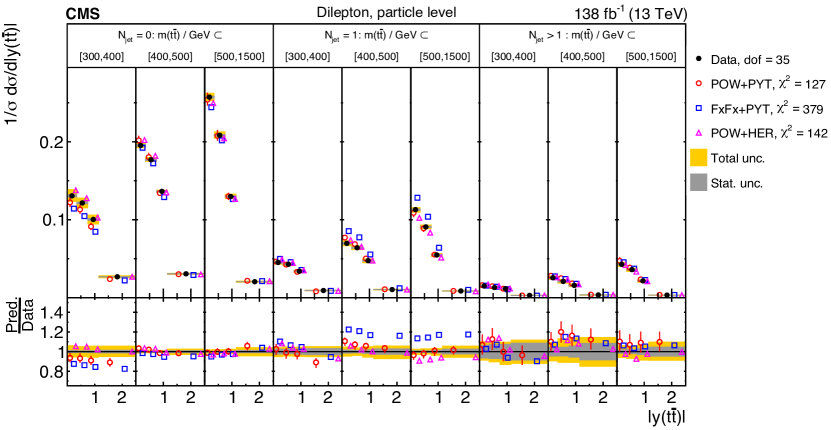
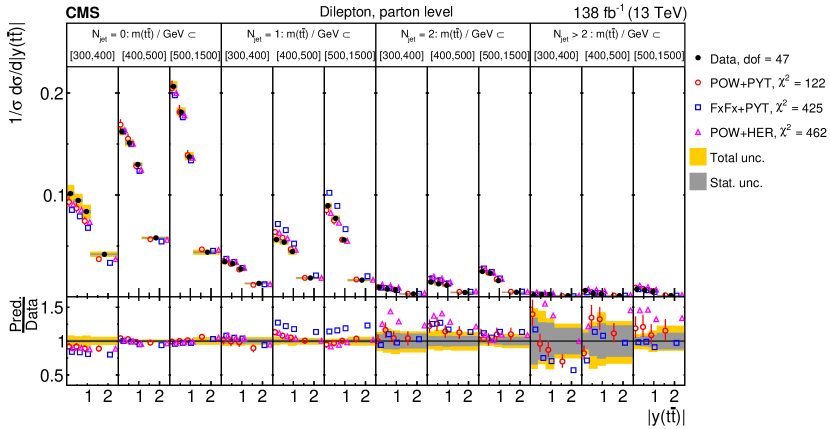
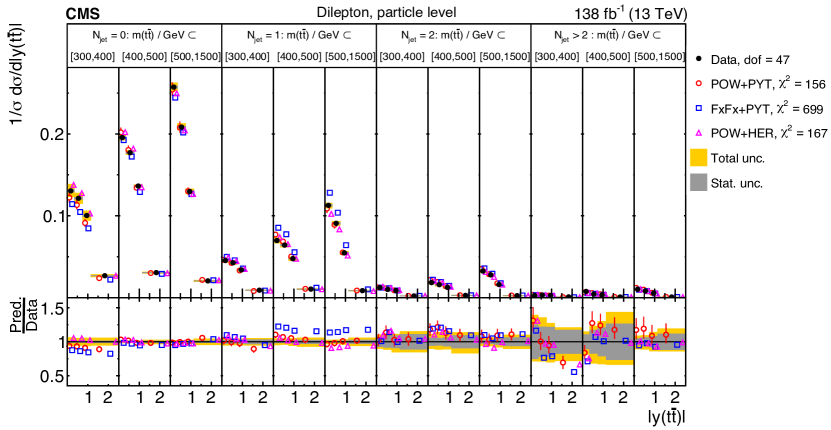
The values and dof of the measured normalized differential cross sections as a function of the additional-jet multiplicity in the events, at the parton level of the top quark and antiquark, are shown with respect to the predictions of various MC generators. The values are calculated taking only measurement uncertainties into account and excluding theory uncertainties. For POW+PYT, the values including theory uncertainties are indicated with the brackets (w. unc.). Cross section dof variables POW+PYT (w. unc.) FxFx+PYT POW+HER 5 6 (3) 280 251 4 27 (8) 34 68 8 22 (12) 161 124 11 38 (29) 128 85 11 50 (37) 189 92 11 56 (41) 140 151 11 11 (5) 121 60 8 84 (37) 189 143 23 48 (35) 73 92 35 83 (57) 212 211 47 122 (84) 425 462
The values and dof of the measured normalized differential cross sections as a function of the additional-jet multiplicity in the events, at the particle level of the top quark and antiquark, are shown with respect to the predictions of various MC generators. The values are calculated taking only measurement uncertainties into account and excluding theory uncertainties. For POW+PYT, the values including theory uncertainties are indicated with the brackets (w. unc.). Cross section dof variables POW+PYT (w. unc.) FxFx+PYT POW+HER 5 6 (3) 340 9 4 31 (8) 34 6 8 30 (13) 237 26 11 39 (24) 174 28 11 58 (37) 327 89 11 53 (35) 283 51 11 14 (5) 178 9 8 124 (41) 290 107 23 75 (45) 96 91 35 127 (69) 379 142 47 156 (94) 699 167
0.9.4 Comparisons to higher-order theoretical predictions
In this Section, the measured cross sections are compared to the following calculations of beyond-NLO precision in QCD:
-
•
: An approximate next-to-NNLO calculation [2, 3], based on the resummation of soft-gluon contributions at NNLL accuracy in the moment-space approach. This prediction is only available for the , , and cross sections. The renormalization and factorization scales are set to for the distributions and to \mTfor and . Here, denotes the top quark mass and \mTis defined as .
- •
-
•
Stripper (NNLO): A calculation with full NNLO precision in QCD using the Stripper framework [108, 8, 109, 110, 5]. The dynamic scales are set to . For parton level cross sections as functions of the \ttbarand top quark kinematic observables, the Stripper predictions are expected to be identical to the results obtained with Matrix. The Stripper calculation also provides cross sections at NNLO accuracy for the process [8], that can be compared to the particle level measurements obtained in this analysis as functions of the \ttbar, top quark, and lepton and \PQbjet kinematic variables.
-
•
MiNNLOPS (NNLOPS): A prediction with full NNLO precision in QCD, complemented with parton showers and computed using the \POWHEG-BOX-V2 [39]. These calculations are obtained using the MiNNLOPS method [111, 112, 113], which supplements the MiNLO prescription [114, 115] with the missing pieces to reach NNLO accuracy for inclusive observables. The for the two powers of \alpSis set to , and the scale of the modified logarithms is set to half of this value. Parton showering is simulated with \PYTHIA8, and includes the effects of underlying event and hadronization.
In all predictions, the top quark mass is set to and the NNPDF3.1 NNLO PDF set [36] is used. In the following, the calculations are collectively referred to as theoretical predictions.
The comparisons of the theoretical predictions to the measured normalized differential cross sections are shown in Figs. 40–62. The predictions are depicted as symbols with vertical bars representing missing higher-order uncertainties, as estimated from six variations of and , following the same variation procedure as described in Section 0.8.2. These uncertainties are denoted in the following as “theory scale uncertainties”. The predictions from POW+PYT are also shown, serving as a reference for the description by the MC models, discussed in Sections 0.9.1 and 0.9.2. The values of model-to-data comparisons are listed in Tables 0.9.4–0.9.4, and the corresponding -values can be found in Tables .13–.13. The values are provided only taking measurement uncertainties into account and also including the full (scale) uncertainties for the POW+PYT (beyond-NLO) predictions. The scale uncertainties of the beyond-NLO predictions are found to be quite asymmetric in some cases; this feature is taken into account by using the averaging procedure described in Appendix .11 when constructing the covariance matrix of the calculation. Comparisons of the predictions to the measured absolute cross sections are provided in Appendix .12.2.
For the cross sections as functions of the \ttbarand top quark kinematic observables at the parton and particle levels, shown in Figs. 40–55, the theoretical models provide descriptions of the data that are similar or improved in quality, compared to POW+PYT, with a few exceptions. For the and distributions shown in Fig. 40, the Matrix, Stripper, and MiNNLOPS models provide a good description of the data, with no discernible trend towards a distribution that is harder, as exhibited by POW+PYT. For the calculation, some wiggles are visible in the distribution of the ratio to the data, leading to a rather poor . The Stripper model describes the data also at the particle level reasonably well. The theoretical models also provide a reasonable description of other measured cross sections related to top quark \pt, such as (Fig. 44), and (Fig. 47), clearly improving upon POW+PYT. For observables related to the top quark rapidity and the rapidity and mass of the \ttbarsystem, the trends between data and theoretical calculations are mostly similar to those of POW+PYT. Exemplary cases are the rapidity spectra and , depicted in Fig. 41, where the models exhibit rapidity distributions that are more central than what is observed in data, and the cross sections (Fig. 49), where the predictions overshoot the data in the high- region at large .
For cross sections as functions of and , shown in Figs. 42 and 43, the theoretical calculations exhibit large scale uncertainties, reflecting the sensitivity to higher order QCD effects, and the central predictions overall fail to provide a good data description. Similar observations can be made for the multi-differential cross sections involving these two kinematic variables.
Summarizing, the beyond-NLO theoretical predictions provide descriptions of the data that are of similar or improved quality, compared to POW+PYT, except for some of the kinematic distributions where the theoretical scale uncertainties are large. This is also reflected by the theory-to-data values that are often quite large when only measurement uncertainties are taken into account, but are reduced to reasonably small values when the theory scale uncertainties are also included.
For the differential cross sections as functions of lepton and \PQbjet kinematic variables at the particle level, shown in Figs. 56–62, the Stripper calculation provides descriptions that are overall of similar quality compared to POW+PYT. One exception is the distribution, where Stripper clearly predicts too many events in the lowest mass bin.
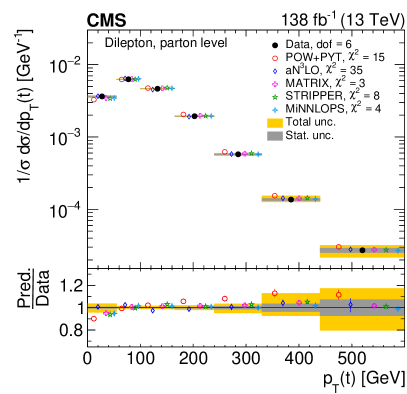
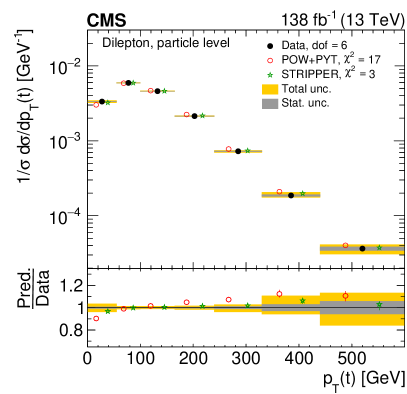

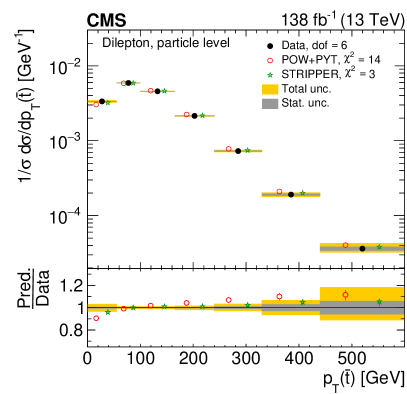
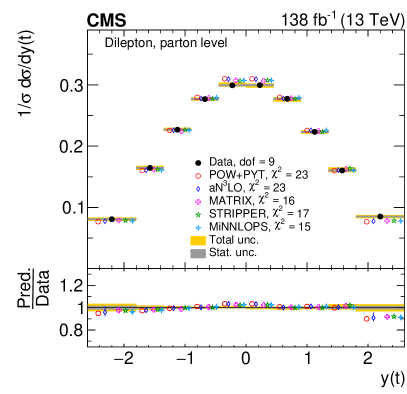
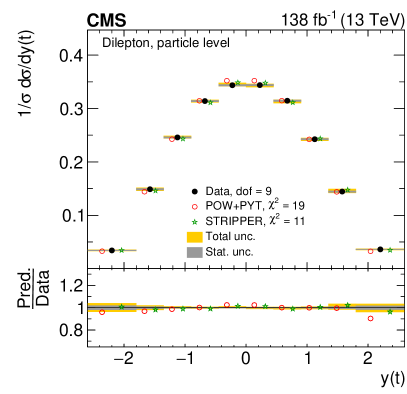
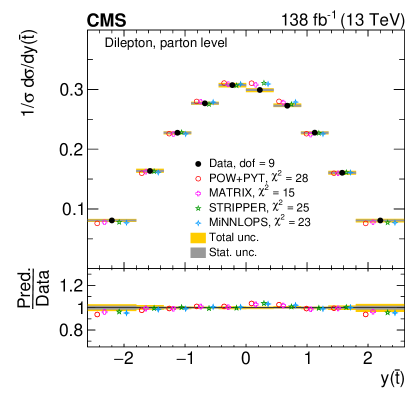
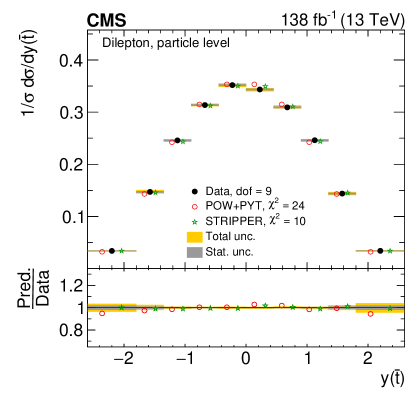
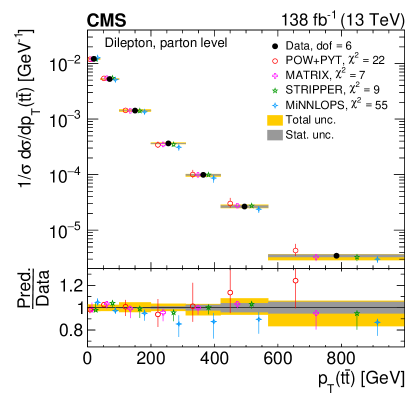

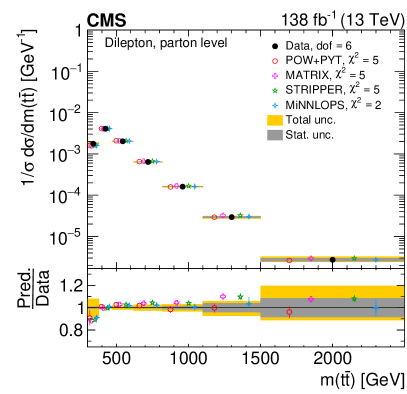
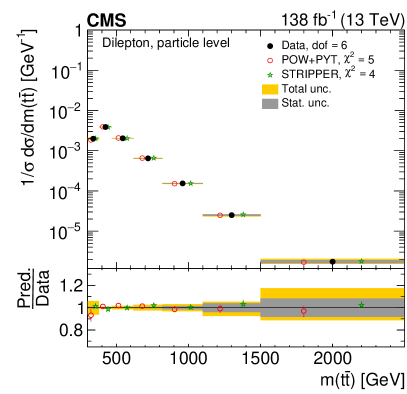
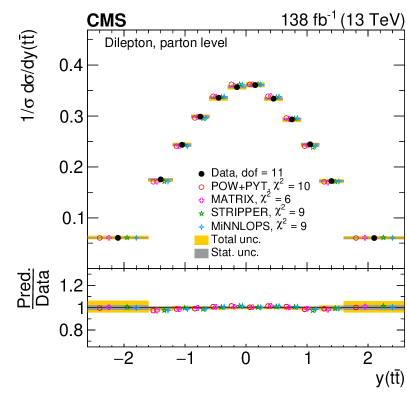
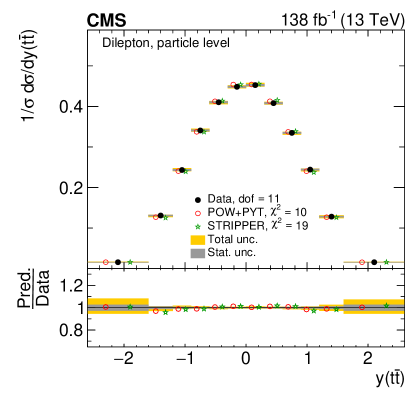
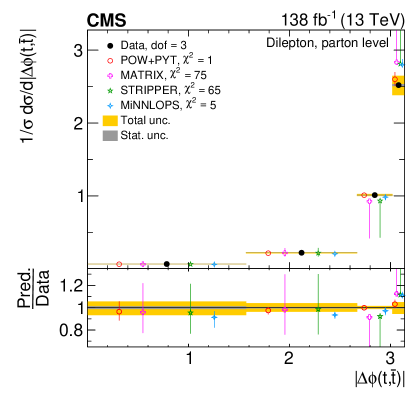


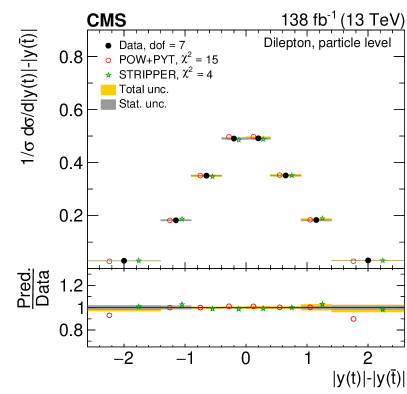
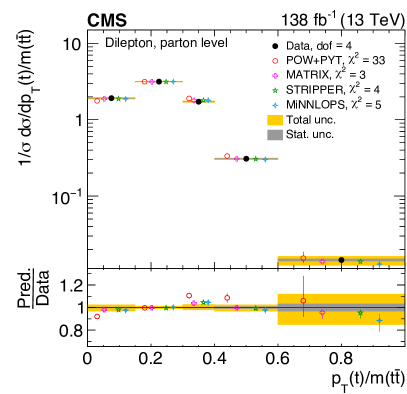
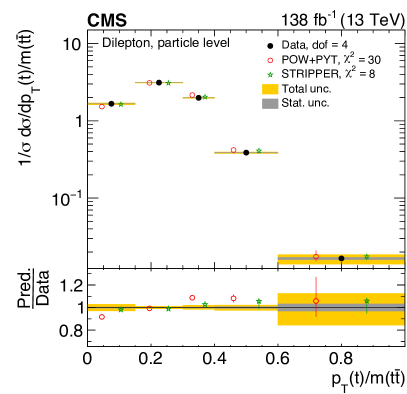
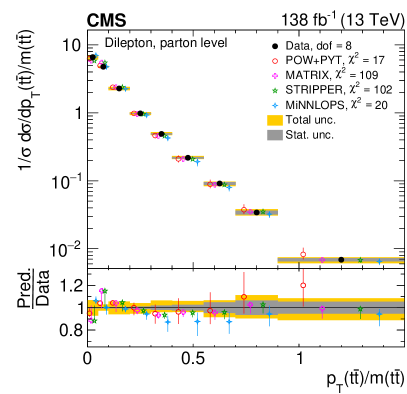


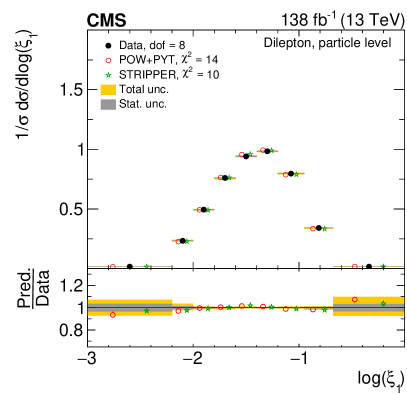
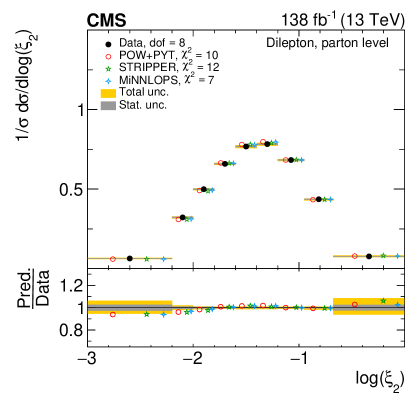

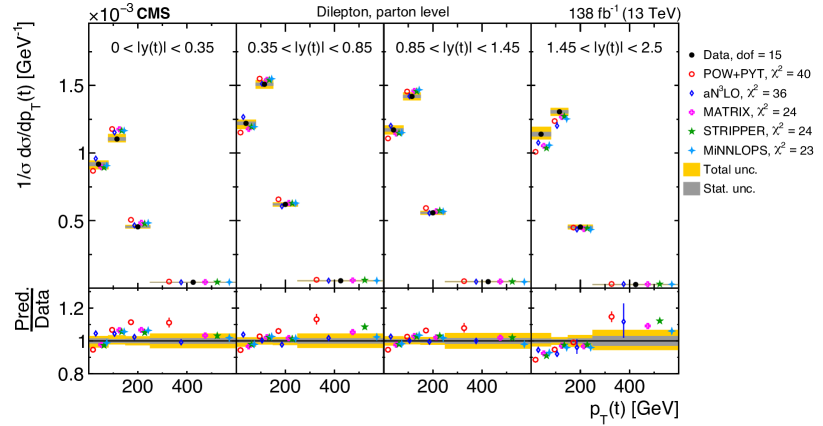
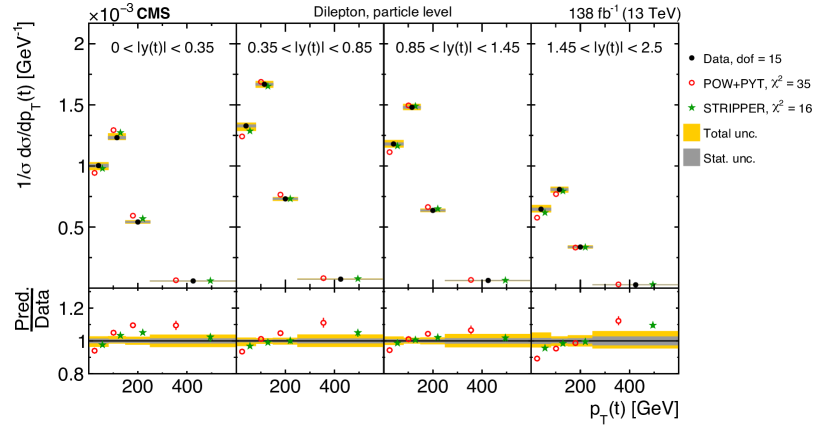
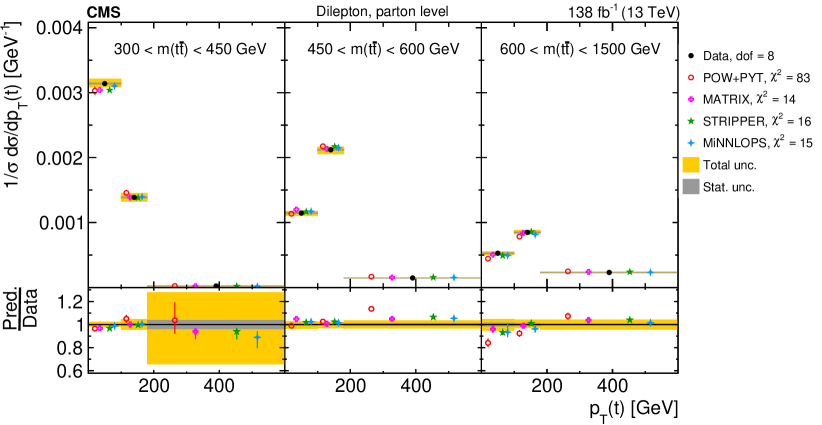
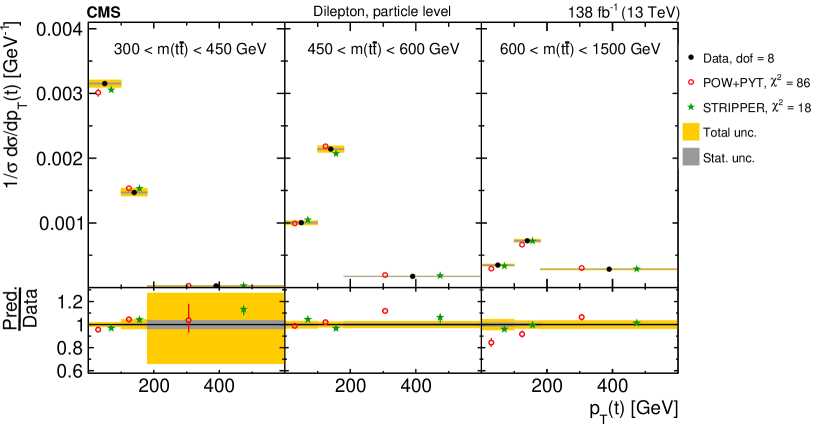
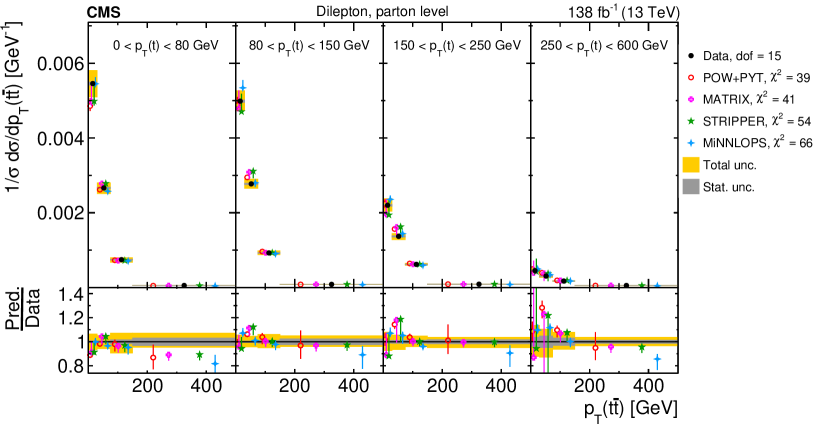
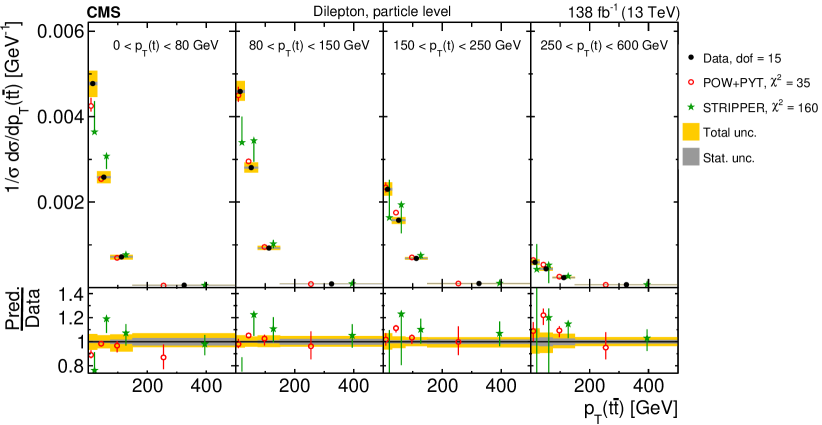
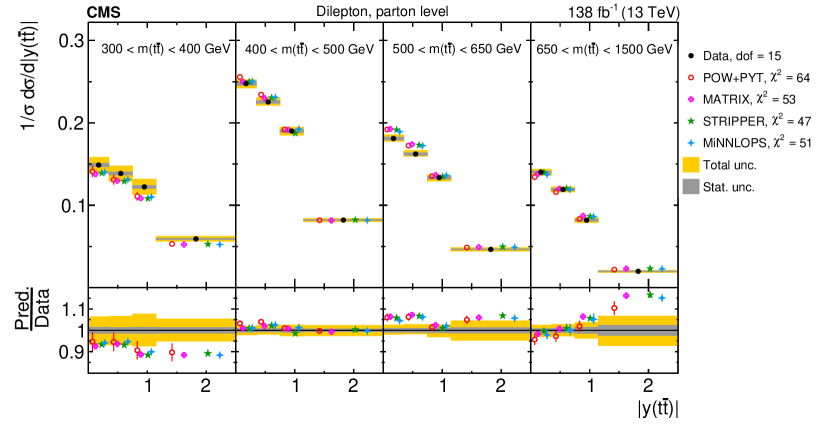
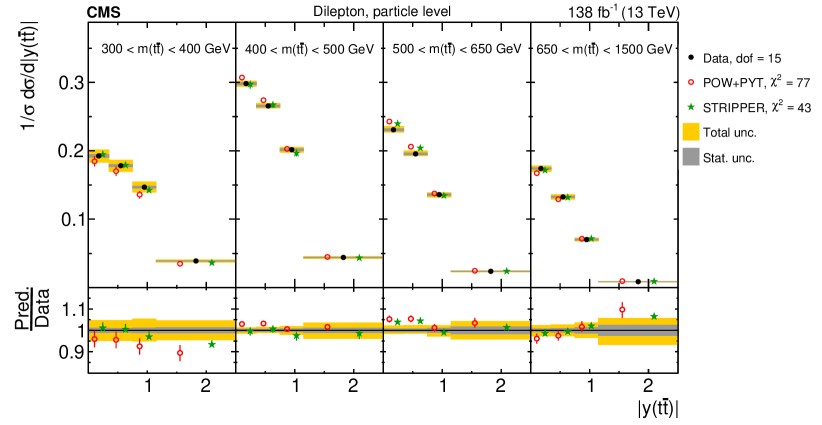
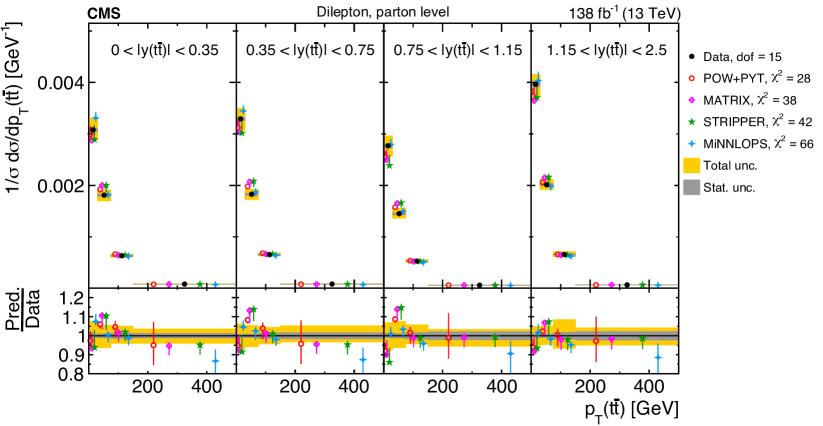
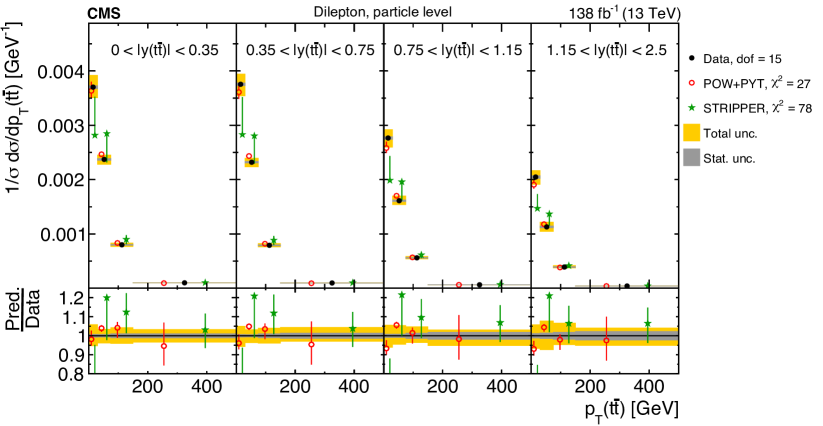
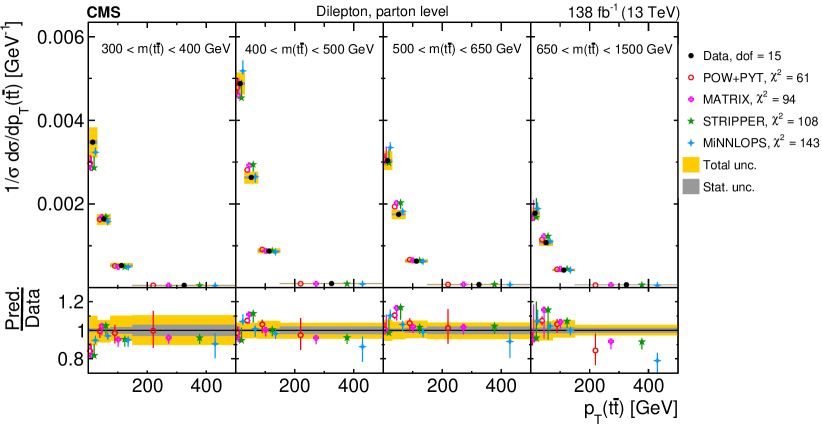
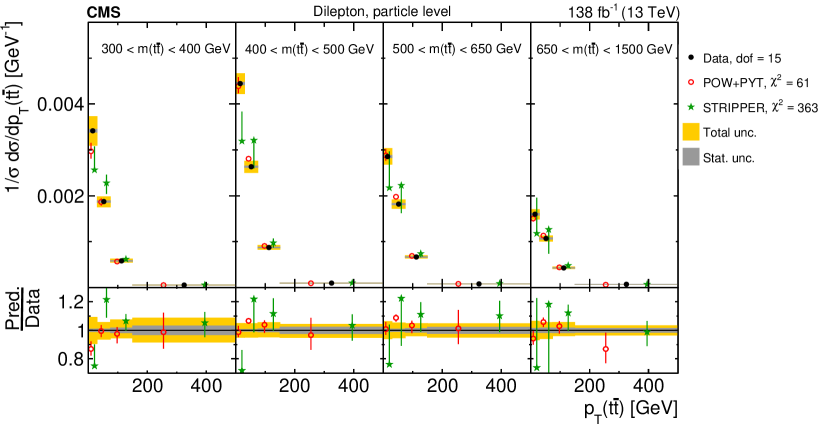
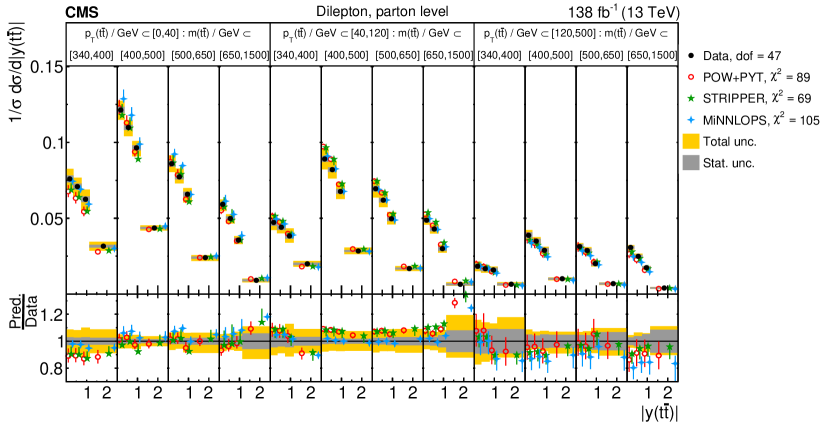
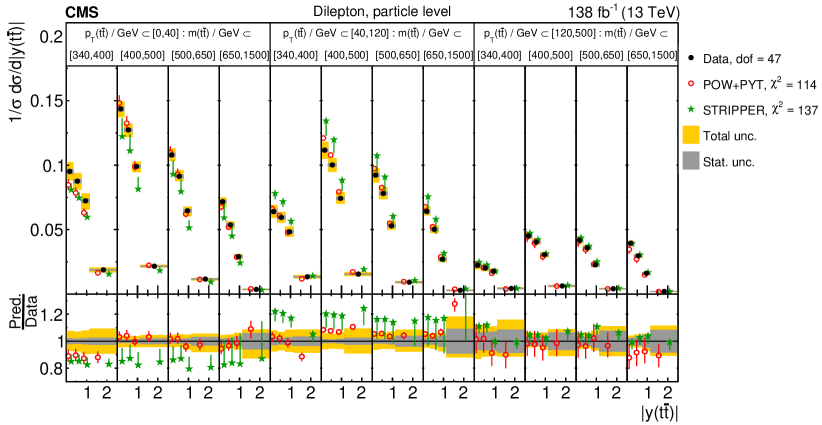

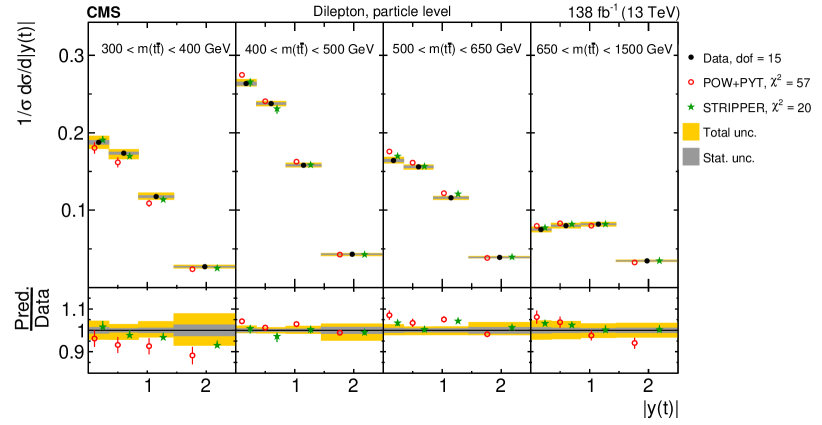
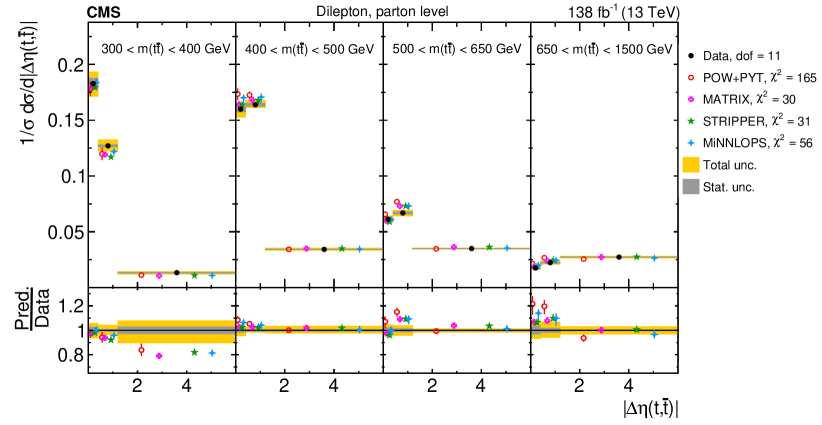
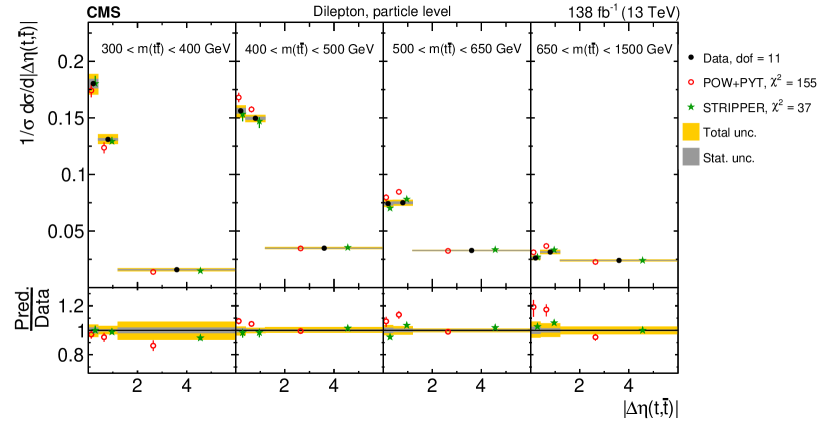
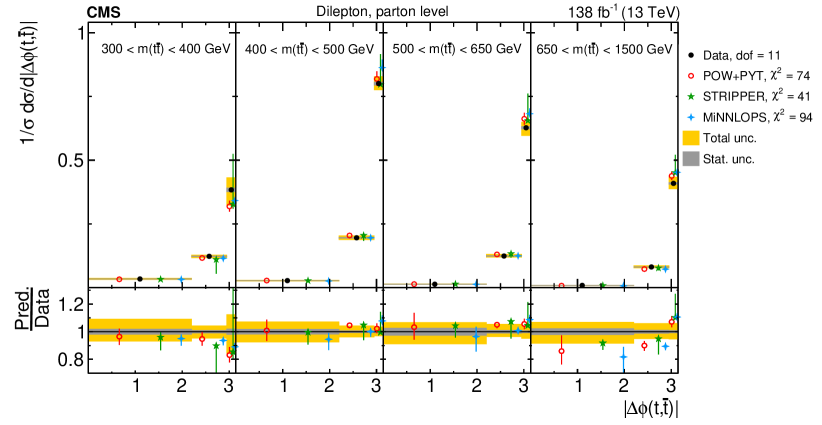
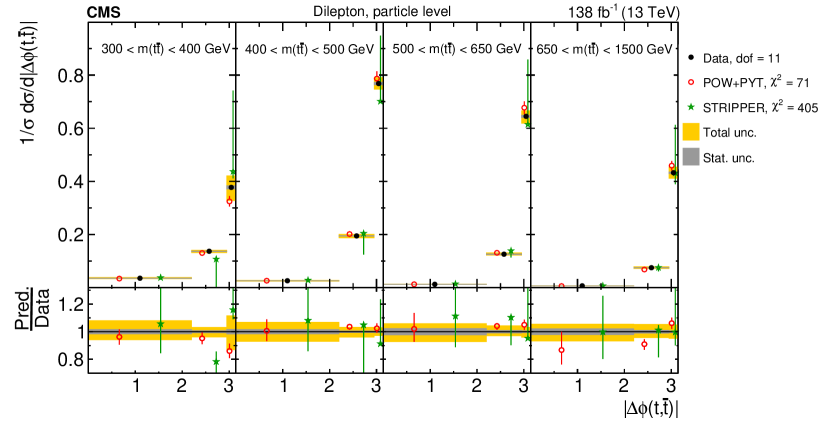
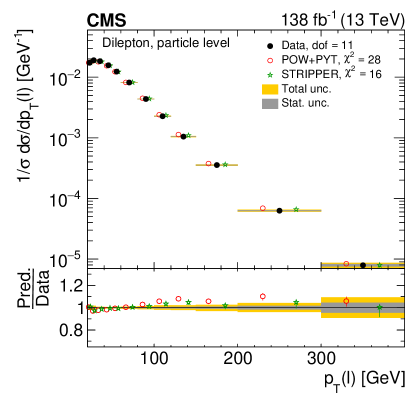
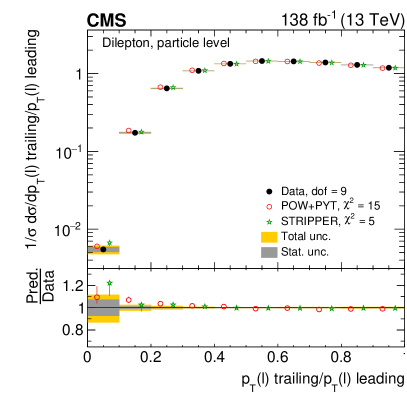
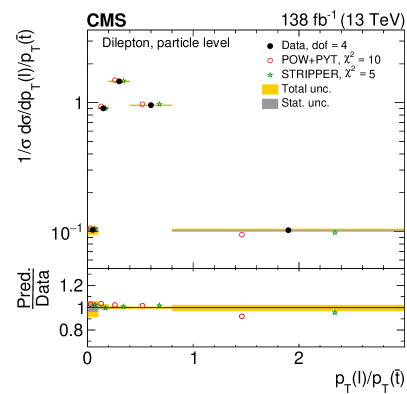
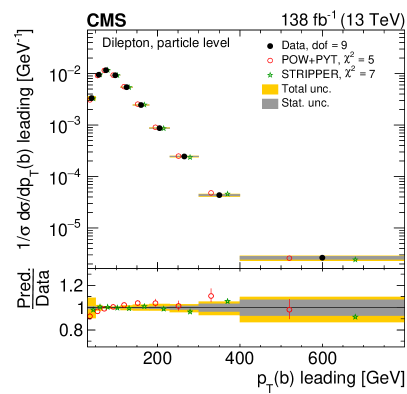
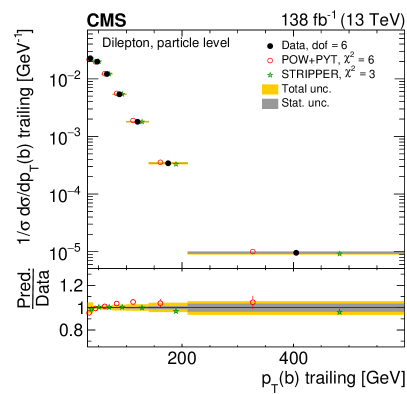
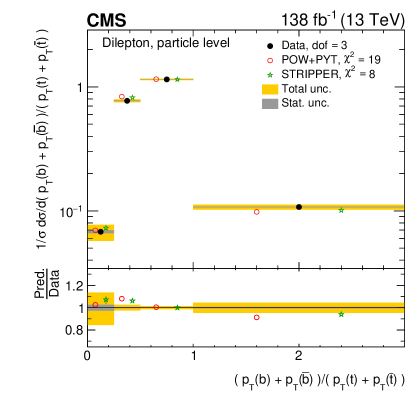
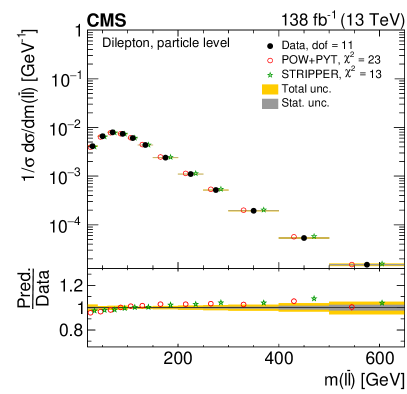
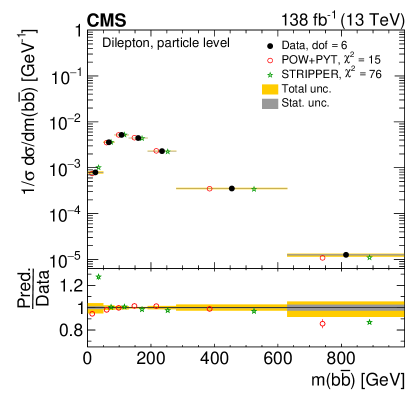
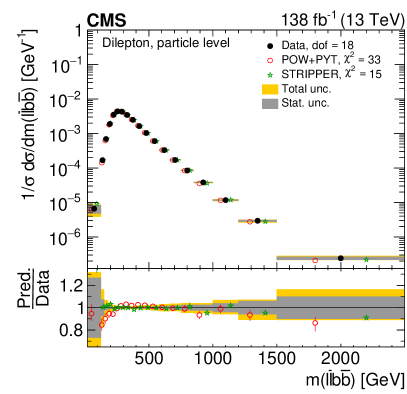

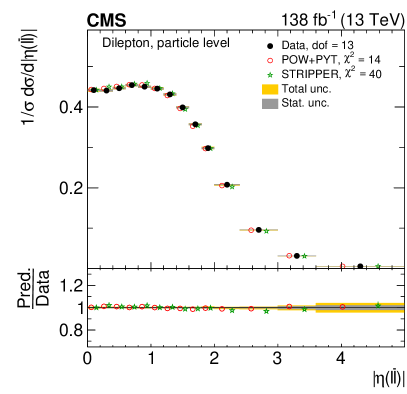
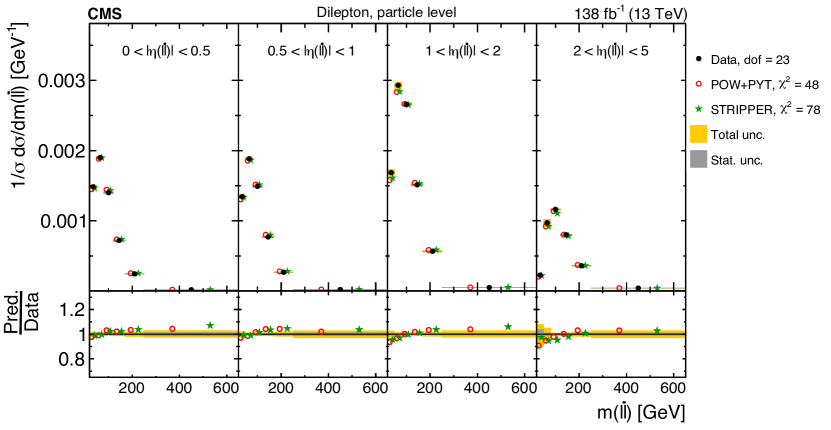
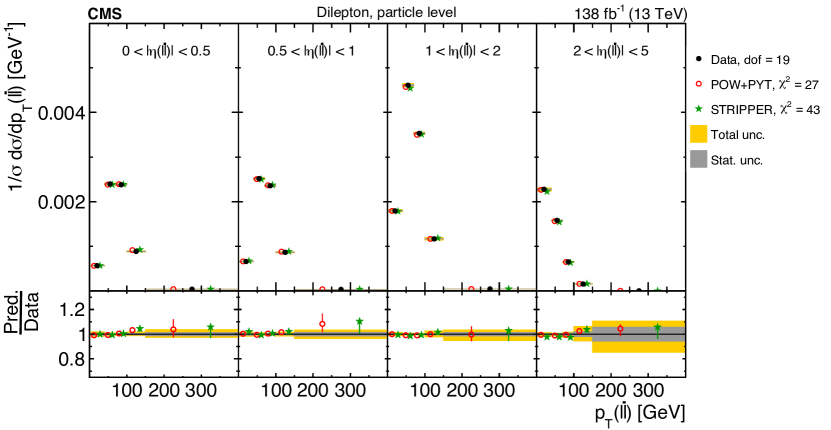
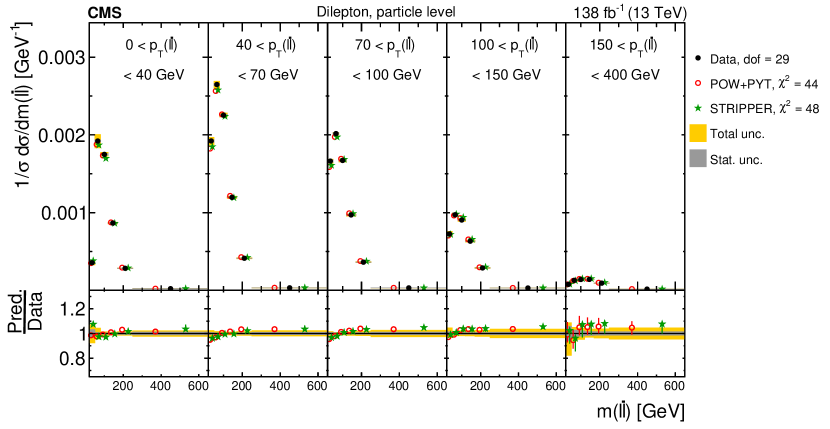
The values and dof of the measured normalized single-differential cross sections for \ttbarand top quark kinematic observables at the parton level are shown with respect to the \POWHEG+\PYTHIA8 (‘POW-PYT’) simulation and various theoretical predictions with beyond-NLO precision. The values are calculated taking only measurement uncertainties into account and excluding theory uncertainties. The corresponding values including theory uncertainties are indicated with the brackets (w. unc.). Cross section dof variables POW+PYT (w. unc.) (w. unc.) Matrix (w. unc.) Stripper (w. unc.) MiNNLOPS (w. unc.) 6 15 (11) 35 (29) 3 (3) 8 (5) 4 (4) 6 13 (9) \NA 4 (3) 10 (9) 5 (5) 9 23 (20) 23 (12) 16 (16) 17 (16) 15 (13) 9 28 (25) \NA 15 (13) 25 (24) 23 (17) 6 22 (7) \NA 7 (2) 9 (3) 55 (14) 11 10 (8) \NA 6 (6) 9 (9) 9 (9) 6 5 (3) \NA 5 (4) 5 (4) 2 (2) 3 1 (0) \NA 75 (0) 65 (1) 5 (4) 7 16 (9) \NA 2 (2) 3 (3) 12 (9) 4 33 (20) \NA 3 (3) 4 (4) 5 (2) 8 17 (6) \NA 109 (9) 102 (10) 20 (5) 8 14 (10) \NA \NA 15 (14) 12 (11) 8 10 (7) \NA \NA 12 (11) 7 (7)
The values and dof of the measured normalized single-differential cross sections for \ttbarand top quark kinematic observables at the particle level are shown with respect to the \POWHEG+\PYTHIA8 (‘POW-PYT’) simulation and the Stripper NNLO calculation. The values are calculated taking only measurement uncertainties into account and excluding theory uncertainties. The corresponding values including theory uncertainties are indicated with the brackets (w. unc.). Cross section dof variables POW+PYT (w. unc.) Stripper (w. unc.) 6 17 (12) 3 (2) 6 14 (9) 3 (2) 9 19 (16) 11 (11) 9 24 (20) 10 (9) 6 21 (7) 83 (8) 11 10 (7) 19 (14) 6 5 (3) 4 (2) 3 1 (0) 1076 (2) 7 15 (10) 4 (3) 4 30 (20) 8 (4) 8 18 (7) 144 (7) 8 14 (9) 10 (10) 8 9 (6) 9 (9)
The values and dof of the measured normalized multi-differential cross sections for \ttbarand top quark kinematic observables at the parton level are shown with respect to the \POWHEG+\PYTHIA8 (‘POW-PYT’) simulation and various theoretical predictions with beyond-NLO precision. The values are calculated taking only measurement uncertainties into account and excluding theory uncertainties. The corresponding values including theory uncertainties are indicated with the brackets (w. unc.). Cross section dof variables POW+PYT (w. unc.) (w. unc.) Matrix (w. unc.) Stripper (w. unc.) MiNNLOPS (w. unc.) 15 40 (31) 36 (36) 24 (24) 24 (24) 23 (22) 8 83 (35) \NA 14 (12) 16 (13) 15 (8) 15 39 (21) \NA 41 (36) 54 (53) 66 (29) 15 64 (42) \NA 53 (52) 47 (46) 51 (40) 15 28 (15) \NA 38 (36) 42 (41) 66 (25) 15 61 (43) \NA 94 (83) 108 (95) 143 (34) 47 89 (64) \NA \NA 69 (68) 105 (77) 15 61 (37) \NA 35 (34) 30 (29) 53 (45) 11 165 (31) \NA 30 (29) 31 (30) 56 (17) 11 74 (47) \NA \NA 41 (18) 94 (67)
The values and dof of the measured normalized multi-differential cross sections for \ttbarand top quark kinematic observables at the particle level are shown with respect to the \POWHEG+\PYTHIA8 (‘POW-PYT’) simulation and the Stripper NNLO calculation. The values are calculated taking only measurement uncertainties into account and excluding theory uncertainties. The corresponding values including theory uncertainties are indicated with the brackets (w. unc.). Cross section dof variables POW+PYT (w. unc.) Stripper (w. unc.) 15 35 (25) 16 (16) 8 86 (36) 18 (9) 15 35 (19) 160 (109) 15 77 (40) 43 (42) 15 27 (18) 78 (40) 15 61 (36) 363 (146) 47 114 (68) 137 (82) 15 57 (26) 20 (18) 11 155 (30) 37 (21) 11 71 (42) 405 (334)
The values and dof of the measured normalized single-differential cross sections for lepton and \PQb-jet kinematic observables at the particle level are shown with respect to the \POWHEG+\PYTHIA8 (‘POW-PYT’) simulation and the Stripper NNLO calculation. The values are calculated taking only measurement uncertainties into account and excluding theory uncertainties. The corresponding values including theory uncertainties are indicated with the brackets (w. unc.). Cross section dof variables POW+PYT (w. unc.) Stripper (w. unc.) 11 28 (18) 16 (16) trailing/ leading 9 15 (11) 5 (5) / 4 10 (9) 5 (5) leading 9 5 (4) 7 (6) trailing 6 6 (4) 3 (1) 3 19 (15) 8 (8) 11 23 (20) 13 (12) 6 15 (12) 76 (71) 18 33 (18) 15 (14) 8 4 (3) 5 (3) 13 14 (9) 40 (21) 23 48 (28) 78 (59) 19 27 (14) 43 (27) 29 44 (37) 48 (48)
0.9.5 Comparisons to \POWHEG+\PYTHIA8 predictions using different PDFs
In this subsection the sensitivity of the measured differential \ttbarproduction cross sections to the PDFs is assessed. The \ttbarproduction at the LHC is known to be particularly sensitive to the gluon density at higher proton momentum fractions . In the previous CMS analyses [19, 27], systematic investigations were performed in which different sets of \ttbarkinematic spectra were included in PDF fits and their impact evaluated. A particularly large sensitivity was observed in Ref. [19] for the cross sections measured at , leading to a strong constraint on the gluon density at values around 0.3. In the present analysis, the PDF sensitivity is assessed by comparing kinematic spectra of the top quark or the \ttbarsystem with the \POWHEG+\PYTHIA8 predictions, evaluated with a number of different PDF sets: NNPDF3.1 [36], CT14 [116], ABMP16 [117], MMHT2014 [118], and HERAPDF2.0 [119]. For the NNPDF3.1 PDFs, both the NNLO (used in the nominal simulation) and NLO variants are studied, while only the NLO versions are taken for all other sets. The PDFs differ in the input data and methodologies that were used to extract them, as discussed elsewhere [120, 121].
Figure 63 shows the measured normalized single-differential cross sections, defined at the parton level, as functions of , , , and , and compared to the predictions obtained with different PDF sets. Most of the PDFs provide a similar description of the data, except HERAPDF2.0 NLO that describes the distribution well but exhibits clear shape deviations for the other spectra, leading to large values. In Fig. 64, the , , and cross section distributions are shown. As discussed above, in the LO QCD picture the and variables represent the proton momentum fractions carried by the two partons entering the hard interaction. The HERAPDF2.0 NLO prediction undershoots the data near the smallest and largest values of these observables, which may give a hint of a possibly wrong dependence of the gluon density in this PDF set. For , all PDFs again provide data descriptions of similar quality, except HERAPDF2.0 NLO, that predicts too few events towards large and values. The particularly large for HERAPDF2.0 NLO for this distribution indicates an enhanced PDF sensitivity for this double-differential cross section. Summarizing, the differential spectra of the top quark and the \ttbarsystem clearly show sensitivity to the PDFs and, therefore, it will be useful to include the corresponding data in future global PDF fits.
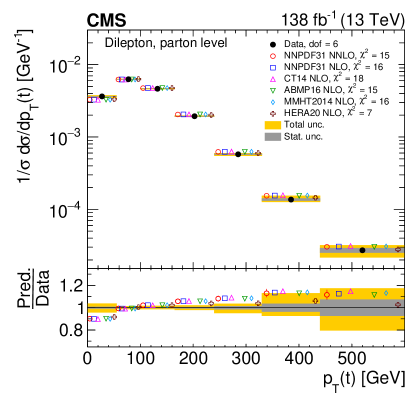
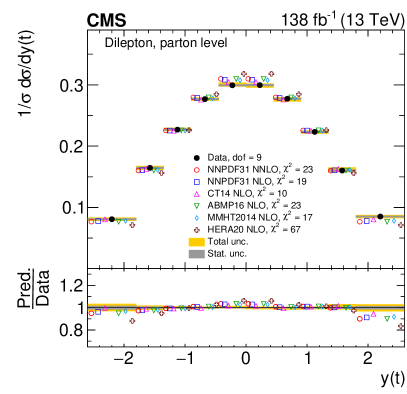
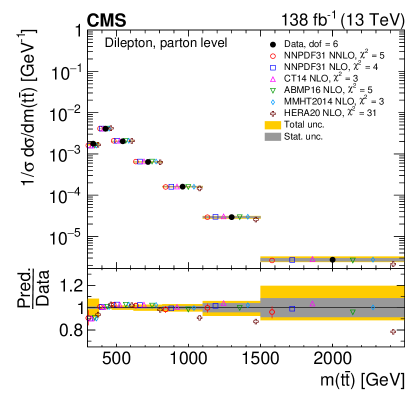

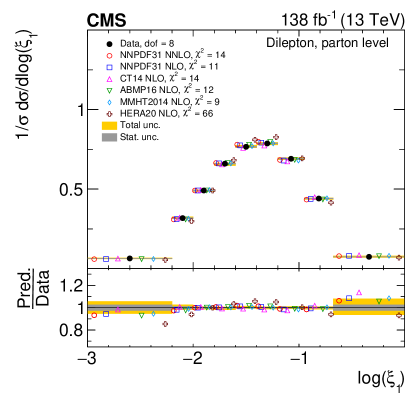
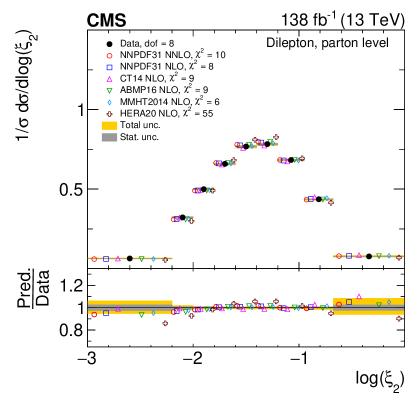
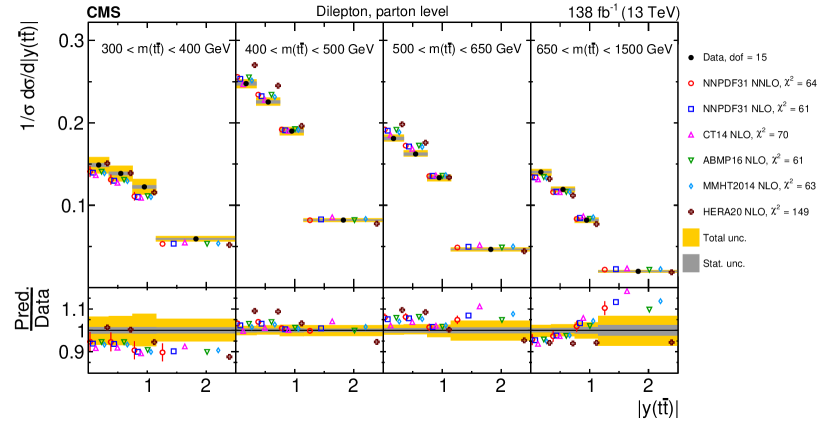
0.10 Summary
A measurement of differential top quark pair (\ttbar) production cross sections in proton-proton collisions at \TeVwas presented, performed with events containing two oppositely charged leptons (electrons or muons). The data used in this analysis were recorded in the years 2016 through 2018 with the CMS detector at the LHC and correspond to an integrated luminosity of 138 \fbinv. Differential cross sections are measured as functions of kinematical observables of the \ttbarsystem, the top quark and antiquark and their decay products, and the total number of additional jets in the event not originating from the \ttbardecay. The measurements are performed as functions of single observables, or simultaneously as functions of two or three kinematic variables. The differential cross sections are defined both with particle-level objects in a fiducial phase space close to that of the detector acceptance and with parton-level top quarks in the full phase space. Overall, both the statistical and the systematic uncertainties in the measurements are improved by a factor of about two compared to the previous analyses [26, 27] which are based on the 2016 data set.
Predictions of several next-to-leading-order (NLO) Monte Carlo (MC) event generators that differ in the hard matrix element, parton shower, and hadronization models were compared to the data. The predictions of these MC models, without taking theoretical uncertainties into account, generally fail to describe many of the measured cross sections in their full kinematic range. The predicted transverse momentum \ptdistributions of the top quark and antiquark are harder than observed in the data, and the rapidity distributions are more central. The invariant mass and rapidity distributions of the \ttbarsystem are reasonably well described by the models overall. The predictions for the \ttbartransverse momentum distribution differ from the data even more than the top quark and antiquark distributions do; none of them provides a good description of the data. Double- and triple-differential cross sections show large model-to-data discrepancies, for instance the effect of a harder top quark \ptspectrum in the models is pronounced at high . Differential cross sections as functions of kinematic observables of the leptons and \PQbjets originating from the decay of the top quark and antiquark are measured with high precision. Overall, the observed trends for these objects follow those for the top quarks and antiquarks, with the models predicting harder \ptspectra than seen in the data. For the leptons, this effect is somewhat enhanced and furthermore the dilepton invariant mass spectrum is harder in the models than in the data. The distribution of the multiplicity of additional jets in \ttbarevents shows varying level of agreement between data and the models. When considered as a function of jet multiplicity, the evolution of the shapes of \ttbar, top quark and antiquark kinematic distributions is different for the models and for data. There is an indication that the trend of harder distributions in the models is localized at small jet multiplicities.
Selected kinematic distributions were also compared to a variety of theoretical predictions beyond NLO precision. For observables of the top quark and the \ttbarsystem, these predictions provide descriptions of the data that are of similar or improved quality, compared to the MC model best describing each variable, except for some of the kinematic spectra for which the theory scale uncertainties are large. For observables associated with the leptons and \PQbjets, the quality of the tested next-to-NLO model is on average comparable to but not better than that of the NLO MC models. Comparing several kinematic distributions of the top quark and the \ttbarsystem to NLO MC models using various parton distribution function (PDF) sets, clear differences are observed which indicate a sensitivity to PDFs that could be exploited in future PDF fits.
For each distribution, the quality of the description of the data by the models has been assessed with a test statistic. When only the measurement uncertainties are taken into account in the calculation (\ieneglecting the uncertainties on the predictions), the -values obtained from the tests are in general close to zero, pointing to a poor description of the data by the nominal models. The inclusion of the uncertainties on the predictions leads, in many cases, to substantially reduced values with reasonable -values. However, for several distributions, and in particular for a larger fraction of the multi-differential distributions, the observed differences between data and simulation still remain significant, providing important input for future theoretical predictions.
Acknowledgements.
We congratulate our colleagues in the CERN accelerator departments for the excellent performance of the LHC and thank the technical and administrative staffs at CERN and at other CMS institutes for their contributions to the success of the CMS effort. In addition, we gratefully acknowledge the computing centers and personnel of the Worldwide LHC Computing Grid and other centers for delivering so effectively the computing infrastructure essential to our analyses. Finally, we acknowledge the enduring support for the construction and operation of the LHC, the CMS detector, and the supporting computing infrastructure provided by the following funding agencies: SC (Armenia), BMBWF and FWF (Austria); FNRS and FWO (Belgium); CNPq, CAPES, FAPERJ, FAPERGS, and FAPESP (Brazil); MES and BNSF (Bulgaria); CERN; CAS, MoST, and NSFC (China); MINCIENCIAS (Colombia); MSES and CSF (Croatia); RIF (Cyprus); SENESCYT (Ecuador); ERC PRG, RVTT3 and TK202 (Estonia); Academy of Finland, MEC, and HIP (Finland); CEA and CNRS/IN2P3 (France); SRNSF (Georgia); BMBF, DFG, and HGF (Germany); GSRI (Greece); NKFIH (Hungary); DAE and DST (India); IPM (Iran); SFI (Ireland); INFN (Italy); MSIP and NRF (Republic of Korea); MES (Latvia); LAS (Lithuania); MOE and UM (Malaysia); BUAP, CINVESTAV, CONACYT, LNS, SEP, and UASLP-FAI (Mexico); MOS (Montenegro); MBIE (New Zealand); PAEC (Pakistan); MES and NSC (Poland); FCT (Portugal); MESTD (Serbia); MCIN/AEI and PCTI (Spain); MOSTR (Sri Lanka); Swiss Funding Agencies (Switzerland); MST (Taipei); MHESI and NSTDA (Thailand); TUBITAK and TENMAK (Turkey); NASU (Ukraine); STFC (United Kingdom); DOE and NSF (USA). Individuals have received support from the Marie-Curie program and the European Research Council and Horizon 2020 Grant, contract Nos. 675440, 724704, 752730, 758316, 765710, 824093, and COST Action CA16108 (European Union); the Leventis Foundation; the Alfred P. Sloan Foundation; the Alexander von Humboldt Foundation; the Science Committee, project no. 22rl-037 (Armenia); the Belgian Federal Science Policy Office; the Fonds pour la Formation à la Recherche dans l’Industrie et dans l’Agriculture (FRIA-Belgium); the Agentschap voor Innovatie door Wetenschap en Technologie (IWT-Belgium); the F.R.S.-FNRS and FWO (Belgium) under the “Excellence of Science – EOS” – be.h project n. 30820817; the Beijing Municipal Science & Technology Commission, No. Z191100007219010 and Fundamental Research Funds for the Central Universities (China); the Ministry of Education, Youth and Sports (MEYS) of the Czech Republic; the Shota Rustaveli National Science Foundation, grant FR-22-985 (Georgia); the Deutsche Forschungsgemeinschaft (DFG), under Germany’s Excellence Strategy – EXC 2121 “Quantum Universe” – 390833306, and under project number 400140256 - GRK2497; the Hellenic Foundation for Research and Innovation (HFRI), Project Number 2288 (Greece); the Hungarian Academy of Sciences, the New National Excellence Program - ÚNKP, the NKFIH research grants K 124845, K 124850, K 128713, K 128786, K 129058, K 131991, K 133046, K 138136, K 143460, K 143477, 2020-2.2.1-ED-2021-00181, and TKP2021-NKTA-64 (Hungary); the Council of Science and Industrial Research, India; ICSC – National Research Center for High Performance Computing, Big Data and Quantum Computing, funded by the EU NexGeneration program (Italy); the Latvian Council of Science; the Ministry of Education and Science, project no. 2022/WK/14, and the National Science Center, contracts Opus 2021/41/B/ST2/01369 and 2021/43/B/ST2/01552 (Poland); the Fundação para a Ciência e a Tecnologia, grant CEECIND/01334/2018 (Portugal); the National Priorities Research Program by Qatar National Research Fund; MCIN/AEI/10.13039/501100011033, ERDF “a way of making Europe”, and the Programa Estatal de Fomento de la Investigación Científica y Técnica de Excelencia María de Maeztu, grant MDM-2017-0765 and Programa Severo Ochoa del Principado de Asturias (Spain); the Chulalongkorn Academic into Its 2nd Century Project Advancement Project, and the National Science, Research and Innovation Fund via the Program Management Unit for Human Resources & Institutional Development, Research and Innovation, grant B37G660013 (Thailand); the Kavli Foundation; the Nvidia Corporation; the SuperMicro Corporation; the Welch Foundation, contract C-1845; and the Weston Havens Foundation (USA).References
- [1] Particle Data Group Collaboration, “Review of Particle Physics”, PTEP 2022 (2022) 083C01, 10.1093/ptep/ptac097.
- [2] N. Kidonakis, “NNNLO soft-gluon corrections for the top-quark \ptand rapidity distributions”, Phys. Rev. D 91 (2015) 031501, 10.1103/PhysRevD.91.031501, arXiv:1411.2633.
- [3] N. Kidonakis, “Top-quark double-differential distributions at approximate N3LO”, Phys. Rev. D 101 (2020) 074006, 10.1103/PhysRevD.101.074006, arXiv:1912.10362.
- [4] M. Czakon, D. Heymes, and A. Mitov, “High-precision differential predictions for top-quark pairs at the LHC”, Phys. Rev. Lett. 116 (2016) 082003, 10.1103/PhysRevLett.116.082003, arXiv:1511.00549.
- [5] M. Czakon et al., “Top-pair production at the LHC through NNLO QCD and NLO EW”, JHEP 10 (2017) 186, 10.1007/JHEP10(2017)186, arXiv:1705.04105.
- [6] M. Czakon et al., “Resummation for (boosted) top-quark pair production at NNLO+NNLL’ in QCD”, JHEP 05 (2018) 149, 10.1007/JHEP05(2018)149, arXiv:1803.07623.
- [7] S. Catani et al., “Top-quark pair production at the LHC: Fully differential QCD predictions at NNLO”, JHEP 07 (2019) 100, 10.1007/JHEP07(2019)100, arXiv:1906.06535.
- [8] M. Czakon, A. Mitov, and R. Poncelet, “NNLO QCD corrections to leptonic observables in top-quark pair production and decay”, JHEP 05 (2021) 212, 10.1007/JHEP05(2021)212, arXiv:2008.11133.
- [9] ATLAS Collaboration, “Measurements of top quark pair relative differential cross sections with ATLAS in collisions at 7\TeV”, Eur. Phys. J. C 73 (2013) 2261, 10.1140/epjc/s10052-012-2261-1, arXiv:1207.5644.
- [10] CMS Collaboration, “Measurement of differential top-quark pair production cross sections in collisions at 7\TeV”, Eur. Phys. J. C 73 (2013) 2339, 10.1140/epjc/s10052-013-2339-4, arXiv:1211.2220.
- [11] ATLAS Collaboration, “Measurements of normalized differential cross sections for \ttbarproduction in collisions at 7\TeV using the ATLAS detector”, Phys. Rev. D 90 (2014) 072004, 10.1103/PhysRevD.90.072004, arXiv:1407.0371.
- [12] ATLAS Collaboration, “Differential top-antitop cross section measurements as a function of observables constructed from final-state particles using collisions at 7\TeV in the ATLAS detector”, JHEP 06 (2015) 100, 10.1007/JHEP06(2015)100, arXiv:1502.05923.
- [13] ATLAS Collaboration, “Measurement of top quark pair differential cross sections in the dilepton channel in collisions at 7 and 8\TeV with ATLAS”, Phys. Rev. D 94 (2016) 092003, 10.1103/PhysRevD.94.092003, arXiv:1607.07281.
- [14] CMS Collaboration, “Measurement of the differential cross section for top quark pair production in collisions at 8\TeV”, Eur. Phys. J. C 75 (2015) 542, 10.1140/epjc/s10052-015-3709-x, arXiv:1505.04480.
- [15] ATLAS Collaboration, “Measurements of top-quark pair differential cross sections in the lepton+jets channel in collisions at 8\TeV using the ATLAS detector”, Eur. Phys. J. C 76 (2016) 538, 10.1140/epjc/s10052-016-4366-4, arXiv:1511.04716.
- [16] ATLAS Collaboration, “Measurement of the differential cross section of highly boosted top quarks as a function of their transverse momentum in 8\TeV proton-proton collisions using the ATLAS detector”, Phys. Rev. D 93 (2016) 032009, 10.1103/PhysRevD.93.032009, arXiv:1510.03818.
- [17] CMS Collaboration, “Measurement of the \ttbarproduction cross section in the all-jets final state in collisions at 8\TeV”, Eur. Phys. J. C 76 (2016) 128, 10.1140/epjc/s10052-016-3956-5, arXiv:1509.06076.
- [18] CMS Collaboration, “Measurement of the integrated and differential \ttbarproduction cross sections for high-\pttop quarks in collisions at 8\TeV”, Phys. Rev. D 94 (2016) 072002, 10.1103/PhysRevD.94.072002, arXiv:1605.00116.
- [19] CMS Collaboration, “Measurement of double-differential cross sections for top quark pair production in collisions at 8\TeV and impact on parton distribution functions”, Eur. Phys. J. C 77 (2017) 459, 10.1140/epjc/s10052-017-4984-5, arXiv:1703.01630.
- [20] ATLAS Collaboration, “Measurement of the top-quark mass in -jet events collected with the ATLAS detector in collisions at 8\TeV”, JHEP 11 (2019) 150, 10.1007/JHEP11(2019)150, arXiv:1905.02302.
- [21] CMS Collaboration, “Measurement of differential cross sections for top quark pair production using the lepton+jets final state in proton-proton collisions at 13\TeV”, Phys. Rev. D 95 (2017) 092001, 10.1103/PhysRevD.95.092001, arXiv:1610.04191.
- [22] ATLAS Collaboration, “Measurement of jet activity produced in top-quark events with an electron, a muon and two b-tagged jets in the final state in collisions at 13\TeV with the ATLAS detector”, Eur. Phys. J. C 77 (2017) 220, 10.1140/epjc/s10052-017-4766-0, arXiv:1610.09978.
- [23] ATLAS Collaboration, “Measurements of top-quark pair differential cross sections in the channel in collisions at 13\TeV using the ATLAS detector”, Eur. Phys. J. C 77 (2017) 292, 10.1140/epjc/s10052-017-4821-x, arXiv:1612.05220.
- [24] CMS Collaboration, “Measurement of normalized differential \ttbarcross sections in the dilepton channel from collisions at 13\TeV”, JHEP 04 (2018) 060, 10.1007/JHEP04(2018)060, arXiv:1708.07638.
- [25] CMS Collaboration, “Measurement of differential cross sections for the production of top quark pairs and of additional jets in lepton+jets events from collisions at 13\TeV”, Phys. Rev. D 97 (2018) 112003, 10.1103/PhysRevD.97.112003, arXiv:1803.08856.
- [26] CMS Collaboration, “Measurements of \ttbardifferential cross sections in proton-proton collisions at 13\TeV using events containing two leptons”, JHEP 02 (2019) 149, 10.1007/JHEP02(2019)149, arXiv:1811.06625.
- [27] CMS Collaboration, “Measurement of \ttbarnormalised multi-differential cross sections in collisions at 13\TeV, and simultaneous determination of the strong coupling strength, top quark pole mass, and parton distribution functions”, Eur. Phys. J. C 80 (2020) 658, 10.1140/epjc/s10052-020-7917-7, arXiv:1904.05237.
- [28] ATLAS Collaboration, “Measurements of top-quark pair differential and double-differential cross sections in the +jets channel with collisions at 13\TeV using the ATLAS detector”, Eur. Phys. J. C 79 (2019) 1028, 10.1140/epjc/s10052-019-7525-6, arXiv:1908.07305. [Erratum: \DOI10.1140/epjc/s10052-020-08541-3].
- [29] ATLAS Collaboration, “Measurement of the \ttbarproduction cross section and lepton differential distributions in dilepton events from collisions at 13\TeV with the ATLAS detector”, Eur. Phys. J. C 80 (2020) 528, 10.1140/epjc/s10052-020-7907-9, arXiv:1910.08819.
- [30] ATLAS Collaboration, “Measurements of top-quark pair single- and double-differential cross sections in the all-hadronic channel in collisions at 13\TeV using the ATLAS detector”, JHEP 01 (2021) 033, 10.1007/JHEP01(2021)033, arXiv:2006.09274.
- [31] CMS Collaboration, “Measurement of differential \ttbarproduction cross sections in the full kinematic range using lepton+jets events from proton-proton collisions at 13\TeV”, Phys. Rev. D 104 (2021) 092013, 10.1103/PhysRevD.104.092013, arXiv:2108.02803.
- [32] “HEPData record for this analysis”, 2023. 10.17182/hepdata.127702.
- [33] CMS Collaboration, “The CMS trigger system”, JINST 12 (2017) P01020, 10.1088/1748-0221/12/01/P01020, arXiv:1609.02366.
- [34] CMS Collaboration, “The CMS experiment at the CERN LHC”, JINST 3 (2008) S08004, 10.1088/1748-0221/3/08/S08004.
- [35] NNPDF Collaboration, “Unbiased global determination of parton distributions and their uncertainties at NNLO and LO”, Nucl. Phys. B 855 (2012) 153, 10.1016/j.nuclphysb.2011.09.024, arXiv:1107.2652.
- [36] NNPDF Collaboration, “Parton distributions from high-precision collider data”, Eur. Phys. J. C 77 (2017) 663, 10.1140/epjc/s10052-017-5199-5, arXiv:1706.00428.
- [37] P. Nason, “A new method for combining NLO QCD with shower Monte Carlo algorithms”, JHEP 11 (2004) 040, 10.1088/1126-6708/2004/11/040, arXiv:hep-ph/0409146.
- [38] S. Frixione, P. Nason, and C. Oleari, “Matching NLO QCD computations with parton shower simulations: the \POWHEG method”, JHEP 11 (2007) 070, 10.1088/1126-6708/2007/11/070, arXiv:0709.2092.
- [39] S. Alioli, P. Nason, C. Oleari, and E. Re, “A general framework for implementing NLO calculations in shower Monte Carlo programs: the \POWHEG BOX”, JHEP 06 (2010) 043, 10.1007/JHEP06(2010)043, arXiv:1002.2581.
- [40] S. Frixione, P. Nason, and G. Ridolfi, “A positive-weight next-to-leading-order Monte Carlo for heavy flavour hadroproduction”, JHEP 09 (2007) 126, 10.1088/1126-6708/2007/09/126, arXiv:0707.3088.
- [41] CMS Collaboration, “Extraction and validation of a new set of CMS \PYTHIA8 tunes from underlying-event measurements”, Eur. Phys. J. C 80 (2020) 4, 10.1140/epjc/s10052-019-7499-4, arXiv:1903.12179.
- [42] T. Sjöstrand et al., “An introduction to \PYTHIA 8.2”, Comput. Phys. Commun. 191 (2015) 159, 10.1016/j.cpc.2015.01.024, arXiv:1410.3012.
- [43] J. Alwall et al., “The automated computation of tree-level and next-to-leading order differential cross sections, and their matching to parton shower simulations”, JHEP 07 (2014) 079, 10.1007/JHEP07(2014)079, arXiv:1405.0301.
- [44] R. Frederix and S. Frixione, “Merging meets matching in MC@NLO”, JHEP 12 (2012) 061, 10.1007/JHEP12(2012)061, arXiv:1209.6215.
- [45] P. Artoisenet, R. Frederix, O. Mattelaer, and R. Rietkerk, “Automatic spin-entangled decays of heavy resonances in Monte Carlo simulations”, JHEP 03 (2013) 015, 10.1007/JHEP03(2013)015, arXiv:1212.3460.
- [46] J. Bellm et al., “\HERWIG 7.0/\HERWIGpp 3.0 release note”, Eur. Phys. J. C 76 (2016) 196, 10.1140/epjc/s10052-016-4018-8, arXiv:1512.01178.
- [47] CMS Collaboration, “Development and validation of \HERWIG 7 tunes from CMS underlying-event measurements”, Eur. Phys. J. C 81 (2021) 312, 10.1140/epjc/s10052-021-08949-5, arXiv:2011.03422.
- [48] S. Alioli, P. Nason, C. Oleari, and E. Re, “NLO single-top production matched with shower in \POWHEG: - and -channel contributions”, JHEP 09 (2009) 111, 10.1088/1126-6708/2009/09/111, arXiv:0907.4076. [Erratum: \DOI10.1007/JHEP02(2010)011].
- [49] R. Frederix, E. Re, and P. Torrielli, “Single-top -channel hadroproduction in the four-flavour scheme with \POWHEG and a\MCATNLO”, JHEP 09 (2012) 130, 10.1007/JHEP09(2012)130, arXiv:1207.5391.
- [50] E. Re, “Single-top -channel production matched with parton showers using the \POWHEG method”, Eur. Phys. J. C 71 (2011) 1547, 10.1140/epjc/s10052-011-1547-z, arXiv:1009.2450.
- [51] CMS Collaboration, “Investigations of the impact of the parton shower tuning in \PYTHIA in the modelling of \ttbarat 8 and 13\TeV”, CMS Physics Analysis Summary CMS-PAS-TOP-16-021, 2016.
- [52] CMS Collaboration, “Event generator tunes obtained from underlying event and multiparton scattering measurements”, Eur. Phys. J. C 76 (2016) 155, 10.1140/epjc/s10052-016-3988-x, arXiv:1512.00815.
- [53] P. Skands, S. Carrazza, and J. Rojo, “Tuning \PYTHIA 8.1: the Monash 2013 Tune”, Eur. Phys. J. C 74 (2014) 3024, 10.1140/epjc/s10052-014-3024-y, arXiv:1404.5630.
- [54] NNPDF Collaboration, “Parton distributions for the LHC Run II”, JHEP 04 (2015) 040, 10.1007/JHEP04(2015)040, arXiv:1410.8849.
- [55] M. L. Mangano, M. Moretti, F. Piccinini, and M. Treccani, “Matching matrix elements and shower evolution for top-quark production in hadronic collisions”, JHEP 01 (2007) 013, 10.1088/1126-6708/2007/01/013, arXiv:hep-ex/0611129.
- [56] S. Mrenna and P. Richardson, “Matching matrix elements and parton showers with \HERWIG and \PYTHIA”, JHEP 05 (2004) 040, 10.1088/1126-6708/2004/05/040, arXiv:hep-ph/0312274.
- [57] P. Kant et al., “HatHor for single top-quark production: Updated predictions and uncertainty estimates for single top-quark production in hadronic collisions”, Comput. Phys. Commun. 191 (2015) 74, 10.1016/j.cpc.2015.02.001, arXiv:1406.4403.
- [58] N. Kidonakis, “Two-loop soft anomalous dimensions for single top quark associated production with \PWm or ”, Phys. Rev. D 82 (2010) 054018, 10.1103/PhysRevD.82.054018, arXiv:hep-ph/1005.4451.
- [59] Y. Li and F. Petriello, “Combining QCD and electroweak corrections to dilepton production in \FEWZ”, Phys. Rev. D 86 (2012) 094034, 10.1103/PhysRevD.86.094034, arXiv:1208.5967.
- [60] J. M. Campbell, R. K. Ellis, and C. Williams, “Vector boson pair production at the LHC”, JHEP 07 (2011) 018, 10.1007/JHEP07(2011)018, arXiv:1105.0020.
- [61] M. Czakon and A. Mitov, “\TOPpp: a program for the calculation of the top-pair cross section at hadron colliders”, Comput. Phys. Commun. 185 (2014) 2930, 10.1016/j.cpc.2014.06.021, arXiv:1112.5675.
- [62] M. Cacciari et al., “Top-pair production at hadron colliders with next-to-next-to-leading logarithmic soft-gluon resummation”, Phys. Lett. B 710 (2012) 612, 10.1016/j.physletb.2012.03.013, arXiv:1111.5869.
- [63] P. Bärnreuther, M. Czakon, and A. Mitov, “Percent level precision physics at the Tevatron: first genuine NNLO QCD corrections to ”, Phys. Rev. Lett. 109 (2012) 132001, 10.1103/PhysRevLett.109.132001, arXiv:1204.5201.
- [64] M. Czakon and A. Mitov, “NNLO corrections to top-pair production at hadron colliders: the all-fermionic scattering channels”, JHEP 12 (2012) 054, 10.1007/JHEP12(2012)054, arXiv:1207.0236.
- [65] M. Czakon and A. Mitov, “NNLO corrections to top-pair production at hadron colliders: the quark-gluon reaction”, JHEP 01 (2013) 080, 10.1007/JHEP01(2013)080, arXiv:1210.6832.
- [66] M. Beneke, P. Falgari, S. Klein, and C. Schwinn, “Hadronic top-quark pair production with NNLL threshold resummation”, Nucl. Phys. B 855 (2012) 695, 10.1016/j.nuclphysb.2011.10.021, arXiv:1109.1536.
- [67] M. Czakon, P. Fiedler, and A. Mitov, “Total top-quark pair-production cross section at hadron colliders through ”, Phys. Rev. Lett. 110 (2013) 252004, 10.1103/PhysRevLett.110.252004, arXiv:1303.6254.
- [68] GEANT4 Collaboration, “GEANT4—a simulation toolkit”, Nucl. Instrum. Meth. A 506 (2003) 250, 10.1016/S0168-9002(03)01368-8.
- [69] ATLAS Collaboration, “Measurement of the inelastic proton-proton cross section at 13\TeV with the ATLAS detector at the LHC”, Phys. Rev. Lett. 117 (2016) 182002, 10.1103/PhysRevLett.117.182002, arXiv:1606.02625.
- [70] CMS Collaboration, “Particle-flow reconstruction and global event description with the CMS detector”, JINST 12 (2017) P10003, 10.1088/1748-0221/12/10/P10003, arXiv:1706.04965.
- [71] CMS Collaboration, “Technical proposal for the Phase-II upgrade of the Compact Muon Solenoid”, CMS Technical Proposal CERN-LHCC-2015-010, CMS-TDR-15-02, 2015.
- [72] CMS Collaboration, “Electron and photon reconstruction and identification with the CMS experiment at the CERN LHC”, JINST 16 (2021) P05014, 10.1088/1748-0221/16/05/P05014, arXiv:2012.06888.
- [73] CMS Collaboration, “Performance of the CMS muon detector and muon reconstruction with proton-proton collisions at 13\TeV”, JINST 13 (2018) P06015, 10.1088/1748-0221/13/06/P06015, arXiv:1804.04528.
- [74] M. Cacciari, G. P. Salam, and G. Soyez, “The anti-\ktjet clustering algorithm”, JHEP 04 (2008) 063, 10.1088/1126-6708/2008/04/063, arXiv:0802.1189.
- [75] M. Cacciari, G. P. Salam, and G. Soyez, “FastJet user manual”, Eur. Phys. J. C 72 (2012) 1896, 10.1140/epjc/s10052-012-1896-2, arXiv:1111.6097.
- [76] CMS Collaboration, “Jet energy scale and resolution in the CMS experiment in collisions at 8\TeV”, JINST 12 (2017) P02014, 10.1088/1748-0221/12/02/P02014, arXiv:1607.03663.
- [77] CMS Collaboration, “Identification of heavy-flavour jets with the CMS detector in collisions at 13\TeV”, JINST 13 (2018) P05011, 10.1088/1748-0221/13/05/P05011, arXiv:1712.07158.
- [78] CMS Collaboration, “A Deep Neural Network for simultaneous estimation of b jet energy and resolution”, Comput. Softw. Big Sci. 4 (2020) 10, 10.1007/s41781-020-00041-z, arXiv:1912.06046.
- [79] CMS Collaboration, “Performance of missing transverse momentum reconstruction in proton-proton collisions at 13\TeV using the CMS detector”, JINST 14 (2019) P07004, 10.1088/1748-0221/14/07/P07004, arXiv:1903.06078.
- [80] D. Bertolini, P. Harris, M. Low, and N. Tran, “Pileup per particle identification”, JHEP 10 (2014) 59, 10.1007/JHEP10(2014)059, arXiv:1407.6013.
- [81] I. Korol, “Measurement of Double Differential \ttbarProduction Cross Sections with the CMS Detector”. PhD thesis, Universität Hamburg, 2016. 10.3204/DESY-THESIS-2016-011.
- [82] R. J. Barlow and C. Beeston, “Fitting using finite Monte Carlo samples”, Comput. Phys. Commun. 77 (1993) 219, 10.1016/0010-4655(93)90005-W.
- [83] R. Brun and F. Rademakers, “ROOT: An object oriented data analysis framework”, Nucl. Instrum. Meth. A 389 (1997) 81, 10.1016/S0168-9002(97)00048-X.
- [84] S. Schmitt, “TUnfold: an algorithm for correcting migration effects in high energy physics”, JINST 7 (2012) T10003, 10.1088/1748-0221/7/10/T10003, arXiv:1205.6201.
- [85] A. N. Tikhonov, “Solution of incorrectly formulated problems and the regularization method”, Sov. Math. Dokl. 4 (1963) 1035.
- [86] S. Schmitt, “Data unfolding methods in high energy physics”, Eur. Phys. J. Web Conf. 137 (2017) 11008, 10.1051/epjconf/201713711008, arXiv:1611.01927.
- [87] CMS Collaboration, “Object definitions for top quark analyses at the particle level”, CMS Note CERN-CMS-NOTE-2017-004, 2017.
- [88] M. Cacciari, G. P. Salam, and G. Soyez, “The catchment area of jets”, JHEP 04 (2008) 005, 10.1088/1126-6708/2008/04/005, arXiv:0802.1188.
- [89] CMS Collaboration, “Precision luminosity measurement in proton-proton collisions at 13\TeV in 2015 and 2016 at CMS”, Eur. Phys. J. C 81 (2021) 800, 10.1140/epjc/s10052-021-09538-2, arXiv:2104.01927.
- [90] CMS Collaboration, “CMS Luminosity measurement for the 2017 data-taking period at 13\TeV”, CMS Physics Analysis Summary CMS-PAS-LUM-17-004, 2018.
- [91] CMS Collaboration, “CMS Luminosity measurement for the 2018 data-taking period at 13\TeV”, CMS Physics Analysis Summary CMS-PAS-LUM-18-002, 2019.
- [92] CMS Collaboration, “Measurement of the Drell-Yan cross section in collisions at 7\TeV”, JHEP 10 (2011) 007, 10.1007/JHEP10(2011)007, arXiv:1108.0566.
- [93] CMS Collaboration, “Measurement of the top quark pair production cross section in proton-proton collisions at 13\TeV”, Phys. Rev. Lett. 116 (2016) 052002, 10.1103/PhysRevLett.116.052002, arXiv:1510.05302.
- [94] CMS Collaboration, “Measurement of the Higgs boson production rate in association with top quarks in final states with electrons, muons, and hadronically decaying tau leptons at 13\TeV”, Eur. Phys. J. C 81 (2021) 378, 10.1140/epjc/s10052-021-09014-x, arXiv:2011.03652.
- [95] S. Argyropoulos and T. Sjöstrand, “Effects of color reconnection on \ttbarfinal states at the LHC”, JHEP 11 (2014) 043, 10.1007/JHEP11(2014)043, arXiv:1407.6653.
- [96] J. R. Christiansen and P. Z. Skands, “String formation beyond leading colour”, JHEP 08 (2015) 003, 10.1007/JHEP08(2015)003, arXiv:1505.01681.
- [97] M. Bähr et al., “\HERWIGpp physics and manual”, Eur. Phys. J. C 58 (2008) 639, 10.1140/epjc/s10052-008-0798-9, arXiv:0803.0883.
- [98] CMS Collaboration, “Running of the top quark mass from proton-proton collisions at 13TeV”, Phys. Lett. B 803 (2020) 135263, 10.1016/j.physletb.2020.135263, arXiv:1909.09193.
- [99] T. Chwalek and F. Déliot, “Top quark asymmetries”, Universe 8 (2022) 622, 10.3390/universe8120622.
- [100] M. Diehl.
- [101] M. Grazzini, S. Kallweit, and M. Wiesemann, “Fully differential NNLO computations with MATRIX”, Eur. Phys. J. C 78 (2018) 537, 10.1140/epjc/s10052-018-5771-7, arXiv:1711.06631.
- [102] S. Catani et al., “Top-quark pair hadroproduction at next-to-next-to-leading order in QCD”, Phys. Rev. D 99 (2019) 051501, 10.1103/PhysRevD.99.051501, arXiv:1901.04005.
- [103] F. Buccioni et al., “OpenLoops 2”, Eur. Phys. J. C 79 (2019) 866, 10.1140/epjc/s10052-019-7306-2, arXiv:1907.13071.
- [104] F. Cascioli, P. Maierhofer, and S. Pozzorini, “Scattering amplitudes with Open Loops”, Phys. Rev. Lett. 108 (2012) 111601, 10.1103/PhysRevLett.108.111601, arXiv:1111.5206.
- [105] A. Denner, S. Dittmaier, and L. Hofer, “Collier: a fortran-based Complex One-Loop LIbrary in Extended Regularizations”, Comput. Phys. Commun. 212 (2017) 220, 10.1016/j.cpc.2016.10.013, arXiv:1604.06792.
- [106] S. Catani et al., “Vector boson production at hadron colliders: hard-collinear coefficients at the NNLO”, Eur. Phys. J. C 72 (2012) 2195, 10.1140/epjc/s10052-012-2195-7, arXiv:1209.0158.
- [107] S. Catani and M. Grazzini, “An NNLO subtraction formalism in hadron collisions and its application to Higgs boson production at the LHC”, Phys. Rev. Lett. 98 (2007) 222002, 10.1103/PhysRevLett.98.222002, arXiv:hep-ph/0703012.
- [108] M. Czakon, “A novel subtraction scheme for double-real radiation at NNLO”, Phys. Lett. B 693 (2010) 259, 10.1016/j.physletb.2010.08.036, arXiv:1005.0274.
- [109] M. Czakon and D. Heymes, “Four-dimensional formulation of the sector-improved residue subtraction scheme”, Nucl. Phys. B 890 (2014) 152, 10.1016/j.nuclphysb.2014.11.006, arXiv:1408.2500.
- [110] M. Czakon, “Double-real radiation in hadronic top quark pair production as a proof of a certain concept”, Nucl. Phys. B 849 (2011) 250, 10.1016/j.nuclphysb.2011.03.020, arXiv:1101.0642.
- [111] P. F. Monni et al., “MiNNLO: a new method to match NNLO QCD to parton showers”, JHEP 05 (2020) 143, 10.1007/JHEP05(2020)143, arXiv:1908.06987.
- [112] P. F. Monni, E. Re, and M. Wiesemann, “MiNNLO: optimizing hadronic processes”, Eur. Phys. J. C 80 (2020) 1075, 10.1140/epjc/s10052-020-08658-5, arXiv:2006.04133.
- [113] J. Mazzitelli et al., “Top-pair production at the LHC with MINNLOPS”, JHEP 04 (2022) 079, 10.1007/JHEP04(2022)079, arXiv:2112.12135.
- [114] K. Hamilton, P. Nason, and G. Zanderighi, “MINLO: Multi-scale improved NLO”, JHEP 10 (2012) 155, 10.1007/JHEP10(2012)155, arXiv:1206.3572.
- [115] K. Hamilton, P. Nason, C. Oleari, and G. Zanderighi, “Merging + 0 and 1 jet at NLO with no merging scale: a path to parton shower + NNLO matching”, JHEP 05 (2013) 082, 10.1007/JHEP05(2013)082, arXiv:1212.4504.
- [116] S. Dulat et al., “New parton distribution functions from a global analysis of quantum chromodynamics”, Phys. Rev. D 93 (2016) 033006, 10.1103/PhysRevD.93.033006, arXiv:1506.07443.
- [117] S. Alekhin, J. Blümlein, and S. Moch, “NLO PDFs from the ABMP16 fit”, Eur. Phys. J. C 78 (2018) 477, 10.1140/epjc/s10052-018-5947-1, arXiv:1803.07537.
- [118] L. A. Harland-Lang, A. D. Martin, P. Motylinski, and R. S. Thorne, “Parton distributions in the LHC era: MMHT 2014 PDFs”, Eur. Phys. J. C 75 (2015) 204, 10.1140/epjc/s10052-015-3397-6, arXiv:1412.3989.
- [119] H1 and ZEUS Collaborations, “Combination of measurements of inclusive deep inelastic scattering cross sections and QCD analysis of HERA data”, Eur. Phys. J. C 75 (2015) 580, 10.1140/epjc/s10052-015-3710-4, arXiv:1506.06042.
- [120] J. Butterworth et al., “PDF4LHC recommendations for LHC Run II”, J. Phys. G 43 (2016) 023001, 10.1088/0954-3899/43/2/023001, arXiv:1510.03865.
- [121] A. Accardi et al., “A critical appraisal and evaluation of modern PDFs”, Eur. Phys. J. C 76 (2016) 471, 10.1140/epjc/s10052-016-4285-4, arXiv:1603.08906.
.11 Definition of for theory-to-data comparisons
We define here the values for the theory-to-data comparisons shown in Section 0.9 and Appendix .12. The standard values are calculated taking the measurement uncertainties into account, but ignoring the uncertainties in the predictions:
| (2) |
where denotes the number of bins of the respective cross section distribution and the vector of differences of the measured cross sections and the corresponding predictions. The covariance matrix is calculated as:
| (3) |
where and are the covariance matrices representing the statistical uncertainties from the unfolding, and the systematic uncertainties, respectively. The systematic covariance matrix is calculated as
| (4) |
Here, denotes the systematic uncertainty from variation of source in the th bin, and is the number of variations for source . The sums run over all sources of systematic uncertainties and all their corresponding variations. Most of the systematic uncertainty sources in this analysis consist of positive and negative variations and thus have , though one model uncertainty (namely, the model of color reconnection) consists of more than two variations, a property that is accounted for in Eq. (4). For a subset of the models, values are provided including the uncertainties in the predictions. This is achieved by adding the covariance matrix of these predictions, , calculated analogously to Eq. (4), to .
For normalized cross sections the values are calculated as
| (5) |
where is the column vector of the residuals calculated as the difference of the measured normalized cross sections and the corresponding predictions and discarding one of the bins, and is the submatrix obtained from the full covariance matrix by discarding the corresponding row and column. The matrix obtained in this way is invertible, while the original covariance matrix is singular because for normalized cross sections one degree of freedom is lost.
.12 Results for absolute cross sections
Absolute differential cross sections corresponding to the normalized ones discussed in Section 0.9 are presented in the following, together with tables listing values of all prediction-to-data comparisons.
.12.1 Comparisons to MC simulations
The absolute differential cross sections comparing data to predictions based on MC simulations are shown in Figs. 65–97, and the corresponding values are presented in Tables .12.1–.12.1. The -values of the tests are provided in Tables .13–.13. The measurements are compared to the three MC simulations introduced in Section 0.3: \POWHEG+\PYTHIA8 (POW+PYT), MG5_amc@nlo[FxFx]+\PYTHIA8 (FxFx+PYT), and \POWHEG+\HERWIG7 (POW+HER). Comparing the absolute cross sections to the normalized ones presented in Section 0.9, two effects are visible. Firstly, the uncertainties in the measured and also the predicted absolute cross sections are considerably larger than those of the corresponding normalized ones, which can be attributed to bin-to-bin correlated global normalization uncertainties. Secondly, the absolute total cross section obtained by integrating over the spectra of the three MC models is within 5% of that calculated from the data, indicating a reasonable agreement.
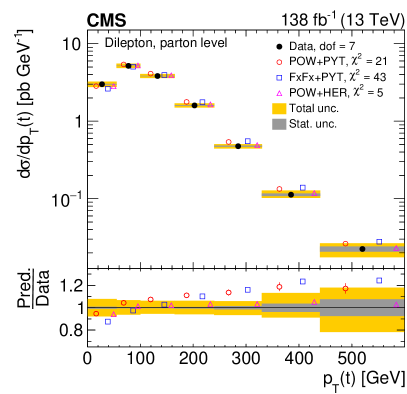
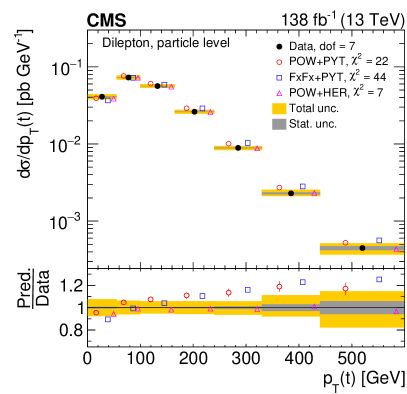
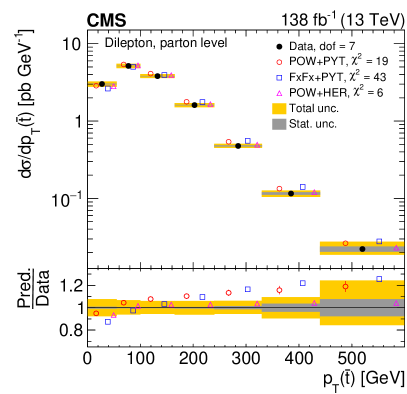
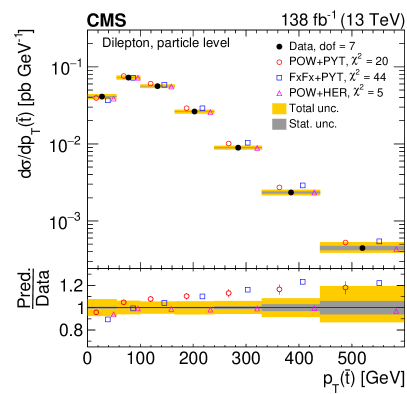
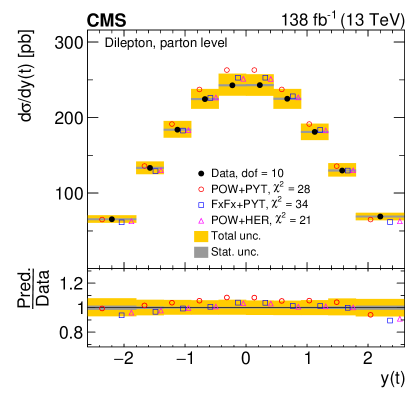
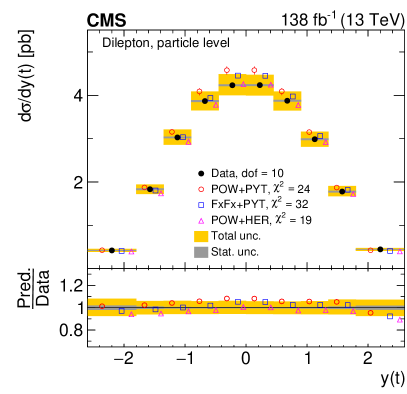
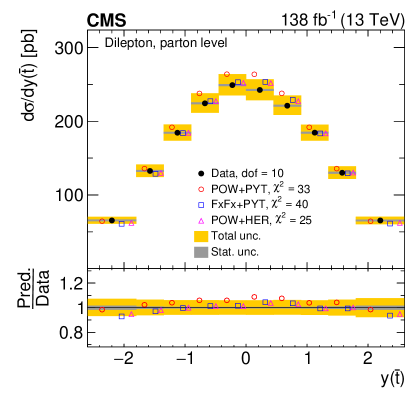
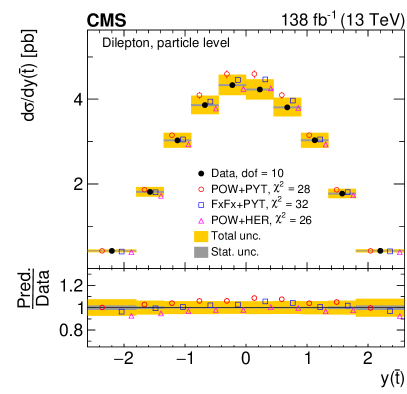
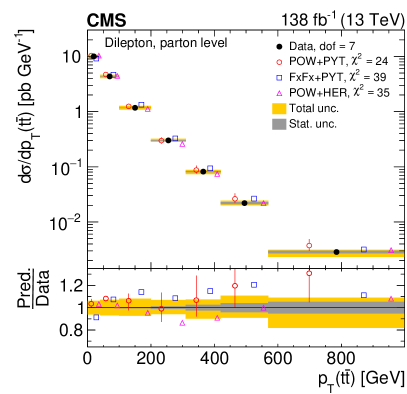
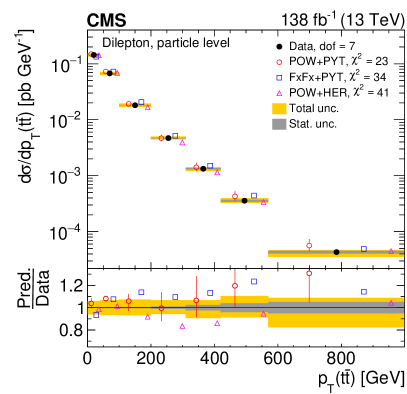
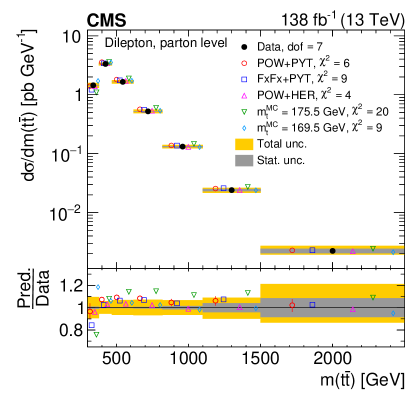
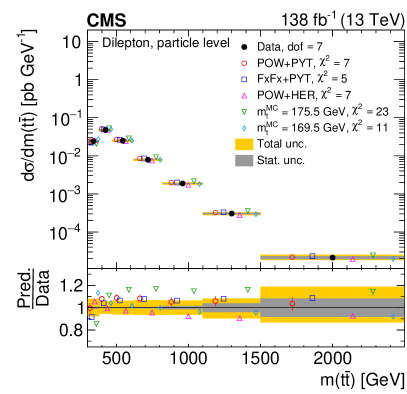
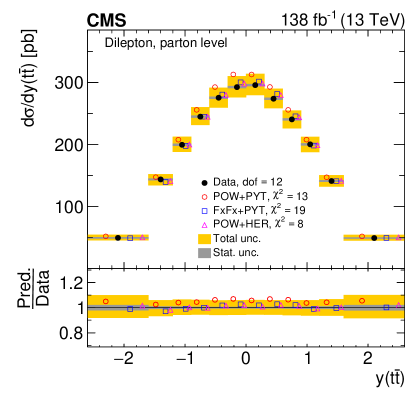
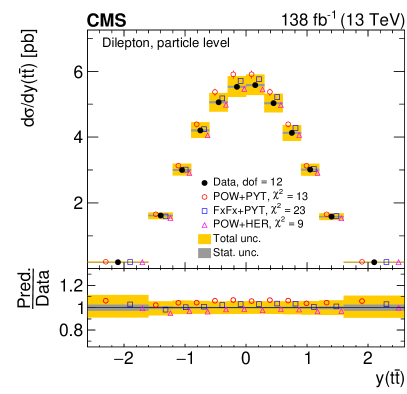

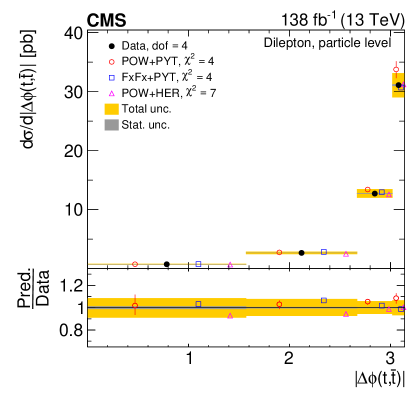


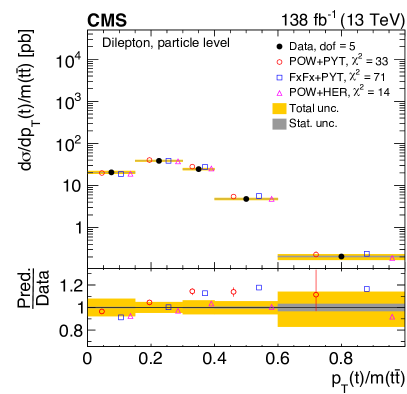
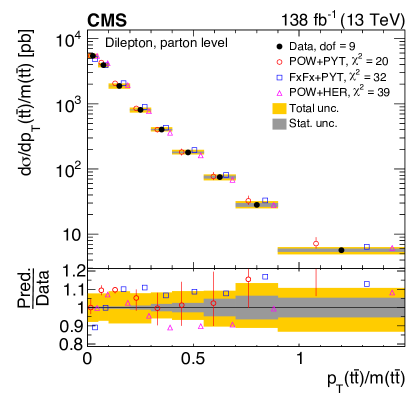
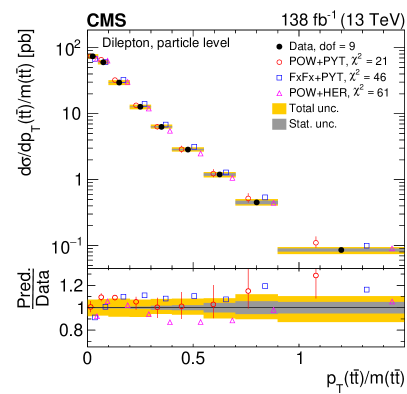
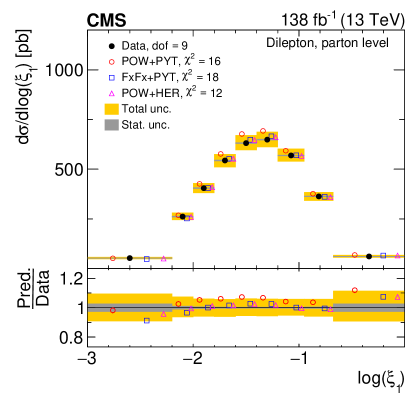


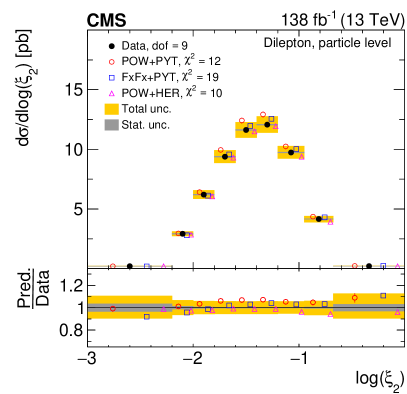

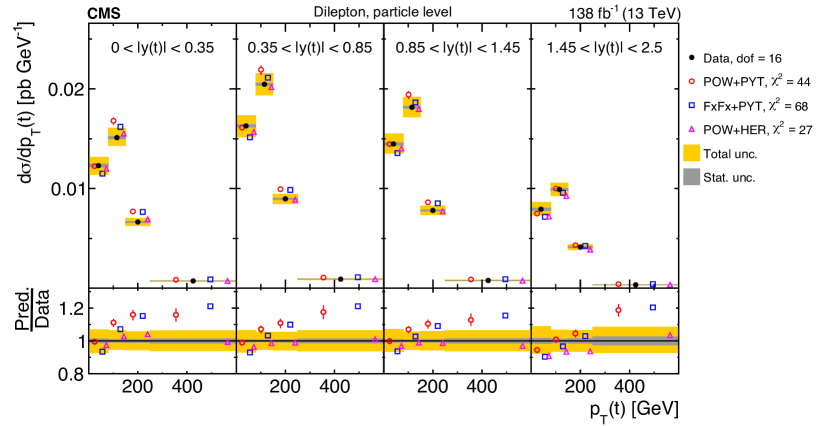
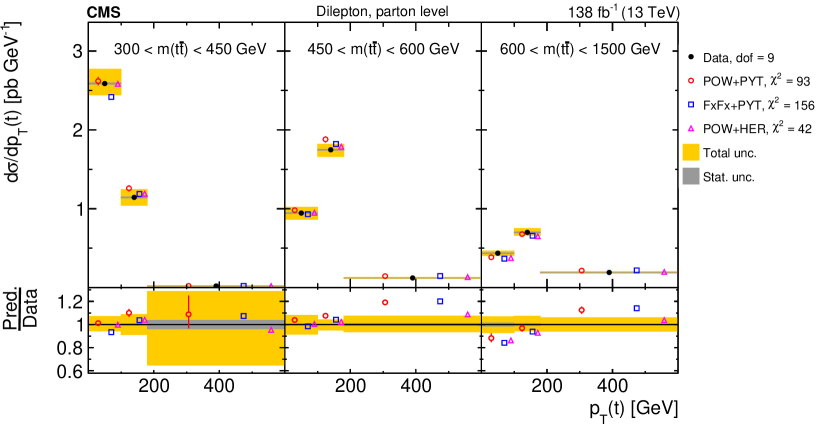
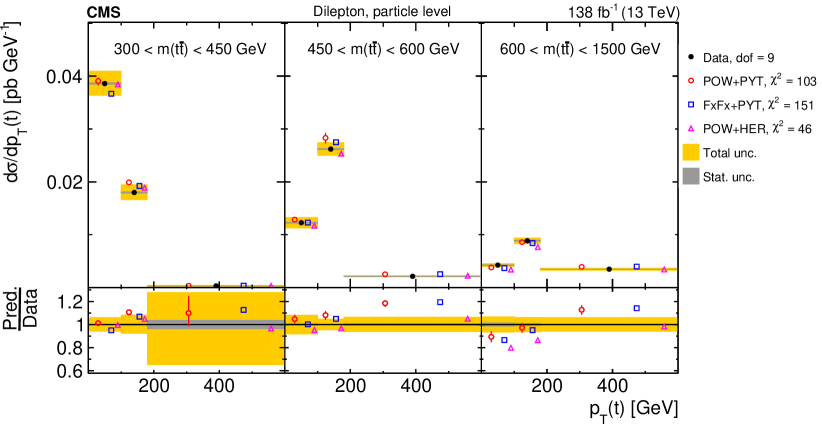
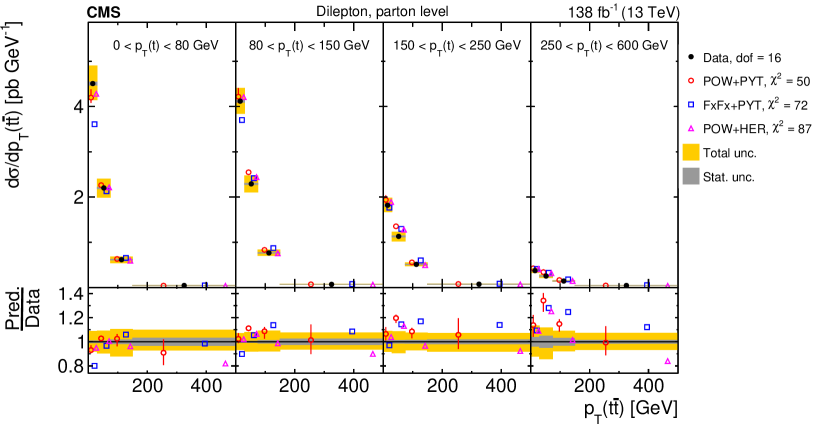
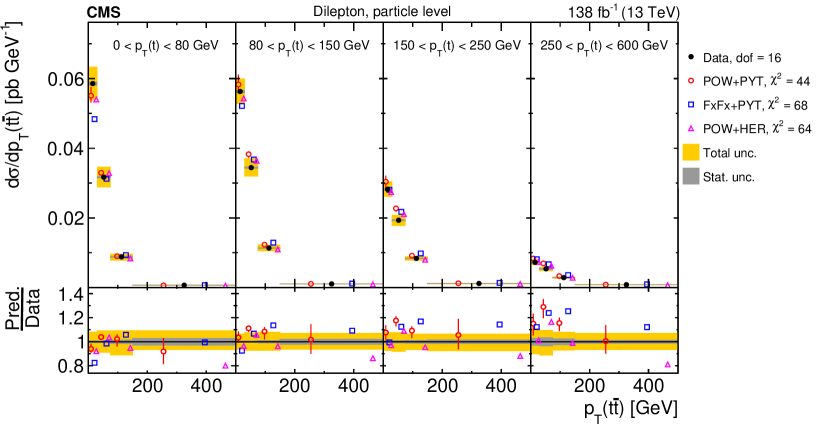
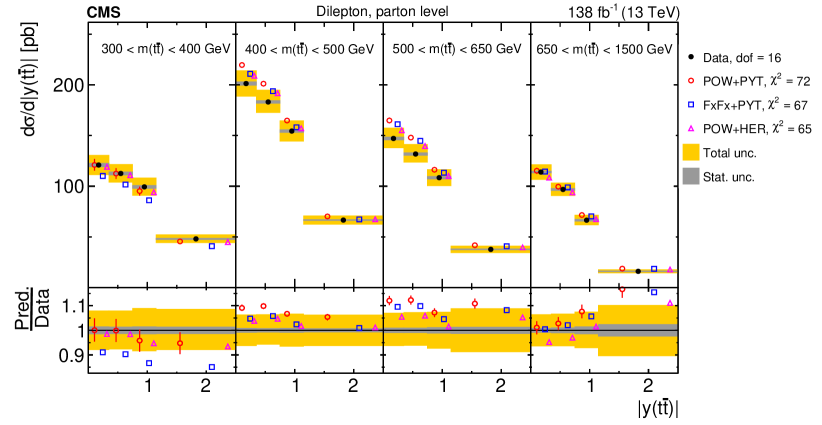
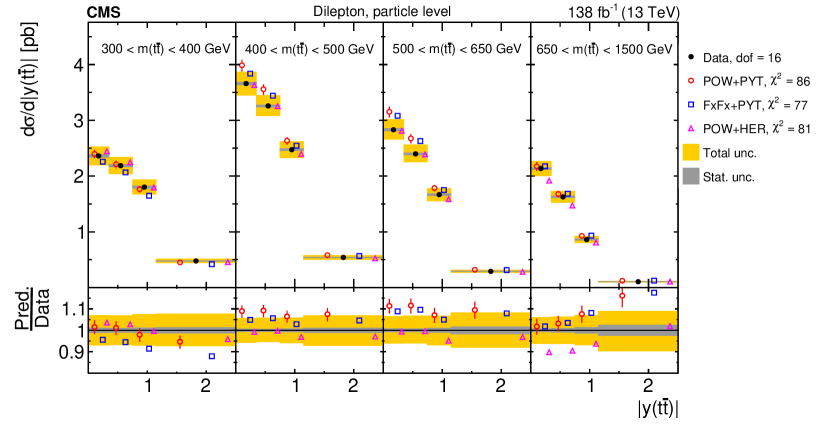

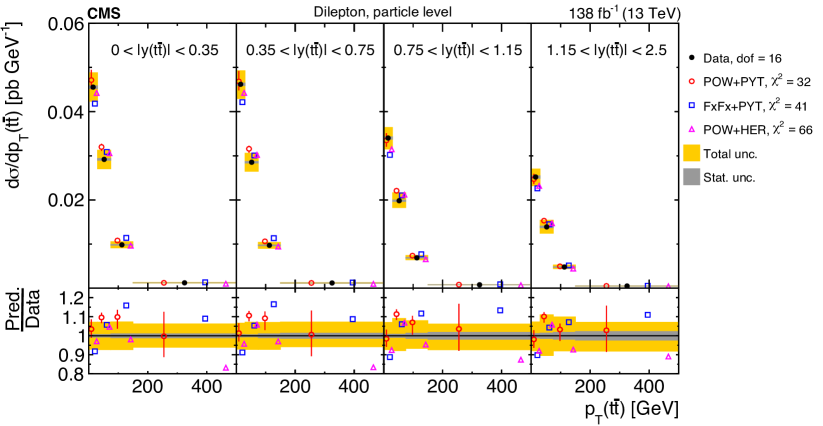

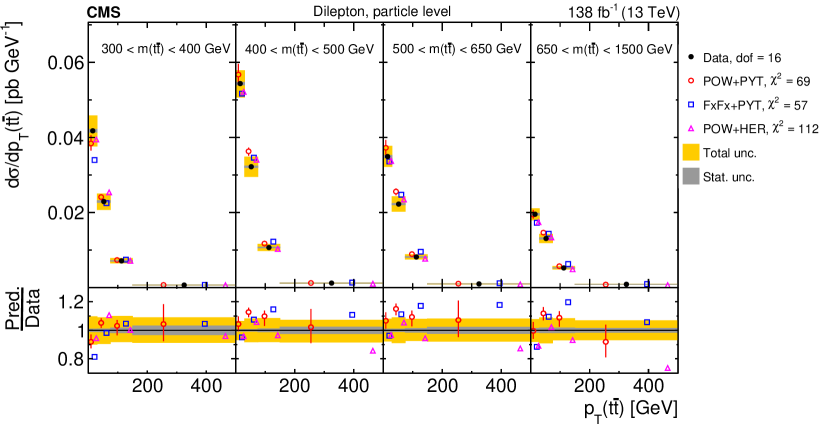
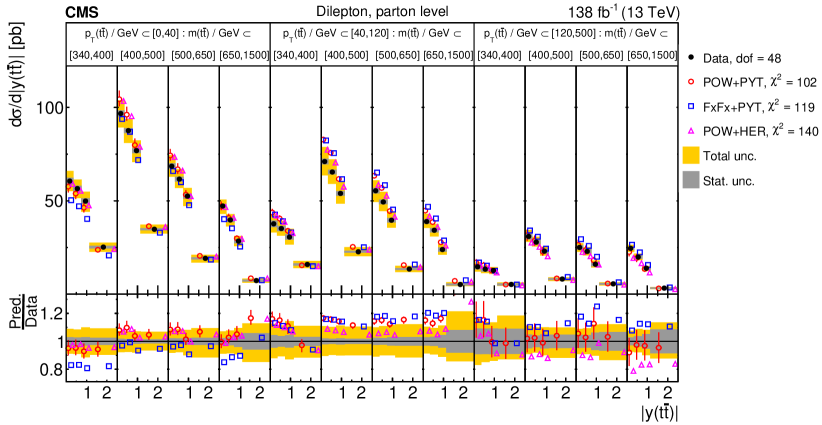
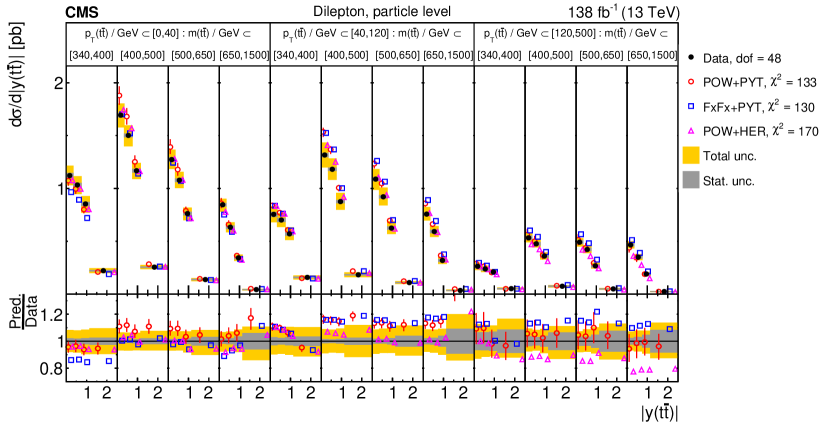

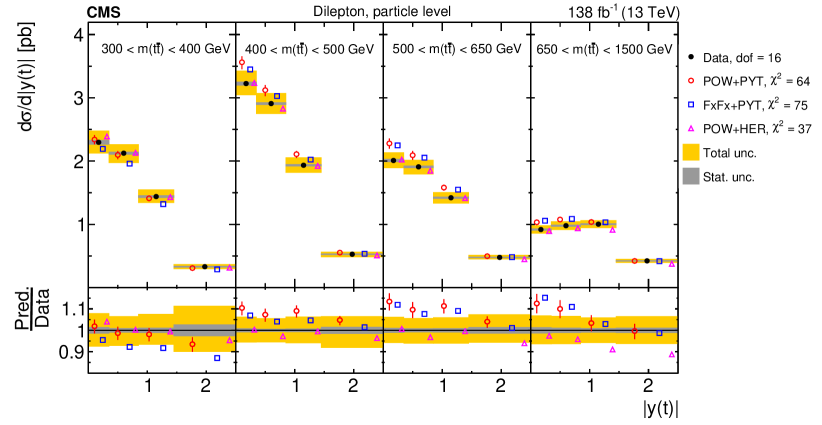
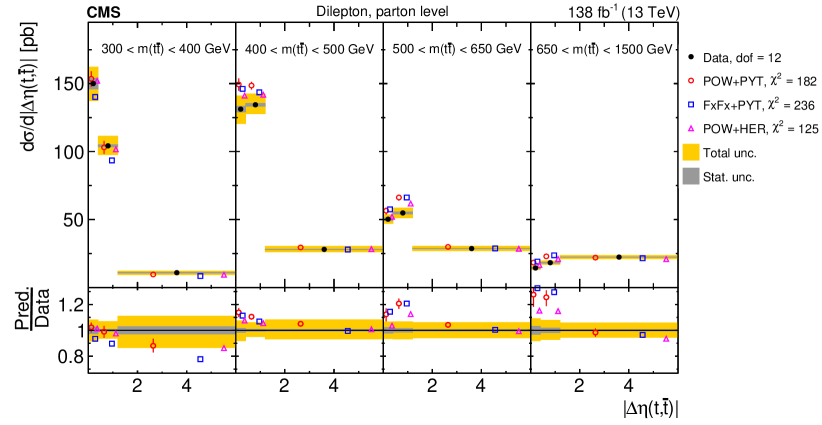
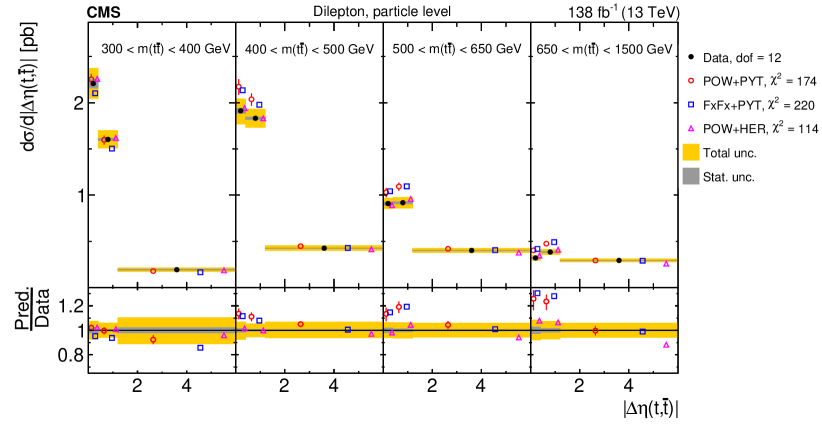
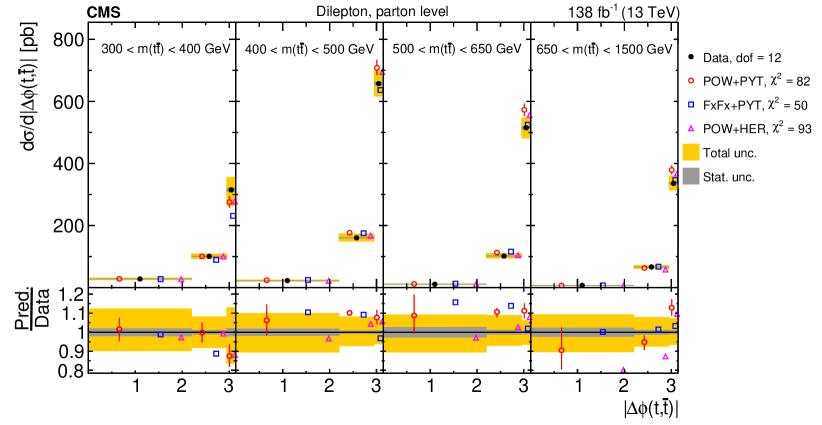
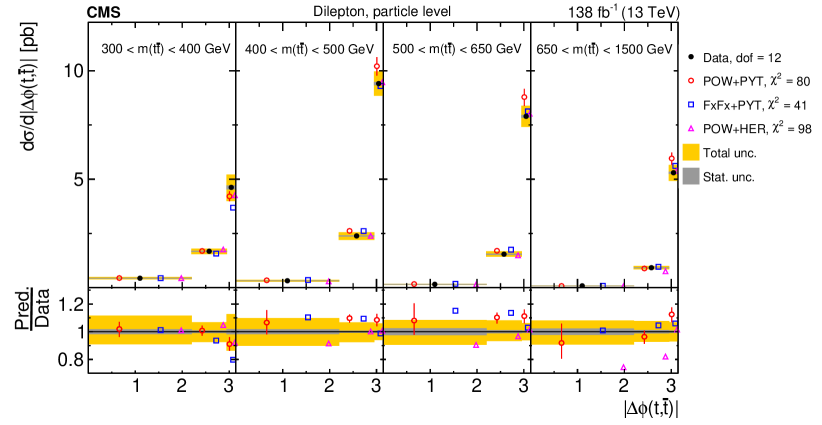
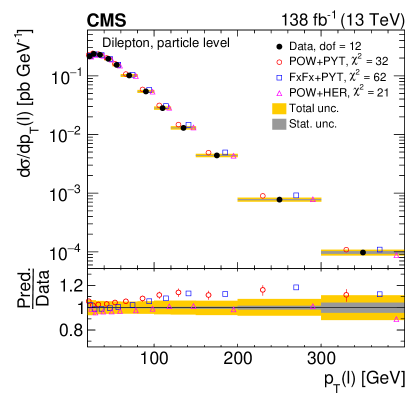

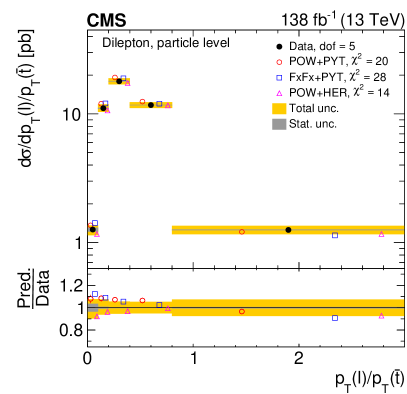
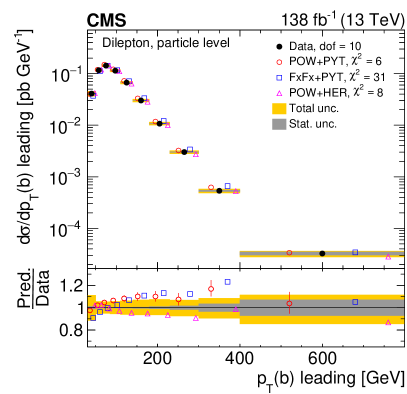
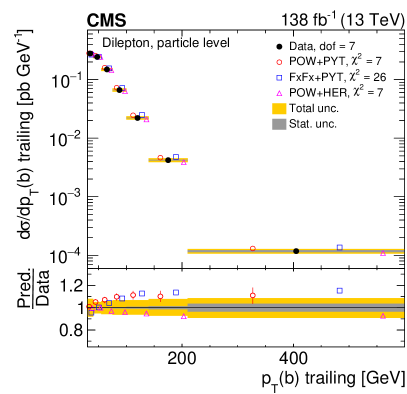
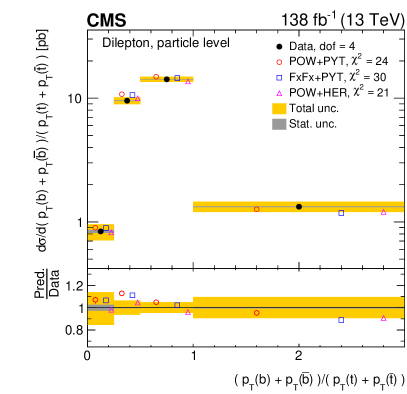
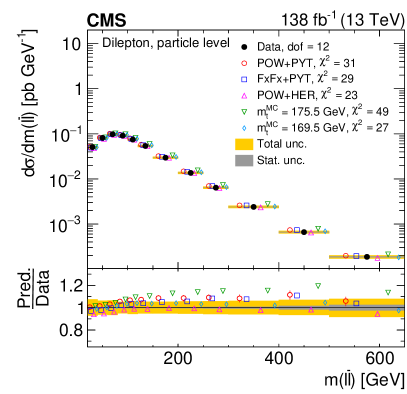
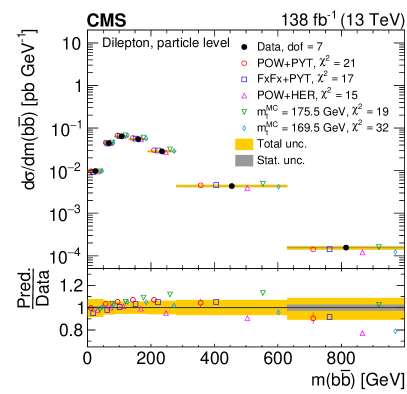
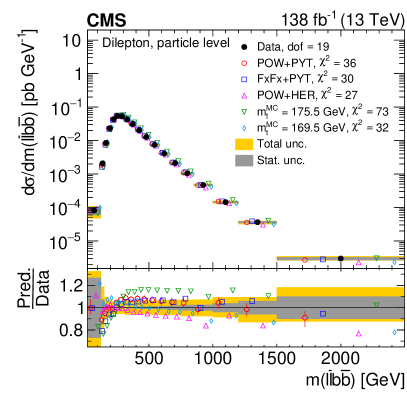
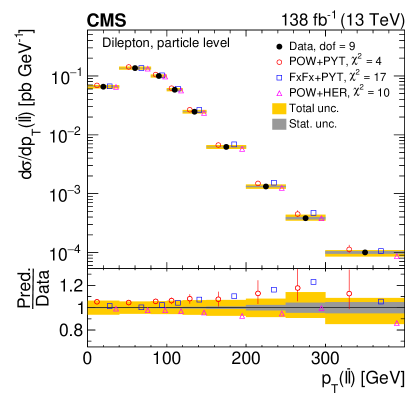
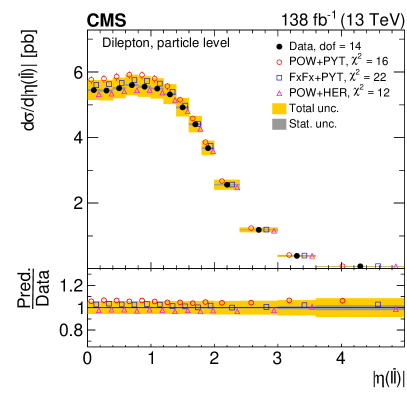
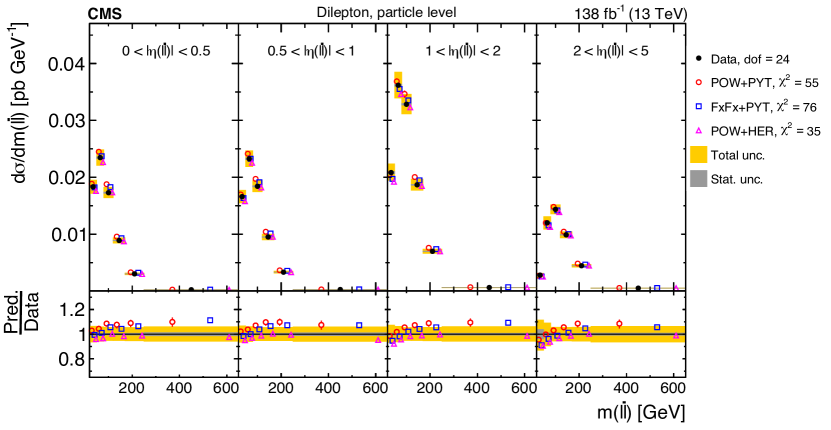
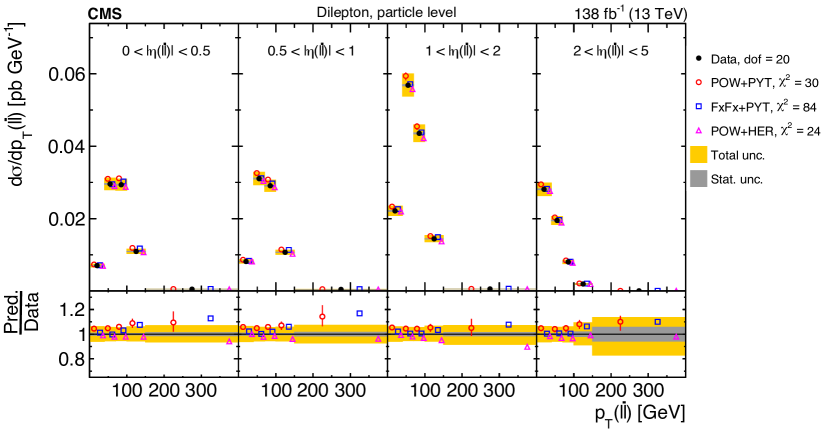
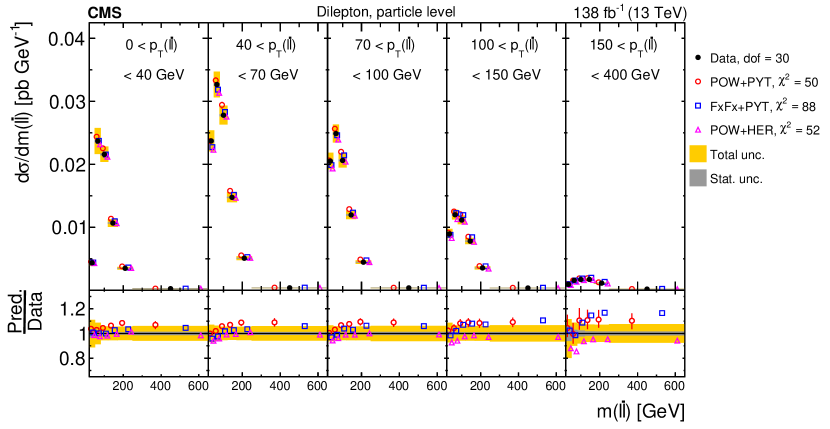
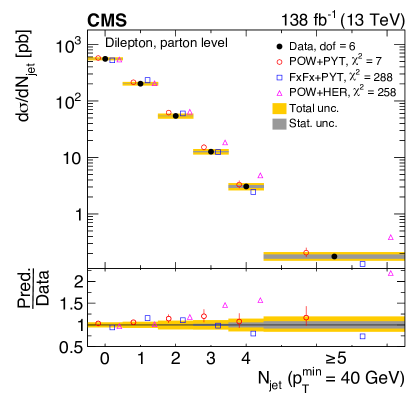
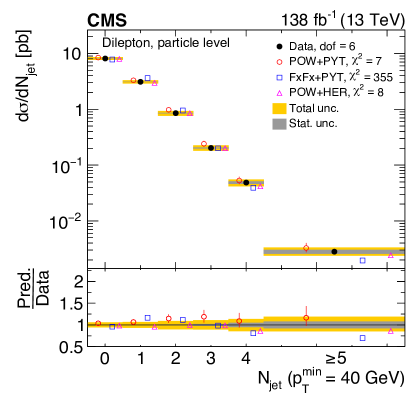
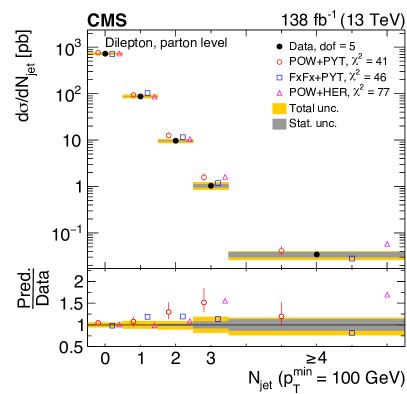
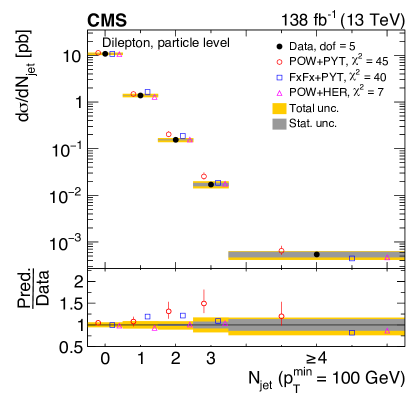
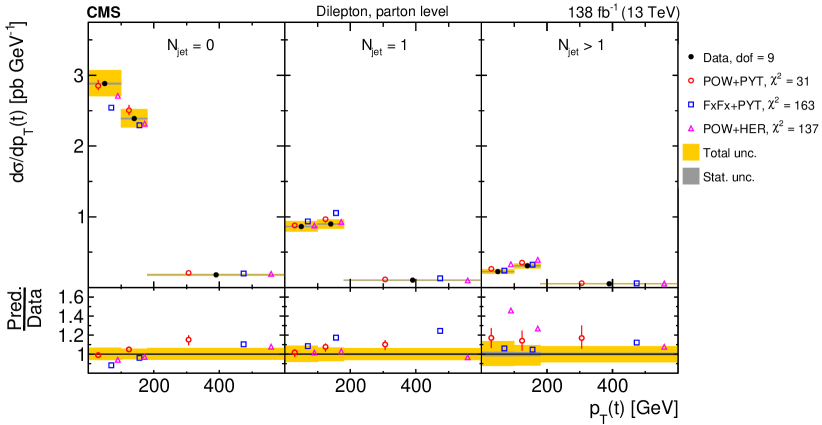
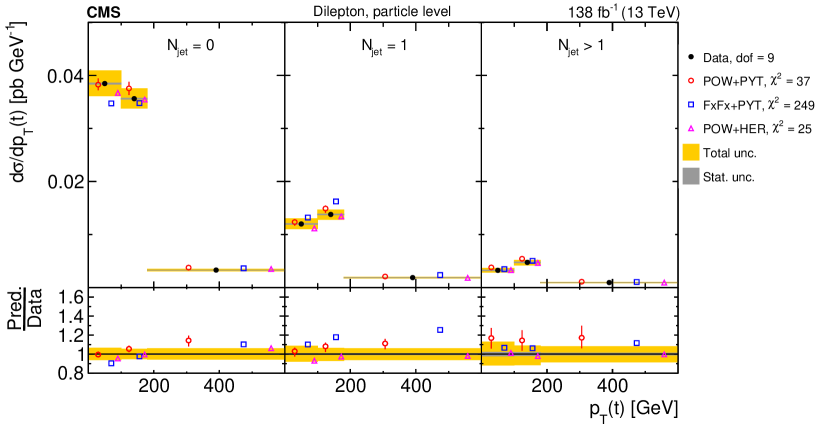
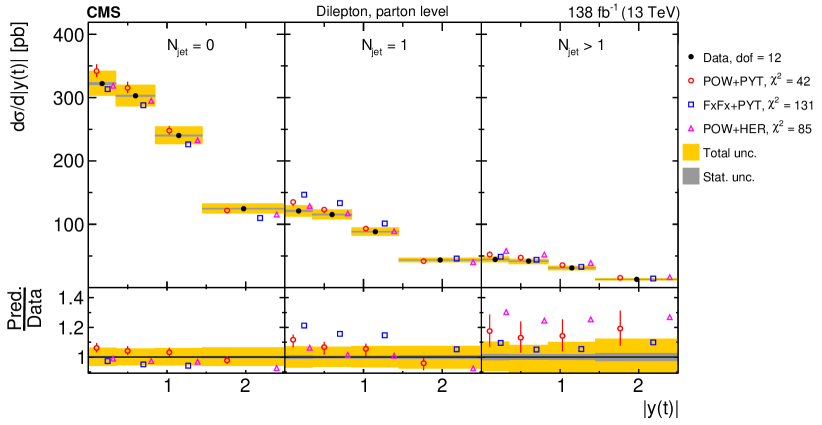

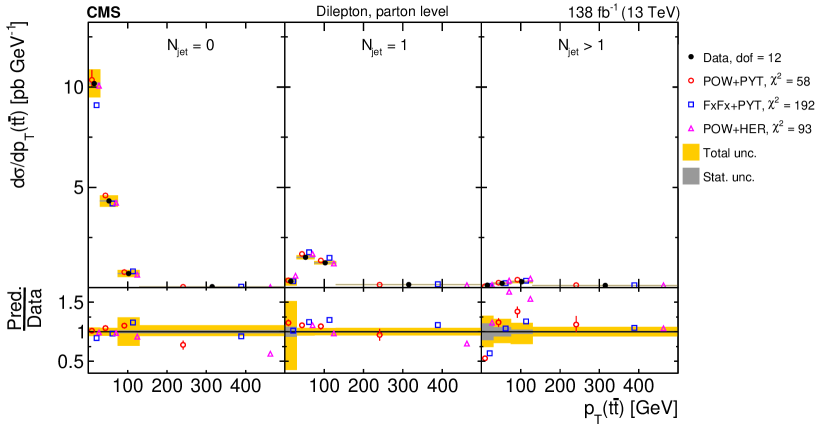
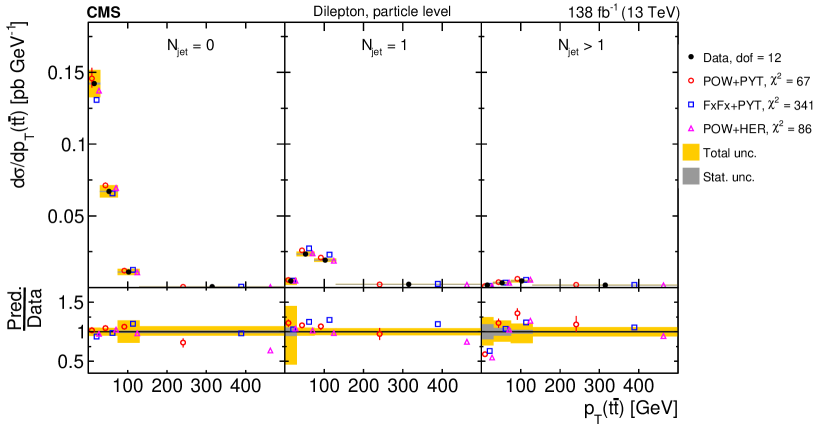
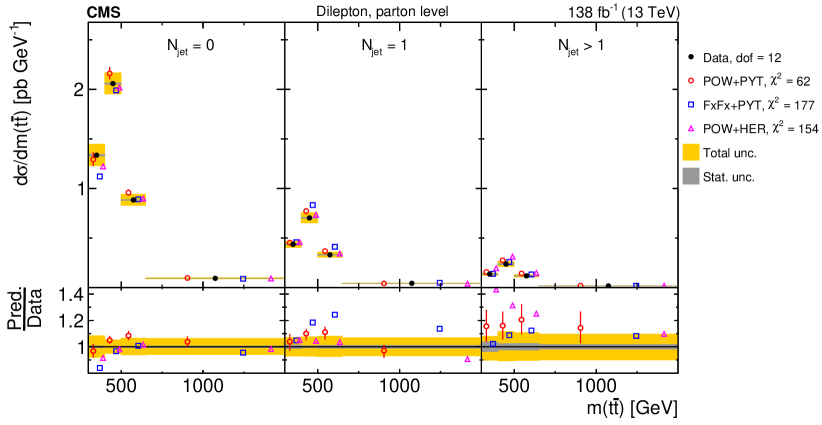


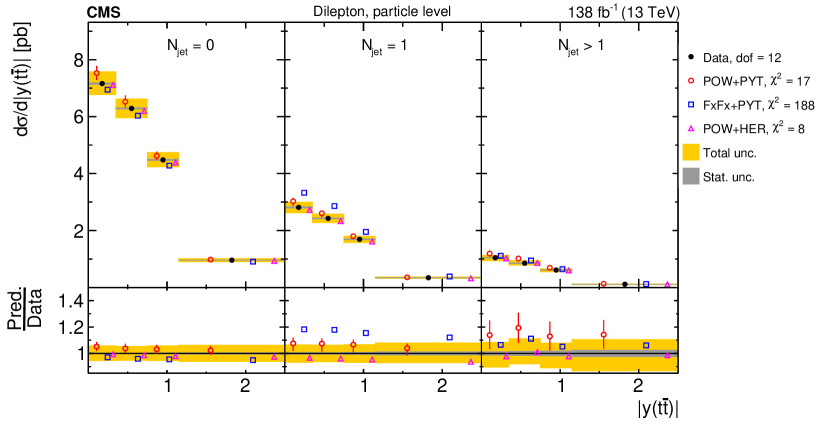
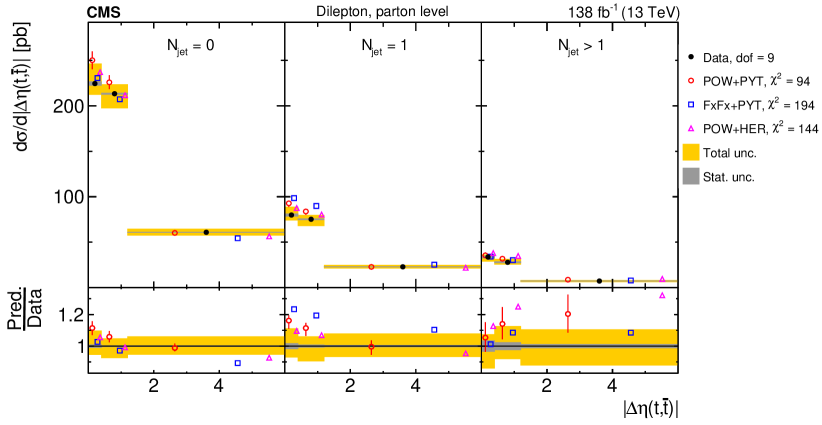
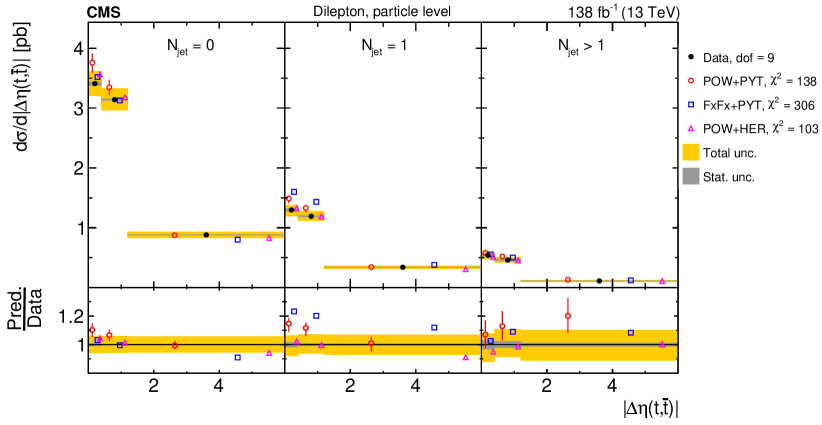
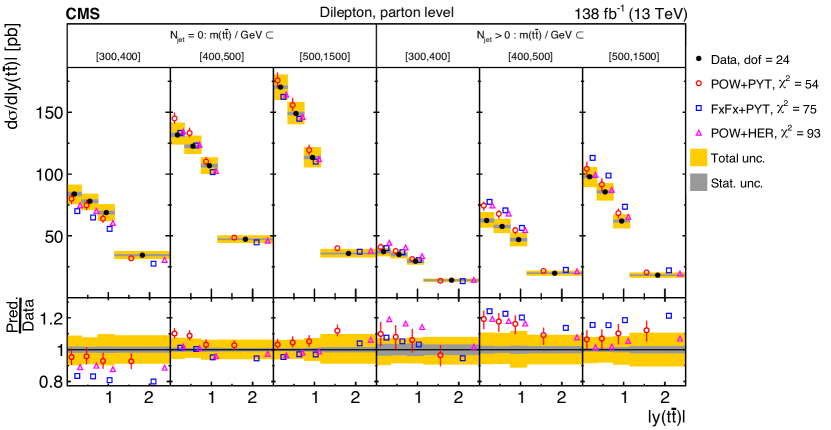
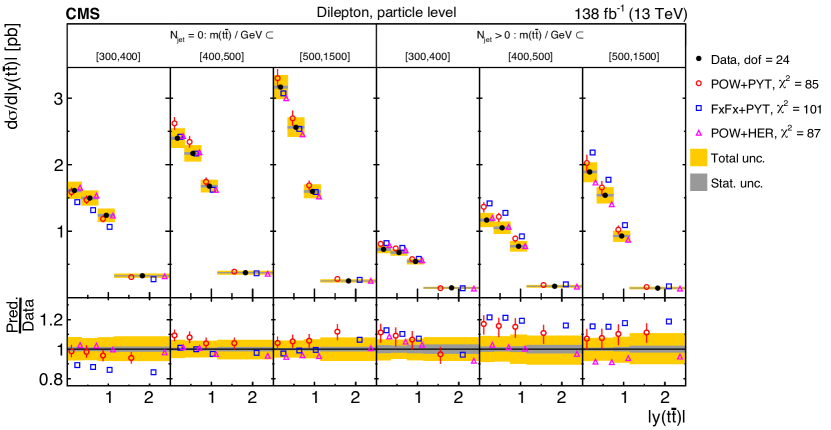
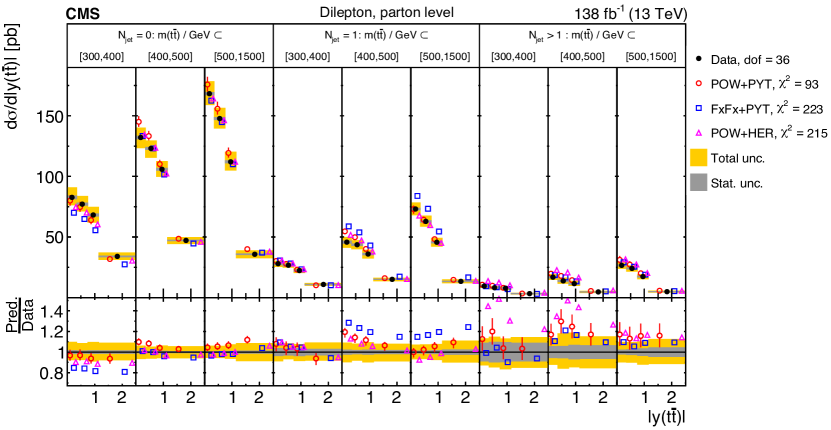
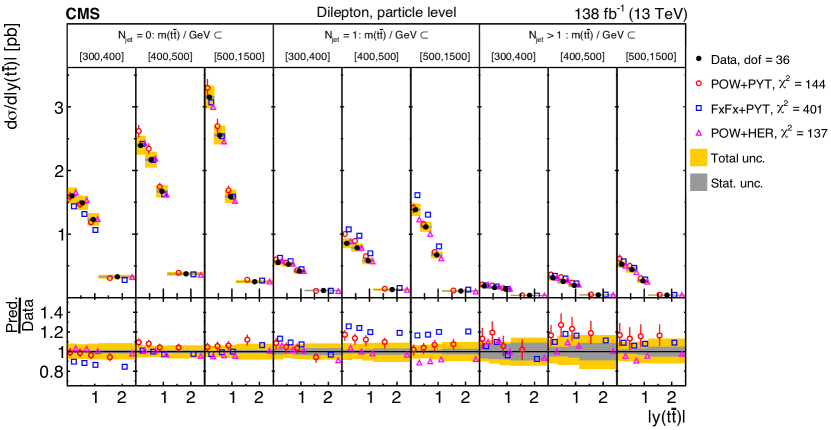
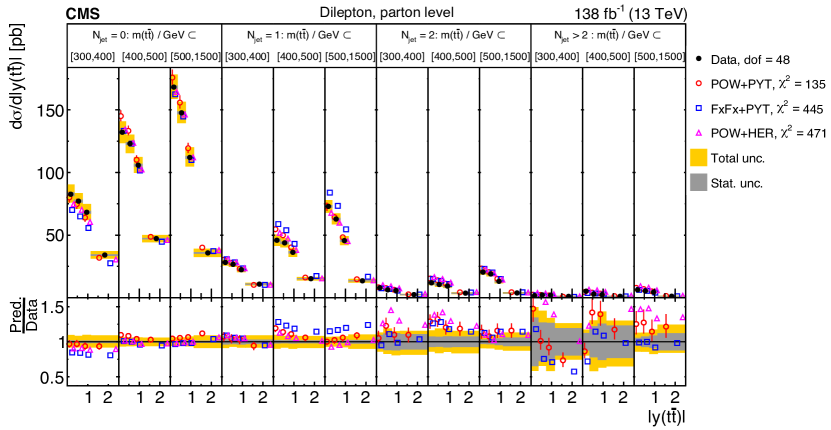
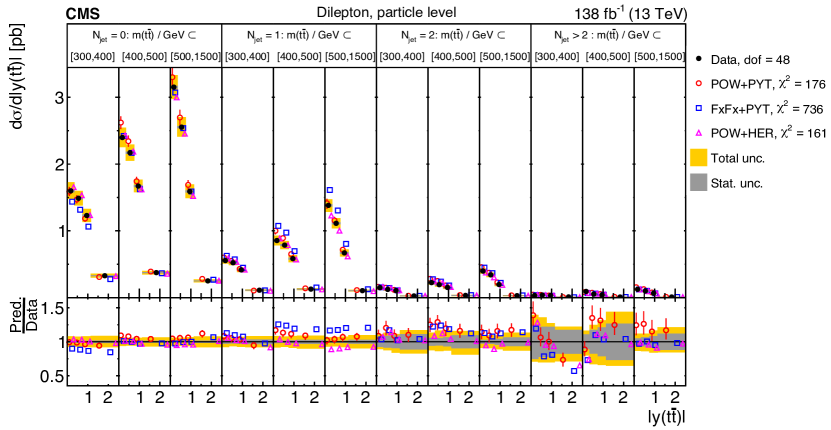
The values and dof of the measured absolute single-differential cross sections for \ttbarand top quark kinematic observables at the parton level are shown with respect to the predictions of various MC generators. The values are calculated taking only measurement uncertainties into account and excluding theory uncertainties. For POW+PYT, the values including theory uncertainties are indicated with the brackets (w. unc.). Cross section dof variables POW+PYT (w. unc.) FxFx+PYT POW+HER 7 21 (13) 43 5 7 19 (12) 43 6 10 28 (24) 34 21 10 33 (28) 40 25 7 24 (8) 39 35 12 13 (9) 19 8 7 6 (4) 9 4 4 4 (2) 7 11 8 18 (10) 19 14 5 39 (21) 104 13 9 20 (7) 32 39 9 16 (12) 18 12 9 14 (9) 24 7
The values and dof of the measured absolute single-differential cross sections for \ttbarand top quark kinematic observables at the particle level are shown with respect to the predictions of various MC generators. The values are calculated taking only measurement uncertainties into account and excluding theory uncertainties. For POW+PYT, the values including theory uncertainties are indicated with the brackets (w. unc.). Cross section dof variables POW+PYT (w. unc.) FxFx+PYT POW+HER 7 22 (13) 44 7 7 20 (12) 44 5 10 24 (18) 32 19 10 28 (23) 32 26 7 23 (8) 34 41 12 13 (8) 23 9 7 7 (4) 5 7 4 4 (1) 4 7 8 17 (11) 15 18 5 33 (23) 71 14 9 21 (7) 46 61 9 16 (10) 17 19 9 12 (7) 19 10
The values and dof of the measured absolute multi-differential cross sections for \ttbarand top quark kinematic observables at the parton level are shown with respect to the predictions of various MC generators. The values are calculated taking only measurement uncertainties into account and excluding theory uncertainties. For POW+PYT, the values including theory uncertainties are indicated with the brackets (w. unc.). Cross section dof variables POW+PYT (w. unc.) FxFx+PYT POW+HER 16 48 (36) 75 30 9 93 (36) 156 42 16 50 (25) 72 87 16 72 (46) 67 65 16 32 (17) 37 71 16 68 (47) 77 115 48 102 (71) 119 140 16 67 (39) 84 49 12 182 (34) 236 125 12 82 (51) 50 93
The values and dof of the measured absolute multi-differential cross sections for \ttbarand top quark kinematic observables at the particle level are shown with respect to the predictions of various MC generators. The values are calculated taking only measurement uncertainties into account and excluding theory uncertainties. For POW+PYT, the values including theory uncertainties are indicated with the brackets (w. unc.). Cross section dof variables POW+PYT (w. unc.) FxFx+PYT POW+HER 16 44 (28) 68 27 9 103 (37) 151 46 16 44 (21) 68 64 16 86 (41) 77 81 16 32 (19) 41 66 16 69 (37) 57 112 48 133 (69) 130 170 16 64 (27) 75 37 12 174 (32) 220 114 12 80 (44) 41 98
The values and dof of the measured absolute single-differential cross sections for lepton and \PQb-jet kinematic observables at the particle level are shown with respect to the predictions of various MC generators. The values are calculated taking only measurement uncertainties into account and excluding theory uncertainties. For POW+PYT, the values including theory uncertainties are indicated with the brackets (w. unc.). Cross section dof variables POW+PYT (w. unc.) FxFx+PYT POW+HER 12 32 (19) 62 21 trailing/ leading 10 16 (11) 27 7 / 5 20 (17) 28 14 leading 10 6 (5) 31 8 trailing 7 7 (5) 26 7 4 24 (19) 30 21 12 31 (25) 29 23 7 21 (16) 17 15 19 36 (19) 30 27 9 4 (3) 17 10 14 16 (10) 22 12 24 55 (29) 76 35 20 30 (15) 84 24 30 50 (39) 88 52
The values and dof of the measured absolute differential cross sections as a function of the additional-jet multiplicity in the events, at the parton level of the top quark and antiquark, are shown with respect to the predictions of various MC generators. The values are calculated taking only measurement uncertainties into account and excluding theory uncertainties. For POW+PYT, the values including theory uncertainties are indicated with the brackets (w. unc.). Cross section dof variables POW+PYT (w. unc.) FxFx+PYT POW+HER 6 7 (5) 288 258 5 41 (11) 46 77 9 31 (17) 163 137 12 42 (32) 131 85 12 58 (43) 192 93 12 62 (48) 177 154 12 14 (7) 122 61 9 94 (40) 194 144 24 54 (39) 75 93 36 93 (63) 223 215 48 135 (92) 445 471
The values and dof of the measured absolute differential cross sections as a function of the additional-jet multiplicity in the events, at the particle level of the top quark and antiquark, are shown with respect to the predictions of various MC generators. The values are calculated taking only measurement uncertainties into account and excluding theory uncertainties. For POW+PYT, the values including theory uncertainties are indicated with the brackets (w. unc.). Cross section dof variables POW+PYT (w. unc.) FxFx+PYT POW+HER 6 7 (4) 355 8 5 45 (11) 40 7 9 37 (15) 249 25 12 44 (26) 182 27 12 67 (41) 341 86 12 60 (40) 302 50 12 17 (6) 188 8 9 138 (43) 306 103 24 85 (46) 101 87 36 144 (71) 401 137 48 176 (97) 736 161
.12.2 Comparisons to higher-order theoretical predictions
The absolute differential cross sections comparing data to theoretical predictions of beyond-NLO precision are shown in Figs. 98–120, and the corresponding values are given in Tables .12.2–.12.2. The -values of the tests are presented in Tables .13–.13. The theoretical calculations are those discussed in Section 0.9.4: , Stripper (NNLO), Matrix (NNLO), and MiNNLOPS (NNLOPS). Comparing the absolute cross sections to the normalized ones in Section 0.9.4, one can see a similar level of agreement between data and predictions. We conclude that the calculations provide overall reasonable predictions of the total normalization of the data.
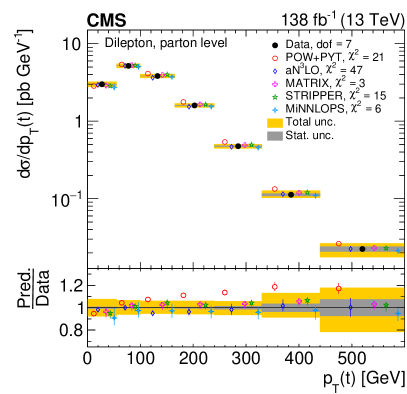
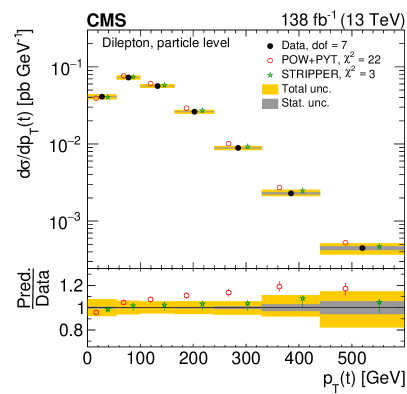
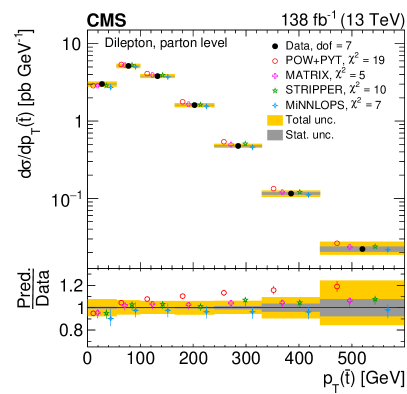
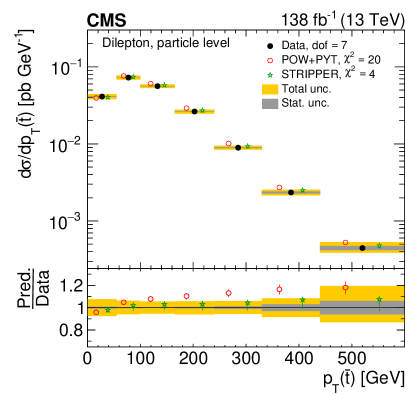
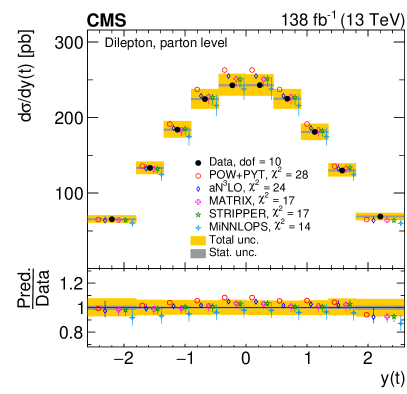
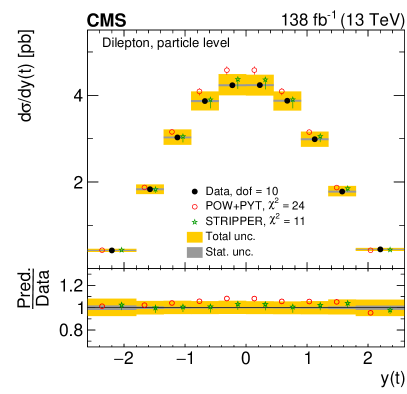
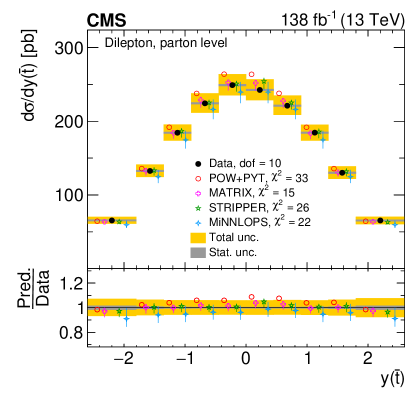

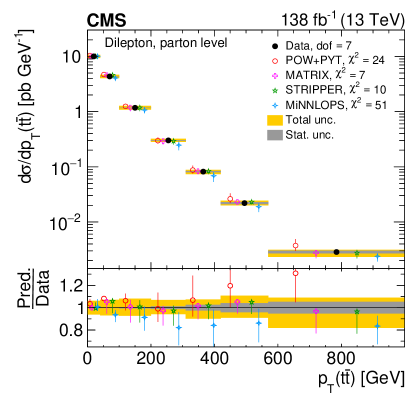
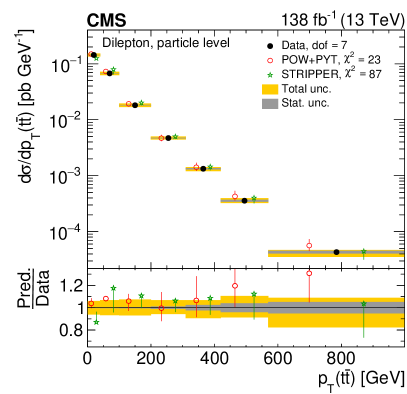
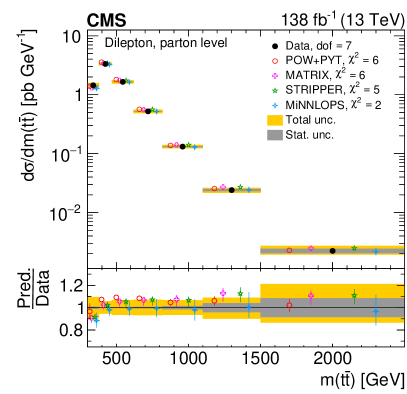
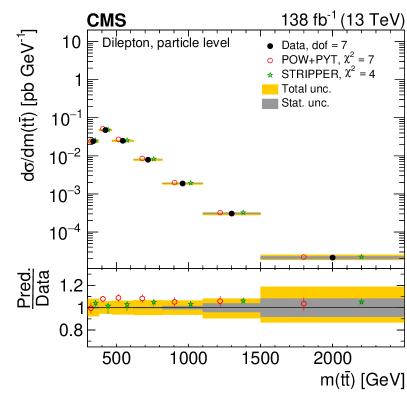
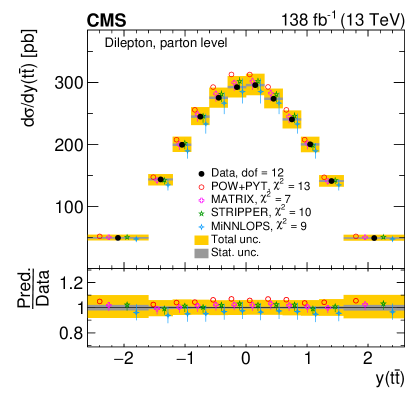
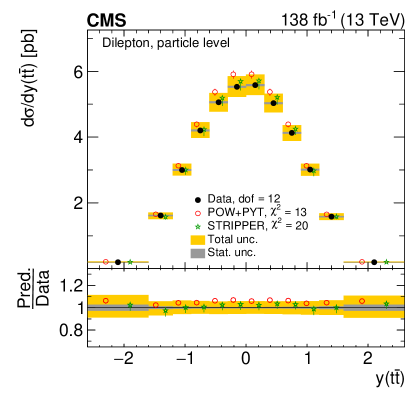
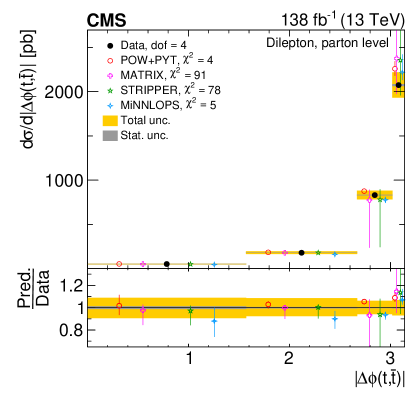
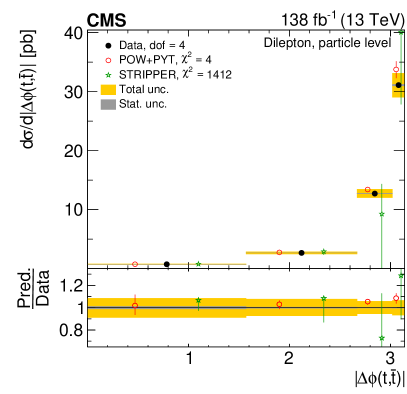
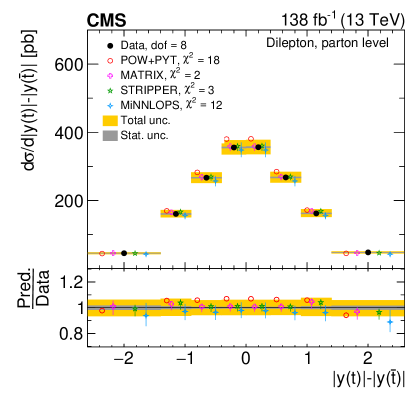
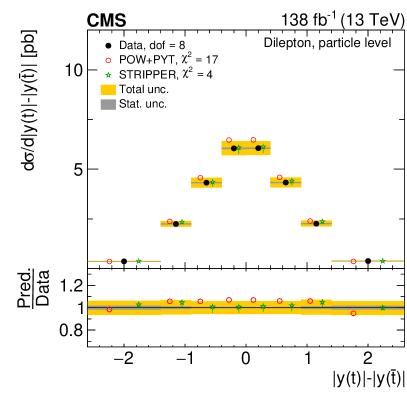
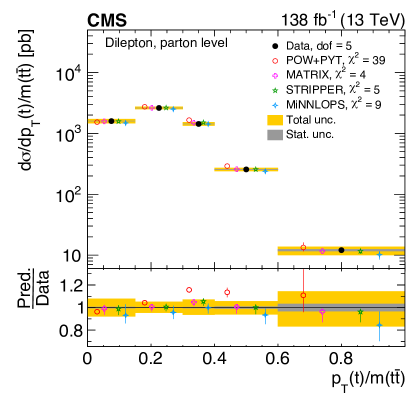
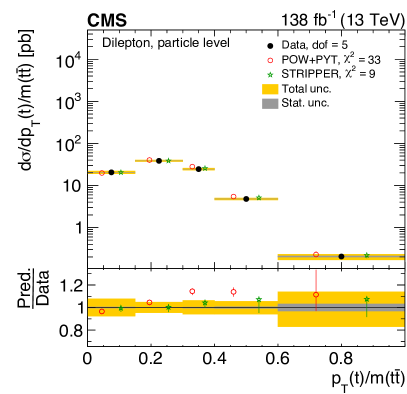
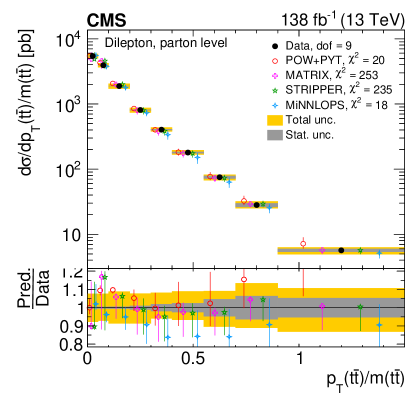
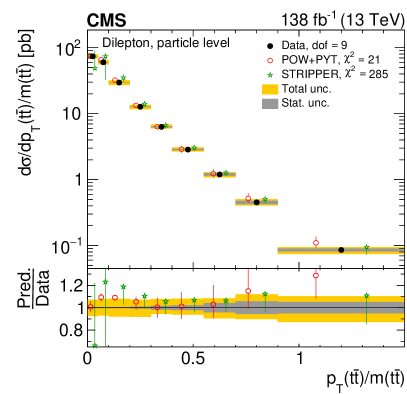

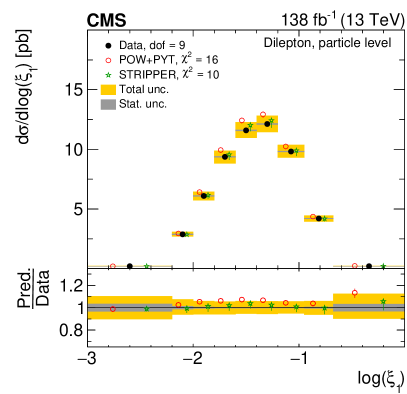

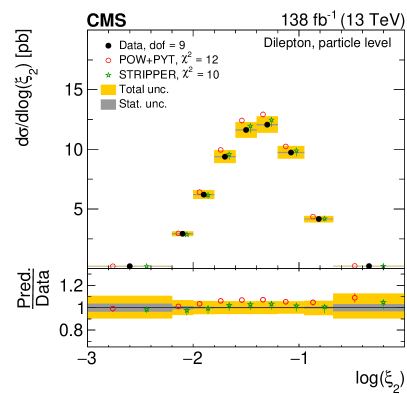
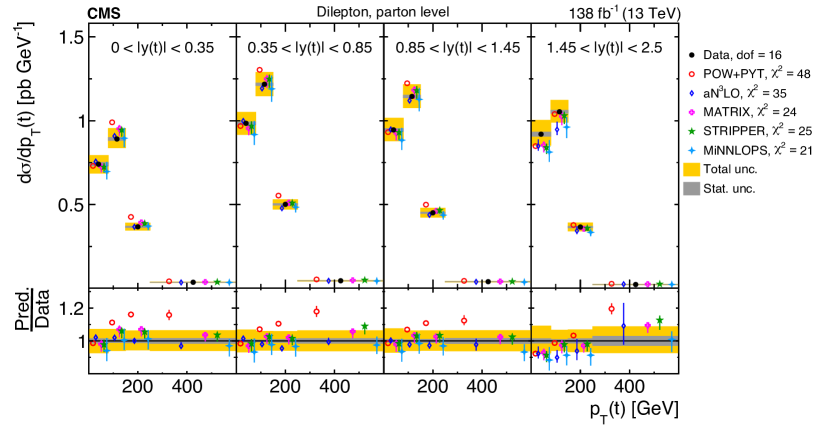
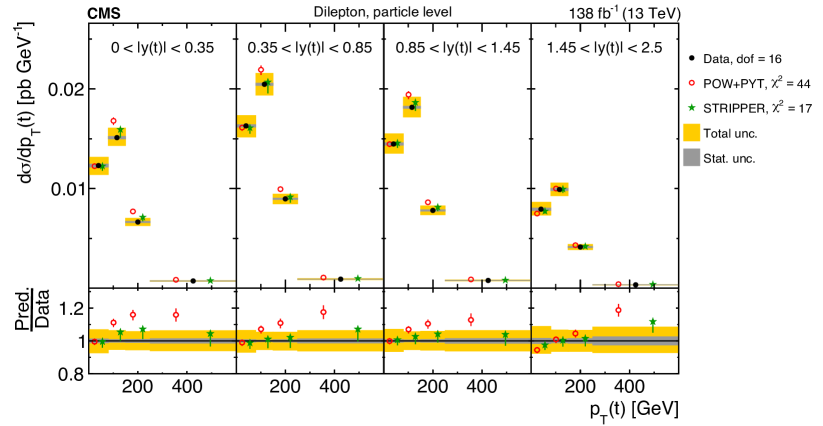
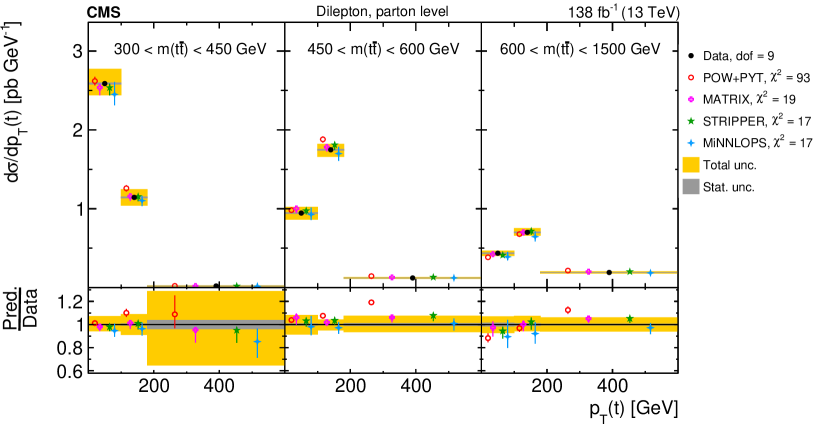
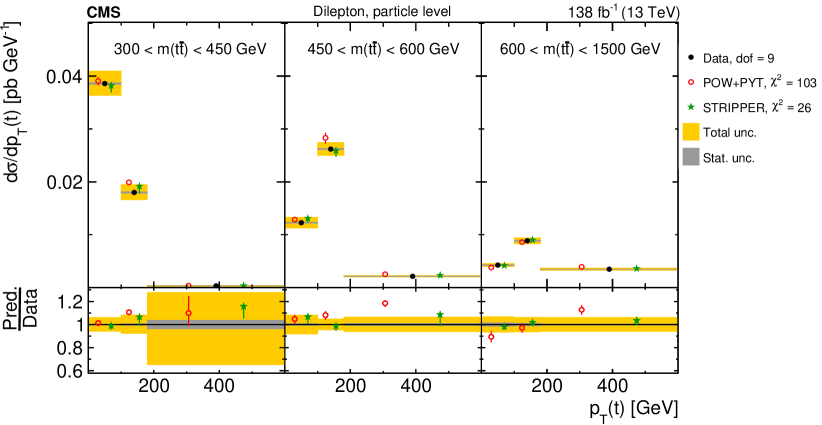
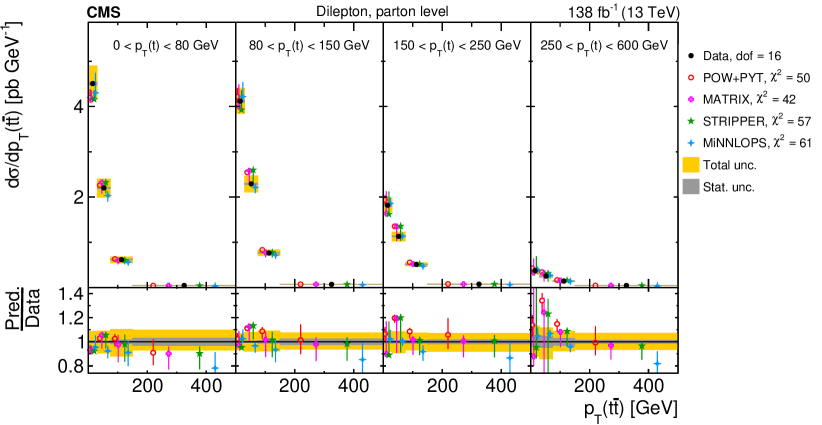

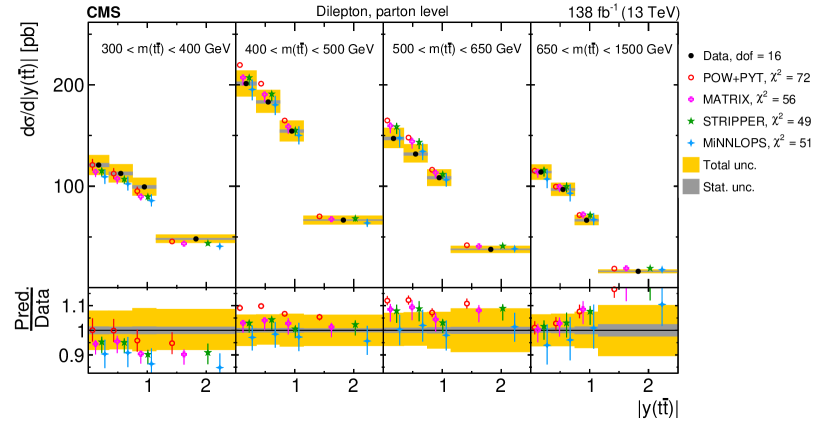
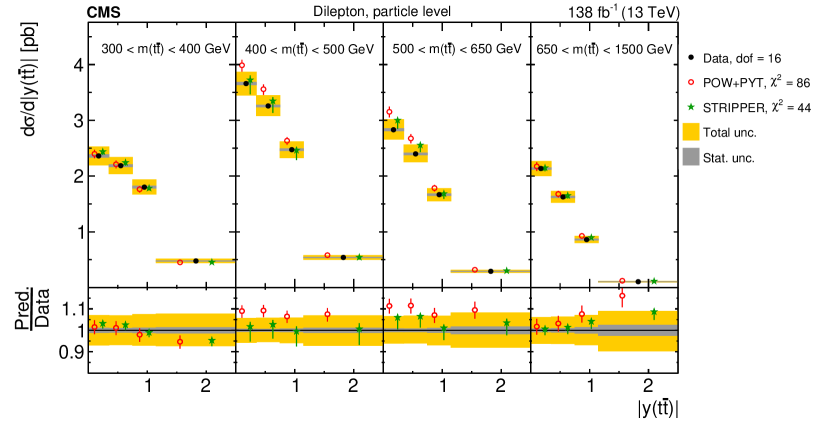
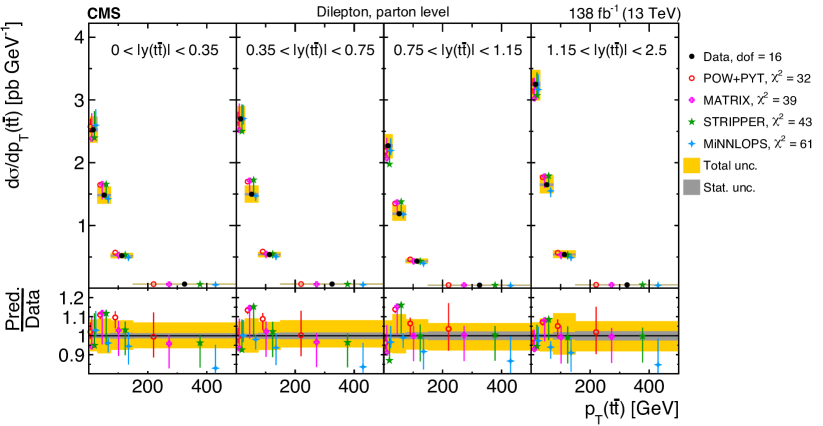
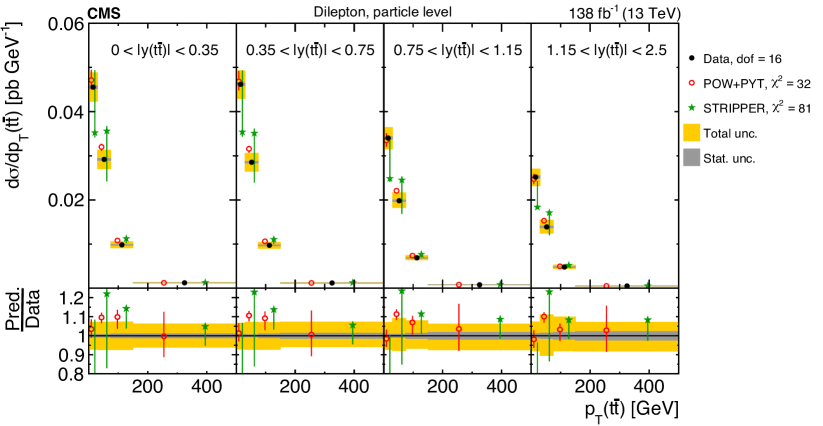
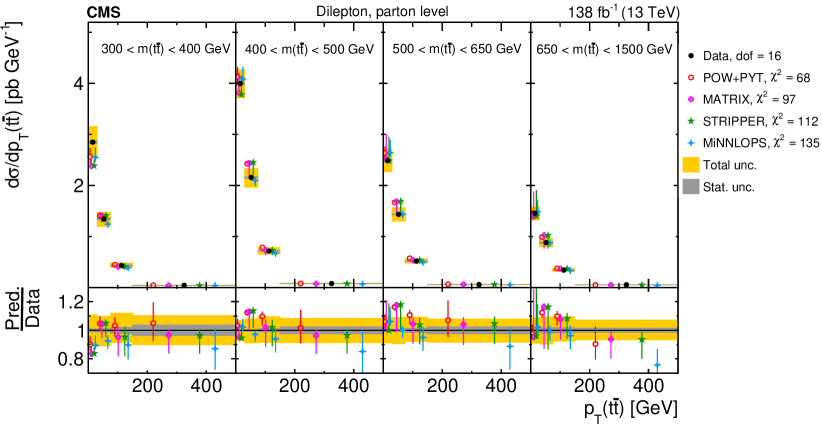
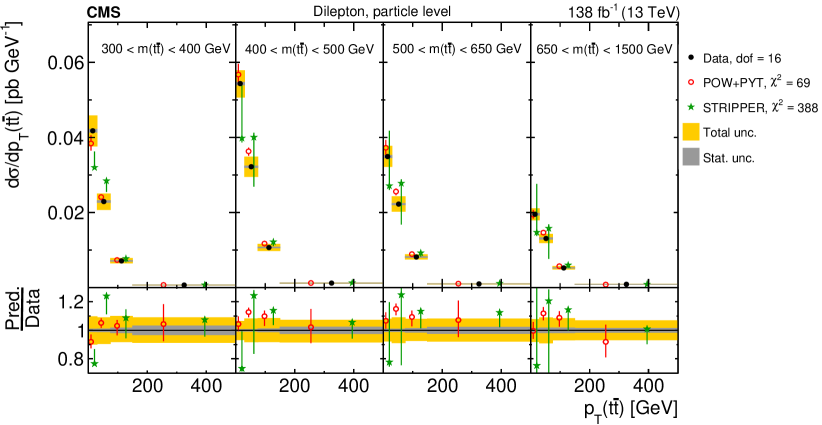

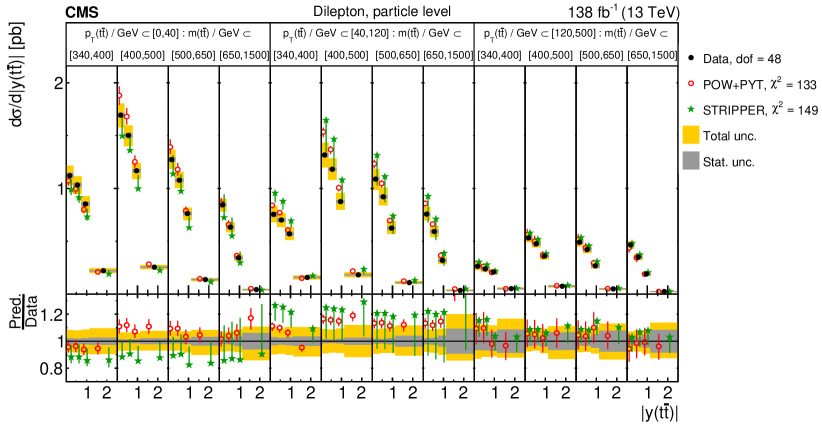
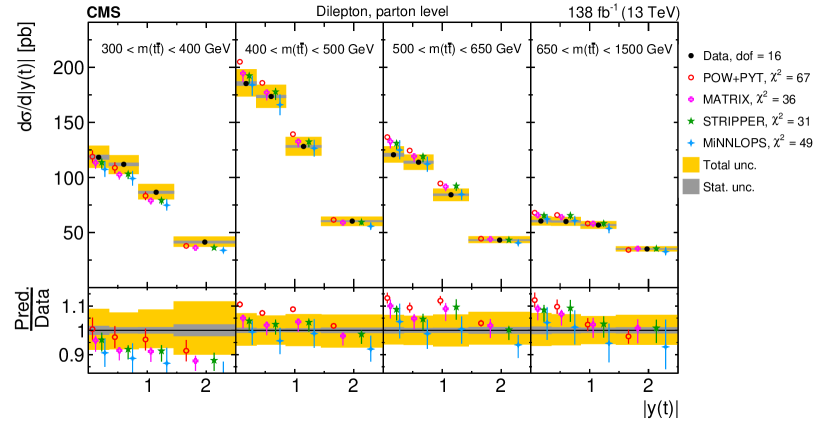
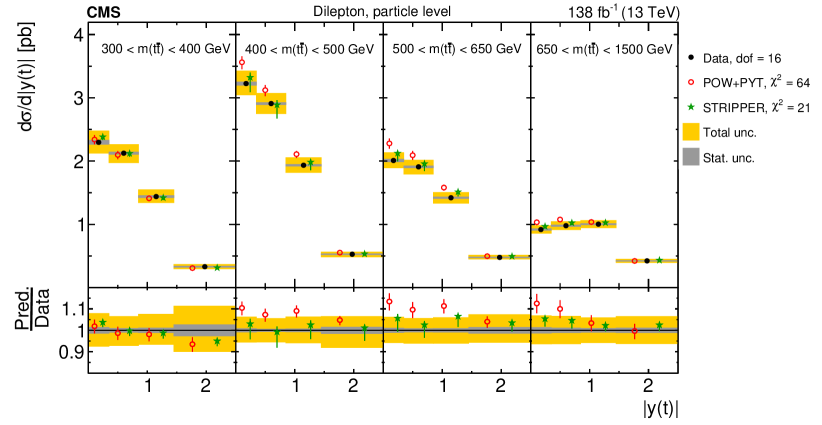
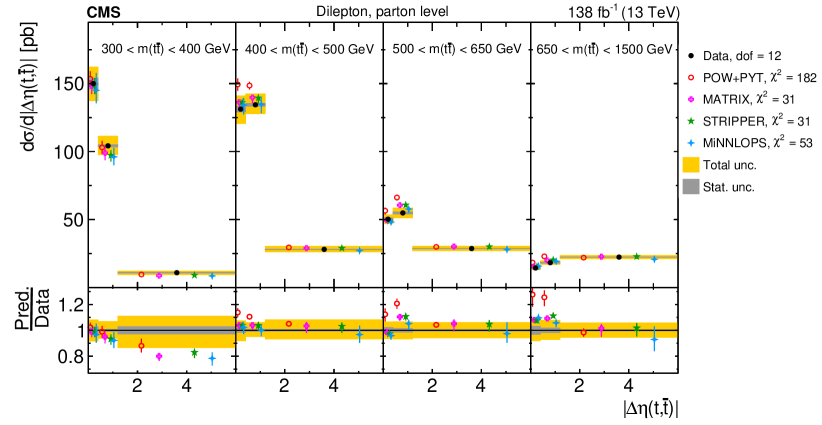
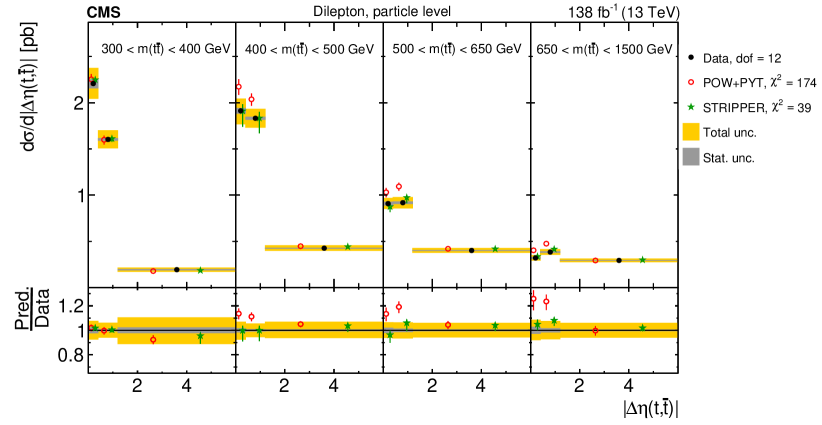
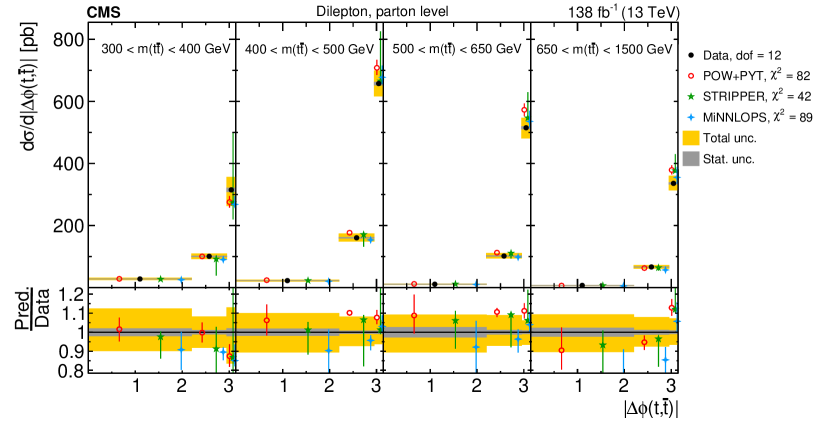
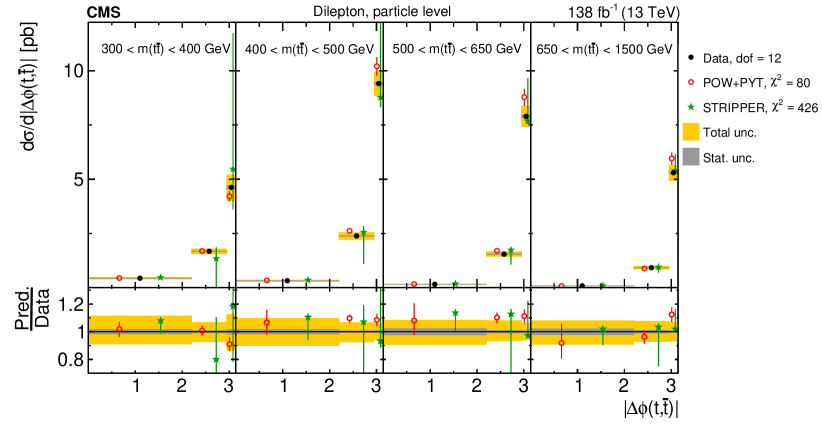
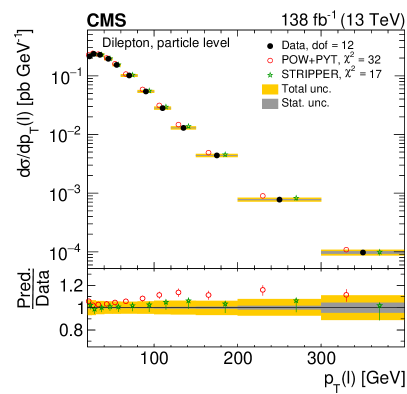
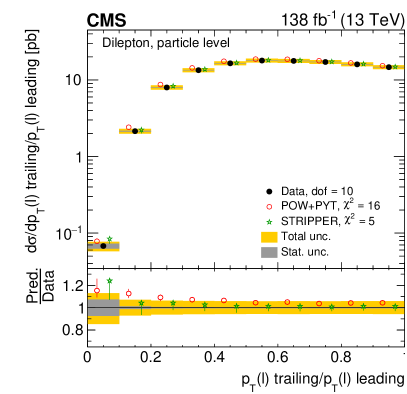
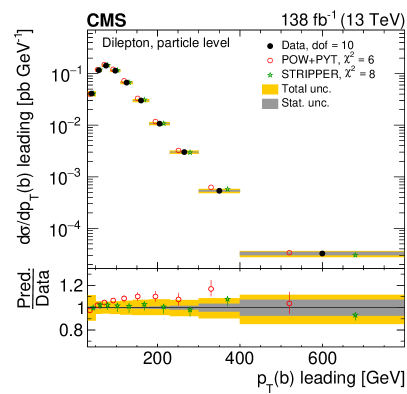
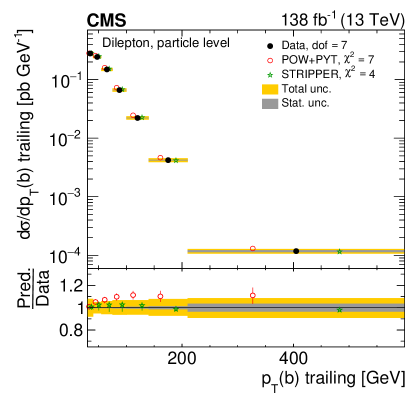
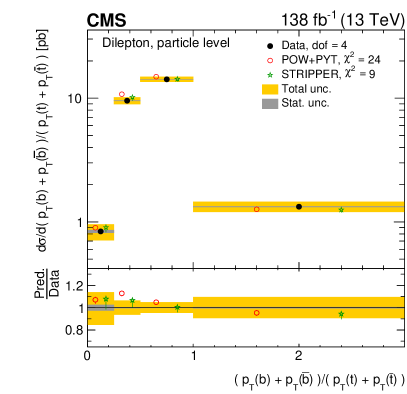
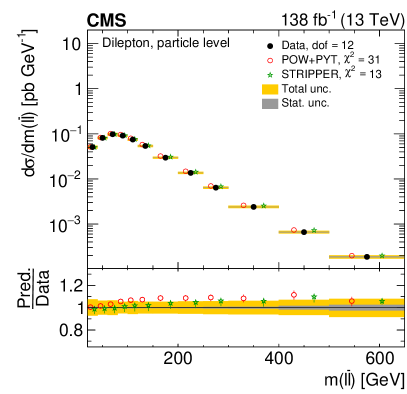
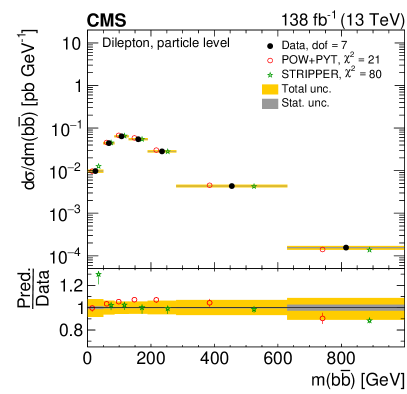
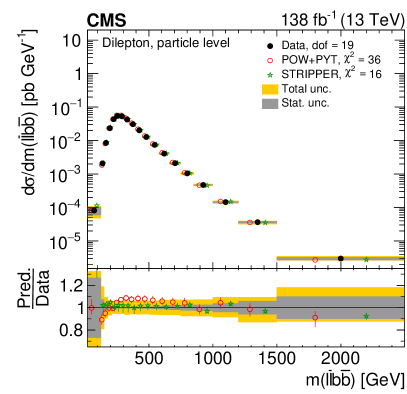
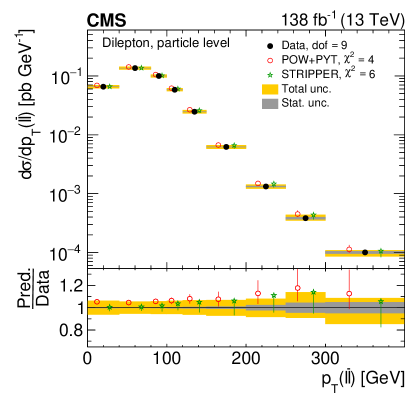
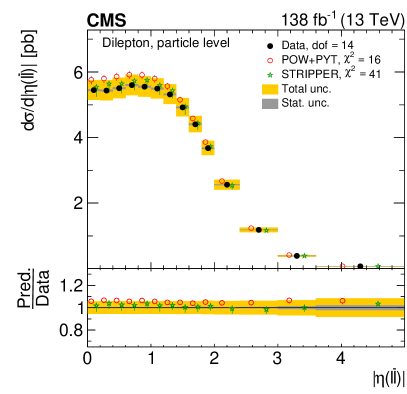
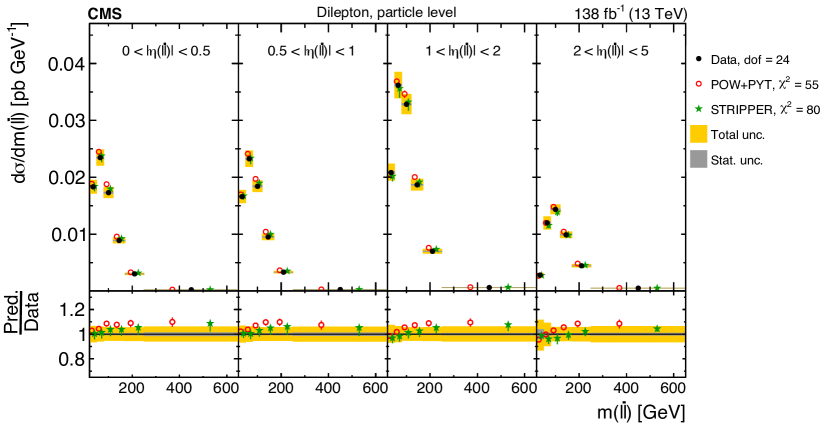
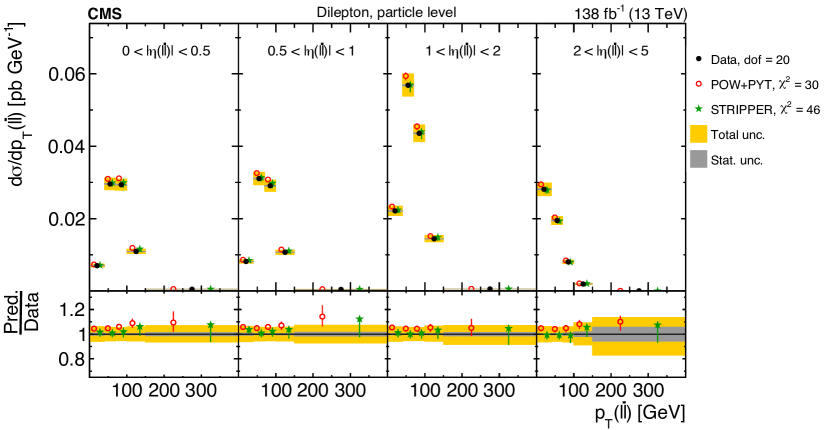
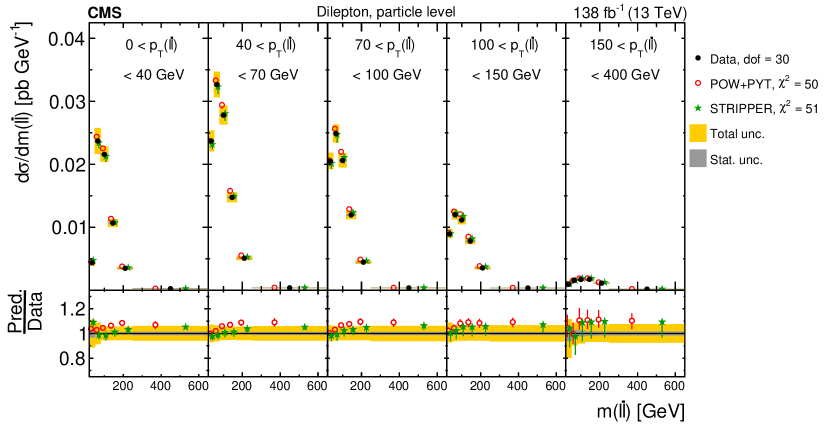
The values and dof of the measured absolute single-differential cross sections for \ttbarand top quark kinematic observables at the parton level are shown with respect to the \POWHEG+\PYTHIA8 (‘POW-PYT’) simulation and various theoretical predictions with beyond-NLO precision. The values are calculated taking only measurement uncertainties into account and excluding theory uncertainties. The corresponding values including theory uncertainties are indicated with the brackets (w. unc.). Cross section dof variables POW+PYT (w. unc.) (w. unc.) Matrix (w. unc.) Stripper (w. unc.) MiNNLOPS (w. unc.) 7 21 (13) 47 (33) 3 (3) 15 (6) 6 (5) 7 19 (12) \NA 5 (4) 10 (10) 7 (5) 10 28 (24) 24 (13) 17 (17) 17 (17) 14 (14) 10 33 (28) \NA 15 (14) 26 (24) 22 (19) 7 24 (8) \NA 7 (3) 10 (3) 51 (15) 12 13 (9) \NA 7 (7) 10 (9) 9 (9) 7 6 (4) \NA 6 (4) 5 (4) 2 (2) 4 4 (2) \NA 91 (0) 78 (1) 5 (4) 8 18 (10) \NA 2 (2) 3 (3) 12 (10) 5 39 (21) \NA 4 (3) 5 (5) 9 (3) 9 20 (7) \NA 253 (9) 235 (10) 18 (6) 9 16 (12) \NA \NA 15 (14) 12 (11) 9 14 (9) \NA \NA 13 (11) 7 (6)
The values and dof of the measured absolute single-differential cross sections for \ttbarand top quark kinematic observables at the particle level are shown with respect to the \POWHEG+\PYTHIA8 (‘POW-PYT’) simulation and the Stripper NNLO calculation. The values are calculated taking only measurement uncertainties into account and excluding theory uncertainties. The corresponding values including theory uncertainties are indicated with the brackets (w. unc.). Cross section dof variables POW+PYT (w. unc.) Stripper (w. unc.) 7 22 (13) 3 (2) 7 20 (12) 4 (2) 10 24 (18) 11 (11) 10 28 (23) 10 (9) 7 23 (8) 87 (8) 12 13 (8) 20 (18) 7 7 (4) 4 (2) 4 4 (1) 1412 (6) 8 17 (11) 4 (3) 5 33 (23) 9 (6) 9 21 (7) 285 (8) 9 16 (10) 10 (10) 9 12 (7) 10 (10)
The values and dof of the measured absolute multi-differential cross sections for \ttbarand top quark kinematic observables at the parton level are shown with respect to the \POWHEG+\PYTHIA8 (‘POW-PYT’) simulation and various theoretical predictions with beyond-NLO precision. The values are calculated taking only measurement uncertainties into account and excluding theory uncertainties. The corresponding values including theory uncertainties are indicated with the brackets (w. unc.). Cross section dof variables POW+PYT (w. unc.) (w. unc.) Matrix (w. unc.) Stripper (w. unc.) MiNNLOPS (w. unc.) 16 48 (36) 35 (35) 24 (24) 25 (24) 21 (21) 9 93 (36) \NA 19 (16) 17 (14) 17 (9) 16 50 (25) \NA 42 (37) 57 (56) 61 (31) 16 72 (46) \NA 56 (53) 49 (48) 51 (42) 16 32 (17) \NA 39 (35) 43 (40) 61 (28) 16 68 (47) \NA 97 (81) 112 (91) 135 (37) 48 102 (71) \NA \NA 74 (74) 103 (83) 16 67 (39) \NA 36 (36) 31 (31) 49 (45) 12 182 (34) \NA 31 (30) 31 (31) 53 (20) 12 82 (51) \NA \NA 42 (27) 89 (68)
The values and dof of the measured absolute multi-differential cross sections for \ttbarand top quark kinematic observables at the particle level are shown with respect to the \POWHEG+\PYTHIA8 (‘POW-PYT’) simulation and the Stripper NNLO calculation. The values are calculated taking only measurement uncertainties into account and excluding theory uncertainties. The corresponding values including theory uncertainties are indicated with the brackets (w. unc.). Cross section dof variables POW+PYT (w. unc.) Stripper (w. unc.) 16 44 (28) 17 (16) 9 103 (37) 26 (17) 16 44 (21) 169 (106) 16 86 (41) 44 (43) 16 32 (19) 81 (38) 16 69 (37) 388 (145) 48 133 (69) 149 (82) 16 64 (27) 21 (20) 12 174 (32) 39 (25) 12 80 (44) 426 (327)
The values and dof of the measured absolute single-differential cross sections for lepton and \PQb-jet kinematic observables at the particle level are shown with respect to the \POWHEG+\PYTHIA8 (‘POW-PYT’) simulation and the Stripper NNLO calculation. The values are calculated taking only measurement uncertainties into account and excluding theory uncertainties. The corresponding values including theory uncertainties are indicated with the brackets (w. unc.). Cross section dof variables POW+PYT (w. unc.) Stripper (w. unc.) 12 32 (19) 17 (17) trailing/ leading 10 16 (11) 5 (5) / 5 20 (17) 8 (6) leading 10 6 (5) 8 (8) trailing 7 7 (5) 4 (1) 4 24 (19) 9 (8) 12 31 (25) 13 (13) 7 21 (16) 80 (72) 19 36 (19) 16 (15) 9 4 (3) 6 (3) 14 16 (10) 41 (24) 24 55 (29) 80 (59) 20 30 (15) 46 (28) 30 50 (39) 51 (51)
.13 Tables with -values of tests
Tables .13–.13 present the -values of the performed tests between the measured differential cross sections for \ttbarproduction and various predictions. The corresponding values and number of degrees of freedom can be found in the Tables 0.9.1–.12.2.
The -values are shown for the tests of the measured normalized single-differential cross sections for \ttbarand top quark kinematic observables at the parton level with respect to the predictions of various MC generators. The values are calculated taking only measurement uncertainties into account and excluding theory uncertainties. For POW+PYT, the -values of the tests including theory uncertainties are indicated with the brackets (w. unc.). Cross section -values of (in %) variables POW+PYT (w. unc.) FxFx+PYT POW+HER 2 (10) 1 51 5 (16) 1 41 1 (2) 1 1 1 (1) 1 1 1 (32) 1 1 51 (74) 7 73 56 (77) 30 70 82 (97) 15 7 3 (22) 1 6 1 (1) 1 3 3 (62) 1 1 9 (26) 3 15 24 (54) 1 51
The -values are shown for the tests of the measured normalized single-differential cross sections for \ttbarand top quark kinematic observables at the particle level with respect to the predictions of various MC generators. The values are calculated taking only measurement uncertainties into account and excluding theory uncertainties. For POW+PYT, the -values of the tests including theory uncertainties are indicated with the brackets (w. unc.). Cross section -values of (in %) variables POW+PYT (w. unc.) FxFx+PYT POW+HER 1 (7) 1 47 3 (15) 1 59 3 (7) 1 2 1 (2) 1 1 1 (33) 1 1 51 (81) 3 64 59 (81) 60 28 82 (97) 36 10 4 (20) 4 1 1 (1) 1 2 2 (57) 1 1 8 (34) 3 2 32 (67) 3 29
The -values are shown for the tests of the measured normalized multi-differential cross sections for \ttbarand top quark kinematic observables at the parton level with respect to the predictions of various MC generators. The values are calculated taking only measurement uncertainties into account and excluding theory uncertainties. For POW+PYT, the -values of the tests including theory uncertainties are indicated with the brackets (w. unc.). Cross section -values of (in %) variables POW+PYT (w. unc.) FxFx+PYT POW+HER 1 (1) 1 1 1 (1) 1 1 1 (14) 1 1 1 (1) 1 1 2 (44) 1 1 1 (1) 1 1 1 (5) 1 1 1 (1) 1 1 1 (1) 1 1 1 (1) 1 1
The -values are shown for the tests of the measured normalized multi-differential cross sections for \ttbarand top quark kinematic observables at the particle level with respect to the predictions of various MC generators. The values are calculated taking only measurement uncertainties into account and excluding theory uncertainties. For POW+PYT, the -values of the tests including theory uncertainties are indicated with the brackets (w. unc.). Cross section -values of (in %) variables POW+PYT (w. unc.) FxFx+PYT POW+HER 1 (5) 1 2 1 (1) 1 1 1 (21) 1 1 1 (1) 1 1 3 (28) 1 1 1 (1) 1 1 1 (3) 1 1 1 (4) 1 1 1 (1) 1 1 1 (1) 1 1
The -values are shown for the tests of the measured normalized single-differential cross sections for lepton and \PQb-jet kinematic observables at the particle level with respect to the predictions of various MC generators. The values are calculated taking only measurement uncertainties into account and excluding theory uncertainties. For POW+PYT, the -values of the tests including theory uncertainties are indicated with the brackets (w. unc.). Cross section -values of (in %) variables POW+PYT (w. unc.) FxFx+PYT POW+HER 1 (8) 1 9 trailing/ leading 10 (30) 1 66 / 4 (6) 1 2 leading 86 (92) 1 55 trailing 48 (70) 1 35 1 (1) 1 1 2 (5) 1 2 2 (7) 2 3 2 (45) 6 6 86 (96) 9 31 40 (77) 7 58 1 (23) 1 4 10 (78) 1 19 3 (15) 1 1
The -values are shown for the tests of the measured normalized differential cross sections as a function of the additional-jet multiplicity in the events, at the parton level of the top quark and antiquark, with respect to the predictions of various MC generators. The values are calculated taking only measurement uncertainties into account and excluding theory uncertainties. For POW+PYT, the -values of the tests including theory uncertainties are indicated with the brackets (w. unc.). Cross section -values of (in %) variables POW+PYT (w. unc.) FxFx+PYT POW+HER 34 (64) 1 1 1 (11) 1 1 1 (14) 1 1 1 (1) 1 1 1 (1) 1 1 1 (1) 1 1 46 (94) 1 1 1 (1) 1 1 1 (5) 1 1 1 (1) 1 1 1 (1) 1 1
The -values are shown for the tests of the measured normalized differential cross sections as a function of the additional-jet multiplicity in the events, at the particle level of the top quark and antiquark, with respect to the predictions of various MC generators. The values are calculated taking only measurement uncertainties into account and excluding theory uncertainties. For POW+PYT, the -values of the tests including theory uncertainties are indicated with the brackets (w. unc.). Cross section -values of (in %) variables POW+PYT (w. unc.) FxFx+PYT POW+HER 30 (63) 1 12 1 (8) 1 19 1 (12) 1 1 1 (1) 1 1 1 (1) 1 1 1 (1) 1 1 22 (94) 1 65 1 (1) 1 1 1 (1) 1 1 1 (1) 1 1 1 (1) 1 1
The -values are shown for the tests of the measured normalized single-differential cross sections for \ttbarand top quark kinematic observables at the parton level with respect to various fixed-order predictions. The values are calculated taking only measurement uncertainties into account and excluding theory uncertainties. The -values of the tests including theory uncertainties are indicated with the brackets (w. unc.). Cross section -values of (in %) variables POW+PYT (w. unc.) (w. unc.) Matrix (w. unc.) Stripper (w. unc.) MiNNLOPS (w. unc.) 2 (10) 1 (1) 78 (85) 22 (51) 62 (64) 5 (16) \NA 69 (75) 14 (15) 49 (53) 1 (2) 1 (22) 6 (6) 6 (7) 8 (17) 1 (1) \NA 10 (15) 1 (1) 1 (5) 1 (32) \NA 33 (90) 15 (86) 1 (4) 51 (74) \NA 84 (85) 61 (65) 61 (62) 56 (77) \NA 49 (69) 59 (73) 90 (94) 82 (97) \NA 1 (93) 1 (90) 14 (29) 3 (22) \NA 94 (94) 86 (86) 10 (22) 1 (1) \NA 58 (64) 41 (44) 28 (68) 3 (62) \NA 1 (32) 1 (28) 1 (75) 9 (26) \NA \NA 6 (7) 16 (18) 24 (54) \NA \NA 17 (18) 52 (59)
The -values are shown for the tests of the measured normalized single-differential cross sections for \ttbarand top quark kinematic observables at the particle level with respect to the \POWHEG+\PYTHIA8 (‘POW-PYT’) simulation and the Stripper NNLO calculation. The values are calculated taking only measurement uncertainties into account and excluding theory uncertainties. The -values of the tests including theory uncertainties are indicated with the brackets (w. unc.). Cross section -values of (in %) variables POW+PYT (w. unc.) Stripper (w. unc.) 1 (7) 83 (95) 3 (15) 82 (94) 3 (7) 29 (29) 1 (2) 37 (44) 1 (33) 1 (25) 51 (81) 6 (23) 59 (81) 73 (95) 82 (97) 1 (65) 4 (20) 81 (88) 1 (1) 9 (39) 2 (57) 1 (56) 8 (34) 28 (28) 32 (67) 33 (33)
The -values are shown for the tests of the measured normalized multi-differential cross sections for \ttbarand top quark kinematic observables at the parton level with respect to various fixed-order predictions. The values are calculated taking only measurement uncertainties into account and excluding theory uncertainties. The -values of the tests including theory uncertainties are indicated with the brackets (w. unc.). Cross section -values of (in %) variables POW+PYT (w. unc.) (w. unc.) Matrix (w. unc.) Stripper (w. unc.) MiNNLOPS (w. unc.) 1 (1) 1 (1) 7 (7) 6 (7) 9 (10) 1 (1) \NA 7 (15) 4 (13) 6 (47) 1 (14) \NA 1 (1) 1 (1) 1 (2) 1 (1) \NA 1 (1) 1 (1) 1 (1) 2 (44) \NA 1 (1) 1 (1) 1 (5) 1 (1) \NA 1 (1) 1 (1) 1 (1) 1 (5) \NA \NA 2 (3) 1 (1) 1 (1) \NA 1 (1) 1 (1) 1 (1) 1 (1) \NA 1 (1) 1 (1) 1 (10) 1 (1) \NA \NA 1 (8) 1 (1)
The -values are shown for the tests of the measured normalized multi-differential cross sections for \ttbarand top quark kinematic observables at the particle level with respect to the \POWHEG+\PYTHIA8 (‘POW-PYT’) simulation and the Stripper NNLO calculation. The values are calculated taking only measurement uncertainties into account and excluding theory uncertainties. The -values of the tests including theory uncertainties are indicated with the brackets (w. unc.). Cross section -values of (in %) variables POW+PYT (w. unc.) Stripper (w. unc.) 1 (5) 38 (39) 1 (1) 2 (32) 1 (21) 1 (1) 1 (1) 1 (1) 3 (28) 1 (1) 1 (1) 1 (1) 1 (3) 1 (1) 1 (4) 18 (25) 1 (1) 1 (3) 1 (1) 1 (1)
The -values are shown for the tests of the measured normalized single-differential cross sections for lepton and \PQb-jet kinematic observables at the particle level with respect to the \POWHEG+\PYTHIA8 (‘POW-PYT’) simulation and the Stripper NNLO calculation. The values are calculated taking only measurement uncertainties into account and excluding theory uncertainties. The -values of the tests including theory uncertainties are indicated with the brackets (w. unc.). Cross section -values of (in %) variables POW+PYT (w. unc.) Stripper (w. unc.) 1 (8) 12 (13) trailing/ leading 10 (30) 81 (82) / 4 (6) 33 (34) leading 86 (92) 64 (76) trailing 48 (70) 81 (97) 1 (1) 4 (5) 2 (5) 32 (34) 2 (7) 1 (1) 2 (45) 68 (76) 86 (96) 73 (93) 40 (77) 1 (7) 1 (23) 1 (1) 10 (78) 1 (11) 3 (15) 2 (2)
The -values are shown for the tests of the measured absolute single-differential cross sections for \ttbarand top quark kinematic observables at the parton level with respect to the predictions of various MC generators. The values are calculated taking only measurement uncertainties into account and excluding theory uncertainties. For POW+PYT, the -values of the tests including theory uncertainties are indicated with the brackets (w. unc.). Cross section -values of (in %) variables POW+PYT (w. unc.) FxFx+PYT POW+HER 1 (7) 1 61 1 (9) 1 50 1 (1) 1 2 1 (1) 1 1 1 (35) 1 1 38 (67) 9 78 55 (78) 28 76 40 (81) 14 3 2 (23) 2 9 1 (1) 1 3 2 (66) 1 1 7 (23) 4 20 14 (47) 1 60
The -values are shown for the tests of the measured absolute single-differential cross sections for \ttbarand top quark kinematic observables at the particle level with respect to the predictions of various MC generators. The values are calculated taking only measurement uncertainties into account and excluding theory uncertainties. For POW+PYT, the -values of the tests including theory uncertainties are indicated with the brackets (w. unc.). Cross section -values of (in %) variables POW+PYT (w. unc.) FxFx+PYT POW+HER 1 (7) 1 46 1 (11) 1 68 1 (5) 1 4 1 (1) 1 1 1 (37) 1 1 35 (78) 3 74 46 (80) 67 39 40 (85) 43 13 3 (23) 5 2 1 (1) 1 1 1 (59) 1 1 7 (35) 4 3 22 (67) 3 36
The -values are shown for the tests of the measured absolute multi-differential cross sections for \ttbarand top quark kinematic observables at the parton level with respect to the predictions of various MC generators. The values are calculated taking only measurement uncertainties into account and excluding theory uncertainties. For POW+PYT, the -values of the tests including theory uncertainties are indicated with the brackets (w. unc.). Cross section -values of (in %) variables POW+PYT (w. unc.) FxFx+PYT POW+HER 1 (1) 1 2 1 (1) 1 1 1 (6) 1 1 1 (1) 1 1 1 (37) 1 1 1 (1) 1 1 1 (2) 1 1 1 (1) 1 1 1 (1) 1 1 1 (1) 1 1
The -values are shown for the tests of the measured absolute multi-differential cross sections for \ttbarand top quark kinematic observables at the particle level with respect to the predictions of various MC generators. The values are calculated taking only measurement uncertainties into account and excluding theory uncertainties. For POW+PYT, the -values of the tests including theory uncertainties are indicated with the brackets (w. unc.). Cross section -values of (in %) variables POW+PYT (w. unc.) FxFx+PYT POW+HER 1 (3) 1 4 1 (1) 1 1 1 (17) 1 1 1 (1) 1 1 1 (27) 1 1 1 (1) 1 1 1 (3) 1 1 1 (5) 1 1 1 (1) 1 1 1 (1) 1 1
The -values are shown for the tests of the measured absolute single-differential cross sections for lepton and \PQb-jet kinematic observables at the particle level with respect to the predictions of various MC generators. The values are calculated taking only measurement uncertainties into account and excluding theory uncertainties. For POW+PYT, the -values of the tests including theory uncertainties are indicated with the brackets (w. unc.). Cross section -values of (in %) variables POW+PYT (w. unc.) FxFx+PYT POW+HER 1 (9) 1 6 trailing/ leading 9 (34) 1 70 / 1 (1) 1 2 leading 85 (91) 1 64 trailing 46 (64) 1 41 1 (1) 1 1 1 (2) 1 3 1 (2) 2 4 1 (48) 6 10 88 (97) 6 34 32 (77) 7 63 1 (22) 1 7 7 (80) 1 24 1 (12) 1 1
The -values are shown for the tests of the measured absolute differential cross sections as a function of the additional-jet multiplicity in the events, at the parton level of the top quark and antiquark, with respect to the predictions of various MC generators. The values are calculated taking only measurement uncertainties into account and excluding theory uncertainties. For POW+PYT, the -values of the tests including theory uncertainties are indicated with the brackets (w. unc.). Cross section -values of (in $) variables POW+PYT (w. unc.) FxFx+PYT POW+HER 30 (56) 1 1 1 (5) 1 1 1 (5) 1 1 1 (1) 1 1 1 (1) 1 1 1 (1) 1 1 32 (87) 1 1 1 (1) 1 1 1 (3) 1 1 1 (1) 1 1 1 (1) 1 1
The -values are shown for the tests of the measured absolute differential cross sections as a function of the additional-jet multiplicity in the events, at the particle level of the top quark and antiquark, with respect to the predictions of various MC generators. The values are calculated taking only measurement uncertainties into account and excluding theory uncertainties. For POW+PYT, the -values of the tests including theory uncertainties are indicated with the brackets (w. unc.). Cross section -values of (in %) variables POW+PYT (w. unc.) FxFx+PYT POW+HER 29 (66) 1 22 1 (5) 1 25 1 (9) 1 1 1 (1) 1 1 1 (1) 1 1 1 (1) 1 1 13 (91) 1 75 1 (1) 1 1 1 (1) 1 1 1 (1) 1 1 1 (1) 1 1
The -values are shown for the tests of the measured absolute single-differential cross sections for \ttbarand top quark kinematic observables at the parton level with respect to various fixed-order predictions. The values are calculated taking only measurement uncertainties into account and excluding theory uncertainties. The -values of the tests including theory uncertainties are indicated with the brackets (w. unc.). Cross section -values of (in %) variables POW+PYT (w. unc.) (w. unc.) Matrix (w. unc.) Stripper (w. unc.) MiNNLOPS (w. unc.) 1 (7) 1 (1) 84 (87) 4 (58) 55 (68) 1 (9) \NA 71 (74) 17 (20) 47 (60) 1 (1) 1 (20) 8 (9) 7 (8) 17 (20) 1 (1) \NA 13 (15) 1 (1) 2 (5) 1 (35) \NA 42 (90) 21 (85) 1 (4) 38 (67) \NA 86 (87) 65 (72) 72 (73) 55 (78) \NA 51 (72) 61 (76) 94 (97) 40 (81) \NA 1 (98) 1 (96) 25 (45) 2 (23) \NA 97 (97) 90 (91) 15 (28) 1 (1) \NA 60 (74) 38 (47) 9 (76) 2 (66) \NA 1 (40) 1 (37) 3 (76) 7 (23) \NA \NA 8 (11) 23 (27) 14 (47) \NA \NA 18 (26) 66 (71)
The -values are shown for the tests of the measured absolute single-differential cross sections for \ttbarand top quark kinematic observables at the particle level with respect to the \POWHEG+\PYTHIA8 (‘POW-PYT’) simulation and the Stripper NNLO calculation. The values are calculated taking only measurement uncertainties into account and excluding theory uncertainties. The -values of the tests including theory uncertainties are indicated with the brackets (w. unc.). Cross section -values of (in %) variables POW+PYT (w. unc.) Stripper (w. unc.) 1 (7) 88 (97) 1 (11) 82 (97) 1 (5) 33 (34) 1 (1) 43 (53) 1 (37) 1 (35) 35 (78) 6 (11) 46 (80) 80 (94) 40 (85) 1 (18) 3 (23) 87 (91) 1 (1) 11 (28) 1 (59) 1 (51) 7 (35) 34 (35) 22 (67) 37 (39)
The -values are shown for the tests of the measured absolute multi-differential cross sections for \ttbarand top quark kinematic observables at the parton level with respect to various fixed-order predictions. The values are calculated taking only measurement uncertainties into account and excluding theory uncertainties. The -values of the tests including theory uncertainties are indicated with the brackets (w. unc.). Cross section -values of (in %) variables POW+PYT (w. unc.) (w. unc.) Matrix (w. unc.) Stripper (w. unc.) MiNNLOPS (w. unc.) 1 (1) 1 (1) 8 (10) 6 (10) 19 (19) 1 (1) \NA 2 (6) 5 (13) 4 (46) 1 (6) \NA 1 (1) 1 (1) 1 (1) 1 (1) \NA 1 (1) 1 (1) 1 (1) 1 (37) \NA 1 (1) 1 (1) 1 (4) 1 (1) \NA 1 (1) 1 (1) 1 (1) 1 (2) \NA \NA 1 (1) 1 (1) 1 (1) \NA 1 (1) 1 (1) 1 (1) 1 (1) \NA 1 (1) 1 (1) 1 (7) 1 (1) \NA \NA 1 (1) 1 (1)
The -values are shown for the tests of the measured absolute multi-differential cross sections for \ttbarand top quark kinematic observables at the particle level with respect to the \POWHEG+\PYTHIA8 (‘POW-PYT’) simulation and the Stripper NNLO calculation. The values are calculated taking only measurement uncertainties into account and excluding theory uncertainties. The -values of the tests including theory uncertainties are indicated with the brackets (w. unc.). Cross section -values of (in %) variables POW+PYT (w. unc.) Stripper (w. unc.) 1 (3) 39 (45) 1 (1) 1 (4) 1 (17) 1 (1) 1 (1) 1 (1) 1 (27) 1 (1) 1 (1) 1 (1) 1 (3) 1 (1) 1 (5) 20 (23) 1 (1) 1 (2) 1 (1) 1 (1)
The -values are shown for the tests of the measured absolute single-differential
cross
sections for lepton and \PQb-jet kinematic observables at the particle level
with respect to the \POWHEG+\PYTHIA8 (‘POW-PYT’) simulation and the Stripper NNLO calculation.
The values are calculated taking only measurement uncertainties into account and
excluding theory uncertainties. The -values of the tests including theory uncertainties are indicat
ed with the brackets (w. unc.).
Cross section
-values of (in %)
variables
POW+PYT (w. unc.)
Stripper (w. unc.)
1 (9)
14 (14)
trailing/ leading
9 (34)
86 (87)
/
1 (1)
14 (32)
leading
85 (91)
61 (65)
trailing
46 (64)
78 (98)
1 (1)
7 (9)
1 (2)
36 (40)
1 (2)
1 (1)
1 (48)
66 (75)
88 (97)
78 (96)
32 (77)
1 (4)
1 (22)
1 (1)
7 (80)
1 (12)
1 (12)
1 (1)