High Resolution Imaging Spectroscopy of a Sigmoidal Mini-filament Eruption
Abstract
Minifilament (MF) eruption producing small jets and micro-flares is regarded as an important source for coronal heating and the solar wind transients through studies mostly based on coronal observations in the extreme ultraviolet (EUV) and X-ray wavelengths. In this study, we focus on the chromospheric plasma diagnostics of a tiny minifilament in quiet Sun located at (71”, 450”) on 2021–08–09 at 19:11 UT observed as part of the ninth encounter of the PSP campaign. Main data obtained are the high cadence, high resolution spectroscopy from the Fast Imaging Solar Spectrograph (FISS) and high-resolution magnetograms from the Near InfraRed Imaging Spectropolarimeter (NIRIS) on the 1.6 m Goode Solar Telescope (GST) at Big Bear Solar Observatory (BBSO). The mini-filament with size 1”5” and a micro-flare are detected in both the H line center and SDO/AIA 193, 304 Å images. On the NIRIS magnetogram, we found that the cancellation of a magnetic bipole in the footpoints of the minifilament triggered its eruption in a sigmoidal shape. By inversion of the H and Ca ii spectra under the embedded cloud model, we found a temperature increase of 3,800 K in the brightening region, associated with rising speed average of MF increased by 18 . This cool plasma is also found in the EUV images. We estimate the kinetic energy change of the rising filament as 1.50 ergs, and thermal energy accumulation in the MF, 1.44 ergs. From the photospheric magnetograms, we find the magnetic energy change is 1.57 ergs across the PIL of converging opposite magnetic elements, which amounts to the energy release in the chromosphere in this smallest two-ribbon flare ever observed.
Solar filament eruptions(1981) – Solar magnetic reconnection(1504)
1 Introduction
Solar filaments are typically dense, cool plasma formulated in chromosphere along the polarity inversion line (PIL) during flux emergence (e.g., Bruzek, 1967; Foukal, 1971; Zwaan, 1985; Shibata et al., 1989; Toriumi et al., 2017). The arch filament enveloped in the emerging magnetic bipole expands as it rises from the solar surface. The filament erupts as its configuration with surrounding fields is destabilized by reconnection in different scenarios, such as breakout, kink instability, and tether-cutting (Bi et al., 2015; Kumar et al., 2019; Kim & Yurchyshyn, 2022). Solar filament eruptions are often associated with a wide range of dynamic solar activities from as large as coronal mass ejections (CMEs) to small-scale spicule activities by which free energy is transported to the corona from the chromosphere. In active regions, the sigmoid configurations, which are defined as S-shaped loop arcades of non-potential magnetic field, have typical length of 100. Non-potentiality of the kinked magnetic field flux ropes tend to drive eruption in the PIL (polarity inversion lines) of the sigmoidal regions by tether-cutting reconnection and form arcade loops (Liu et al., 2010, 2012). Strong non-potential bipolar magnetic configuration is also identified in X-ray and EUV micro-sigmoids (Mandrini et al., 2005; Raouafi et al., 2010; Zheng et al., 2013).
Mini-filaments are scale-down version of solar filaments, which extend less than 25 Mm and last for about 50 min in H images (Wang et al., 2000a). Similar to large-scale filaments, loop-like topology of mini-filaments usually lie above the photospheric polarity inversion line (PIL) of small-scale adjacent opposite-polarity magnetic fields, which are distinguished from “surge-like macrospicules” that emanating from network field concentrations on the same size scale. The earliest systematic studies of small-scale filaments utilizing H observations from Big Bear Solar Observatory (BBSO) by Hermans & Martin (1986a) discovered elongated dark features and characterized that: 1) With occurrence rate of 600 per 24 hour day, the average duration of eruptive phase was 26 minutes in total lifetime of 70 minutes; 2) Majority of events are spatially related to cancelling magnetic features; 3) Small-scale filament share similarities with large scale filaments that often has one or both ends terminate at cancellation site. The total mass and kinetic energy are estimated to be 1013 g and 1025 ergs, respectively.
The eruptions of mini-filaments are also found to often produce small scale coronal mass ejections, coronal jets, and microflares (Innes et al., 2009; Raouafi et al., 2016), which is thus of interest to the recent topic a small solar eruption that could contribute correspondingly small transients to the coronal heating and solar wind acceleration. Observations of the roots of coronal heating in chromosphere proved that it cannot be driven solely by energy deposition in the coronal heights; instead, mass and energy supply from lower atmosphere are required through ubiquitous upflows across the magnetic configuration in the heating process of corona (De Pontieu et al., 2009; Tian, 2017). The ejected cold material from filament eruptions in chromosphere called surges have been observed in H filtergrams (Harrison et al., 1988; Schmieder et al., 1995; Chen et al., 2022; Schmieder et al., 2022) with bright/flaring points separating from footpoints of the surge during onset of eruptions. The brightening primarily observed in soft X-ray (SXR) wavelengths is located where the H surges originate, in which magnetic reconnection between twisted cool loops and open field lines leads to the formation of surges that coincide with X-ray subflares (Shibata et al., 1992; Alexander & Fletcher, 1999). Coronal counterparts of the erupted filament, jets, are observed in extreme ultraviolet filtergrams (EUV, Wang et al., 1998; Li et al., 2023), as well as at SXR (Innes et al., 2016; Sterling et al., 2022). Observational facts of the scenario that magnetic reconnection bewteen confined flux loop and overlying field in different wavelengths suggest the formation of cool and hot ejecting components from minifilament eruptions (Shen et al., 2017). Coronal bright points (CBPs) of network field configuration of opposite polarities are found to be heated to their brightness temperature maxima with occurrence of minifilament eruptions (Hong et al., 2014).
A schematic model of MFs eruptions that has characteristics different from standard jet model (Shibata et al., 1992) was proposed by Moore et al. (2010), in which the sheared core field carrying cool plasma to begin erupting when X-ray brightening in the base arch is observed. Such dynamic small-scale filament eruptions are often observed to initiate blowout jet scenario through interchange reconnection at the boundary of open fields and closed flux loops (Shen, 2012; Adams et al., 2014; Li et al., 2015), and show obvious asymmetric brightening in the loop called jet bright points (JBPs) (Sterling et al., 2015). The external reconnection is driven by flux cancellation (Panesar et al., 2017; McGlasson et al., 2019; Sterling & Moore, 2020) at the polarity inversion line and opens filament field to allow plasma ejection through the undergoing internal reconnection (Shen, 2012; Adams et al., 2014; Panesar et al., 2016, 2018). Recently, by reviewing jet producing minifilament events and flux cancellation model, Sterling & Moore (2020) proposed a possible mechanism for magnetic switchbacks in the solar wind detected by Parker Solar Probe (PSP), in which the jetlets carry twist from flux cancellation in the interplanetary propagation. In-situ observations of solar wind show expansion of scale and duration small-scale magnetic flux ropes over propagation (Chen et al., 2020), which inversely, are used to investigate their possible solar sources (Bale et al., 2021; Lee et al., 2022). The occurrence rate of small-scale solar eruptions 0.02 per unit area per hour is arguably sufficient to heat corona and generate Alvénic pulses for switchbacks (Wang et al., 2022; Raouafi et al., 2023).
The questions raised to be addressed are: How do small-scale filaments evolve in the quiet Sun? What is the energy distribution in the chromosphere and corona in the event of MF eruption? How much free energy from underlying photospheric magnetic fields is released by the coronal heating and solar wind acceleration? With high-resolution H and Ca II spectra, this study focus on the above questions by investigating a newly observed two-ribbon microflare associated with partial minifilament eruption.
In this paper, we study spectroscopic and dynamic properties of a mini-filament observed with the H and Ca ii lines offered by FISS together with EUV wavelengths (AIA) images. Although significant progress has been made in erupting minifilaments in X-ray or EUV wavelengths, earlier identification of small scale eruption in H wavelength minifilaments (Wang et al., 2000b) suggests that fact that jets may have both hot and cool components. In this regard, spectral diagnostics available from the chromospheric lines will complement the existing results obtained from X-ray/EUV wavelengths. We focus on the spectral diagnostics of the the chromospheric temperature and density variation around the time of the minifilament eruption along with underlying magnetic field detected by the GST/NIRIS to provide insight into small-scale solar eruption along with jet-formation.
2 Observations and Data Analysis
2.1 Quiet Sun data
On 2021 August 7, BBSO/GST provided ground-based support to Parker Solar Probe (PSP) observations with multi-wavelength instruments. GST observations of quiet Sun filament evolution were conducted on the target that is located at (71, 450) before the ninth encounter of the PSP campaign passing through perihelion (2021–08–09 19:11 UT) on the far side. We utilized 304 Å and 1600 Å images taken by the Atmospheric Imaging Assembly (AIA; Lemen et al., 2012) on board Solar Dynamic Observatory (SDO) to observe the brightening associated with the MF eruprion in UV/EUV channels.
High-resolution observations were carried out by the 1.6 m Goode Solar Telescope (GST; Cao et al., 2010) in Big Bear Solar Observatory (BBSO), with the advantage of a high-order adaptive optics system combining 308 sub-apertures and reconstruction technique for solar speckle interferometric data (Wöger et al., 2008). Photospheric optical continuum images are obtained by Broadband Filter Imager (BFI) with a TiO filter (705.7 nm; 10 Å band-pass). Spectroscopic polarization measurement of the Fe I 1565 nm line (0.25 Å band-pass) is taken by NIRIS with a round FOV of 80 at 024 resolution and 42 s cadence.
H observation is achieved with Fast Imaging Solar Spectrograph (FISS), which is capable of recording dual-band Echelle spectrograph at H line and Ca ii 854.2 nm simultaneously. Only the H line data are used in the present work. Each H spectrogram (slit image) consists of 256 spectral profiles that represent the spatial variation along the slit with a sampling of 016, and each spectral profile, of 512 data points that cover 0.97 nm (9.7 Å) with a sampling of 1.9 pm (19 mÅ). The position of the slit on the image plane was successively shifted with a step size of 016, and one raster scan comprising 100 steps covered a 32 41 area inside the field of view. The raster scan was repeated every 22 s for half an hour.
2.2 Reduction and model fitting
To process the FISS spectrographs, an average of the observed background solar region is taken as a reference profile. All the profiles are normalized by the maximum intensity (a proxy of the continuum intensity) of the reference profile. The data profiles are then corrected to the reference profile by a multiplication factor that is close to unity so that contrast in far wings vanishes while maintaining contrast accuracy in the H line center. The stray light effect in the observation is removed by following the calibration process of Chae et al. (2013b). Thermodynamic properties (i.e., temperature and line-of-sight velocity) of the filaments are obtained from H spectrum inversion. In this study, we applied the embedded cloud model proposed by Chae (2014) to the calibrated data, which assumes low-lying cloud features (e.g., minifilaments, spicules) are partially embedded in the chromosphere that displays both emission and absorption, then use regression method to the free parameters to fit model with observation. According to Beckers’ cloud model, the absorption profile is uniform inside the feature and subject to Doppler broadening only, giving the optical depth
and radiative transfer function
where and represents observed and incident intensity of light; parameters , , , and are optical depth at peak absorption, source function, Doppler width and peak absorption wavelength at line-of sight (LOS) velocity . By assuming incident intensity (Iλ,in) to equals intensity of light (Rλ,in) at the same height in chromosphere, basic radiative transfer function is reduced to
in which the , , and are ensemble-average quantities of observed reference profile, intensity of light, and source function, respectively. is defined as
with three introduced parameters , , and . By resolving the previously defined parameters(also see, Beckers, 1968; Tziotziou, 2007; Bostanci & Al Erdoğan, 2010), we obtain temperature and LOS velocity from the equations
and
Combining spatial and wavelength information of H and Ca II spectra taken by FISS, we are able to derive thermal and dynamic properties of the chromospheric structures. Further, with multilayer spectral inverison (MLSI) method developed by Chen et al. (2020), which divides the relatively wide range of atmosphere into finite number of layers consisting of photosphere, lower and upper chromosphere, we estimate and compare kinetic properties in different height during the eruption of MF.
3 Results
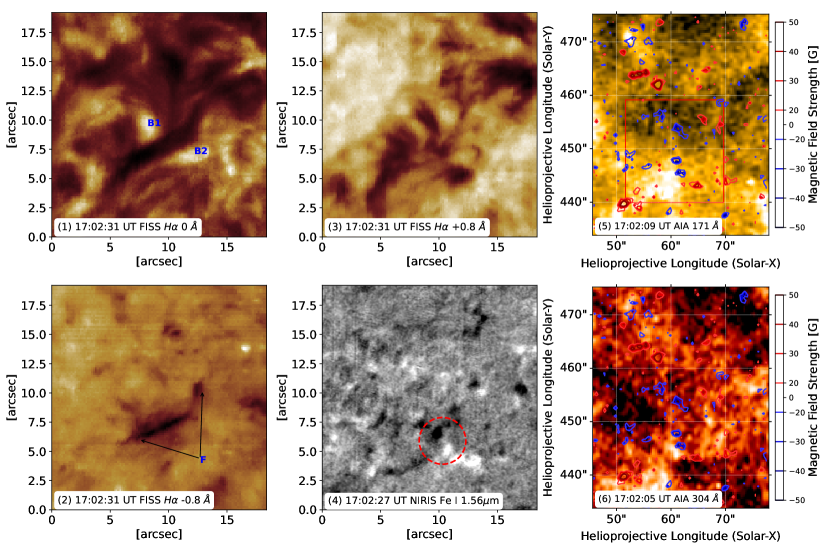
An event of minifilament eruption in multiple channels (FISS H lines, AIA 171Å, 304Å, and NIRIS magnetograms) is presented in Figure 1. The x-axis is along East-West direction in all panels. Figure 1(1)–(4) display the GST observations of the MF evolution from spicular bundles between opposite polarities of the same FOV, which is indicated by the red box in panel 5. The MF in sigmoid configuration is displayed in H filtergrams at central line and 0.8 Å off at blue wing (see panel 1–3). Two parts of the arcade loops coincides at [10, 7.5], with brightening structures B1 and B2 appearing across two sides of the central region of the sigmoid, and fan-spined dark features observed with H at Å wavelength. The magnetic bipole at the MF footpoints are circled in panel 4. Upper chromospheric and Coronal counterparts of the MF at higher temperature is observed in AIA 304 Å(50000 K) and 193 Å(1.25 MK) (see Figure 1(5) and (6)), respectively. Manifestation of a miniature version of two-ribbon flare is observed in a supplementary H and AIA (193 Å and 304 Å)movie. Contours of longitudinal magnetic field at 50 G are superimposed on AIA 304 Å and 193 Å, with positive (negative) field represented in red (blue). The polarity inversion line lies along the direction of MF, which is between opposite polarities of strong magnetic elements.
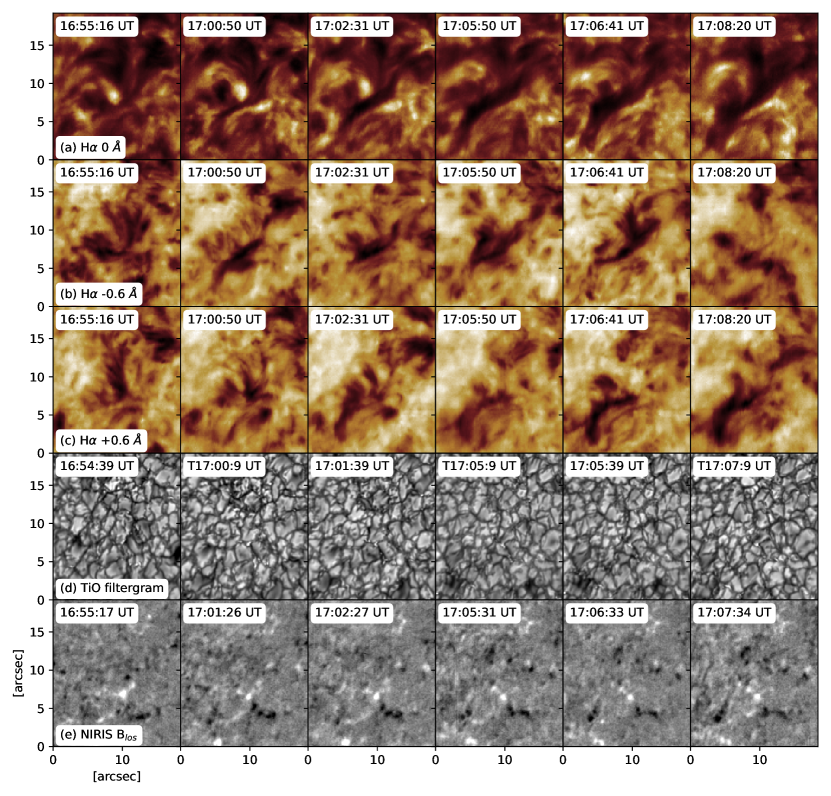
Detailed eruption process of the MF is shown in Figure 2. Footpoints of the emerging MF was preoccupied by spicule bundles surrounding the bright point as seen in H line-center wavelength at 16:55:16 UT. The MF emerged from the bright points with one footpoint anchored in place, of which the rising flux formed two conjugated arcade loop that extend in opposite directions at 17:00:50 UT. The MF upflow is shown in the H0.8 Å at the same time as appearance of MF sigmoid structure. The eruptive activity of the rising sigmoid is observed at 17:05:50 UT with bright points seperating from the footpoints, followed by prominent downflow three minutes later as seen in H0.8 Å, as the rising MF vanishes.
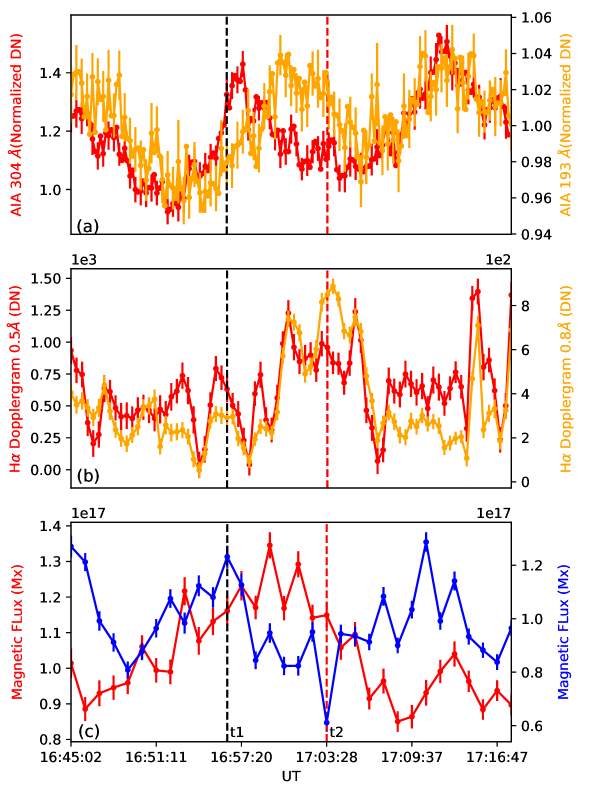
Figure 3 show time variation of the MF intensity in EUV wavelengths by AIA 193 and 304 Å channels(Fig.3(a)). After subtracting background oscillation, we found the activation and rising of MF () is followed by EUV dimming in 304 Å, and intensity starts to increase when start of the MF eruption () is observed in H images (Fig.2(a-c)). And AIA 193 Å profile shows similar trend, while the intensity reaches maximum 2 minutes later than in 304 Å before dimming between and . The H profiles (Fig.2(b) in both 0.5 and 0.8 Å show increase of Doppler blue-shift indicated by absorption contrast starting from and decrease to background level 3 minutes after . Fig.2(c) show that positive magnetic flux decreased by 6.2 Mx through MF eruption while the negative magnetic flux decreased by 3.0 Mx from to 3 minutes after .
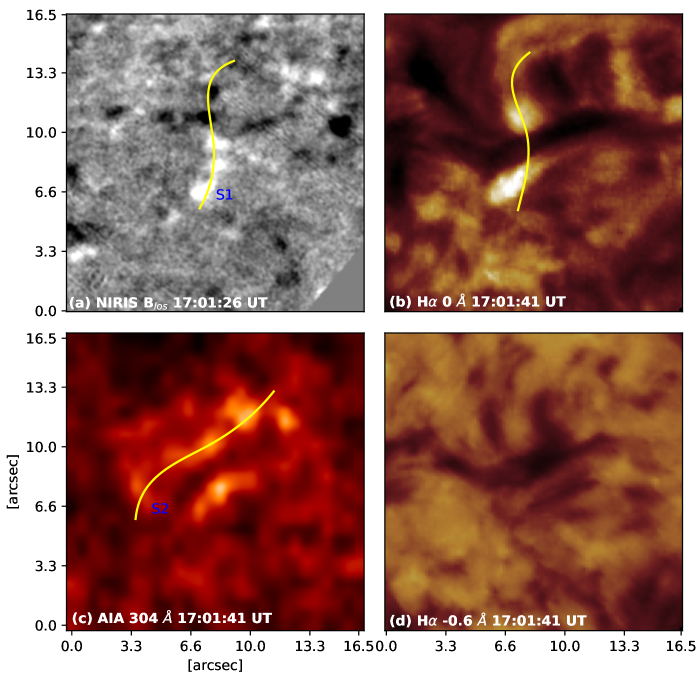
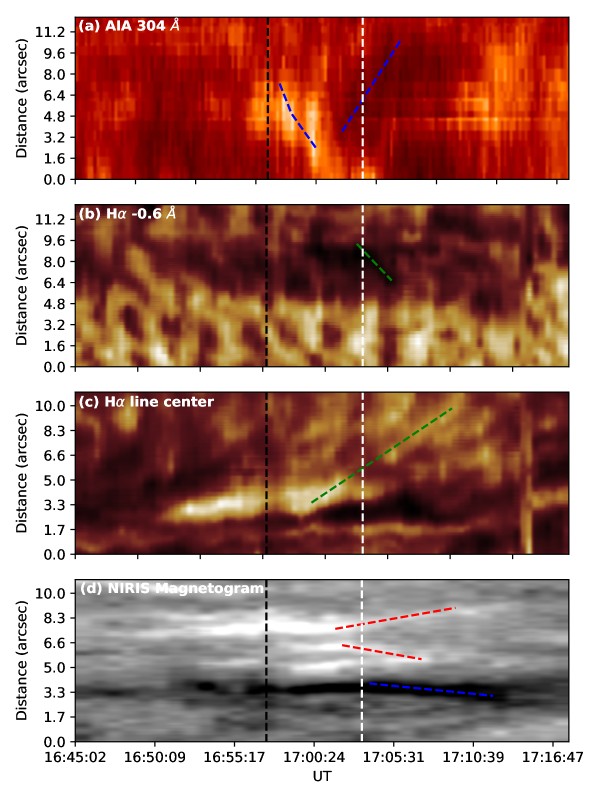
Two slits S1 and S2 are created along the magnetic bipole direction and along the MF sigmoid trace, respectively (see Figure 4(a) and (c)). Figure 5 show time-distance diagrams of the MF along S1 (Fig.5 (a) and (b)) and S2(Fig.5 (c) and (d)). In Fig.5 (a), we found the motion of the bright point and the following dark feature along the MF sigmoid. The apparent speed of bright point is 38–54 , and the speed of dark feature seen in Fig.5 (a) and (b) is 21.51.0 . Fig.5(c) shows the ribbon propagation from footpoint of the MF sigmoid at a speed of 110.8 . Transverse motions of the magnetic bipole footpoints in Fig.5(d) show speed of 1.90.5 .
In the magnetic field evolution the negative polarity is stationary in position while the positive polarities emerge and migrate towards negative polarity in the rising phase of MF. Field strengths in both positive and negative polarities decrease by 30 (24) in MF eruption (see Figure 3(c)). With accurate co-alignment in H images and AIA images (193 Å, 304 Å), we distinguished this MF eruption with FISS spectra and the exact location of its coronal counterparts in AIA EUV images. This enables us to study thermodynamic properties of the MF eruption from characteristics of the spectra and their connection with coronal dynamics. We focus our spectral analysis of Hin the following subsection, on the transient part of the MF which survived 10 minutes in H images.
3.1 Spectrosopic Analysis of the Minifilament
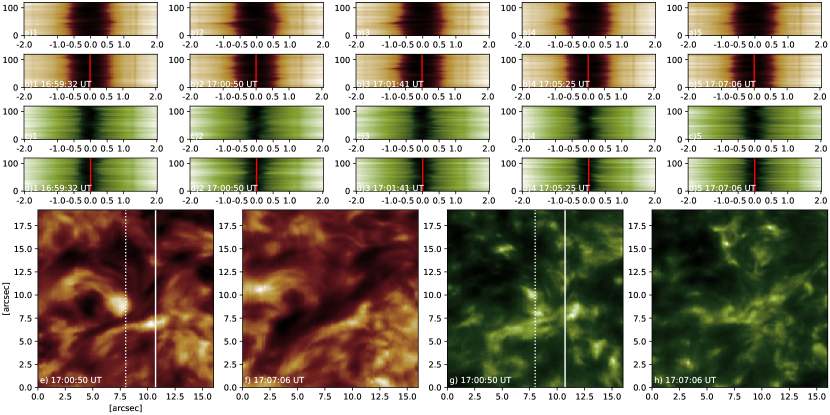
We show the spectroscopic data obtained with 22 s cadence between 16:59:33 UT and 17:07:06 UT in Figure 6. The raster images of H and Ca II 8542 Å are taken at line center(see Figure 6(e-h)), respectively. The H images display an -shape MF structure near the center of the FOV, with two J-shaped arms reaching 5″ from the junction ([80, 75]). We select a slit position across the prominent rising arm of MF structure as well as bright point in vicinity. In the H spectral profiles, strong blue-shifted absorption is detected from 17:00:50–17:02:30 UT. The Ca II 8542 Å spectral profiles show narrowed absorption in the line center, with corresponding brightening fibrils ([80, 70]) in raster images (Figure 6(g)). Slit 2 is selected across the bright ribbon along the rising segment of the MF and cut through the J-shaped arm at [105, 100]. At 17:07:06 UT, The MF feature in low opacity broaden in northwest direction, with Ca II 8542 Å bright fibrils ceding underneath the MF loop.
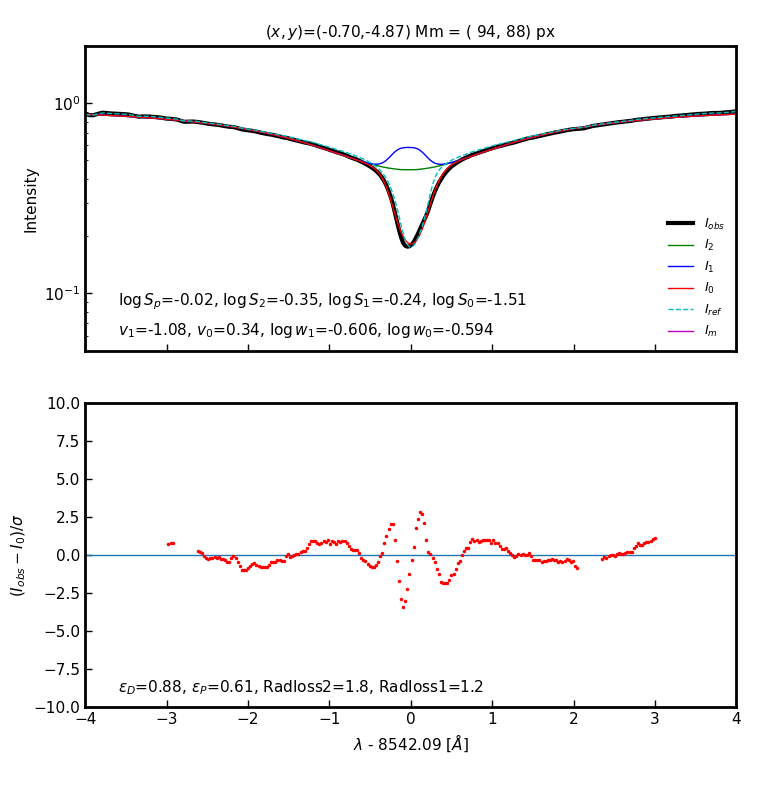
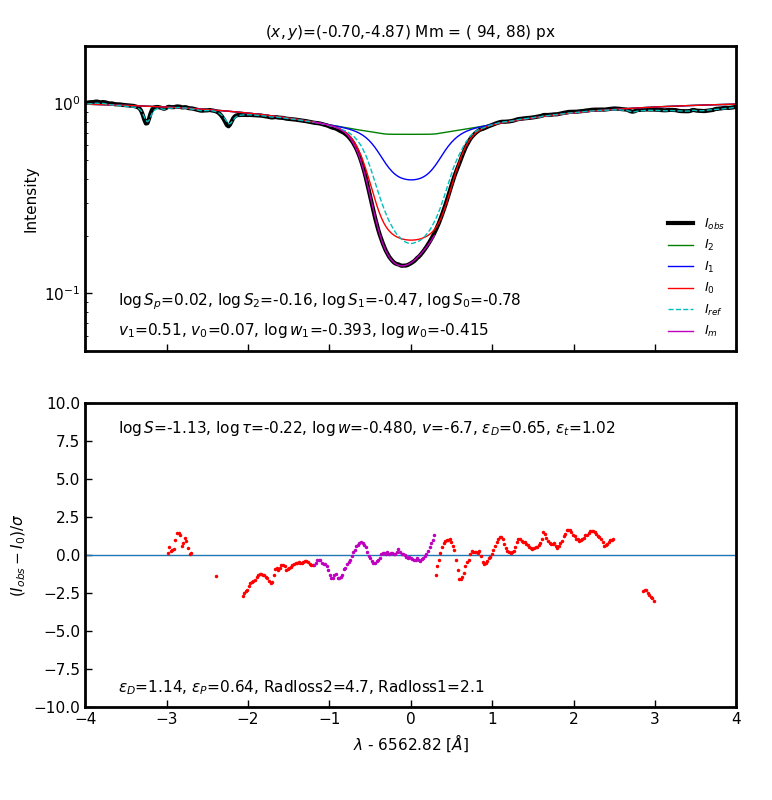
We applied the most update MLSI code to H and Ca II 8542 Å spectra at different points (B,F, and R) in the slit postions displayed in Figure 6. Given the source function and opacity are variable along chromosheric height, MLSI generate a composite of spectral parameters to represent different layers. In Figure 7 and figure 8, for the spectra inside the MF, the H profile fitting is based on the 4-layer model fit of the profile. Spectral wavelengths in the cloud feature range [-1.2 Å 0.30 Å] has been fitted by the 4-layer model, while is fitted by 3-layer model outside the wavelengths of the cloud regime, in which, the top layer is like a cloud. The MF is characterized by source function of 0.08, optical depth of 0.6, Doppler width of 0.33 Å, and Doppler velocity of 6.7 . The temperature of the MF is around 1 K. The Doppler width of the H in combination with the Ca II 8542 Å Doppler width of 0.25 Å yields the temperature estimate of 9,400 K at the beginning of the MF rising phase. The above values may vary depending on the choice of the cloud wavelength range, but not much under the requirement of good fitting. With above selection of fitting parameters, we have verified that at onset of the filament rising phase, the MF can be treated as non-emitting cloud. Therefore, in the following results of spectral inversion, we focus on the central regime of the spectral wavelengths using parameters of the cloud features.
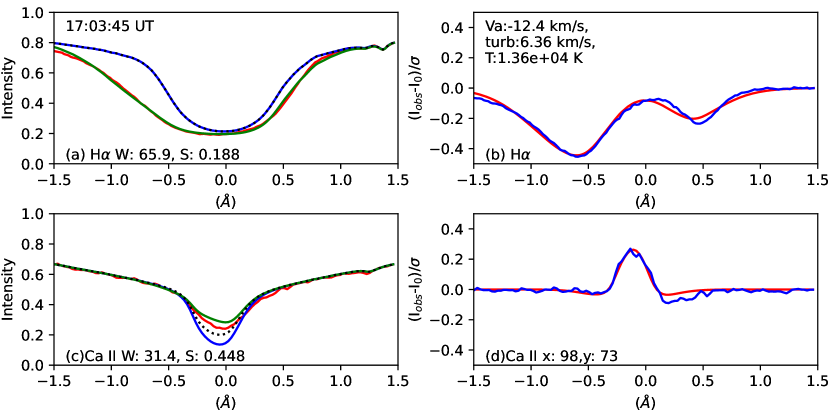
Figure 9 show inversion of H and Ca II spectral profiles using embedded cloud model (ECM) at start time (17:00:50 UT) of the MF eruption. The strongest upflow motion indicated by the blue shift of H is observed at this moment. The Doppler velocity is estimated reaching 18 by using lambdameter method (Chae et al., 2013a) on H profile. In Ca II 8542 Å profile, we find the enhanced intensity with redshift, indicating bright fibrils associated with the MF rising. We interpret such relation as photospheric magnetic field cancellation driving embedded filament upward motion.
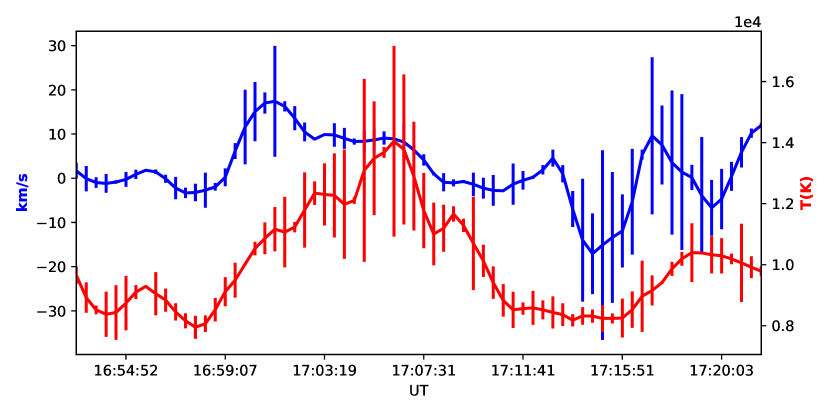

Temperature variation and Doppler velocity change of the MF before and after eruption is shown in figure 10 and figure 11 from 16:56:58 UT to 17:12:56 UT. As shown in the velocity profile, the MF has prominent upflow from the rising phase (17:00:50 UT) to eruption (17:07:06 UT). Peak value 28 of Doppler velocity is reached when the dark feature become visible in H blue-wing images (see Figure 2 (b2)). Temperature of cloud feature show continuous increase in 403 s from MF rise to eruption, followed by an abrupt decrease in the next 160 s. Temperature reaches maximum at 17:06:15 UT when the eruption occurs and filament structure eject laterally (see Figure 2 (b4) and (b5)). The acceleration in upflow velocity and the photospheric flux cancellation show close association, during which the magnetic flux reaches minimum at the same as the upflow speed reaches maximum. However, time discrepancy is found between temperature rise of the MF feature and flux cancellation but is co-temporal with the following magnetic flux increase. We interpret this relation as continuous emergence of flux bring the MF to upper chromospheric heights through reconnection driven acceleration.
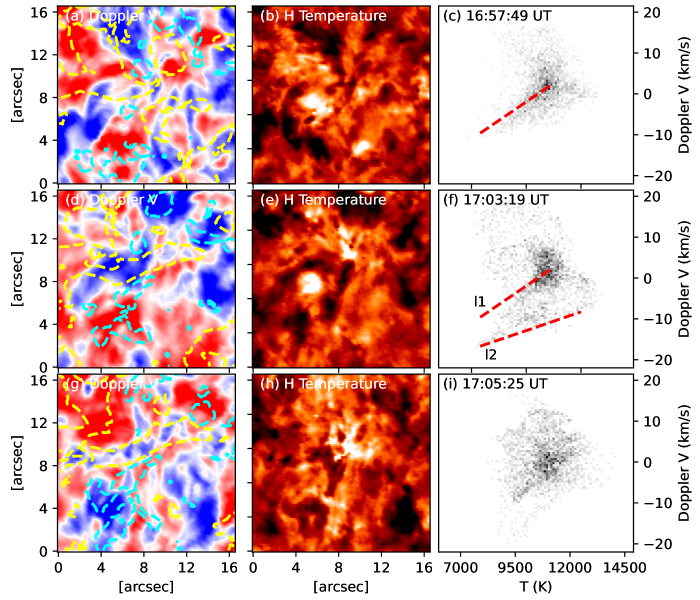
At [8”,8”] of the Dopplergrams((a),(d), and (g)) and Temperature maps ((b), (e), and (h)) in figure 12, prominent upflow is shown along the MF sigmoid associated with temperature burst near the central region. The scatterplots at activation time 16:57:49 UT in Fig.12(c) show temperature in the MF region is 9,700 K with cool materials of 7,500 K rising at Doppler speed of 10 . Then with enhanced blue shift observed at start of eruption in the Dopplergram (Fig.12(d)), a segment of high speed area (l2) that over 10 appear in the scattered distribution, while the temperature does not show promiment change. At post-eruption time 17:05:25 UT, the scatterplot (Fig.12(i)) shows 2D Gaussian like distribution centered at 9,800 K. We observed that with upflow speed over 10 , temperature is 9,500 K, which is 2,000 K higher than start of the MF eruption.
3.2 EUV brightenings associated with the MF eruption
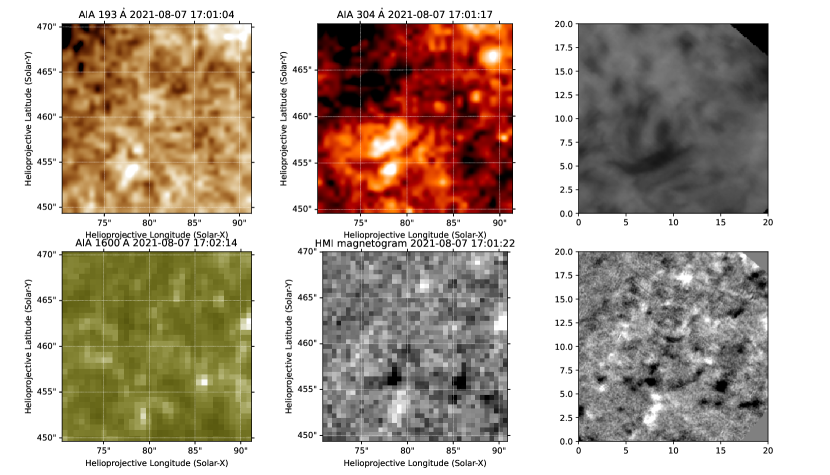
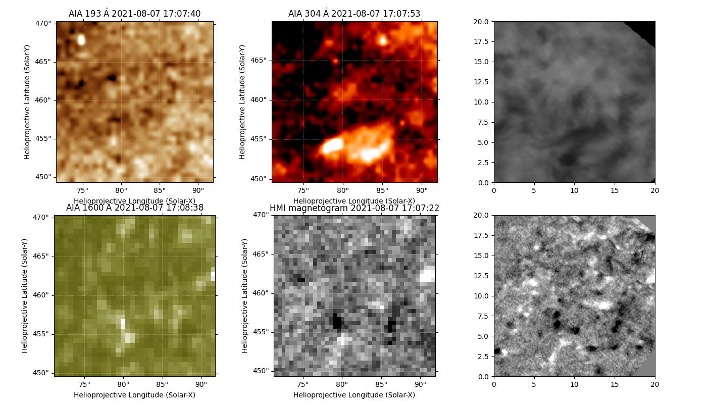
Figure 13 and Figure 14 show EUV brightenings in AIA 193 Å (Figure 13 (a)) with corresponding MF at 17:01:04 UT (Figure 13 (b) and two-ribbon flare at 17:07:53 UT (Figure 14 (b)). The EUV brightenings occur as the dark filament feature appear from bright background in AIA 304 Å, and vanishes when two-ribbon flaring configuration is observed in chromosphere. Chen et al. (2020) found that at onset of the MF, it has no corresponding brightening signals and experiences slow-to-fast acceleration. while in this event, not only the acceleration is associated with appearance of rising filament, brightening is also observed at coronal heights before flare ribbon appearance. This indicates reconnection of a blowout jet model, in which the interchange reconnection with external field and reconnection of internal flux loop occurred the same time.
To estimate the energy distribution of the MF event, we applied the cloud model assumption proposed by Tsiropoula & Schmieder (1997) to determine plasma density in the chromospheric cloud features. This allows us to calculate kinetic and thermal energy release of the MF eruption from fitted thermodynamic properties obtained in Section 3.1. Combining AIA 304 Å and H line-center images, we find the eruptive filament of 12 ″length and maximum width of 25. Adopting the mass density estimation of 1.1 , the kinetic energy change of the rising filament is 1.50 ergs, and thermal energy accumulation in the MF is 1.44 ergs. From the photospheric magnetograms, we find the magnetic energy change is 1.57 ergs across the PIL of converging opposite magnetic elements. Our previous study of quiet Sun small-scale eruptions suggest that magnetic flux cancellation in granule scale provides sufficient free energy to heat the corona (Wang et al., 2022).
4 Summary and Discussions
In this paper, we investigate the chromospheric thermodynamics of minifilament eruption associated with brightening and corresponding photospheric magnetic cancellation with high-cadence spectral data of H line from FISS, and high-resolution magnetograms from NIRIS of GST. With updated MLSI of H data, temperature evolution and energy transportation of chromespheric features are quantitatively evaluated at a small-scale brightening region. The coronal bright points are observed in AIA EUV (193, 304 Å) channel imaging data as micro-flare in the quiet Sun, which is associated with partial minifilament eruption. Key structural and dynamic properties of the eruption minifilament are summarized as follows.
-
1.
With high-resolution spectroscopy, we analyzed the dynamic process of this very small scale sigmoidal mini-filament. Such micro-flare related minifilament eruption is not associated with jet/jetlet in vicinity, while coronal brightening is observed along the trajectory direction of the eruption. This resemblances two-ribbon flare with filament eruption in the large scale.
-
2.
Temperature rise in the flaring regions is co-temporal with magnetic flux emergence while the brightening emission in corona is associated with photospheric flux cancellation. Time evolution of the temperature in the filament sigmoid show maximum value when lateral displacement is observed in the flux loop. Temperature estimation shows increase from 8,800 K to 12,600 K, an increase of almost 4,000 K during the eruptive phase, while the maximum Doppler velocity (18 ) of the filament is observed at beginning of the eruption.
-
3.
Thermal and kinetic energy releases are both in the order of ergs, consist of 18.7% of total magnetic energy change in the photosphere from emergence phase to flux cancellation. The released energy is considered as minimum of minifilament eruption release, which is comparable to enhanced spicular events.
Minifilament eruptions are known as downscale filament activities in the quiet Sun. Systematic survey of 32 days of BBSO H data for small-scale eruptive filamentary events suggest such ubiquitous presence as many as 600 per 24 hour day (Hermans & Martin, 1986b). Aside from topological similarities between minifilament events and large scale filaments that often has one or both ends anchor at cancellation site, small-scale filament also undergo emergence phase (slow rising phase) and eruption phase, which are often associated with microflares. We report observations of microflare ribbons in H that are often unresolved due to resolution limit of instrument. The microflare is visible in AIA 304 Å as well, with j-shaped dark feature overlying along the PIL of the magnetic bipole in the photosphere. In the eruptive phase, the sigmoid feature experienced heating processing and lateral displacement. Such chromospheric heating can be interpreted as results of microflare triggered particle beams (Frogner, L. et al., 2020).
Typically, both cool and hot plasma are both ejected from eruptions. In this event, we have not observed cool plasma ejection into the corona that are often associated with (mini)filament eruption and (micro)flare. Sterling et al. (2022) proposed a small-scale analog of coronal jet, in which the cool materials of erupting minifilamet fill in the open field jet spire. However, not all coronal jets are associated with presence of erupting cool minifilament. Kumar et al. (2019) found 33% of the coronal jets in their study have no evidence of cool plasma at base of the spire. One argument of the missing coronal jet is that such small-scale eruptive activity have weak signal in EUV, especially cool spire can be smeared by background signals. The observed filament is of typical small-scale filament size, with coronal brightening counterparts of the magnetic cancellation site. Study of coronal jet eruptions by Panesar et al. (2020) conclude that magnetic cancellation triggers the eruption before runaway breakout/tether-cutting reconnection when speed of the rising minifilament is above 1 . Our results show that the minifilament experience explosive motion in vertical direction with speed over 10 following magnetic flux cancellation in photosphere, which suggest the runaway reconnection at the internal current sheet drove minifilament eruption. However, transition from slow rise to fast rise (eruption) is not observed. Doppler velocity decreases when lateral expansion of the minifilament is observed in H images. Coincident of magnetic flux cancellation and acceleration of minifilament eruption in this study agree with previous studies of large filament eruptions that tether-cutting reconnection accelerate eruptions (Moore & Sterling, 2006).
With high cadence H spectral data observed by FISS, we found that the minifilament in the chromosphere has close connection with CBP phenomena. In the event of mini-filament eruption, jet is not associated with the chromospheric eruptive motions as identified in previous observations. Instead, the loop shape brightening in corona become visible following the minifilamentary eruption. Analysis of magnetic properties from NIRIS data indicates that the cancellation of a magnetic bipole in the footpoints of minifilament triggered the mini-eruption. Line-of-sight velocity and temperature from an inversion of H spectra with embedded cloud model exhibit a temperature increase of 13,300 K in the brightening region, associated with average minifilament rising speed increased by 21 in 10 minutes. Such a study of high-resolution observations provides further details of connections between photospheric magnetic topology and its chromospheric counterpart, with which we conclude that energy released through mini-eruptions could be a source of coronal heating.
References
- Adams et al. (2014) Adams, M., Sterling, A. C., Moore, R. L., & Gary, G. A. 2014, ApJ, 783, 11, doi: 10.1088/0004-637X/783/1/11
- Alexander & Fletcher (1999) Alexander, D., & Fletcher, L. 1999, Sol. Phys., 190, 167, doi: 10.1023/A:1005213826793
- Bale et al. (2021) Bale, S. D., Horbury, T. S., Velli, M., et al. 2021, ApJ, 923, 174, doi: 10.3847/1538-4357/ac2d8c
- Beckers (1968) Beckers, J. M. 1968, Sol. Phys., 3, 367, doi: 10.1007/BF00171614
- Bi et al. (2015) Bi, Y., Jiang, Y., Yang, J., et al. 2015, ApJ, 805, 48, doi: 10.1088/0004-637X/805/1/48
- Bostanci & Al Erdoğan (2010) Bostanci, Z. F., & Al Erdoğan, N. 2010, Mem. Soc. Astron. Italiana, 81, 769. https://arxiv.org/abs/1001.3361
- Bruzek (1967) Bruzek, A. 1967, Sol. Phys., 2, 451, doi: 10.1007/BF00146493
- Cao et al. (2010) Cao, W., Gorceix, N., Coulter, R., et al. 2010, Astronomische Nachrichten, 331, 636, doi: 10.1002/asna.201011390
- Chae (2014) Chae, J. 2014, ApJ, 780, 109, doi: 10.1088/0004-637X/780/1/109
- Chae et al. (2013a) Chae, J., Park, H.-M., Ahn, K., et al. 2013a, Sol. Phys., 288, 89, doi: 10.1007/s11207-013-0313-9
- Chae et al. (2013b) —. 2013b, Sol. Phys., 288, 1, doi: 10.1007/s11207-012-0147-x
- Chen et al. (2020) Chen, H., Hong, J., Yang, B., Xu, Z., & Yang, J. 2020, ApJ, 902, 8, doi: 10.3847/1538-4357/abb1c1
- Chen et al. (2020) Chen, H., Hong, J., Yang, B., Xu, Z., & Yang, J. 2020, ApJ, 902, 8, doi: 10.3847/1538-4357/abb1c1
- Chen et al. (2022) Chen, J., Erdélyi, R., Liu, J., et al. 2022, Frontiers in Astronomy and Space Sciences, 8, 238, doi: 10.3389/fspas.2021.786856
- De Pontieu et al. (2009) De Pontieu, B., McIntosh, S. W., Hansteen, V. H., & Schrijver, C. J. 2009, ApJ, 701, L1, doi: 10.1088/0004-637X/701/1/L1
- Foukal (1971) Foukal, P. 1971, Sol. Phys., 19, 59, doi: 10.1007/BF00148824
- Frogner, L. et al. (2020) Frogner, L., Gudiksen, B. V., & Bakke, H. 2020, A&A, 643, A27, doi: 10.1051/0004-6361/202038529
- Harrison et al. (1988) Harrison, R. A., Rompolt, B., & Garczynska, I. 1988, Sol. Phys., 116, 61, doi: 10.1007/BF00171715
- Hermans & Martin (1986a) Hermans, L. M., & Martin, S. F. 1986a, in NASA Conference Publication, Vol. 2442, NASA Conference Publication, 369–375
- Hermans & Martin (1986b) Hermans, L. M., & Martin, S. F. 1986b, in NASA Conference Publication, Vol. 2442, NASA Conference Publication, 369–375
- Hong et al. (2014) Hong, J., Jiang, Y., Yang, J., et al. 2014, ApJ, 796, 73, doi: 10.1088/0004-637X/796/2/73
- Innes et al. (2016) Innes, D. E., Bučík, R., Guo, L. J., & Nitta, N. 2016, Astronomische Nachrichten, 337, 1024, doi: 10.1002/asna.201612428
- Innes et al. (2009) Innes, D. E., Genetelli, A., Attie, R., & Potts, H. E. 2009, A&A, 495, 319, doi: 10.1051/0004-6361:200811011
- Kim & Yurchyshyn (2022) Kim, S., & Yurchyshyn, V. 2022, ApJ, 932, L18, doi: 10.3847/2041-8213/ac7236
- Kumar et al. (2019) Kumar, P., Karpen, J. T., Antiochos, S. K., Wyper, P. F., & DeVore, C. R. 2019, ApJ, 885, L15, doi: 10.3847/2041-8213/ab45f9
- Kumar et al. (2019) Kumar, P., Karpen, J. T., Antiochos, S. K., Wyper, P. F., & DeVore, C. R. 2019, The Astrophysical Journal Letters, 885, L15, doi: 10.3847/2041-8213/ab45f9
- Lee et al. (2022) Lee, J., Yurchyshyn, V., Wang, H., et al. 2022, ApJ, 935, L27, doi: 10.3847/2041-8213/ac86bf
- Lemen et al. (2012) Lemen, J. R., Title, A. M., Akin, D. J., et al. 2012, Sol. Phys., 275, 17, doi: 10.1007/s11207-011-9776-8
- Li et al. (2015) Li, X., Yang, S., Chen, H., Li, T., & Zhang, J. 2015, ApJ, 814, L13, doi: 10.1088/2041-8205/814/1/L13
- Li et al. (2023) Li, Z. F., Cheng, X., Ding, M. D., et al. 2023, A&A, 673, A83, doi: 10.1051/0004-6361/202245814
- Liu et al. (2012) Liu, C., Deng, N., Liu, R., et al. 2012, ApJ, 745, L4, doi: 10.1088/2041-8205/745/1/L4
- Liu et al. (2010) Liu, R., Liu, C., Wang, S., Deng, N., & Wang, H. 2010, ApJ, 725, L84, doi: 10.1088/2041-8205/725/1/L84
- Mandrini et al. (2005) Mandrini, C. H., Pohjolainen, S., Dasso, S., et al. 2005, A&A, 434, 725, doi: 10.1051/0004-6361:20041079
- McGlasson et al. (2019) McGlasson, R. A., Panesar, N. K., Sterling, A. C., & Moore, R. L. 2019, ApJ, 882, 16, doi: 10.3847/1538-4357/ab2fe3
- Moore et al. (2010) Moore, R. L., Cirtain, J. W., Sterling, A. C., & Falconer, D. A. 2010, ApJ, 720, 757, doi: 10.1088/0004-637X/720/1/757
- Moore & Sterling (2006) Moore, R. L., & Sterling, A. C. 2006, Geophysical Monograph Series, 165, 43, doi: 10.1029/165GM07
- Panesar et al. (2020) Panesar, N. K., Moore, R. L., & Sterling, A. C. 2020, ApJ, 894, 104, doi: 10.3847/1538-4357/ab88ce
- Panesar et al. (2017) Panesar, N. K., Sterling, A. C., & Moore, R. L. 2017, The Astrophysical Journal, 844, 131, doi: 10.3847/1538-4357/aa7b77
- Panesar et al. (2018) —. 2018, ApJ, 853, 189, doi: 10.3847/1538-4357/aaa3e9
- Panesar et al. (2016) Panesar, N. K., Sterling, A. C., Moore, R. L., & Chakrapani, P. 2016, ApJ, 832, L7, doi: 10.3847/2041-8205/832/1/L7
- Raouafi et al. (2010) Raouafi, N. E., Georgoulis, M. K., Rust, D. M., & Bernasconi, P. N. 2010, ApJ, 718, 981, doi: 10.1088/0004-637X/718/2/981
- Raouafi et al. (2016) Raouafi, N. E., Patsourakos, S., Pariat, E., et al. 2016, Space Sci. Rev., 201, 1, doi: 10.1007/s11214-016-0260-5
- Raouafi et al. (2023) Raouafi, N. E., Stenborg, G., Seaton, D. B., et al. 2023, ApJ, 945, 28, doi: 10.3847/1538-4357/acaf6c
- Schmieder et al. (2022) Schmieder, B., Joshi, R., & Chandra, R. 2022, Advances in Space Research, 70, 1580, doi: 10.1016/j.asr.2021.12.013
- Schmieder et al. (1995) Schmieder, B., Shibata, K., van Driel-Gesztelyi, L., & Freeland, S. 1995, Sol. Phys., 156, 245, doi: 10.1007/BF00670226
- Shen (2012) Shen, Y. 2012, in 39th COSPAR Scientific Assembly, Vol. 39, 1774. https://ui.adsabs.harvard.edu/abs/2012cosp...39.1774S
- Shen et al. (2017) Shen, Y., Liu, Y. D., Su, J., Qu, Z., & Tian, Z. 2017, ApJ, 851, 67, doi: 10.3847/1538-4357/aa9a48
- Shibata et al. (1989) Shibata, K., Tajima, T., Steinolfson, R. S., & Matsumoto, R. 1989, ApJ, 345, 584, doi: 10.1086/167932
- Shibata et al. (1992) Shibata, K., Ishido, Y., Acton, L. W., et al. 1992, PASJ, 44, L173. https://ui.adsabs.harvard.edu/abs/1992PASJ...44L.173S
- Sterling & Moore (2020) Sterling, A. C., & Moore, R. L. 2020, ApJ, 896, L18, doi: 10.3847/2041-8213/ab96be
- Sterling et al. (2015) Sterling, A. C., Moore, R. L., Falconer, D. A., & Adams, M. 2015, Nature, 523, 437, doi: 10.1038/nature14556
- Sterling et al. (2022) Sterling, A. C., Moore, R. L., & Panesar, N. K. 2022, ApJ, 927, 127, doi: 10.3847/1538-4357/ac473f
- Tian (2017) Tian, H. 2017, Research in Astronomy and Astrophysics, 17, 110, doi: 10.1088/1674-4527/17/11/110
- Toriumi et al. (2017) Toriumi, S., Katsukawa, Y., & Cheung, M. C. M. 2017, ApJ, 836, 63, doi: 10.3847/1538-4357/836/1/63
- Tsiropoula & Schmieder (1997) Tsiropoula, G., & Schmieder, B. 1997, A&A, 324, 1183
- Tziotziou (2007) Tziotziou, K. 2007, in Astronomical Society of the Pacific Conference Series, Vol. 368, The Physics of Chromospheric Plasmas, ed. P. Heinzel, I. Dorotovič, & R. J. Rutten, 217. https://arxiv.org/abs/0704.1558
- Wang et al. (2022) Wang, J., Lee, J., Liu, C., Cao, W., & Wang, H. 2022, ApJ, 924, 137, doi: 10.3847/1538-4357/ac374e
- Wang et al. (2000a) Wang, J., Li, W., Denker, C., et al. 2000a, The Astrophysical Journal, 530, 1071, doi: 10.1086/308377
- Wang et al. (2000b) —. 2000b, ApJ, 530, 1071, doi: 10.1086/308377
- Wang et al. (1998) Wang, Y. M., Sheeley, N. R., J., Socker, D. G., et al. 1998, ApJ, 508, 899, doi: 10.1086/306450
- Wöger et al. (2008) Wöger, F., von der Lühe, O., & Reardon, K. 2008, A&A, 488, 375, doi: 10.1051/0004-6361:200809894
- Zheng et al. (2013) Zheng, R. S., Jiang, Y. C., Yang, J. Y., et al. 2013, MNRAS, 431, 1359, doi: 10.1093/mnras/stt258
- Zwaan (1985) Zwaan, C. 1985, Sol. Phys., 100, 397, doi: 10.1007/BF00158438