A multiwavelength light curve model of the classical nova V339 Del:
A mechanism for the coexistence of dust dip and supersoft X-rays
Abstract
The classical nova V339 Del 2013 is characterized by a 1.5 mag dip of the light curve owing to a dust shell formation, during which soft X-ray emissions coexist. We present Strömgren band light curve, which represents continuum emission, not influenced by strong [O III] emission lines. The light curve monotonically decreases in marked contrast to the light curve that shows a 1.5 mag dip. We propose a multiwavelength light curve model that reproduces the and light curves as well as the gamma-ray and X-ray light curves. In our model, a strong shock arises far outside the photosphere after optical maximum, because later ejected matter collides with earlier ejected gas. Our shocked shell model explains optical emission lines, H, hard X-ray, and gamma-ray fluxes. A dust shell forms behind the shock that suppresses [O III]. This low flux of [O III] shapes a 1.5 mag drop in the light curve. Then, the flux recovers by increasing contribution from [O III] lines, while the flux does not. However, the optical depth of the dust shell is too small to absorb the photospheric (X-ray) emission of the white dwarf. This is the reason that a dust shell and a soft X-ray radiation coexist. We determined the white dwarf mass to be and the distance modulus in the band to be ; the distance is kpc for the reddening of .
1 Introduction
A classical nova is an explosion of a hydrogen-rich envelope on a mass-accreting white dwarf (WD) in a binary. Hydrogen ignites to trigger an outburst when the mass of the envelope reaches a critical value (e.g., Kato et al., 2022a, for a recent fully self-consistent nova explosion model).
Hachisu & Kato (2022) theoretically found a strong shock formation far outside the photosphere in nova outbursts based on Kato et al. (2022a)’s nova explosion model. A strong shock inevitably arises after the optical maximum because the photospheric wind velocity increases after the optical maximum so that the wind ejected later catches up with the wind ejected earlier. Thus, a strong shock naturally arises far outside the photosphere after the optical maximum.
Nova ejecta with a shock show a rich variety of emission/absorption line systems. Expanding ejecta with different velocities makes multiple velocity emission/absorption line systems (McLaughlin, 1942). Also high energy emissions, such as hard X-rays and gamma-rays are expected from the shock (e.g., Friedjung, 1987; Mukai & Ishida, 2001; Martin et al., 2018). Hachisu & Kato (2023) explained how and where McLaughlin’s optical multiple emission/absorption line systems arise in classical novae.
In the present work, we elucidate the nature of the classical nova V339 Del based on our nova shock model (Hachisu & Kato, 2022, 2023). The outburst of V339 Del was optically discovered by K. Itagaki at 6.8 mag on UT 2013 August 14.584 (JD 2,456,519.084, Nakano & Samus, 2013). Immediately after the discovery, it was well observed in multiwavelength bands, especially in photometry, because of its brightness (a naked-eye nova; at peak). See Section 3 for an observational summary.
V339 Del is also characterized by (1) the third GeV gamma-ray detected nova in close binaries, after V1324 Sco 2012 and V959 Mon 2012 (Ackermann et al., 2014), (2) the first example of coexistence of dust and soft X-ray emissions in novae (Gehrz et al., 2015), (3) different behaviors in the and light curves: the magnitude was recovered after the dust blackout, while the magnitude continuously decreased (Munari et al., 2015). We clarify these properties based on our shocked shell model.
The different behaviors in the and light curves are the key in this study. We present detailed and band observation of V339 Del from 1 day to 858 days after the discovery that were obtained at Osaka Kyoiku University (OKU), which are shown in, e.g., Figure 1 for the and magnitudes. The magnitude is monotonically decreasing while the light curve has a dip around 65 days after the discovery. This property is first identified in the classical nova V339 Del and a very important clue to the mechanism for the coexistence of dust and soft X-ray emissions.
Formation of a dust shell is also closely related with a shock; a dust shell forms just behind the shock (Derdzinski et al., 2017). We also explain the temporal variations of the narrow band [O III] and H light curves as well as the broad band , , and (or ), and intermediate Strömgren band light curves of V339 Del.
Our paper is organized as follows. First we describe the and observation of V339 Del at Osaka Kyoiku University in Section 2. Overall observational properties are summarized in Section 3. Our shock model and expected emissions are presented in Section 4. Section 5 explains our model light curve and a strong shock formation that was derived from our nova model based on the optically-thick wind theory. Formation of a dust shell is discussed in connection to the depth of and dip after the dust blackout in Section 6. Conclusions follow in Section 7.
2 Observation at OKU
The CCD photometric observation of V339 Del at OKU was started on UT 2013 August 14.774, approximately 4.5 hours after the discovery, using a 0.51 m reflector telescope with optical bandpass filters of standard Johnson-Cousins , and Strömgren . The -band filter is free from influences of striking emission lines of novae such as Fe II, [O III], or [N II], so that the magnitude represents the continuum flux of the nova. The data reduction was made by the Image Reduction and Analysis Facility (IRAF)111https://iraf-community.github.io/ in a standard manner. The comparison stars for the photometry were chosen to be nearby field stars of AUIDs 000-BLC-955, 000-BLD-830, and 000-BLF-177 from the American Association of Variable Star Observers (AAVSO), depending on the apparent brightness of the nova during the observing period. Our data are shown in Figure 1 together with other observational data, the details of which will be explained in Section 3.
3 Summary of observation
3.1 Overall properties of the nova light curves
Munari et al. (2013d) presented light curves during the early 77 days, from UT 2013 August 15.115 JD 2,456,519.615 to JD 2,456,597.240. They obtained the decline rates of days, and days in the band, where and are the decline times by 2 and 3 mag from the peak, respectively.
Chochol et al. (2014) summarized the photometric and spectroscopic evolutions of V339 Del. They obtained the peak brightness of on UT 2013 August 16.47 (JD 2,456,520.97), days, and days for the band light curve. They suggested the orbital period of hr ( days) from small brightness variations, and the mean values of the reddening , peak magnitude , distance modulus in the band , and the distance kpc, from various empirical laws of classical novae. Recently, Schaefer (2022a) determined the orbital period of days (3.91 hr) from TESS data. Schaefer (2022b) proposed a rather small distance of pc based on the Gaia eDR3 parallax.
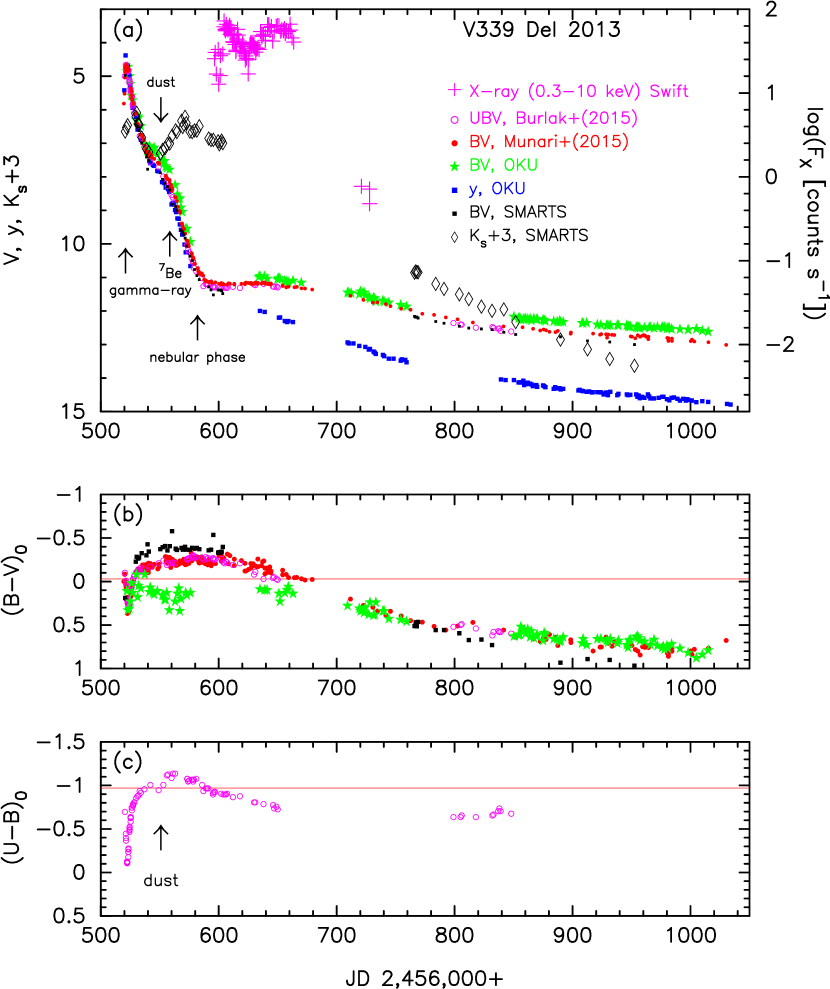
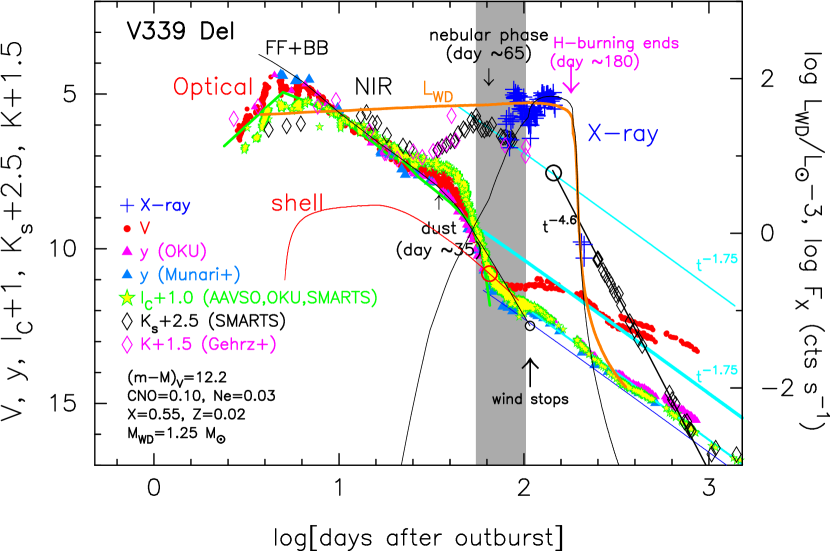
Figure 1 shows the (a) , , , and X-ray light curves, and color evolutions of (b) and (c) , on a linear timescale. The data are taken from Burlak et al. (2015, ), from Munari et al. (2015, ), from the Small and Medium Aperture Telescope System (SMARTS, Walter et al., 2012, ), and Osaka Kyoiku University (OKU, Hachisu et al., 2006, ). The band is an intermediate band, the center of which is similar to that of the band but designed to avoid strong emission lines such as [O III] lines. Therefore, it represents a flux of continuum (see, e.g., Figure 1 of Munari et al., 2013a). Here, and are the intrinsic colors of and , which are dereddened with the color excess of .
3.2 Very early phase
Early photometric and spectroscopic results are reported by many groups (e.g., Darnley et al., 2013; Shore et al., 2013; Tomov et al., 2013; Munari et al., 2013b; Hays et al., 2013; Shenavrin et al., 2013; Shore, 2013; Page et al., 2013; Munari et al., 2013c; Kawakita et al., 2019). Munari et al. (2015) reported their Strömgren , , and narrow-band H, [O III] photometric evolution of V339 Del covering 500 days after the optical maximum.
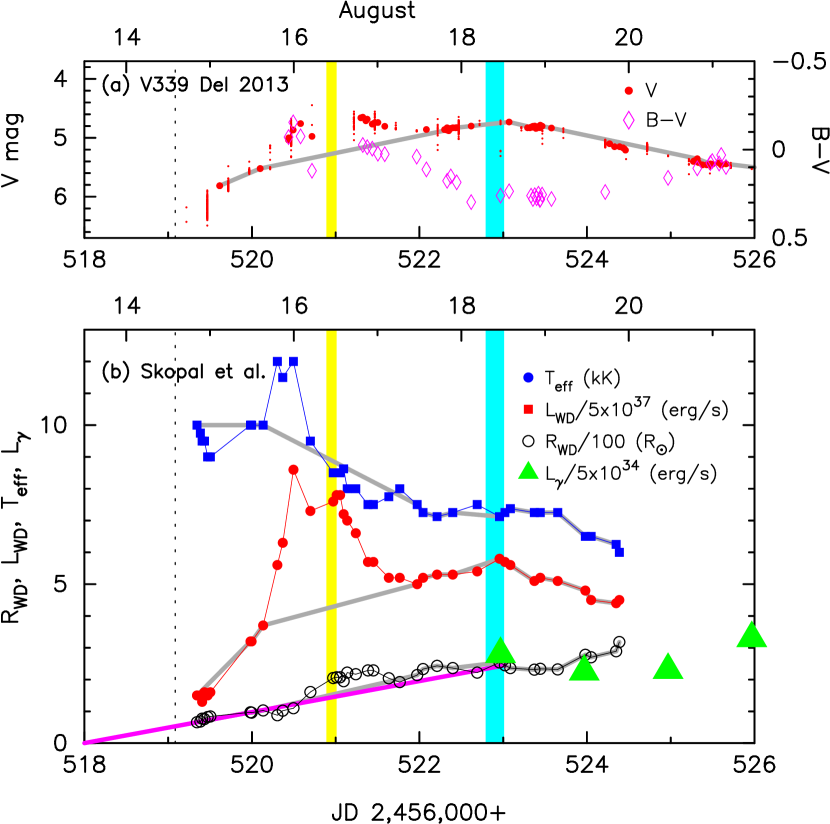
Figure 2 shows the (a) early light curve and color evolution of V339 Del and (b) temporal variations of the luminosity, radius, and effective temperature of the white dwarf (WD) pseudo-photosphere obtained by Skopal et al. (2014). Note that the luminosity and radius depend on the assumed distance to the nova (see figure captions). We also added the gamma-ray fluxes reported by Ackermann et al. (2014).
3.3 Expansion of the photosphere, optical peak, and outburst day
The light curve in Figure 2 shows the two maxima. The first peak is on UT 2013 August 16.47 JD 2,456,520.97 (Chochol et al., 2014), as indicated with the vertical broad yellow line. The data of the yellow line are taken from Skopal et al. (2014), i.e., UT 2013 August .
The second peak is on UT 2013 August 18.4 JD 2,456,522.9 (Skopal et al., 2014), as indicated with the vertical broad cyan line. The color evolution shows that this second maximum corresponds to a global maximum of color (see Figure 2a). Thus, we regard this second maximum to be a global maximum without the effect of local (short timescale) fluctuations like in the first peak.
We extrapolated the photospheric radii in Figure 2(b) to zero, i.e., JD 2,456,518.0 (UT 2013 August 13.5) as indicated by the straight magenta line. Schaefer et al. (2014) estimated the outburst day to be JD 2,456,518.077 (UT 2013 August 13.577) by extrapolating the two pre-discovery magnitudes to the quiescent brightness. Our estimated date is consistent with the Schaefer et al.’s date. In what follows, we define time as the days after outburst, i.e., time from .
The outburst day could be exactly identified if the X-ray flash was detected in V339 Del. The X-ray flash is a brief X-ray bright phase just after the onset of nova outburst, several days before optical brightening (Kato et al., 2022b, c). The classical nova YZ Ret is only the nova in which the X-ray flash is detected (König et al., 2022).
3.4 Distance
Shore et al. (2013) and Shore (2013) obtained the distance of kpc comparing the UV fluxes of V339 Del with those of OS And (Shore et al., 2016). This distance of kpc, however, is much larger than kpc of Gaia early data release 3 (Gaia eDR3) (Bailer-Jones et al., 2021). Shore et al. assumed and kpc for OS And. If we adopt kpc for OS And from the Gaia eDR3 distance (Bailer-Jones et al., 2021) and assume that the UV flux of V339 Del should be 1.25 times larger than that of OS And (e.g., Hachisu & Kato, 2016b) because the WD mass of V339 Del is about 1.25 times more massive than that of OS And, we obtained a much smaller distance of kpc to V339 Del.
Chochol et al. (2014) gave a distance of kpc from various empirical laws on the absolute magnitudes of classical novae. These empirical laws such as the maximum magnitude versus rate of decline (MMRD) relation, however, have a large scatter for an individual nova as shown later in Figure 3 (see also Schaefer, 2018, for discussion). Therefore, we do not expect a high accuracy for the distance.
Schaefer et al. (2014) obtained the distance to the nova to be kpc from the expansion parallax method based on their interferometric image data in the nova fireball stage, together with the expansion velocity of the ejecta, km s-1.
The expansion rate of the photosphere in V339 Del can be estimated from Figure 2(b), which shows the temporal variation of the pseudo-photosphere (Skopal et al., 2014). The mean expansion rate (magenta line) of the pseudo-photosphere is approximately cm s = 400 km s from UT August 14.84 to the second peak (UT August 18.4). If we use the distance of kpc (Bailer-Jones et al., 2021), this photosphere expansion rate is about 280 km s-1, which is much smaller than the wind velocity of km s-1 (Schaefer et al., 2014).
Thus, once winds begin to blow, the photosphere expansion rate cannot be determined from the spectra, because the winds leave the photosphere behind. This is a reason why Schaefer et al. failed to obtain the correct distance. If we adopt 280 km s-1, we obtain the distance of kpc. (This is a kind of tautology, however. Assuming kpc, we obtain kpc.)
Gehrz et al. (2015) also estimated the distance to the nova to be kpc from the expansion rate of the photosphere with their Equation (3) and the expansion velocity of the ejecta, 505 km s-1. If we instead adopt 280 km s-1, we similarly obtain the distance to the nova to be kpc.
These examples give us a warning that the expansion parallax method cannot be applied to a nova fireball stage, simply because the expansion rate of the pseudo-photosphere is different from the velocity of ejecta (see, e.g., Kato et al., 2022a, for nova winds).
3.5 E(B-V)
Rudy et al. (2013) reported on m spectroscopy of V339 Del. The object is an “Fe II”-type nova222Williams (1992) divided novae into two major classes depending on their early spectra. Either “Fe II lines” or “emission lines of He or N” is stronger. with numerous infrared Fe II features. In addition, there is strong emission from C I, N I, O I, and Ca II. The [O I] lines are present, including the line at 557.7 nm. Line widths for the stronger hydrogen lines are approximately 1300 km s-1 (FWHM). The interstellar reddening, as measured from the O I lines, is .
Nelson et al. (2013) obtained the interstellar absorption column density of cm-2 from the Chandra X-ray spectrum, 88.25 days after the outburst. This column density corresponds to the reddening of based on the relation given by Liszt (2014).
Tomov et al. (2013) estimated the reddening of from the equivalent width of interstellar Na I D1 line and the relation given by Munari & Zwitter (1997). Munari et al. (2013b) also estimated the reddening of from the equivalent width of interstellar Na I D1 line and the relation given by Munari & Zwitter (1997). Chochol et al. (2014) obtained a similar value of from the mean value calculated with various methods as mentioned in Section 3.1.
We plot the and colors dereddened with in Figure 1b and c. The colors diverge between JD 2,456,530 and JD 2,456,710 among the different telescopes. In general, this kind of divergence frequently occurs, when strong emission lines contribute to each band edge. If the filter response is slightly different in each telescope, strong emission lines such as [O III] on the blue edge of filter make a large difference in the flux. Such examples and discussion can be seen, e.g., in Munari et al. (2013a).
In the present paper, we adopt the extinction of after Tomov et al. (2013), Munari et al. (2013b), and Chochol et al. (2014), then determine the distance modulus in the band to be by using the time-stretching method (Hachisu & Kato, 2010, 2015, 2016a, 2018a; Hachisu et al., 2020), which will be described in Section 5.11, and obtain the distance to be kpc.
3.6 Gamma-ray emission
3.7 IR light curve and dust formation
Figure 1a depicts the light curve, which shows two maxima. We will discuss this behavior of the light curve in relation to our model later in Section 6.2.
Shenavrin et al. (2013) reported the formation of warm dust ( K) on UT 2013 September 21.8 (day 39.3) and September 27.8 (day 45.3). The increase of brightness in or bands occurred on UT 2013 September 17.0 (day 34.5) in the data of SMARTS and Burlak et al. (2015). Evans et al. (2017) obtained the formation date of dust to be 34.75 days after the eruption (their is UT 2013 August 13.9 JD 2,456,518.4).
The epoch of dust formation is indicated by the black downward arrow labeled dust in Figure 1a, days after the outburst.
3.8 Supersoft X-ray source phase
The bright supersoft X-ray source (SSS) phase started on UT 2013 October 24 (day 71.5; Osborne et al., 2013).
Note that this epoch corresponds broadly to the time that the nova V339 Del entered the nebular phase on UT 2013 October 18 (day 65.5) from the flux ratio of [O III]H (Munari et al., 2013c). Munari et al. (2015) pointed out that the [O III] 5007 Å emission line rapidly grows in intensity, because the spreading ionization is caused by the supersoft X-ray input.
Nelson et al. (2013) reported a Chandra X-ray spectrum of V339 Del during the SSS phase on UT 2013 November 9.75 (day 88.25). The spectrum shows many absorption lines superimposed on a supersoft continuum source. Their blackbody fit with the continuum indicates a temperature of k eV ( K) and interstellar absorption column density of cm-2.
Page et al. (2014) reported that the SSS phase has ended before UT 2014 March 4 (day 202.5). It is difficult to determine the exact turn-off date because there is a large gap between the last observation before the Swift Sun constraint (UT 2014 January 6= day 145.5) and UT 2014 March 4 (day 202.5).
Beardmore et al. (2013) reported a s quasi-periodic oscillation with Swift X-ray observation. Ness et al. (2013) also confirmed the 54 s oscillation with XMM-Newton.
Osborne et al. (2013) suggested that the start of the SSS phase coincides with the appearance of the plateau phase in the band. Such coincidence is observed in recurrent novae like U Sco, which has been theoretically explained as effects of a large irradiated accretion disk (e.g., Hachisu et al., 2000). In V339 Del, however, Osborn et al.’s explanation is unlikely because (1) the magnitude light curve does not show a flat plateau (Figure 1a) and (2) the short orbital period of hr ( days) (Schaefer, 2022a) hardly supports a bright (large) accretion disk like in U Sco whose orbital period is hr ( days) (Schaefer & Ringwald, 1995).
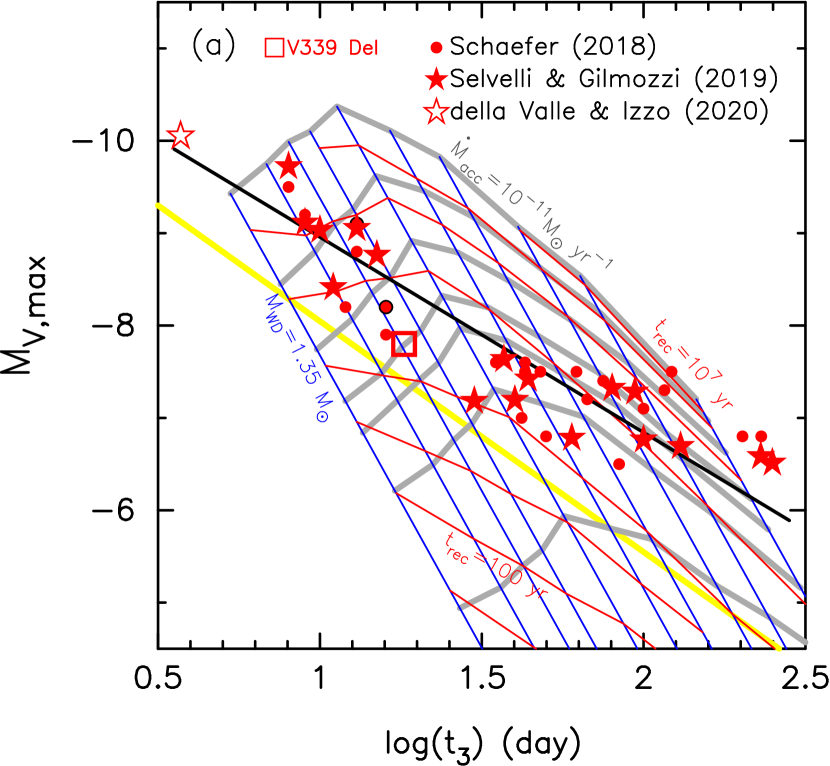
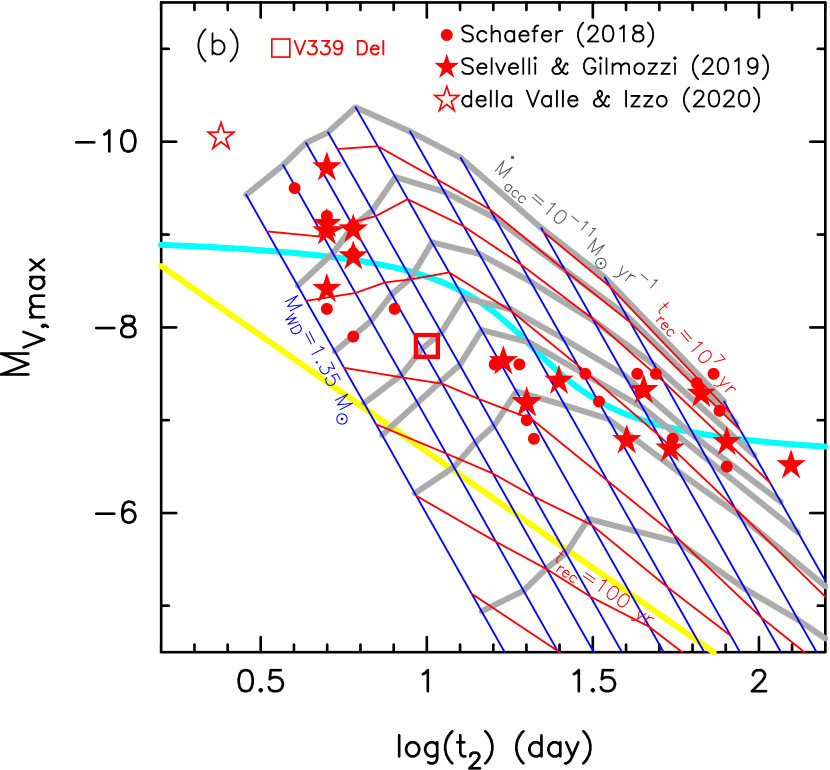
3.9 Nova speed class ( and ) versus peak brightness
Hachisu et al. (2020) calculated a number of nova model light curves and constructed theoretical diagrams for the relations among various nova parameters. Figure 3 shows such diagrams, the so-called maximum magnitude versus rate of decline (MMRD) diagrams for novae. If the position of a nova is given in these MMRD diagrams, we can know its WD mass, mass-accretion rate, and recurrence time. For V339 Del, the rates of decline, and days, were obtained by Chochol et al. (2014). The absolute maximum magnitude is calculated to be . We plot these two positions in Figure 3a and b, respectively. Both the positions are located on the blue line of , and on the gray line of yr-1. The recurrence time can be estimated to be yr from an interpolation between the two red lines of yr and yr. In this way, these theoretical diagrams are useful to easily estimate the nova parameters such as the WD mass , average mass-accretion rate to the WD , and recurrence time from the decline rates and peak brightness.
The above results are consistent with our WD model obtained in Section 5.
4 Shock formation
As described in the previous section, V339 Del was well observed in multiwavelength bands. Such a large variety in wavelengths (or energies) of emissions indicates that various emissions originate from different places or times of the nova ejecta. Hachisu & Kato (2022, 2023) proposed nova ejecta evolution models based on the fully self-consistent nova outburst model of Kato et al. (2022a). The authors found that a strong shock naturally arises in nova ejecta far outside the WD photosphere without ad hoc or arbitrary setting on the nova ejecta, and elucidated the origin of nova absorption/emission line systems raised by McLaughlin (1942).
Optically thick winds start after the X-ray flash ends (Kato et al., 2022b; König et al., 2022) and continue to blow until about the beginning of the SSS phase. The winds are called “optically thick winds,” because matter is accelerated deep inside the photosphere (Bath, 1978; Ruggles & Bath, 1979; Kato & Hachisu, 1994). However, the wind itself becomes optically thin outside the photosphere as shown in Figure 4a and b. The optical flux is dominated by free-free emission from ejecta just outside the photosphere of a nova envelope. The flux of free-free emission is larger for a larger mass-loss rate of the wind. In Kato et al. (2022a)’s model, when the wind mass-loss rate reaches maximum, both the envelope photospheric radius and free-free emission brightness also reach maximum (see Figure 2 of Hachisu & Kato, 2022).
The wind velocity at the photosphere becomes slower toward the optical maximum (Kato et al., 2022a; Hachisu & Kato, 2022). Such a tendency of decreasing wind velocity toward optical maximum was observed in many novae (e.g., Aydi et al., 2020). This simply means that the wind ejected earlier leaves behind the wind ejected later and therefore wind fluid expands. After the optical maximum, the wind velocity at the photosphere turns to increase. The wind ejected later can catch up the wind ejected earlier and compression of wind fluid occurs, resulting in a formation of a strong shock, as shown in Figure 4b.
Gamma-rays and hard X-rays are originated from the shock which is located far outside the WD photosphere. Supersoft X-rays are emitted from the WD photosphere when the photospheric temperature becomes high enough near/after optically-thick winds stop (Figure 4c).
The characteristic properties of nova winds play essential roles in the configuration of nova ejecta and emissions with different energy/wavelength. Figure 4 illustrates such a nova ejecta model for V339 Del. In what follows, we study observational properties of V339 Del along with this nova ejecta evolution scenario.
4.1 Very early phase before optical maximum
Figure 4a illustrates a very early phase of the nova outburst. The hydrogen-rich envelope of the WD begins to expand and optically thick winds start to blow when the photospheric temperature decreases to (K) and the photospheric radius expands to . After that, the photospheric radius increases with time until the maximum expansion of the photosphere. We call this period the pre-maximum phase.
In Kato et al. (2022a)’s nova model, the photospheric velocity of wind is decreasing with time until the optical maximum (or maximum expansion of the photosphere). Such a decreasing trend of velocity is commonly observed among various novae (e.g., Aydi et al., 2020).
The same trend of decreasing velocity is also obtained in V339 Del before the global optical maximum. Skopal et al. (2014) estimated the wind velocity from the H P Cygni absorption line center. The velocity is decreasing from km s-1 (on days) to km s-1 (on days the epoch of global optical maximum). Tomov et al. (2013) also obtained km s-1 (JD 2,456,519.38 UT 2013 August 14.88), 1.38 days after the outburst. A similar trend of decreasing velocity in the pre-maximum phase was also reported by De Gennaro Aquino et al. (2015, 2016).
It should be noted that the expansion rate of the pseudo-photosphere, , where is the photospheric radius, is not the same as the photospheric wind velocities, or , as illustrated in Figure 4a and already mentioned in Section 3.4. After optical maximum, the photosphere begins to shrink, not expands, as illustrated in Figure 4b.
4.2 Post-maximum phase and shock formation
Hachisu & Kato (2022) found a formation of a strong shock based on Kato et al. (2022a)’s fully self-consistent nova outburst model. In their nova model, the wind velocity is decreasing with time toward the optical maximum, but turn to increase after that. The wind trajectories depart from one another before the optical maximum (expansion), but converge after the optical maximum (compression). In other words, after the optical maximum, the wind ejected later catches up with the wind ejected earlier. This makes a reverse shock. Thus, a strong shock arises far outside the photosphere. This shock formation mechanism is common among all the WD masses and mass-accretion rates as far as the main driving force of wind is the radiative opacity (Hachisu & Kato, 2022; Kato et al., 2022a).
The trend of increasing wind velocity after optical maximum can be explained as follows: In optically-thick winds, matter is accelerated deep inside the photosphere by radiation pressure gradients which depend on the OPAL opacity (Iglesias & Rogers, 1996). In the decay phase of a nova, the mass of hydrogen-rich envelope is rapidly decreasing due to wind mass-loss. A less massive envelope is accelerated to a higher velocity for a given momentum (same radiation pressure gradients).
In this post-maximum phase, the whole ejecta is divided into three parts, as illustrated in Figure 4b; the outermost expanding gas (earliest wind), shocked shell (geometrically thin), and inner wind. These three parts contribute to pre-maximum, principal, and diffuse enhanced absorption/emission line systems (McLaughlin, 1942), respectively, as proposed by Hachisu & Kato (2022, 2023). It should be stressed that this interpretation is straightforward because we do not need any other arbitrary assumption (or setting) on nova ejecta.
In the V339 Del outburst, the wind velocity is obtained as follows. After the optical maximum ( days), the bluest edge of P Cygni absorption increases to km s-1 on day 16–26 (see, e.g., Figure 8 of De Gennaro Aquino et al., 2015). Shore et al. (2016) obtained km s-1 on day 16-37 (see their Figure 2). We regard these velocities to be the diffuse-enhanced absorption system. On the other hand, the main absorption part is located at km s-1 (De Gennaro Aquino et al., 2015) or at km s-1 (Shore et al., 2016) both on the same days mentioned above. We regard these to be the principal absorption system.
4.3 GeV gamma-rays from the shocked shell
Gamma-rays have been detected in novae (e.g., Chomiuk et al., 2021); some of them are in symbiotic binaries, but many are in close binaries that has no massive circumbinary matter. The so-called internal shock has long been expected in close binary novae as an origin of high energy (hard) X-rays (e.g., Friedjung, 1987; Mukai & Ishida, 2001). Here, the internal shock simply means the shock in the ejecta, and the external shock means the shock between the circumstellar matter and the nova ejecta.
Hachisu & Kato (2022) theoretically found that a shock wave inevitably arises in the course of nova outburst without any arbitrary setting, such as multiple shells or a circumbinary matter. They further clarified that a shock forms only after the optical maximum.
Chomiuk et al. (2021) summarized gamma-ray light curves of 12 novae (see their Figure 8). Among them, six novae, V339 Del, V1369 Cen, V5668 Sgr, V407 Lup, V5855 Sgr, and V5856 Sgr, clearly show that the first detection of MeV gamma-rays with significance were almost just after optical maximum.
Also, in the classical nova YZ Ret, a close binary nova ( hr; Schaefer, 2022a), gamma-rays were detected probably after the optical peak (Sokolovsky et al., 2022; König et al., 2022), although the optical peak is not clearly identified. A few additional cases of gamma-ray novae in close binary includes V1324 Sco, of which gamma-ray detection is between the two optical maximum, and V357 Mus, of which optical maximum probably missed.
In this way, the first detection dates of gamma-rays are consistent with the model prediction by Hachisu & Kato (2022), that is, a shock arises just after the optical peak.
4.4 Dust shell formation
A dust shell could be formed within a cool and dense shell behind the radiative shock in a nova ejecta (e.g., Derdzinski et al., 2017). V339 Del shows rebrightening in the light curve, suggesting a dust shell formation. Figure 1 shows that the mag light curve has two peaks. After the first peak, it decreases along with the (or ) light curve. However, the magnitude increases again from JD 2,456,552.5 (day ). The magnitude again peaked on JD 2,456,572.5 (day ). Also the band fluxes increase similarly (see Figure 1 of Burlak et al., 2015).
This second increase is owing to dust formation. Dust formation is reported on UT 2013 September 27.8 by Shenavrin et al. (2013), days after the outburst. Evans et al. (2017) obtained the formation date of dust to be 34.75 days after the eruption (their is UT 2013 August 13.9 JD 2,456,518.4). The epoch of dust formation is indicated by a black arrow in Figure 1a.
4.5 SSS Phase
The optically thick winds have stopped at the epoch of Figure 4c, because the mass of the hydrogen-rich envelope decreases to a critical value due mainly to wind mass-loss. Then, the photospheric temperature becomes high enough to emit soft X-rays. The nova entered the SSS phase (Kato & Hachisu, 1994; Sala & Hernanz, 2005; Wolf et al., 2013). Even if the winds stop emerging from the photosphere, the latest winds are still colliding with the shock and maintain the geometrically thin shocked shell, as in Figure 4c.
The SSS phase itself is not directly related to the shock, but the optical depth of the shocked layer influences the penetration of soft X-ray photons. Nelson et al. (2013) obtained the absorption column density of cm-2 from the Chandra X-ray spectrum, 89 days after the outburst, in the SSS phase. This is low enough for soft X-rays to penetrate the shocked thin shell. We will discuss the value based on our shocked shell model in Section 5.5.
4.6 Nebular phase and SSS phase
Munari et al. (2013c) reported that the nova entered the nebular phase on UT 2013 October 18 ( days after the outburst) from the flux ratio of [O III]H. We indicate the epoch in Figure 1.
In the nebular phase, strong emission lines such as [O III] 4957, 5007 Å contribute to the band while the band does not include these [O III] line region. Thus, the and light curves depart from each other. Figure 1 shows such a deviation between the and light curves. These departing behaviors of and have been known in V1500 Cyg (Lockwood & Millis, 1976) and V1668 Cyg (Gallagher et al., 1980).
In V339 Del, the beginning of the nebular phase is almost coincident with the start of the SSS phase. Munari et al. (2015) discussed that the nebular emission could be excited by the SSS X-ray photons. They reported their Strömgren , , and narrow-band H, [O III] photometric evolution of V339 Del. They interpreted that, as the ejecta becomes optically thin, the supersoft X-ray input increases and the [O III] 5007 Å emission line rapidly grows in intensity. This causes the brightness in the [O III] band to slow and then to stop the decline (initial 20 days of the SSS phase), followed by an actual and long lasting brightening (see Figures 8 and 9 of Munari et al., 2015). At the end of the SSS phase (130 days past it begun), V339 Del is still brighter by 0.2 mag in the [O III] band than before it started.
We will discuss if the source of nebular emission is the WD X-ray emission or the shocked shell contribution based on our light curve model in Section 6.
4.7 Coexistence of Dust and SSS Phases
Gehrz et al. (2015) pointed out that V339 Del is a rare object among many novae because it shows both dust formation and a soft X-ray radiation in the same period. Evans et al. (2017) also argued the coexistence of X-ray radiation and dust, and concluded that grain shattering by electrostatic stress destroyed dust around V339 Del. In other novae, the dust has not been exhibited because a soft X-ray radiation is expected to have destroyed dust. We will elucidate the mechanism of this coexistence based on our shocked shell model in Section 6.
5 Light Curve Model
Here we present a theoretical light curve model for the V339 Del outburst assuming spherical symmetry. We do not take into account non-spherical nature of ejecta, mainly because we try to explain the main properties of multiwavelength light curves. Non-sphericity of ejecta could be important to analyze complicated line profiles in nova spectra, which is however beyond the scope of the present work.
Among a large set of nova model light curves presented by Hachisu and Kato, we chose a model with the chemical composition of the envelope “neon nova 2 (Ne2),” i.e., . Here, , , and are the mass fraction of hydrogen, helium, and heavy elements, the total abundance of extra carbon, nitrogen, and oxygen, and the extra neon (e.g., Hachisu & Kato, 2006). The optical light curve is tabulated in Table 3 of Hachisu & Kato (2010).
5.1 Optical Light Curve
Hachisu & Kato (2006) proposed a formula of free-free flux in the band from nova winds based on Kato & Hachisu (1994)’s nova outburst model, which can be simplified as
| (1) |
where , , and are the wind mass-loss rate, wind velocity at the photosphere, and photospheric radius, respectively, and is the coefficient for free-free emission. This luminosity represent the flux of free-free emission from optically thin plasma just outside the photosphere. See Hachisu & Kato (2006) for the derivation of this formula and Hachisu et al. (2020) for details of the coefficient . Note that optically-thick nova winds become optically thin outside the photosphere (Figure 4a and b) and we obtain the free-free flux using the physical values at the photosphere.
The total -band flux is the summation of the free-free emission luminosity and the -band flux of the photospheric luminosity ,
| (2) |
The photospheric -band luminosity is calculated from a blackbody with and using a canonical response function of the -band filter, where and are the photospheric temperature and luminosity of our steady-state envelope solution (e.g., Kato & Hachisu, 1994).
To summarize, optically-thick winds are accelerated deep inside the photosphere. The wind becomes optically thin outside the photosphere (Figure 4a and b). The emission from the photosphere is calculated assuming blackbody with the photospheric temperature and luminosity . On the other hand, the wind continuously blows through the photosphere, the gas of which is hot and optically thin outside the photosphere and emits photons by free-free emission . In other words, comes from plasma outside the photosphere. Therefore, is not limited by the Eddington luminosity, which can operate only in the optically-thick region.
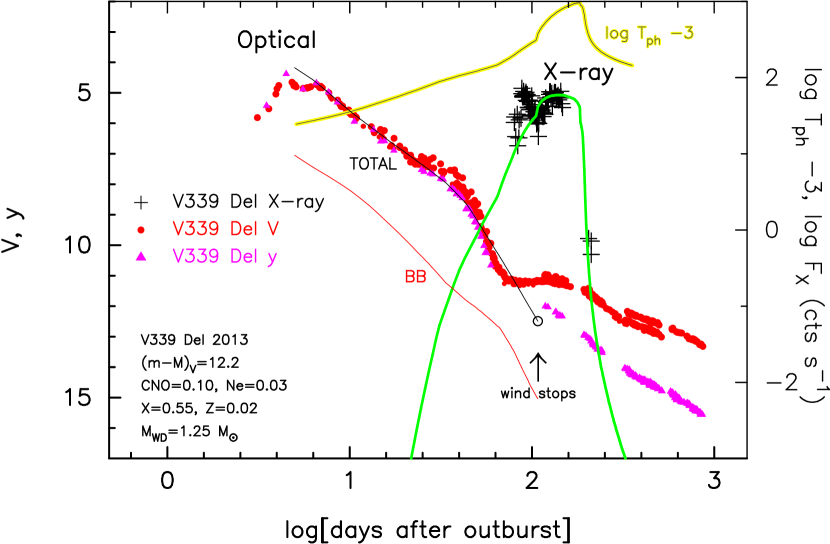
Figure 5 shows our model light curves of the 1.25 WD (Ne2) fitted with the and supersoft X-ray observation. The blackbody flux from the photosphere (red line labeled BB) is much smaller than that of free-free emission of ejecta, so the total flux (black line labeled TOTAL) is very close to the free-free emission luminosity. This tendency is also seen in other novae (e.g., V1668 Cyg, V693 CrA, QU Vul, V351 Pup, V1974 Cyg, and V382 Vel in Hachisu & Kato, 2016a). It should be noted that, because the steady-state winds in Kato & Hachisu (1994)’s model are valid in the decay phase of novae, our model light curve can be applied to the post-maximum phase of novae. Thus, we plot our model light curve for the decay phase of a nova, i.e., after the optical maximum.
The TOTAL light curve well reproduce the observed data for both and until day . The free-free light curve decreases with time but its decline rate changes on day . This is because the wind mass loss rate quickly decreases with time when the photospheric temperature increases to (K) and the wind acceleration becomes ineffective (or inefficient).
The free-free flux of wind is determined mainly by the wind mass-loss rate (Equation (1)). Therefore, the steep decrease in the brightness is due to the quick drop in the wind mass-loss rate. The radiative pressure gradients in the envelope depend on the height of the iron peak at of the OPAL opacity (Iglesias & Rogers, 1996) because the peak blocks radiative flux and makes large radiative pressure gradients. When the photospheric temperature is increasing to pass through (iron peak of the OPAL opacity, see - plot in Figure 2 of Kato & Hachisu, 1994), the effect of radiative pressure gradient is rapidly decreasing, but is still working. This corresponds to the steep decreasing phase in the brightness after day 45. At about (see Figure 5), the height of a residual part of the iron peak inside the photosphere becomes too low (or small) to drive optically-thick winds mainly because a large part of the iron peak goes outside the photosphere. Optically-thick winds driven by radiative pressure gradients stop at/around . The date of wind stopping is denoted by the black arrow labeled “wind stops.”
Thus, the quick decrease in the light curve during day -80 is owing to the quick decay in the wind mass-loss rate, not necessary owing to dust blackout. Such a quick decay is seen in the light curves of V1500 Cyg (Lockwood & Millis, 1976) and V1668 Cyg (Gallagher et al., 1980).
Our WD model has a hydrogen-rich envelope of mass at optical maximum. If the mass-accretion rate to the WD is about yr-1 (Figure 3), the recurrence time is about yr. These values are broadly consistent with the positions at the MMRD diagrams (Figure 3). We assume that in Figure 5. Then, our model light curve follows well the observed and light curves. This supports our adopted distance of kpc for , because .
5.2 Supersoft X-Ray Light Curve
The supersoft X-ray flux is calculated from the photospheric temperature and luminosity of the same model as that of the optical light curve. The green line in Figure 5 denotes the supersoft X-ray flux for the 0.3–2.0 keV energy range. The X-ray flux rises as the photospheric temperature increases to (K) and keeps a constant value around the maximum and begins to decay after hydrogen burning turned off (day ).
We fit our X-ray light curve to the Swift X-ray count rates (0.3–10.0 keV) to set the flat peak on the top count rates, as shown in Figure 5. The difference in the higher energy range, i.e., between 2.0 – 10.0 keV, can be neglected, because most energies of X-rays are emitted at keV (Osborne et al., 2013). Our model light curve is the X-ray luminosity , while the observational data are the count rate. These two are not the same, but our model X-ray light curve reasonably reproduces the temporal variation of the Swift/XRT count rates.
The X-ray count rate in the early SSS phase shows a large amplitude variation (LAV) (Beardmore et al., 2013). This LAV disappears in the later SSS phase. Shore et al. (2016) reported a period of LAV from day 72 to 88, and then a decrease in the count rate by a factor of 5 from day 88 to day 108. Figure 5 shows that the count rate varies along our theoretical model. The LAV appears on day 72 and ends on 110, of which the period exactly corresponds to the phase when the wind mass-loss rate rapidly decreases to finally stop on day 108.
Thus, we regard that the LAV is closely related to the condition of the optically-thick winds. The timescale of the LAV is about 1 day (Beardmore et al., 2013). The thermal timescale of the WD envelope is also about days, where and are the thermal timescale and thermal energy of the hydrogen-rich envelope of the WD, respectively. Thus, the variation timescale is almost the same as the thermal timescale of the envelope. If the winds are thermally unstable just before they stop, we are able to explain the timescale of the variability. See Schwarz et al. (2011), Osborne et al. (2011), and Munari et al. (2015) for other possible explanations on the various LAVs of novae.
Recently, Milla & Paerels (2023) presented X-ray spectra observed with Chandra on UT 2013 November 9 and 2013 December 6 (day 88 and 115) during the SSS phase (day 71 – 200). They obtained the atmospheric effective temperature of K and a shell with the velocity of km s-1 from absorption spectra. This velocity is consistent with the diffuse enhanced system of km s-1 already discussed in Section 4.2.
In our WD (Ne2) model, optically-thick wind is still blowing until day . The velocity of the wind is regarded as that of the diffuse enhanced system, km s-1. Thus, the main absorption feature of the X-ray spectra is consistent with our wind model. The effective temperature of the WD photosphere is about K during day 88 to 115, much lower than Milla & Paerels (2023)’s value. It should be noted that Nelson et al. (2013) reported a temperature of k eV ( K) for the Chandra X-ray spectrum of V339 Del on day 88, which is consistent with our WD (Ne2) model.
On day 88, the photospheric radius is about 16 times larger than that of the original (cool) WD. The difference by a factor of two in the temperature comes from the fact that Milla & Paerels (2023) adopted Rauch (2003)’s atmosphere model, which is based on the assumptions of plane-parallel and in hydrostatic balance.
Milla & Paerels (2023) further claimed a second shell of mass with velocity of km s-1. This second shell is very unlikely because no such high velocity components were observed in optical spectroscopy of V339 Del (e.g., Skopal et al., 2014; De Gennaro Aquino et al., 2015; Shore et al., 2016). Also, their obtained shell mass of is too massive to be compatible with our ejecta mass of , as will be discussed in Section 5.5. We may conclude that this second shell is spurious.
5.3 A shock formation far outside the photosphere
Figure 6a shows the temporal variation of the wind velocity at the photosphere of our WD (Ne2) model. The velocity increases with time, so the matter ejected later will catch up the matter ejected earlier and this results in formation of a strong shock.
Figure 6b depicts the trajectories of each wind particle. Here we assume a ballistic motion for each fluid particle after it is ejected from the photosphere. The position of each fluid particle is denoted by the black line. The shock wave expands far outside the photosphere. We use mass and momentum conservations to derive the shock velocity. The method of this shock calculation is briefly described in Hachisu & Kato (2022).
Figure 6c shows the column density of hydrogen behind the shock and the number density of plasma particles in just front of the shock. We will use these values to estimate the X-ray and gamma-ray emission from the shocked matter.
Hachisu & Kato (2022) showed that the shock properties and high energy emissions in a classical nova can be well explained if we adopt observed velocities instead of their theoretical values. We have already obtained the pre-maximum, principal, and diffuse-enhanced absorption line systems in Section 4.2. These line systems can be interpreted to originate from the earliest wind, shocked shell, and inner wind, respectively, as in Figure 4b.
In what follows, we regard the principal and diffuse-enhanced velocity systems to be km s-1 and km s-1, respectively, instead of our shock model velocities of –600 km s-1 and –1000 km s-1. Here, is the velocity of the principal system, and is that of the diffuse-enhanced system.
Our WD (Ne2) model shows the shock velocity of –600 km s-1 and the wind velocity of –1000 km s-1, as in Figure 6a. These velocities are about 40% smaller than the observed ones. The wind acceleration depends on the opacity in our optically-thick wind theory. When the radiative opacity was changed to the OPAL opacity (Iglesias & Rogers, 1996), the wind velocity increases drastically. Thus, we feel a slight lack of acceleration agent to obtain the wind velocities comparative with the observation (see, e.g., Bailey et al., 2014, for a possible cause for higher opacity).
5.4 Duration of shock
The shock arises just after the optical peak (see Figure 6). This shock continues until shortly after the wind stops, and disappears when the last wind reaches the shock front, as illustrated in Figure 4c. The lifetime of the shock can be estimated by the same way as that of Hachisu & Kato (2022, 2023):
| (3) |
Substituting km s-1 (principal system), km s-1 (diffuse-enhanced system), and days ( days; the epoch when the optically-thick winds stop in our model minus the date of the global optical maximum) into Equation (3), we obtain the shock duration is days. Therefore, we expect hard X-ray emission until day . This date is close to the end of the SSS phase on day .
In some novae like in YZ Ret 2020 (e.g., Figure 1 of Hachisu & Kato, 2023) and V2491 Cyg 2008 (e.g., Figure 7 of Kato et al., 2021), the X-ray count rate does not drop to zero even after the hydrogen shell-burning ended. These late X-rays could originate from the shock (or shocked shell). In V339 Del, the X-ray count rate rapidly decreased to undetected level at the end of the SSS phase, which is consistent with the date when the shock disappeared.
5.5 Hard X-ray emission from shocked matter
The temperature just behind the shock is estimated to be
| (4) | |||||
| (5) |
where is the Boltzmann constant, is the temperature just after the shock (see, e.g., Metzger et al., 2014), is the mean molecular weight ( for hydrogen plasma), and is the proton mass. Substituting km s-1 and km s-1, we obtain the post-shock temperature keV.
Mechanical energy of the wind is converted to thermal energy by the reverse shock (Metzger et al., 2014) as
| (6) | |||||
| (8) | |||||
Substituting yr-1 from Figure 6a, we obtain the post-shock energy of erg s-1.
In the later nebular and SSS phases, the velocity and mass of the shocked shell do not change so much. The column density of hydrogen is estimated from , where is the density in the shocked shell, and is the thickness of the shocked shell. If we take an averaged velocity of shell , the shock radius is calculated from . This reads
| (9) | |||||
| (10) | |||||
| (12) | |||||
This gives cm-2 for , km s-1, and days, which is close to the start day of the SSS phase. This value is broadly consistent with cm-2 obtained by Nelson et al. (2013) from the Chandra X-ray spectrum on day 88.
For hard X-ray observations, Page & Beardmore (2013) reported the Swift/XRT detection of X-rays mainly below 2 keV energies between day 37 and day 40. They estimated the hydrogen column density of cm-2. Our 1.25 WD (Ne2) model gives a similar column density of cm-2 on day 40.
5.6 GeV gamma-ray emission from shocked matter
GeV gamma-rays were observed in the V339 Del outburst with the Fermi/LAT (Ackermann et al., 2014). Such GeV gamma-rays originate from strong shocks (see, e.g., Chomiuk et al., 2021, for a recent review). The positive detection of gamma-rays started on days, as shown in Figure 2b, just after the global maximum. This epoch of appearance is consistent with our shock model (Hachisu & Kato, 2022).
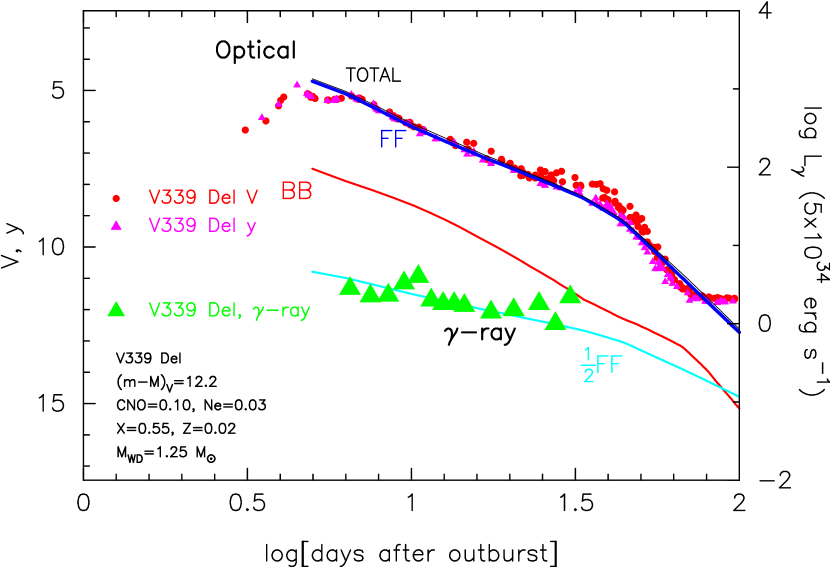
Hachisu & Kato (2022) obtained the decay trend of gamma-ray flux based on their shock model. In their model, the optical flux is dominated by free-free emission and is given by (Equation (1)) while the gamma-ray flux is given by (Equation (8)), where is a function of time . Therefore, the light curves (in magnitude) are written as
| (13) | |||||
| (14) | |||||
| (15) | |||||
| (16) | |||||
| (17) |
so the decay slope is slow by a factor of 2. We plot the (cyan line labeled FF) in Figure 7. This model slope reasonably represents the decay trend of GeV gamma-ray fluxes. Similar decay trends were observed in V5855 Sgr (Hachisu & Kato, 2022) and YZ Ret (Hachisu & Kato, 2023).
Ackermann et al. (2014) obtained the flux of GeV gamma-ray (0.1–300 GeV) to be erg s. The optical luminosity is about erg s on the same day (Skopal et al., 2014). The gamma-to-optical ratio is , if we adopt kpc (Bailer-Jones et al., 2021). The of V339 Del is lowest among the gamma-ray detected novae (typically ; Li et al., 2017; Chomiuk et al., 2021). This could be due to a smaller difference between and , i.e., km s-1, which results in a relatively weak shock of keV in Equation (5). On the other hand, other several novae showed km s-1, which results in a relatively strong shock of -2 keV (e.g., Hachisu & Kato, 2022).
The gamma-ray luminosity obtained by Ackermann et al. (2014) is erg s-1 for kpc. In our model, the shock energy generation is obtained to be erg s-1 (Section 5.5). The ratio of , about 1% conversion rate from the shock energy to the gamma-ray energy, is consistent with the conversion limit of
| (18) |
where is the fraction of the shocked thermal energy to accelerate nonthermal particles, and is the fraction of this energy radiated in the Fermi/LAT band (typically ; Metzger et al., 2015).
5.7 Emission from the Shocked Shell
Figure 7 shows that our theoretical light curve calculated by Equation (2) explains the decay phase of the and light curves of V339 Del until day . This means that the band flux is dominated by free-free emission (blue line labeled FF) from the optically thin ejecta just outside the photosphere. Note that the optically-thick winds become optically thin outside the photosphere (Figure 4a and b). The contribution from the photospheric emission (red line labeled BB) is rather small.
In the later phase, the shocked shell far outside the photosphere begins to contribute to the band flux. Hachisu & Kato (2023) estimated the luminosity of free-free emission from the shocked shell as
| (19) |
where , , and are the mass, radius, and thickness of the shocked shell, respectively, and is the proportionality constant. We assume constant in time when the shock is alive. Note that this expression roughly includes the fluxes of bound-free and bound-bound emission by replacing with or , where and are the coefficients of bound-free and bound-bound emissions, respectively. The other details and derivation of Equation (19) are described in Appendix B of Hachisu & Kato (2023).
Now we have two different luminosities of (FF+BB: equation (2)) and (shell: equation (19)). Hachisu & Kato (2023) adopted
| (20) |
for the total flux, instead of simple summation of the two, because the shocked shell may absorb a part of and re-emit it as a part of .
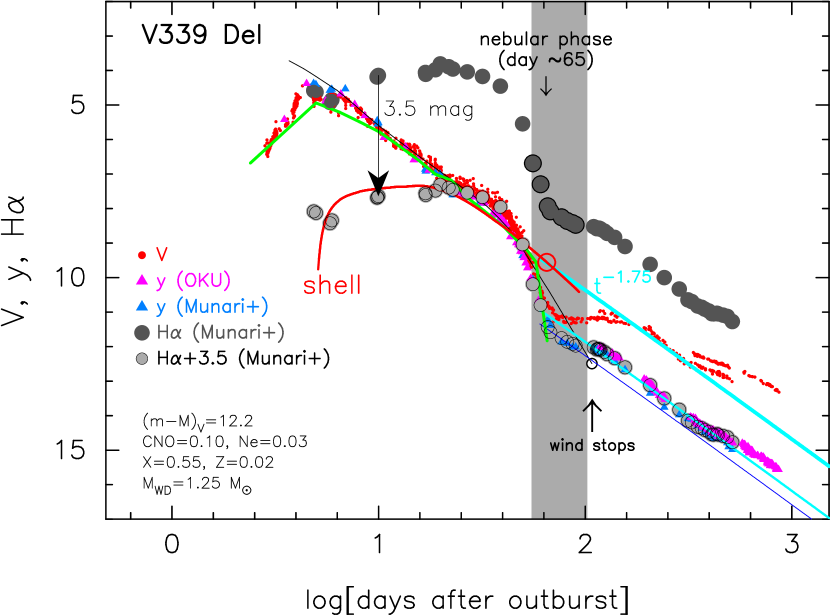
We show the shell emission calculated from Equation (19) in Figure 8a (thick red line labeled shell), which is taken from Hachisu & Kato (2023). The shocked shell emission gradually increases after the shock arises, and reaches a plateau peak on day 16, followed by a slow decay approximately of (thick cyan line labeled ).
5.8 The Universal Decline Law
Hachisu & Kato (2006) found that theoretical light curves of free-free emission calculated based on the nova winds show a decline trend of , which is independent of the WD mass and chemical composition of the envelope. They and their following works showed that many novae show the law. Because the photospheric blackbody flux is much smaller than the flux of free-free emission, the summation of FF+BB fluxes also follows the universal decline law (Hachisu & Kato, 2015).
Hachisu & Kato (2023) further showed that the universal decline law of can be extended over the nebular phase in which the optically thick wind has stopped, if the emission from the shocked shell is taken into account. They extended the universal decline law of to the nebular phase until the shock disappears.
Figure 8a shows the broad band , intermediate band , and narrow band [O III] light curves of V339 Del. Both the and light curves similarly decline along with the universal decline law of until day . After the quick decay in the dust blackout phase (gray-shaded region), the light curve recovered on day and came back to the original decline trend of (thick cyan line labeled ). The band magnitude does not recover. After the dust blackout ended (day ), it shows the same slope of (thin cyan line) starting from the bottom of the dust dip. The location of the line (thin cyan line) is about 1.5 mag below the original decline trend (thick cyan line). The recovery of the light curve starts with the significant increase of the [O III] line emission, because the luminosity includes the flux, but the luminosity does not.
Figure 8b shows the light curve of LV Vul overplotted with the and light curves of V339 Del. LV Vul evolves slower than V339 Del, so we applied the time-stretching method (see Section 5.11) to overlap the same evolution stages of LV Vul with those of V339 Del. The time-stretching factor is , that is, the time-shift by in the horizontal direction, and the vertical shift by mag, as shown by the inserted text of “LV Vul V-0.5, 0.48 t.” LV Vul shows no dust formation. The light curve (blue square) declines almost along with the same universal decline law of (thick cyan line) over the nebular phase. It should be noted that the shell emission (red line) dominates the luminosity in the nebular phase. Comparing V339 Del (Figure 8a) with LV Vul (Figure 8b), we understand that the shell emission (red line) is dominated by [O III] lines. Thus, we regard that the coefficient in Equation (19) is not (free-free) but (bound-bound) for [O III] lines in the nebular phase.
To summarize, there are two main optical sources for , one is the flux of free-free (FF) emission from winds ( in Equation (1)) that is dominant in the early decay phase, and the other is the flux of free-free, bound-free, and bound-bound emissions from shocked shell ( in Equation (19)) that is dominant in the nebular phase or later. Hachisu & Kato (2023) found that the shocked-shell flux of exceeds the free-free flux of in the nebular phase. These two fluxes are connected smoothly to the universal decline law of in typical novae such as LV Vul (Figure 8b).
The light curve of V339 Del does not smoothly decay along the law, but has a mag dip in the nebular phase. We try to elucidate the nature of this dip in Section 6.
5.9 [O III] band flux
Figure 8a shows the temporal variation of the [O III] band flux, the data of which are taken from Munari et al. (2015). Note that the day zero in their Figures 5, 6, 7, and 8 are defined at the first optical peak, HJD 2,456,520.9, which corresponds to our day 2.9. It decays almost along with the and light curves until the dust blackout starts (gray-shaded region). This simply means that the continuum flux dominates the line emission in the [O III] band. If we divide the [O III] band flux into two parts, i.e.,
| (21) |
where is the frequency, is the continuum flux in the [O III] band, and is the [O III] line flux. This can be seen in the spectral evolution in Figure 4 of Munari et al. (2015) that shows the emission line [O III] is weak until day 9.4 and gradually become strong and dominate the continuum on day 59. Thus, we have in the early phase, i.e., , where is the free-free flux of wind in Equation (1). This is the reason that the [O III] band light curve follows almost the free-free light curve.
After the dust blackout starts, the total continuum flux of wind (FF+BB) decays quickly as indicated by the thin black line in Figure 8a, but the [O III] band flux follows the shell emission (thick red line labeled shell). Now, we have , where is the flux of the shocked shell in Equation (19). This indicates that, after the dust blackout starts (in the gray-shaded region), the [O III] band flux is mainly originated from the shocked shell but not from the wind.
After the dust blackout ended (outside the gray-shaded region), the radiation field in the shocked shell becomes hot, so the line flux, , increases. As a result, the [O III] band flux starts to deviate from the universal decline law (thick cyan line labeled in Figure 8a). Figure 4 of Munari et al. (2015) shows that the line flux dominates the [O III] band flux on day 492. We regard that the [O III] line emission is located at the shocked shell, as shown in Figure 4d.
5.10 H band flux
Figure 9 shows the temporal variation of the H band flux (filled dark gray circles), the data of which are taken from Munari et al. (2015). At/near the optical maximum, H band magnitudes almost coincide with those of and magnitudes, and after that it becomes much brighter than the optical and magnitudes.
We add a 3.5 mag-down H light curve (encircled light grey circles), which shows an excellent agreement with the shell emission light curve (red line labeled shell) until the dust blackout started and then with the light curve.
If we divide the H band flux into two parts, i.e.,
| (22) |
where is the continuum flux in the H band, and is the H line flux at the frequency , we have at/near the optical maximum. This is the same situation as that of the [O III] band flux in the previous subsection 5.9.
It is clear that the H band flux follows proportionally with the flux of shell emission, i.e., we have after the strong shock arises and until the dust blackout starts. Thus, we conclude that the dominant source of H is the shocked shell, at least, between the global optical maximum and the start of dust blackout.
The H band flux rapidly decreases in the dust blackout phase. We regard that the temperature of radiation field in the shocked shell rapidly decreases with the dust formation. However, it is very interesting that the 3.5-mag-down H light curve is just overlapped with the light curve after the dust blackout has started.
5.11 Distance Modulus based on the Time-stretching Method
Here, we derive the distance modulus to V339 Del based on the time-stretching method (Hachisu & Kato, 2010, 2015, 2016a, 2018a; Hachisu et al., 2020). This method is based on the similarity of nova light curves. Adopting appropriate time-stretching parameters, we are able to overlap two nova light curves even if the two nova speed classes are different. If the two nova light curves, i.e., one is called the template and the other is called the target, and overlap each other after time-stretching of a factor of in the horizontal direction and shifting vertically down by , i.e.,
| (23) |
their distance moduli in the band satisfy
| (25) | |||||
Here, and are the apparent and absolute magnitudes, and and are the distance moduli in the band of the target and template novae, respectively.
Figure 8b shows the light curves of LV Vul and V339 Del. With the time-stretching factor and shift in Figure 8b, we have the relation of
| (26) | |||||
| (27) | |||||
| (28) |
where we adopt from Hachisu & Kato (2021). Thus, we have a consistent value of the distance modulus in the band with the Gaia eDR3 distance of kpc and extinction mentioned in Section 3.5. The distance of LV Vul is calculated to be kpc for (Schaefer, 2022b) and (Hachisu & Kato, 2021). This distance is consistent with the results of Gaia eDR3 (Bailer-Jones et al., 2021), kpc. Thus, our distance modulus in the band of is supported by the time-stretching method.
6 Discussion
V339 Del is a rare object among novae in the sense that dust exists in the SSS phase (Gehrz et al., 2015). This means that a hot radiation field did not destroy dust. In this section, we clarify the reason why a dust shell coexists with a soft X-ray radiation field in V339 Del, and confirm that the 1.5 mag dip in the light curve is not caused by dust absorption.
6.1 [O III] emission and rapid decay of the light curve
In Section 5.1, we have shown that the rapid drop of the magnitude is due to the rapid decrease in the wind mass-loss rate, not by the dust absorption. Such a drop in the magnitude was reported in the two classical novae, V1500 Cyg (Lockwood & Millis, 1976) and V1668 Cyg (Gallagher et al., 1980). In marked contrast to V339 Del, the magnitudes in these two novae display continuous decreasing along with the universal decline law of . This is because the flux of [O III] rapidly increases and fills the difference between the magnitude and line (Hachisu & Kato, 2016a), as discussed in Section 5.9.
[O III] lines are excited in an environment of lower density and higher temperature (hot radiation field). In the rapid drop phase of free-free (FF) light curve, the wind mass-loss rate quickly decreases that results in the rapid drop of the wind density. At the same time, the photospheric temperature increases with time (Figure 5). Therefore, the ejecta satisfy a suitable condition for exciting [O III] emission, as the mass-loss rate rapidly decreases.
The increase in the [O III] flux compensates the decrease in the flux, which results in a continuous decline trend in the band luminosity expressed by in typical novae such as V1500 Cyg and V1668 Cyg. In V339 Del, however, dust blackout phase overlaps with this rapid drop phase of light curves, as shown in Figure 10. The [O III] lines are not effectively excited in a cooler environment of dust formation (Figure 4d). Therefore, the gap is not filled with the [O III] flux until a hot radiation environment is recovered. We can interpret that the 1.5 mag dip is caused by a cooler environment for dust formation but not by absorption of dust. This interpretation is supported by the fact that the light curve is not recovered just after the 1.5 mag dip but is monotonically decreasing with the slope of even after the dust blackout phase ended (Figure 10). Thus, the cool environment for dust formation affects the excitation of [O III] lines in the shocked shell (Figure 4d).
The band light curve shows a deeper dip of mag, as seen in Figure 10. This 1.5 mag depth corresponds exactly to the difference between the two cyan lines of for the and magnitudes. The band flux includes the flux of the [O III] lines while the band does not. After the dust blackout phase (gray-shaded region in Figure 10), the [O III] emission rapidly increases. This increase begins when a cool environment disappears and a hot radiation field is recovered. Thus, the deep depth of 1.5 mag in the band simply suggests that the optical line emission of [O III] is substantially suppressed during the dust blackout phase, and not owing to absorption of continuum flux by dust.
6.2 Formation of an optically-thin dust shell
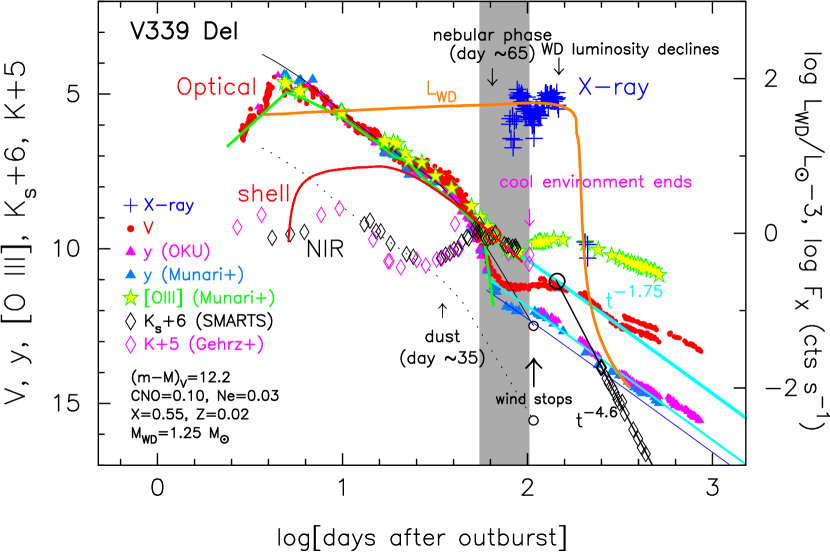
Figure 10 shows the near-infrared (NIR) and band magnitudes, but mag is shift down by 6 mag and mag is 5 mag down to fit them with the universal decline trend of (thick cyan line labeled ) during the dust blackout phase. The shows two maxima, on day and day . After the first maximum, the magnitude declines along with our WD (Ne2) model light curve (dotted black line), same as the thin black line, but shifted down by 3 mag, to fit the mag data. Because this line reproduces well the observed NIR data before rebrightening, we regard that the NIR emission in this phase is dominated by free-free emission from the optically thin plasma (winds) just outside the photosphere.
The magnitude starts to rise again after a dust shell forms on day , and reaches the second peak around day . After that, the magnitude begins to decay following the universal decline law of , where is the luminosity in the band. The magnitude also behaves similarly to the magnitude until a substantial dust blackout phase ended (shaded region in Figure 10).
Derdzinski et al. (2017) showed that dust formation can occur efficiently within the post-shock gas. Therefore, we regard that a dust shell formed just behind the shock as illustrated in Figure 4d. Once the dust shell formed, it partly blocks FF+BB (thin black line in Figure 10) emissions from the wind and WD photosphere, which are emerging from near WD, i.e., far inside the shock and dust shell. Taking a close look at Figure 10, we can see that the band radiation is slightly absorbed between day 75 – 90. During this period, it decays along with the thin blue line of , which is 0.4 mag below the thin cyan line. If the band fluxes were not absorbed by the dust shell, the light curve would follow this thin cyan line. Thus, we measure the optical depth of dust at the band; the band flux was absorbed, at least, by 0.3 mag , that is, , or 0.4 mag , i.e., .
A similar analysis can be done in the UV light curves. Shore et al. (2018) showed three UV light curves of 2025, 2650, and 3555Å bands in their Figure 11. They fitted the overall decay trend with , where is the luminosity of a UV band. These three UV light curves show a dip between day 80 and 100. Each measured flux data shows large fluctuations. The 3555Å band data are least scattered among the three bands, so we adopted the 3555Å light curve and estimated the deepest depth of the dust dip, as deep as on day 73, the difference from the fitted trend line of . This corresponds to the optical depth of , being consistent with the dust absorption calculated from the band light curve as mentioned above.
Taranova et al. (2014) estimated the dust luminosity of and on day 39.28 and 59.18, respectively. The latter luminosity corresponds to 10% of the WD luminosity ( for our 1.25 WD model together with the distance of kpc). In other words, the dust shell absorbed % of UV and soft X-ray photons from the central hot WD, and reemitted in near/mid-infrared bands. This picture is consistent with our interpretation of optically-thin dust shell, estimated in the band.
Skopal et al. (2014) presented a dust component in their broad band spectrum on day 38 (UT 2013 September 20). The dust temperature is K and the luminosity is erg s with blackbody assumption. This dust luminosity is about 3% of the central WD luminosity, i.e., on day 38 of our WD model and distance of kpc. Assuming that dust absorbs a part of the flux from the central WD and reemits it and the total emitting flux is conserved (steady-state), the absorption efficiency by dust is about 3%. This corresponds to the optical depth of . The shock luminosity is negligibly small on day 38, i.e., erg s-1 from Equation (8) with yr-1.
Taranova et al. (2014) also estimated the radius of the dust shell, cm and cm on day 39.28 and 59.18, respectively. On the other hand, our shocked shell is located at cm on day 59, twice larger than Taranova et al. (2014)’s estimate for kpc. This difference can be explained as follows: Assuming an optically-thick sphere of dust shell as a radiation source, Taranova et al. (2014) estimated the dust shell radius, as , where is the distance, is the luminosity at 3.5 m ( band), and is the intensity of the blackbody radiation at the band and dust temperature of . In our analysis, the dust shell is optically thin (and geometrically-thin) so that we must adopt a filling factor, , where is the thickness of the dust shell. Then, the total emission of the dust should be written as . If we adopt () or so, we obtain , which gives a radius of three times larger than their estimate, being broadly consistent with the shock radius of our model for the distance of kpc.
Gehrz et al. (2015) reported that the dust shell emitted about on day 102, which is about 8% of the luminosity of our 1.25 WD model. Here, for the distance of kpc. This dust luminosity is consistent with Taranova et al. (2014)’s estimate.
Gehrz et al. (2015) also argued that the failure of substantial dust formation is due to a lower gas density than the critical density proposed by Gehrz & Ney (1987).
To summarize, during the substantial dust blackout phase (shaded region in Figure 10), a dust shell with the optical depth of absorbed the band flux (FF+BB: continuum) that comes from far inside the shocked shell.
6.3 The 1.5 mag dip in the band
We showed that the dust is optically thin in Section 6.2. If the 1.5 mag dip in the light curve is attributed to dust absorption, we need much larger optical depth such as , which is unlikely to be compatible with the observation as described in Section 6.2. Thus, we conclude that the 1.5 mag dip is not caused by absorption of dust.
From Figure 10, we see that (1) the temporal variation of the [O III] flux behaves similarly to the shell emission during the substantial dust blackout phase (gray-shaded region in Figure 10). Thus, the [O III] emission region must be in the shocked layer. (2) It is unlikely that the flux of [O III] lines is much absorbed during the dust blackout phase. Instead, it almost follows the universal decline law. Thus, we suppose that these [O III] lines are formed outside the optically-thin dust layer as shown in Figure 4d. (3) The dust formation site needs a cool environment. The resultant cool environment could suppress the excitation of [O III] lines. (4) Dust formation reaches a peak on day 55. After day 55, the cool environment is gradually diluted out. A hot radiation could start to excite [O III] lines in the dust layer at least until day 100, the end of substantial dust blackout phase. (5) The flux of [O III] lines gradually increases and reaches a peak on day 140. Accordingly, the light curve recovers and follows the original universal decline law (thick cyan line labeled in Figure 10).
The 1.5 mag drop in the band simply suggests that excitations of [O III] lines are substantially suppressed during the dust blackout phase, but it is not owing to large absorption by dust.
6.4 Rapid decrease in the dust shell emission
Although we have no data between day and day , we see a clear change in the decline rate of (or ) light curve (open black (or magenta) diamonds) in Figure 11; it decays along the universal decline law of (thin cyan line labeled ) in the dust blackout phase, but in the latest phase decays as (thick straight black line labeled ). A simple extension of the black straight line can cross the universal decline law (thin cyan line) on day (large open black circle). This date is close to the date when the WD luminosity starts to decline on day (thick orange line labeled in Figures 10 and 11).
The decay trend of could be explained by the relative decrease in the cross section of dust. We assume that the number of dust grains and their size are unchanged after the maximum of on day 55 (Figure 11). As the dust shell expands with the shocked shell, the surface area of the shell increases as , where is the radius of the shell, is the time from the formation of a shock, and . On the other hand, the total cross section of dust grains is constant with time, i.e., constant because the dust shell is optically thin. The photon cross section against dust is decreasing along , here the shock velocity is almost constant (very gradually increasing). The absorption by the dust shell decreases as and the re-emission from the dust also decreases with the same rate . This decay trend is very close to the trend of .
Shore et al. (2018) discuss that, since the structures are frozen within the ejecta, any change in IR continuum emission should be a simple power law. Thus, we may extend the decay trend of to day , the date when the WD luminosity starts to decline as shown in Figure 10, or day , the date when the hydrogen shell-burning ends as shown in Figure 11.
After the Sun constraint, the decay trend was changed to . It is reasonable to assume that this trend went back to the crossing point with the trend of (or ).
This crossing point coincides with the date when the light curve fully recovered from the 1.5 mag dust dip or when the [O III] light curve attains its local maximum (Figure 10). Both of them could be related to the local maximum of the WD luminosity, , where we define the WD luminosity as the photospheric luminosity of our WD envelope (orange line in Figures 10 and 11). Except for the dust blackout phase, the light curve broadly follows the law from its maximum until a very late phase.
The decay trend of could have changed later than the crossing point, if it is associated to a rapid cooling of the WD (day in our model). Or it could change earlier: Evans et al. (2017) reported that the dust flux, grain size, and dust mass have peaked on day 103, although there are no data between day 103 and day 683.
Shore et al. (2018) claimed that dust survives at least day 867 because optical and UV line profiles show asymmetry owing to dust absorption. Asymmetry of IR line was observed until day 78 but disappeared on day 683 (Evans et al., 2017), which Shore et al. explained as the decreased dust opacity, too low to cause asymmetry in IR.
Shore et al. (2018) estimated the optical depth of dust, even after day 650. This value is too large because the light curve almost recovered on day 140 (thick solid cyan line in Figure 11. If is as large as , the light curve should be fainter by mag. The complete recovery to the overall universal decline law may support our results that the absorption of had disappeared at least until day 140.
6.5 Overall decline trends of band
The mag light curve in Figure 11 follows well the light curve. This is a remarked contrast with the light curve that brightens after the dust blackout, because band is heavily contributed by strong emission lines such as [O III] lines. This means that the band is less contributed by strong emission lines. A close look at the light curve shows a small bump on day 35 - 90, which is due to a blueward tail of dust emission (e.g., Skopal et al., 2014). Also, the lack of 0.4 mag dip on day 70 - 100 compared with the light curve could be due to contribution of a tail of dust emission. We clearly show that the overall light curve of V339 Del is essentially emission line-free and represents continuum flux like the light curve.
We plot the shell emission light curve (thin red line) in Figure 11, which is the same as in Figure 10 but shifted down by 1.5 mag to fit with the light curve in the later phase. We regard that this line corresponds to the free-free emission for band, i.e., Equation (19) with , where is the coefficient for free-free emission. Both the and light curves show a rapid mag drop between day 50 and 70, and then, again, follow the universal decline trend of . Before day 80, the dominant continuum flux is the free-free flux from the winds (FF+BB: thin solid black line), but is replaced with the free-free flux from the shocked shell (shell: thin solid red line) after day 80. The shell emission also follows the trend of after day 80. Both the and light curves did not recover like the band. This clearly shows that the continuum fluxes of V339 Del are not heavily absorbed by dust. The mag drops in the and bands are caused by the drop (decrease) in their free-free fluxes of winds.
To summarize, with no contribution of [O III] lines, the light curve behaves similarly to the and light curves because the and bands represent emission line-free (continuum) fluxes. The 1.5 mag drop itself in the magnitude is caused by a sharp drop in the wind mass-loss rate as calculated with Equation (1) and plotted in Figure 5.
6.6 Summary: coexistence of X-ray and dust shell
From detailed analysis of , , [O III], , and (and ) light curves together with our theoretical light curves, we may conclude that an optically-thin dust shell forms behind the shock until about 55 days ( peak) after the outburst. The drop in the band during day 55 – 140 is estimated to be as deep as about 1.5 mag, which is caused by the substantial suppression of strong emission lines such as [O III] 4959, 5007 Å (e.g., Munari et al., 2015). This drop correspond to % of the shell emission ([O III]), which is converted to, and reemitted in, the near-IR (or ) energy bands.
From the very shallow dust blackout in the magnitude (FF+BB and shell), we estimated the optical depth of the dust shell to be –0.4. This depth of is also confirmed in the UV 3555Å band (Shore et al., 2018). Because the dust shell is optically thin, continuum radiation in the band can mostly penetrate and also supersoft X-ray photons are little absorbed. This is the reason why we have large X-ray flux during the dust dip in the light curve.
After the SSS phase started on day 72, dust grains could be destructed (e.g., shattering process due to electrostatic stress after the dust is exposed to X-ray radiation: Evans et al., 2017), but we have found no evidence for substantial dust destruction in our light curve analysis. Thus, the coexistence of dust and X-ray radiation simply means that we see the X-rays through an optically-thin dust shell.
7 Conclusions
Our main results are summarized as follows:
-
1.
We present photometry of V339 Del at Osaka Kyoiku University from JD 2,456,522.0 to JD 2,457,382.0 for about 860 days.
-
2.
We obtain the distance modulus in the band to be , applying the time-stretching method to the light curve of V339 Del. The distance is kpc for the reddening of , which is consistent with the Gaia eDR3 distance of kpc (Bailer-Jones et al., 2021).
-
3.
Our WD (Ne2) model well reproduces the light curves with , as well as the supersoft X-ray (0.3-2.0 keV). Here our model light curve consists of free-free emission from the ejecta just outside the photosphere plus blackbody emission from the WD photosphere (FF+BB). The X-ray light curve is calculated with blackbody emission of the photosphere.
-
4.
The position of V339 Del in the maximum magnitude versus rate of decline (MMRD) diagrams calculated by Hachisu et al. (2020) gives a set of the WD mass , mass-accretion rate yr-1, and recurrence time 2,000 yr. These values are consistent with our WD (Ne2) model. Thus, we are able to easily estimate the nova properties from these MMRD diagrams.
-
5.
The expansion parallax method cannot be applied to a nova fireball stage, simply because, once winds begin to blow, winds leave the pseudo-photosphere behind, and the expansion rate of the pseudo-photosphere (280 km s-1) is much smaller than the velocities of ejecta (613 or 505 km s-1). For example, the distance estimate based on the expansion parallax method gave a distance of kpc (Schaefer et al., 2014; Gehrz et al., 2015), which is much larger than our estimate of kpc.
-
6.
We show that, based on our WD (Ne2) model, a strong shock arises just after the optical maximum and it moves outward far outside the nova photosphere with the shock velocity of 500–600 km s-1.
- 7.
-
8.
The GeV gamma-ray flux observed with the Fermi/LAT decays twice slower than the optical flux. This tendency can be explained based on our optically-thick wind theory; the free-free emission flux depends on , while the shocked energy generation rate depends roughly on .
-
9.
After the strong shock arises just after the optical maximum, a hot radiation field accelerates emission of H in the shocked shell. The temporal variation of the H band flux decays following the shocked shell emission of our model. Thus, the dominant source of the H band is the shocked shell, at least, from the optical maximum to the dust blackout.
-
10.
A dust shell begins to form just behind the shock about 35 days after the outburst. The optical depth of the dust shell can be estimated from the 0.4 mag dip in the light curve during day 60-100. The dust absorption is as small as –0.4 in the continuum flux. Both the FF+BB emissions and supersoft X-rays are hardly absorbed. This is the reason why the dust emission and supersoft X-rays coexist.
-
11.
The 1.5 mag drop in the light curve is caused not by dust absorption but by a rapid decrease in the free-free flux from the nova wind. This 1.5 mag drop in continuum flux is confirmed in the as well as bands.
-
12.
Dust forms in a cool and dense shell just behind the radiative shock (Derdzinski et al., 2017). Such a cool environment in the dust shell substantially suppresses excitation of strong emission lines [O III] in the very early nebular phase, which prevents recovery from a 1.5 mag drop on day 65.
-
13.
The recovery from the 1.5 mag drop in the light curve is caused by the delayed increase in the [O III] line flux. This is confirmed by the fact that the band is essentially line-free (continuum) and the light curve does not show any recoveries from the 1.5 mag drop as well as the light curve.
-
14.
We have found no clear evidence for substantial dust destruction in our light curve analysis. The coexistence of dust and X-ray radiation simply means that we see X-rays through an optically-thin dust shell.
The data of V339 Del observed at OKU will be shared on reasonable request to the authors.
References
- Ackermann et al. (2014) Ackermann, M., Ajello, M., Albert, A., et al. 2014, Science, 345, 554, 10.1126/science.1253947
- Aydi et al. (2020) Aydi, E., Chomiuk, L., Izzo, L., et al. 2020, ApJ, 905, 62, 10.3847/1538-4357/abc3bb
- Bailey et al. (2014) Bailey, J. E., Nagayama, T., Loisel, G. P., et al. 2014, Nature, 516, 56, 10.1038/nature14048
- Bailer-Jones et al. (2021) Bailer-Jones, C. A. L., Rybizki, J., Fouesneau, M., Demleitner, M., & Andrae, R. 2021, AJ, 161, 147, 10.3847/1538-3881/abd806
- Bath (1978) Bath, G. T. 1978, MNRAS, 182, 35, 10.1093/mnras/182.1.35
- Beardmore et al. (2013) Beardmore, A. P., Osborne, J. P., & Page, K. L. 2013, ATel, 5573, 1
- Burlak et al. (2015) Burlak, M. A., Esipov, V. F., Komissarova, G. V., et al. 2015, Baltic Astronomy, 24, 109, 10.1515/astro-2017-0209
- Chochol et al. (2014) Chochol, D., Shugarov, S., Pribulla, T., Volkov, I. 2014, CoSka, 43, 330
- Chomiuk et al. (2021) Chomiuk, L., Metzger, B. D., & Shen, K. J. 2021, Annual Review of Astronomy and Astrophysics, 59, 48, 10.1146/annurev-astro-112420-114502
- Darnley et al. (2013) Darnley, M. J., Bode, M. F., Smith, R. J., & Evans, A. 2013, ATel, 5279, 1
- De Gennaro Aquino et al. (2015) De Gennaro Aquino, I., Schröder, K. -P., Mittag, M., et al. 2015, A&A, 581, A134, 10.1051/0004-6361/201525810
- De Gennaro Aquino et al. (2016) De Gennaro Aquino, I., Schröder, K. -P., Mittag, M., et al. 2016, A&A, 589, C4, 10.1051/0004-6361/201525810e, (Corrigendum)
- Derdzinski et al. (2017) Derdzinski, A. M., Metzger, B. D., & Lazzati, D. 2017, MNRAS, 469, 1314, 10.1093/mnras/stx829
- della Valle & Izzo (2020) della Valle, M., & Izzo, L. 2020, The Astronomy and Astrophysics Review, 28, 3, 10.1007/s00159-020-0124-6
- Ennis et al. (1977) Ennis, D., Becklin, E. E., Beckwith, S., et al. 1977, ApJ, 214, 478, 10.1086/155273
- Evans et al. (2009) Evans, P. A., Beardmore, A. P., Page, K. L., et al. 2009, MNRAS, 397, 1177, 10.1111/j.1365-2966.2009.14913.x
- Evans et al. (2017) Evans, A., Banerjee, D. P. K., Gehrz, R. D., et al. 2017, MNRAS, 466, 4221, 10.1093/mnras/stw3334
- Friedjung (1987) Friedjung, M. 1987, A&A, 180, 155
- Gallagher et al. (1980) Gallagher, J. S., Kaler, J. B., Olson, E. C., Hartkopf, W. I., & Hunter, D. A. 1980, PASP, 92, 46, 10.1086/130612
- Gehrz & Ney (1987) Gehrz, R. D., & Ney, E. P., 1987, PNAS(USA), 84, 6961, 10.1073/pnas.84.20.6961
- Gehrz et al. (2015) Gehrz, R. D., Evans, A., Helton, L. A., et al. 2015, ApJ, 812, 132, 10.1088/0004-637X/812/2/132
- Hachisu & Kato (2006) Hachisu, I., & Kato, M. 2006, ApJS, 167, 59, 10.1086/508063
- Hachisu & Kato (2010) Hachisu, I., & Kato, M. 2010, ApJ, 709, 680, 10.1088/0004-637X/709/2/680
- Hachisu & Kato (2015) Hachisu, I., & Kato, M. 2015, ApJ, 798, 76, 10.1088/0004-637X/798/2/76
- Hachisu & Kato (2016a) Hachisu, I., & Kato, M. 2016a, ApJ, 816, 26, 10.3847/0004-637X/816/1/26
- Hachisu & Kato (2016b) Hachisu, I., & Kato, M. 2016b, ApJS, 223, 21, 10.3847/0067-0049/223/2/21
- Hachisu & Kato (2018a) Hachisu, I., & Kato, M. 2018a, ApJ, 858, 108, 10.3847/1538-4357/aabee0
- Hachisu & Kato (2021) Hachisu, I., & Kato, M. 2021, ApJS, 253, 27, 10.3847/1538-4365/abd31e
- Hachisu & Kato (2022) Hachisu, I., & Kato, M. 2022, ApJ, 939, 1, 10.3847/1538-4357/ac9475
- Hachisu & Kato (2023) Hachisu, I., & Kato, M. 2023, ApJ, 953, 78, 10.3847/1538-4357/acdfd3
- Hachisu et al. (2000) Hachisu, I., Kato, M., Kato, T., & Matsumoto, K. 2000, ApJ, 528, L97, 10.1086/312684
- Hachisu et al. (2006) Hachisu, I., Kato, M., Kiyota, S., et al. 2006, ApJ, 651, L141, 10.1086/509615
- Hachisu et al. (2020) Hachisu, I., Saio, H., Kato, M., Henze, M., & Shafter, A. W. 2020, ApJ, 902, 91, 10.3847/1538-4357/abb5fa
- Hays et al. (2013) Hays, E., Cheung, T., & Ciprini, S. 2013, ATel, 5302, 1
- Martin et al. (2018) Martin, P., Dubus, G., Jean, P., Tatischeff, V., & Dosne, C. 2018, A&A, 612, A38, 10.1051/0004-6361/201731692
- Iglesias & Rogers (1996) Iglesias, C. A., & Rogers, F. J. 1996, ApJ, 464, 943, 10.1086/177381
- Kato & Hachisu (1994) Kato, M., & Hachisu, I., 1994, ApJ, 437, 802, 10.1086/175041
- Kato et al. (2021) Kato, M., Saio, H., & Hachisu, I., 2021, PASJ, 73, 1137, 10.1093/pasj/psab064
- Kato et al. (2022a) Kato, M., Saio, H., & Hachisu, I. 2022a, PASJ, 74, 1005, 10.1093/pasj/psac051
- Kato et al. (2022b) Kato, M., Saio, H., & Hachisu, I. 2022b, ApJ, 935, L15, 10.3847/2041-8213/ac85c1
- Kato et al. (2022c) Kato, M., Saio, H., & Hachisu, I. 2022c, RNAAS, 6, 258, 10.3847/2515-5172/aca8af
- Kawakita et al. (2019) Kawakita, H., Shinnaka, Y., Arai, A., Arasaki, T., & Ikeda, Y. 2019, ApJ, 872, 120, 10.3847/1538-4357/aaff68
- König et al. (2022) König, O., Wilms, J., Arcodia, R., et al. 2022, Nature, 605, 248, 10.1038/s41586-022-04635-y
- Li et al. (2017) Li, K.-L., Metzger, B. D., Chomiuk, L., et al. 2017, Nature Astronomy, 1, 697, 10.1038/s41550-017-0222-1
- Liszt (2014) Liszt, H. S. 2014, ApJ, 780, 10, 10.1088/0004-637X/780/1/10
- Lockwood & Millis (1976) Lockwood, G. W., & Millis, R. L. 1976, PASP, 88, 235, 10.1086/129935
- McLaughlin (1942) McLaughlin, D. B. 1942, ApJ, 95, 428, 10.1086/144414
- Metzger et al. (2014) Metzger, B. D., Hascoët, R., Vurm, I., et al. 2014, MNRAS, 442, 713, 10.1093.mnras.stu844
- Metzger et al. (2015) Metzger, B. D., Finzell, T., Vurm, I., et al. 2015, MNRAS, 450, 2739, 10.1093/mnras/stv742
- Milla & Paerels (2023) Milla, J., & Paerels, F. 2023, ApJ, 943, 31, 10.3847/1538-4357/aca966
- Mukai & Ishida (2001) Mukai, K., & Ishida, M. 2001, ApJ, 551, 1024, 10.1086/320220
- Munari et al. (2013a) Munari, U., Dallaporta, S., Castellani, F., et al. 2013a, MNRAS, 435, 771, 10.1093/mnras/stt1340
- Munari et al. (2013c) Munari, U., Dallaporta, S., & Cherini, G. 2013c, ATel, 5533, 1
- Munari et al. (2013d) Munari, U., Henden, A., Dallaporta, S., & Cherini, G. 2013d, IBVS, 6080, 1
- Munari et al. (2015) Munari, U., Maitan, A., Moretti, S., Tomaselli, S. 2015, NewA, 40, 28, 10.1016/j.newast.2015.03.008
- Munari et al. (2013b) Munari, U., Valisa, P., Milani, A., & Cetrulo, G. 2013b, ATel, 5297, 1
- Munari & Zwitter (1997) Munari, U., & Zwitter, T. 1997, A&A, 318, 269
- Nakano & Samus (2013) Nakano, S., & Samus, N. N. 2013, IAU Circ., 9258, 1
- Nelson et al. (2013) Nelson, T., Mukai, K., Chomiuk, L., & Sokoloski, J. 2013, ATel, 5593, 1
- Ness et al. (2013) Ness, J.-U., Schwarz, G., Page, K. L., et al. 2013, ATel, 5626, 1
- Osborne et al. (2011) Osborne, J. P., Page, K. L., Beardmore, A. P., et al. 2011, ApJ, 727, 124, 10.1088/0004-637X/727/2/124
- Osborne et al. (2013) Osborne, J. P., Page, K., & Beardmore, A., et al. 2013, ATel, 5505, 1
- Page et al. (2013) Page, K. L., Osborne, J. P., Kuin, N. P. M., et al. 2013, ATel, 5470, 1
- Page & Beardmore (2013) Page, K. L., & Beardmore, A. P. 2013, The Astronomer’s Telegram, 5429, 1
- Page et al. (2014) Page, K. L., Kuin, N. P., Osborne, J. P., et al. 2014, ATel, 5967, 1
- Rauch (2003) Rauch, T. 2003, A&A, 403, 709, 10.1051/0004-6361:20030412
- Rudy et al. (2013) Rudy, R. J., Laag, E. A., Crawford, K. B., et al. 2013, CBET, 3650, 1
- Ruggles & Bath (1979) Ruggles, C. L. N., & Bath, G. T. 1979, A&A, 80, 97
- Sala & Hernanz (2005) Sala, G., & Hernanz, M. 2005, A&A, 439, 1057, 10.1051/0004-6361:20042622
- Schaefer (2018) Schaefer, B. E. 2018, MNRAS, 481, 3033, 10.1093/mnras/sty2388
- Schaefer (2022a) Schaefer, B.E., 2022a,MNRAS, 517, 3640, 10.1093/mnras/stac2089
- Schaefer (2022b) Schaefer, B. E. 2022b, MNRAS, 517, 6150, 10.1093/mnras/stac2900
- Schaefer & Ringwald (1995) Schaefer, B. E., & Ringwald, F. A. 1995, ApJ, 447, L45, 10.1086/309550
- Schaefer et al. (2014) Schaefer, G. H., Brummelaar, T. T., Gies, D. R., et al. 2014, Nature, 515, 234, 10.1038/nature13834
- Schwarz et al. (2011) Schwarz, G. J., Ness, J.-U., Osborne, J. P., et al. 2011, ApJS, 197, 31, 10.1088/0067-0049/197/2/31
- Selvelli & Gilmozzi (2019) Selvelli, P., & Gilmozzi, R. 2019, A&A, 622, A186, 10.1051/0004-6361/201834238
- Shenavrin et al. (2013) Shenavrin, V. I., Taranova, O. G., & Tatarnikov, A. M. 2013, ATel, 5431, 1
- Shore (2013) Shore, S. N. 2013, ATel, 5410, 1
- Shore et al. (2018) Shore, S. N., Kuin, N. P., Mason, E., & De Gennaro Aquino, I. 2018, A&A, 619, A104, 10.1051/0004-6361/201833204
- Shore et al. (2016) Shore, S. N., Mason, E., Schwarz, G. J., et al. 2016, A&A, 590, A123, 10.1051/0004-6361/201527856
- Shore et al. (2013) Shore, S. N., Skoda, P., & Rutsch, P. 2013, ATel, 5282, 1
- Shore et al. (2013) Shore, S. N., Schwarz, G. J., Alton, J., et al. 2013, ATel, 5409, 1
- Skopal et al. (2014) Skopal, A., Drechsel, H., Tarasova, T., et al. 2014, A&A, 569, A112, 10.1051/0004-6361/201424284
- Sokolovsky et al. (2022) Sokolovsky, K. V., Li, K.-L., & Lopes de Oliveira, R. 2022, MNRAS, 514, 2239, 10.1093/mnras/stac1440
- Tajitsu et al. (2015) Tajitsu, A., Sadakane, K., Naito, H., et al. 2015, Nature, 518, 381, 10.1038/nature14161
- Taranova et al. (2014) Taranova, O. G., Tatarnikov, A. M., Shenavrin, V. I., & Tatarnikova, A. A. 2014, Astronomy Letters, 40, 120, 10.1134/S1063773714030086
- Tomov et al. (2013) Tomov, T., Ilkiewicz, K., Swierczynski, E., Belcheva, M., & Dimitrov, D. 2013, ATel, 5288, 1
- Vanlandingham et al. (2007) Vanlandingham, K. M., Schwarz, G., Starrfield, S., Woodward, C., Wagner, M., Ness, J., Helton, A. 2007, BAAS, 38, 99
- Walter et al. (2012) Walter, F. M., Battisti, A., Towers, S. E., Bond, H. E., & Stringfellow, G. S. 2012, PASP, 124, 1057, 10.1086/668404
- Williams (1992) Williams, R. E. 1992, AJ, 104, 725, 10.1086/116268
- Wolf et al. (2013) Wolf, W. M., Bildsten, L., Brooks, J., et al. 2013, ApJ, 777, 136, 10.1088/0004-637X/777/2/136 (Erratum: 2014, ApJ, 782, 117, 10.1088/0004-637X/782/2/117)