Institut d’astrophysique de Paris, CNRS, UMR 7095, Sorbonne Université, 98 bis bd Arago, 75014 Paris, France.
Observatoire de Haute-Provence, St Michel l’Observatoire, France.
Laboratório Nacional de Astrofisica, Rua Estados Unidos 154, 37504-364, Itajubá - MG, Brazil
Instituto de Astrofísica e Ciências do Espaço, Universidade do Porto, CAUP, Rua das Estrelas, 4150-762 Porto, Portugal
Laboratoire d’astrophysique de Marseille, Univ. de Provence, UMR6110 CNRS, 38 r. F. Joliot Curie, 13388 Marseille cedex 13, France
Univ. Grenoble Alpes, CNRS, IPAG, 414 rue de la Piscine, 38400 St-Martin d’Hères, France
INAF - Osservatorio Astrofisico di Catania, Via S. Sofia 78, 95123 Catania, Italy
Acton Sky Portal private observatory, Acton, MA, USA
Center for Astrophysics | Harvard & Smithsonian, 60 Garden Street, Cambridge, MA 02138, USA
SETI Institute/NASA Ames Research Center, Moffett Field, CA 94035, USA
IPAC-NASA Exoplanet Science Institute, 770 S. Wilson Avenue, Pasadena, CA 91106, USA
Center for Astrophysics | Harvard & Smithsonian, 60 Garden Street, Cambridge, MA 02138, USA
Astrophysics Group, University of Exeter, Exeter EX4 2QL, UK
Crow Observatory, Portalegre, Portugal
NASA Ames Research Center, Moffett Field, CA 94035, USA
Bryant Space Science Center, Department of Astronomy, University of Florida, Gainesville, FL 32611, USA
Department of Physics and Kavli Institute for Astrophysics and Space Research, Massachusetts Institute of Technology, Cambridge, MA 02139, USA
LESIA, Observatoire de Paris, Université PSL, CNRS, Sorbonne Université, Université Paris Cité, 5 place Jules Janssen, 92195 Meudon, France
Wild Boar Remote Observatory, San Casciano in val di Pesa, Firenze, Italy
Gruppo Astrofili Catanesi, Catania, Italy
Waffelow Creek Observatory, 10780 FM 1878, Nacogdoches, TX 75961, USA
Université de Toulouse, CNRS, IRAP, 14 avenue Belin, 31400 Toulouse, France
Department of Astrophysical Sciences, Princeton University, Princeton, NJ 08544, USA
Departamento de Física e Astronomia, Faculdade de Ciências, Universidade do Porto, Rua do Campo Alegre, 4169-007 Porto, Portugal
Department of Physics and Astronomy, Vanderbilt University, Nashville, TN 37235, USA
TOI-1199 b and TOI-1273 b: Two new transiting hot Saturns detected and characterized with SOPHIE and TESS
We report the characterization of two planet candidates detected by the Transiting Exoplanet Survey Satellite (TESS), TOI-1199 b and TOI-1273 b, with periods of 3.7 and 4.6 days, respectively. Follow-up observations for both targets, which include several ground-based light curves, confirmed the transit events. High-precision radial velocities from the SOPHIE spectrograph revealed signals at the expected frequencies and phases of the transiting candidates and allowed mass determinations with a precision of 8.4% and 6.7% for TOI-1199 b and TOI-1273 b, respectively. The planetary and orbital parameters were derived from a joint analysis of the radial velocities and photometric data. We find that the planets have masses of 0.2390.020 MJ and 0.2220.015 MJ and radii of 0.9380.025 RJ and 0.990.22 RJ, respectively. The grazing transit of TOI-1273 b translates to a larger uncertainty in its radius, and hence also in its bulk density, compared to TOI-1199 b. The inferred bulk densities of 0.3580.041 g cm-3 and 0.280.11 g cm-3 are among the lowest known for exoplanets in this mass range, which, considering the brightness of the host stars (11 mag), render them particularly amenable to atmospheric characterization via the transit spectroscopy technique. The better constraints on the parameters of TOI-1199 b provide a transmission spectroscopy metric of 134 17, making it the better suited of the two planets for atmospheric studies.
Key Words.:
planets and satellites: detection – techniques: photometric – techniques: radial velocities – planets and satellites: gaseous planets – stars: planetary systems1 Introduction
The search for exoplanets has benefited greatly from space-based transit surveys: many thousands of planet-hosting candidates have been found by looking for small periodic dips in the brightness of stars. Nevertheless, additional observations are needed to discard false positives and characterize the systems. The Transiting Exoplanet Survey Satellite (TESS) was launched in September 2018 with the objective of detecting exoplanets around bright nearby stars by monitoring the flux variations of hundreds of thousands of stars in the solar neighborhood (Ricker et al. 2015), covering 85% of the sky. One key aspect of the mission is that its targets are relatively bright, making them amenable to follow up with precise radial velocity (RV) observations from the ground and potential atmospheric studies with the James Webb Space Telescope and other facilities. Since TESS observes each sector for 27 days, the planets found so far mostly have short periods (¡ 30 days) but a wide range of masses and radii. Therefore, RV surveys are important not only for determining masses but also for providing a way to detect and study long-period systems.
At the time of writing, more than 400 planet candidates from TESS have been confirmed and there are thousands still awaiting their nature to be determined111https://exoplanetarchive.ipac.caltech.edu/. A community effort is being made through the TESS Follow-up Observing Program (TFOP; Collins et al. 2018) to efficiently carry out detailed analyses of candidates with subsequent observations from the ground.
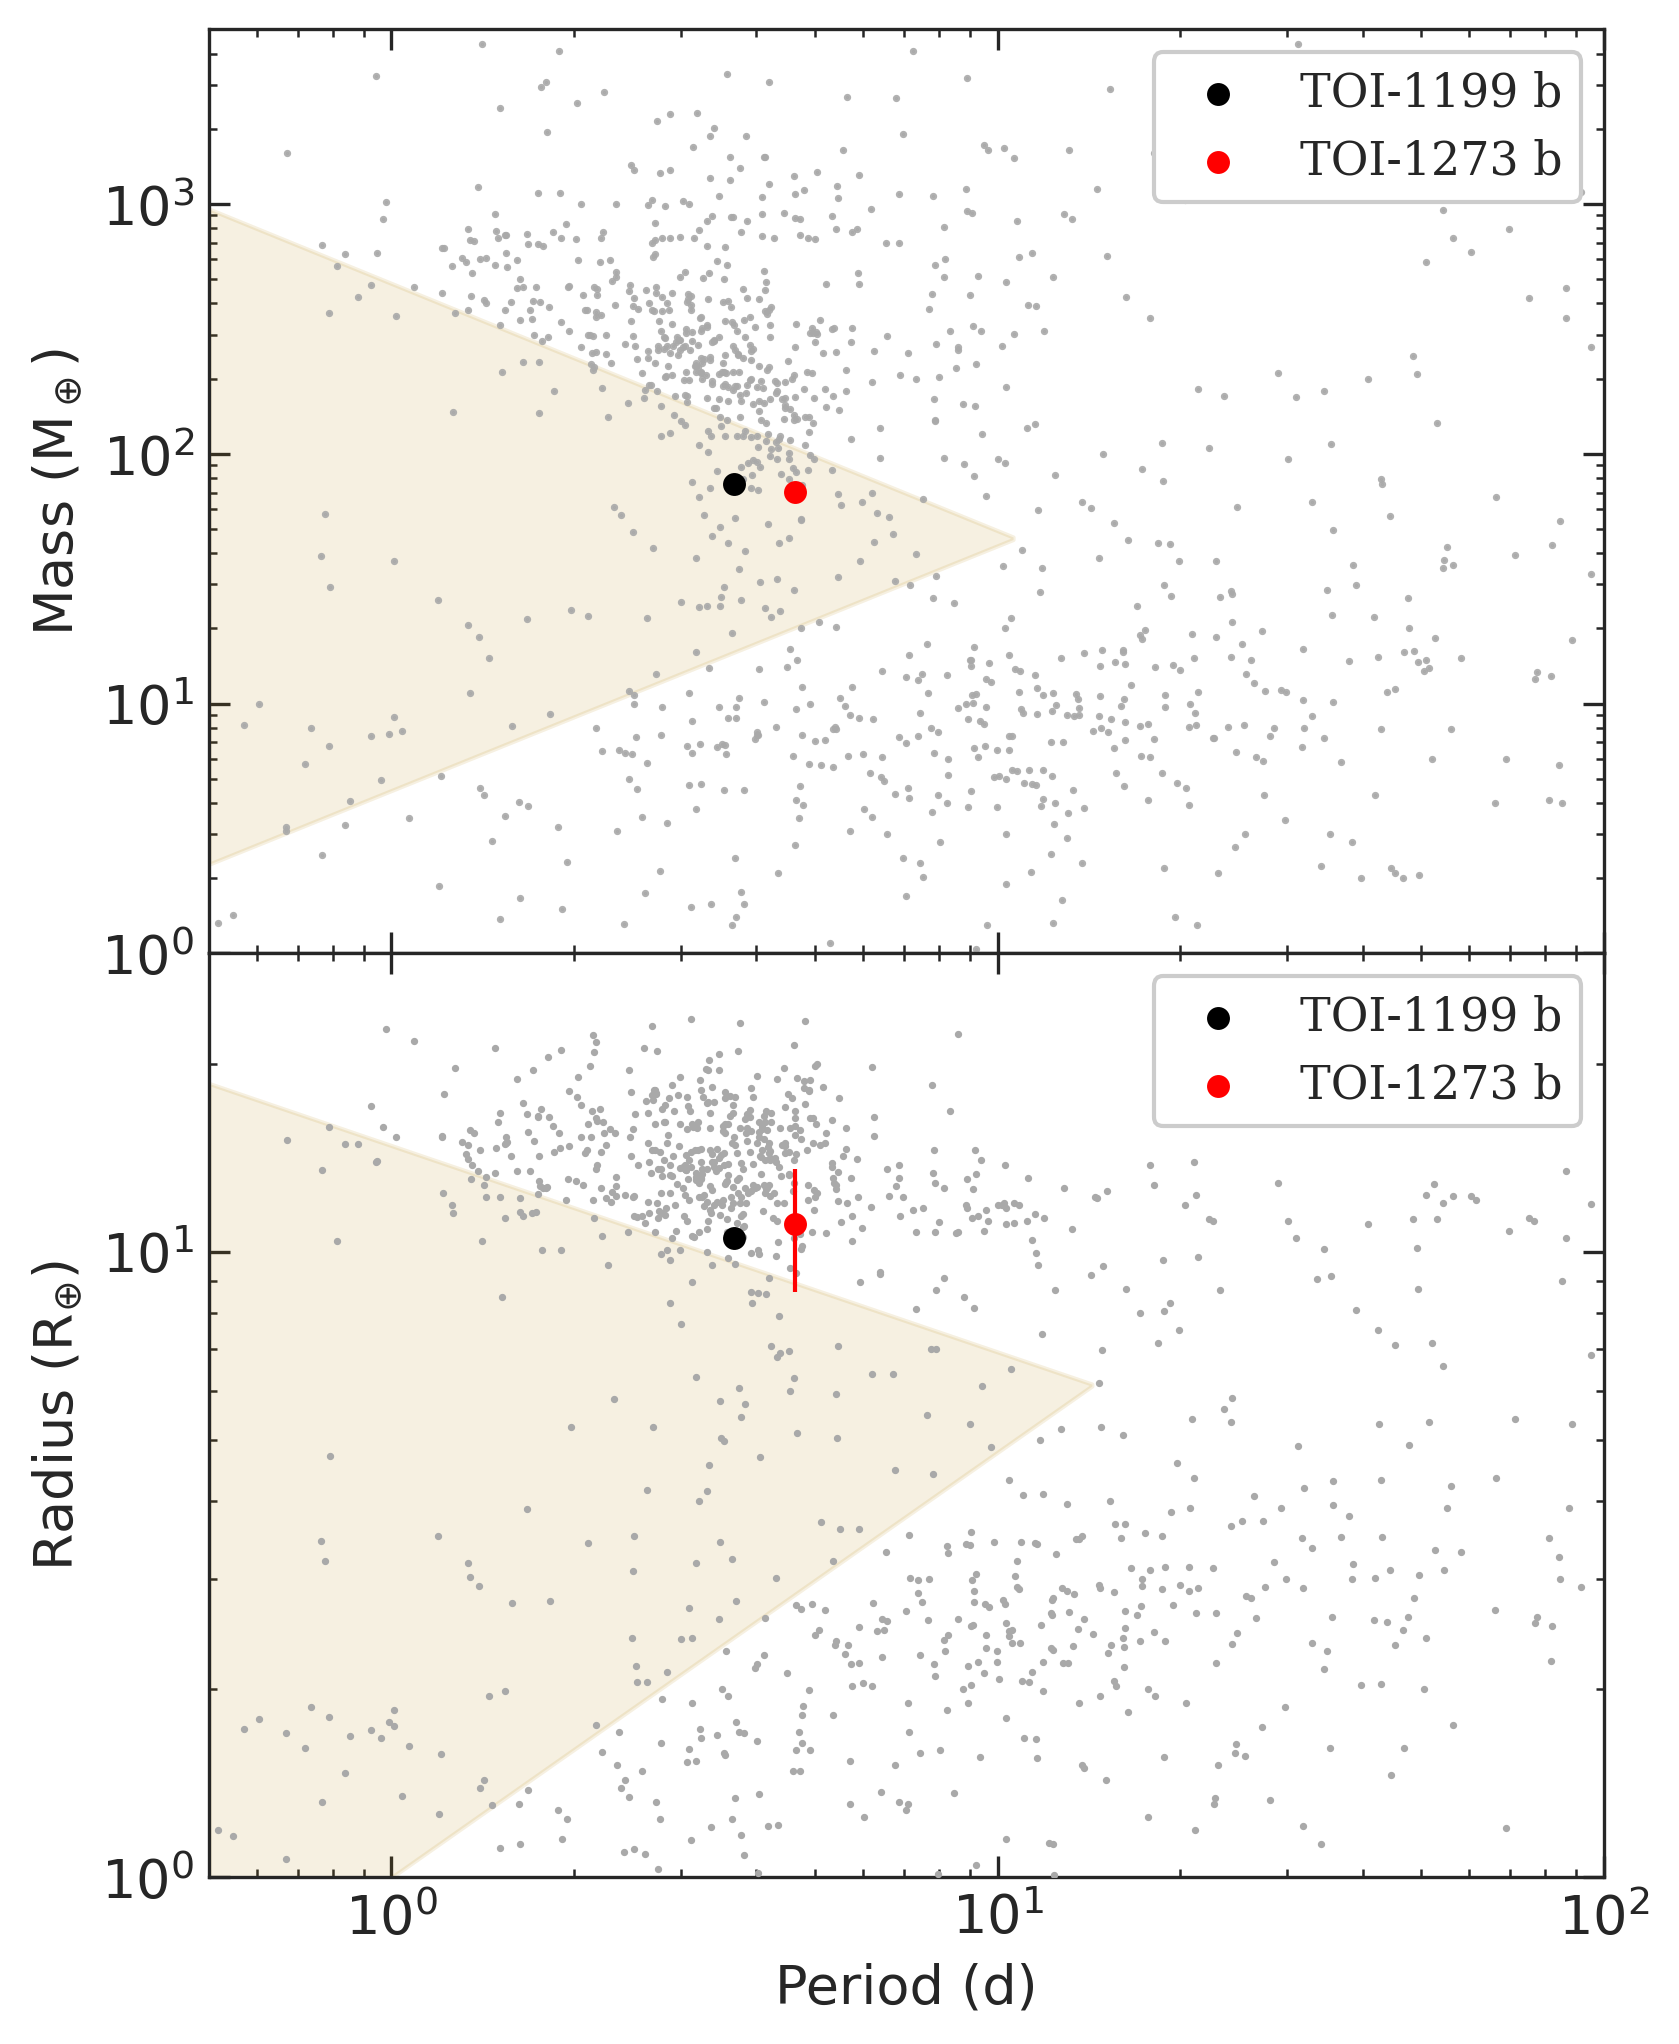
As the population of planets with known masses and radii increased, a deficiency of sub-Jovian planets with P ¡ 10 days became evident. This phenomenon, known as the Neptunian or sub-Jovian desert (Mazeh et al. 2016), is seen as approximately triangular regions in the radius–period and mass–period parameter spaces (see Fig. 12) and is not due to observational biases. The study of planets within the desert or at its boundaries can offer clues as to the different formation and evolution mechanisms at play.
In addition to allowing mass and radius determinations, each transiting planet found around a bright star opens up numerous characterization possibilities. One can sometimes obtain emission and transmission spectra (Charbonneau et al. 2002, 2005), measure the spin-orbit obliquity (Triaud 2018; Jenkins et al. 2010a), and even probe the atmospheric structure by analyzing phase curves (Parmentier & Crossfield 2018).
In this work we performed a detailed analysis of two stars from the TESS input catalog that had been identified as planet host candidates or TESS objects of interest (TOIs), namely TOI-1199 (TIC 99869022) and TOI-1273 (TIC 445859771). We combined photometric data from TESS, KeplerCam, and MusCAT2 (see Sect. 2.2) with precise RV measurements from the SOPHIE spectrograph (see Sect. 2.3) to determine the presence of the planets and characterize their properties, including measurements of their bulk densities.
2 Observations

2.1 TESS photometry
TOI-1199 was observed with TESS with 30-minute cadence during sectors 14 and 21 and with 2-minute cadence during sectors 41 and 48, totaling around 111 days between 2020 and 2022 and obtaining 23 full transits. TOI-1273 was monitored with 2-minute cadences in sectors 15, 22, 23, 48, and 50, and with 30-minute cadence in sector 16, summing up to around 168 days between August 2019 and April 2022 with 32 transit events, two of which were not complete because they fell at the beginning or end of a sector.
The transit signature of TOI-1199.01 was detected by the Quick Look Pipeline (QLP; Huang et al. 2020a, b), which performed a suite of diagnostic tests favoring the planetary nature of the signal and fitted a limb-darkened transit model. The TESS Science Office (TSO) reviewed this information and issued an alert on 27 August 2019 (Guerrero et al. 2021). The TESS Science Processing Operations Center (SPOC) pipeline subsequently detected the same signature in searches of 2-min data in sectors 41 and 48 with a noise-compensating matched filter (Jenkins 2002; Jenkins et al. 2010b, 2020), and the signature was fitted with a limb-darkened transit model (Li et al. 2019) and passed all the diagnostic tests performed (Twicken et al. 2018), including the difference image centroiding test, which located TOI-1199 to within 1.2 2.8 arcsec. The transit signature of TOI-1273.01 was detected by both the QLP and SPOC pipelines in transit searches of sector 15 and alerted by the TSO on 17 October 2019. The difference image centroiding test performed by the SPOC for sector 15 located the host star within 0.5880 2.5565 arcsec of the source of the transit, and subsequently to within 0.3240 2.4923 arcsec based on an analysis of sectors 15, 22, 23, 48 & 50.
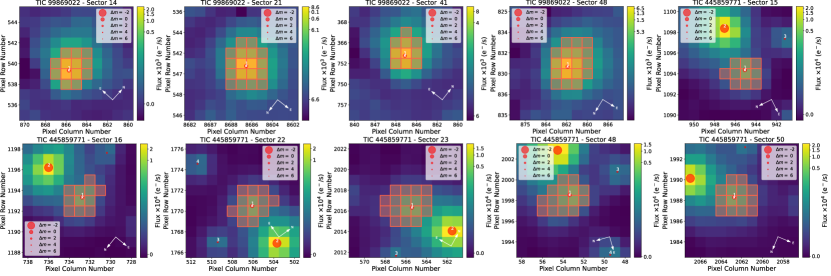
We downloaded from the Mikulski Archive for Space Telescopes (MAST222https://mast.stsci.edu/) the 2-minute cadence light curves computed by the TESS SPOC pipeline (Jenkins et al. 2016) and the 30-minute cadence light curves, which have the same preprocessing but are derived from TESS full frame images by Caldwell et al. (2020). We then used the Lightkurve python package (Lightkurve Collaboration et al. 2018) to remove all NaNs and 5 outliers. We used the column pdcsap_flux as the flux, which is the light curve from the Presearch Data Conditioning Simple Aperture Photometry (PDCSAP) and is corrected for crowding contamination, instrumental trends and noise (Stumpe et al. 2012, 2014; Smith et al. 2012). The data for both targets are presented in Fig. 1, where the flux is shown in parts per thousand (‰) and the transits can be seen at plain sight. The depths and durations of the transits reported by TESS-SPOC are 0.43% and 2.10.2 h for TOI-1199.01 and 0.48% and 1.40.2 h for TOI-1273.01. Contamination ratios of 0.047% for TOI-1199 and 0.30% for TOI-1273 are also reported, where the larger value for TOI-1273 is most likely due to a close source as can be seen in the TESS target pixel file images shown in Fig. 2, which were made using tpfplotter333https://github.com/jlillo/tpfplotter (Aller et al. 2020).
Given the good quality of the PDCSAP light curves, no further detrending or contamination correction was deemed necessary and we did not include a dilution factor in the models. We ran a box least-squares analysis (Kovács et al. 2016) of the TESS time series, which recovered the periodic signals at 3.67 d for TOI-1199.01 and 4.63 d for TOI-1273.01. The phase-folded light curve of TOI-1273.01 reveals a well-defined V-shape transit (see Fig. 9), meaning that if this is product of a planetary transit, the transit must be close to grazing (i.e., the transit impact parameter is near 1).
2.2 Light curve follow-up
The TESS image scale is 21″ per pixel and photometric apertures typically extend out to roughly 1 arcmin, generally causing multiple stars to blend in the TESS aperture. While the SPOC pipeline tests already constrains the location of the source of the transit signature to within a pixel (see Sect. 2.1), to further confirm the true source of the TOI detections, we conducted ground-based photometric follow-up observations of the field around TOI-1199 and TOI-1273 as part of the TFOP444https://tess.mit.edu/followup Sub Group 1 (Collins 2019). We used the TESS Transit Finder, which is a customized version of the Tapir software package (Jensen 2013), to schedule our transit observations. The images were calibrated and differential photometric data were extracted using AstroImageJ (Collins et al. 2017), except as noted below. All light curve data are available on the EXOFOP-TESS website for both TOI-1199.01555https://exofop.ipac.caltech.edu/tess/target.php?id=99869022 and TOI-1273.01666https://exofop.ipac.caltech.edu/tess/target.php?id=445859771. A summary of all the photometry data is presented in Table 7.
| Date | Facility & Instrument | Transit coverage | Filter | Used in the model? |
|---|---|---|---|---|
| TOI-1199 | ||||
| 18 Jul 2019 | TESS 30-min | Full (4) | TESS | Yes |
| 21 Jan 2020 | TESS 30-min | Full (6) | TESS | Yes |
| 24 Jul 2021 | TESS 2-min | Full (8) | TESS | Yes |
| 28 Jan 2022 | TESS 2-min | Full (5) | TESS | Yes |
| 13 Feb 2021 | Fred Lawrence Whipple Observatory - KeplerCam | Full (1) | B, z’ | Yes |
| 13 Apr 2021 | Fred Lawrence Whipple Observatory - KeplerCam | Full (1) | B, z’ | Yes |
| 27 Apr 2021 | Carlos Sanchez Telescope - MusCAT2 | Egress | g’, r’, i’, z | No |
| 4 Feb 2020 | CROW Observatory | Full (1) | g’ | No |
| 4 Feb 2020 | Wild Boar Remote Observatory | Full (1) | Rc | No |
| 9 Dec 2020 | Waffelow Creek Observatory | Full (1) | g’ | No |
| TOI-1273 | ||||
| 15 Aug 2019 | TESS 2-min | Full (6) | TESS | Yes |
| 12 Sep 2019 | TESS 30-min | Full (4) | TESS | Yes |
| 19 Feb 2020 | TESS 2-min | Full (6) | TESS | Yes |
| 19 Mar 2020 | TESS 2-min | Full (5) | TESS | Yes |
| 28 Jan 2022 | TESS 2-min | Full (5) | TESS | Yes |
| 26 Mar 2022 | TESS 2-min | Full (4) | TESS | Yes |
| 13 Feb 2020 | Fred Lawrence Whipple Observatory - KeplerCam | Full (1) | B | Yes |
| 18 Feb 2020 | Carlos Sanchez Telescope - MusCAT2 | Ingress | g’, r’, i’, z | Yes |
| 21 Jan 2020 | Acton Sky Portal | Full (1) | r’ | No |
| 17 Feb 2020 | Catania Astrophysical Observatory | Partial | B | No |
2.2.1 Citizen scientist observations
We initially observed TOI-1199 using citizen scientists observatories. On 4 February 2020 we simultaneously observed a transit of TOI-1199.01 from the 0.36 m telescope at CROW observatory (Portalegre, Portugal) in Sloan g’ band and the 0.24 m telescope at Wild Boar Remote Observatory (San Casciano in val di pesa, Firenze, Italy) in Rc band and detected roughly 0.4% deep events on target using photometric apertures that exclude flux from the nearest known Gaia Data Release 3 (DR3) star 16 north of TOI-1199. We observed a second transit epoch with the 0.36 m telescope at Waffelow Creek Observatory (Nacogdoches, TX, USA) on 9 December 2020 in Sloan g’ band and again confirmed the event on target relative to known Gaia DR3 stars. We adjusted the follow-up ephemeris from these light curves to a slightly longer period, which allowed us to predict the transit timings for our later follow-up observations with a higher precision.
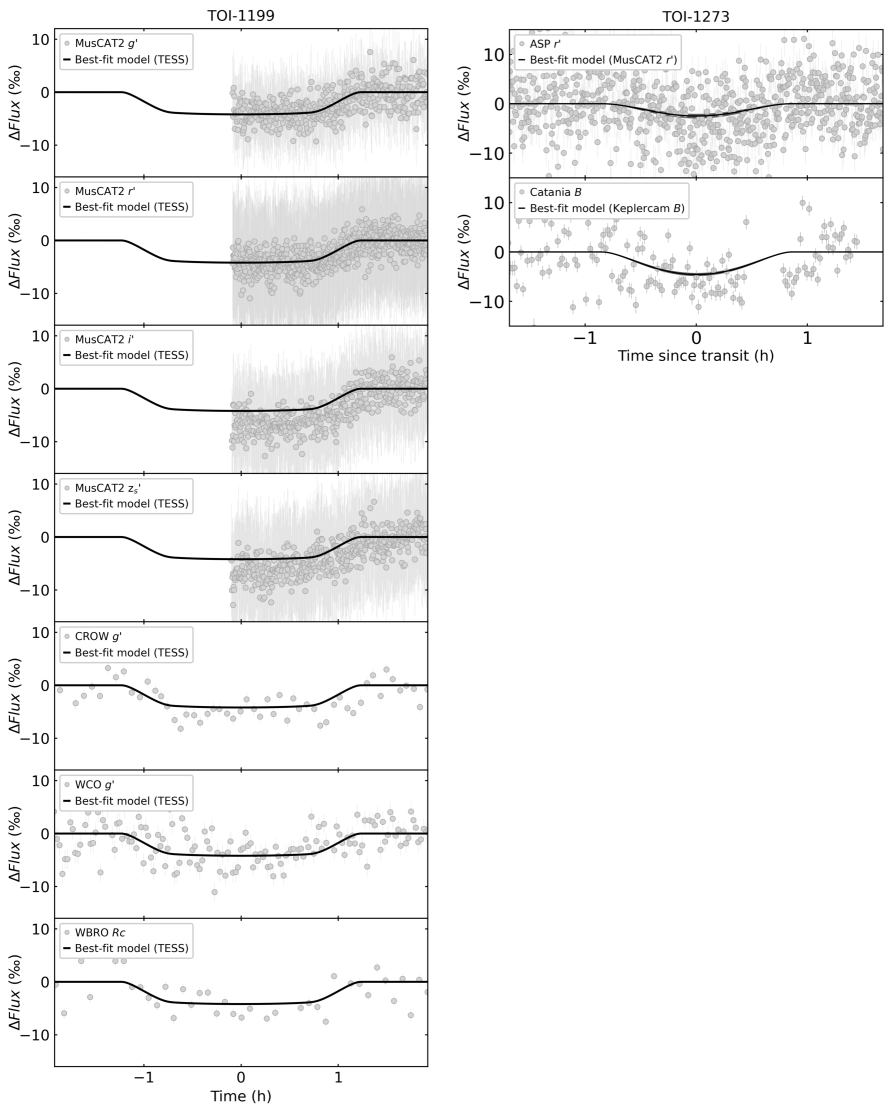
We observed a transit of TOI-1273.01 from the 0.36 m telescope at Acton Sky Portal (Acton, MA, USA) on 21 January 2020 in Sloan r’ band and detected a roughly 0.5-0.6% deep event on target relative to the nearest known Gaia DR3 star 13 northeast of TOI-1273. While this transit observations were important in the follow-up stage of the candidates, they were not included in the model fit. However, we show the best-fit model overplotted to the phased light curves in Appendix D.
2.2.2 MusCAT2
A transit event of TOI-1199.01 was observed on 27 April 2020 with MusCAT2 (Narita et al. 2019) mounted on the 1.5 m Carlos Sanchez Telescope at Teide Observatory, Spain. MusCAT2 is a multi-band imager equipped with four 10241024 pixels CCDs with a field of view of . It can obtain near-simultaneous images in g’, r’, i’, and z bands and it was designed for transiting planets follow-up observations.
During the observations the telescope was slightly defocused to avoid the saturation of the target and clouds were present for roughly half the transit. The exposure times were set to 15, 10, 15, and 15 s in g’, r’, i’, and z, respectively. The raw data were reduced by the MusCAT2 pipeline (Parviainen et al. 2019); the pipeline performs dark and flat field calibrations, aperture photometry and instrumental systematics correction. The single transit event was interrupted by clouds on the first half of the transit. We attempted to use the second half for the modeling, but there was additional systematic noise in the data. When we removed the transit from the fit, there was no significant impact on the derived parameters, so we decided not to include it in the final model. The data are shown in Appendix D with the best-fit model overplotted. TOI-1273 was observed on the night of 17 February 2020 with MusCAT2 in g’, r’, i’, and z bands. The data were acquired with the telescope slightly defocused and the exposure times were set to 8 s for all bands. The raw data were also calibrated and reduced with the MusCAT2 pipeline (Parviainen et al. 2019). Again, the transit captured was affected by clouds, this time on the second half. We used the first half of the transit on the four bands in the model. The data are shown in Fig. 9 along the best-fit model.
2.2.3 KeplerCam
We observed two full transits of TOI-1199.01 on 13 February 2021 and 13 April 2021 with the KeplerCam instrument on the 1.2 m telescope at the Fred Lawrence Whipple Observatory (FLWO) using alternating B band and Sloan z’ band filters, resulting in four light curves. The 40964096 Fairchild CCD 486 detector has an image scale of 0336 per pixel, resulting in a field of view. We also observed one full transit of TOI-1273.01 on 13 February 2020 with KeplerCam in B band. The KeplerCam light curves of both targets were used in the models and are shown on Fig. 8 and Fig. 9.
2.2.4 Catania Astrophysical Observatory
We observed one almost full transit of TOI-1273.01 (a part of the egress is missing) on 17 February 2020 in B band from the 0.91 m telescope at Catania Astrophysical Observatory (Catania, Italy) and detected a roughly 0.5-0.6 % event on target. The custom built 10241024 detector uses a KAF1001E CCD with an image scale of per pixel, resulting in a field of view. These data were not used in the model and is shown in Appendix D.
2.3 SOPHIE spectroscopy
Radial velocity measurements for the two targets were obtained from high-resolution spectroscopy with SOPHIE888http://www.obs-hp.fr/guide/sophie/sophie-eng.shtml, the fiber-fed echelle spectrograph mounted on the m telescope at the Haute-Provence Observatory in France (Perruchot et al. 2008; Bouchy et al. 2013). The spectrograph is fed from the Cassegrain focus through either one of two separate optical fiber sets, yielding two different spectral resolutions (high-efficiency and high-resolution modes). The spectrograph covers the wavelength range 3872-6943 Å. Using the high-resolution mode (R = 75000) we obtained 60 RVs for TOI-1199 between December 2019 and June 2022 with a mean uncertainty of 4.5 m s-1 , mean signal-to-noise ratio (S/N) of 30 and mean exposition time of 1333 s. We also obtained 60 RVs for TOI-1273, which have a mean uncertainty of 5.4 m s-1 , mean S/N 32, mean exposition time of 1500 s and were observed between February 2020 and July 2022.
The RVs were derived through the SOPHIE pipeline (Bouchy et al. 2009a), making cross-correlations with numerical masks. We used the optimized procedures presented by Heidari et al. (2022) and Heidari et al. (2024). This includes in particular: (1) CCD charge transfer inefficiency correction (Bouchy et al. 2009b); (2) correction for the moonlight contamination using the simultaneous sky spectrum obtained from the second SOPHIE fiber aperture (Pollacco et al. 2008; Hébrard et al. 2008); (3) RV constant master correction for instrumental long-term drifts (Courcol et al. 2015); and (4) correction of the instrumental short-term drifts thanks to the frequently measured drifts interpolated at the precise time of each observation.
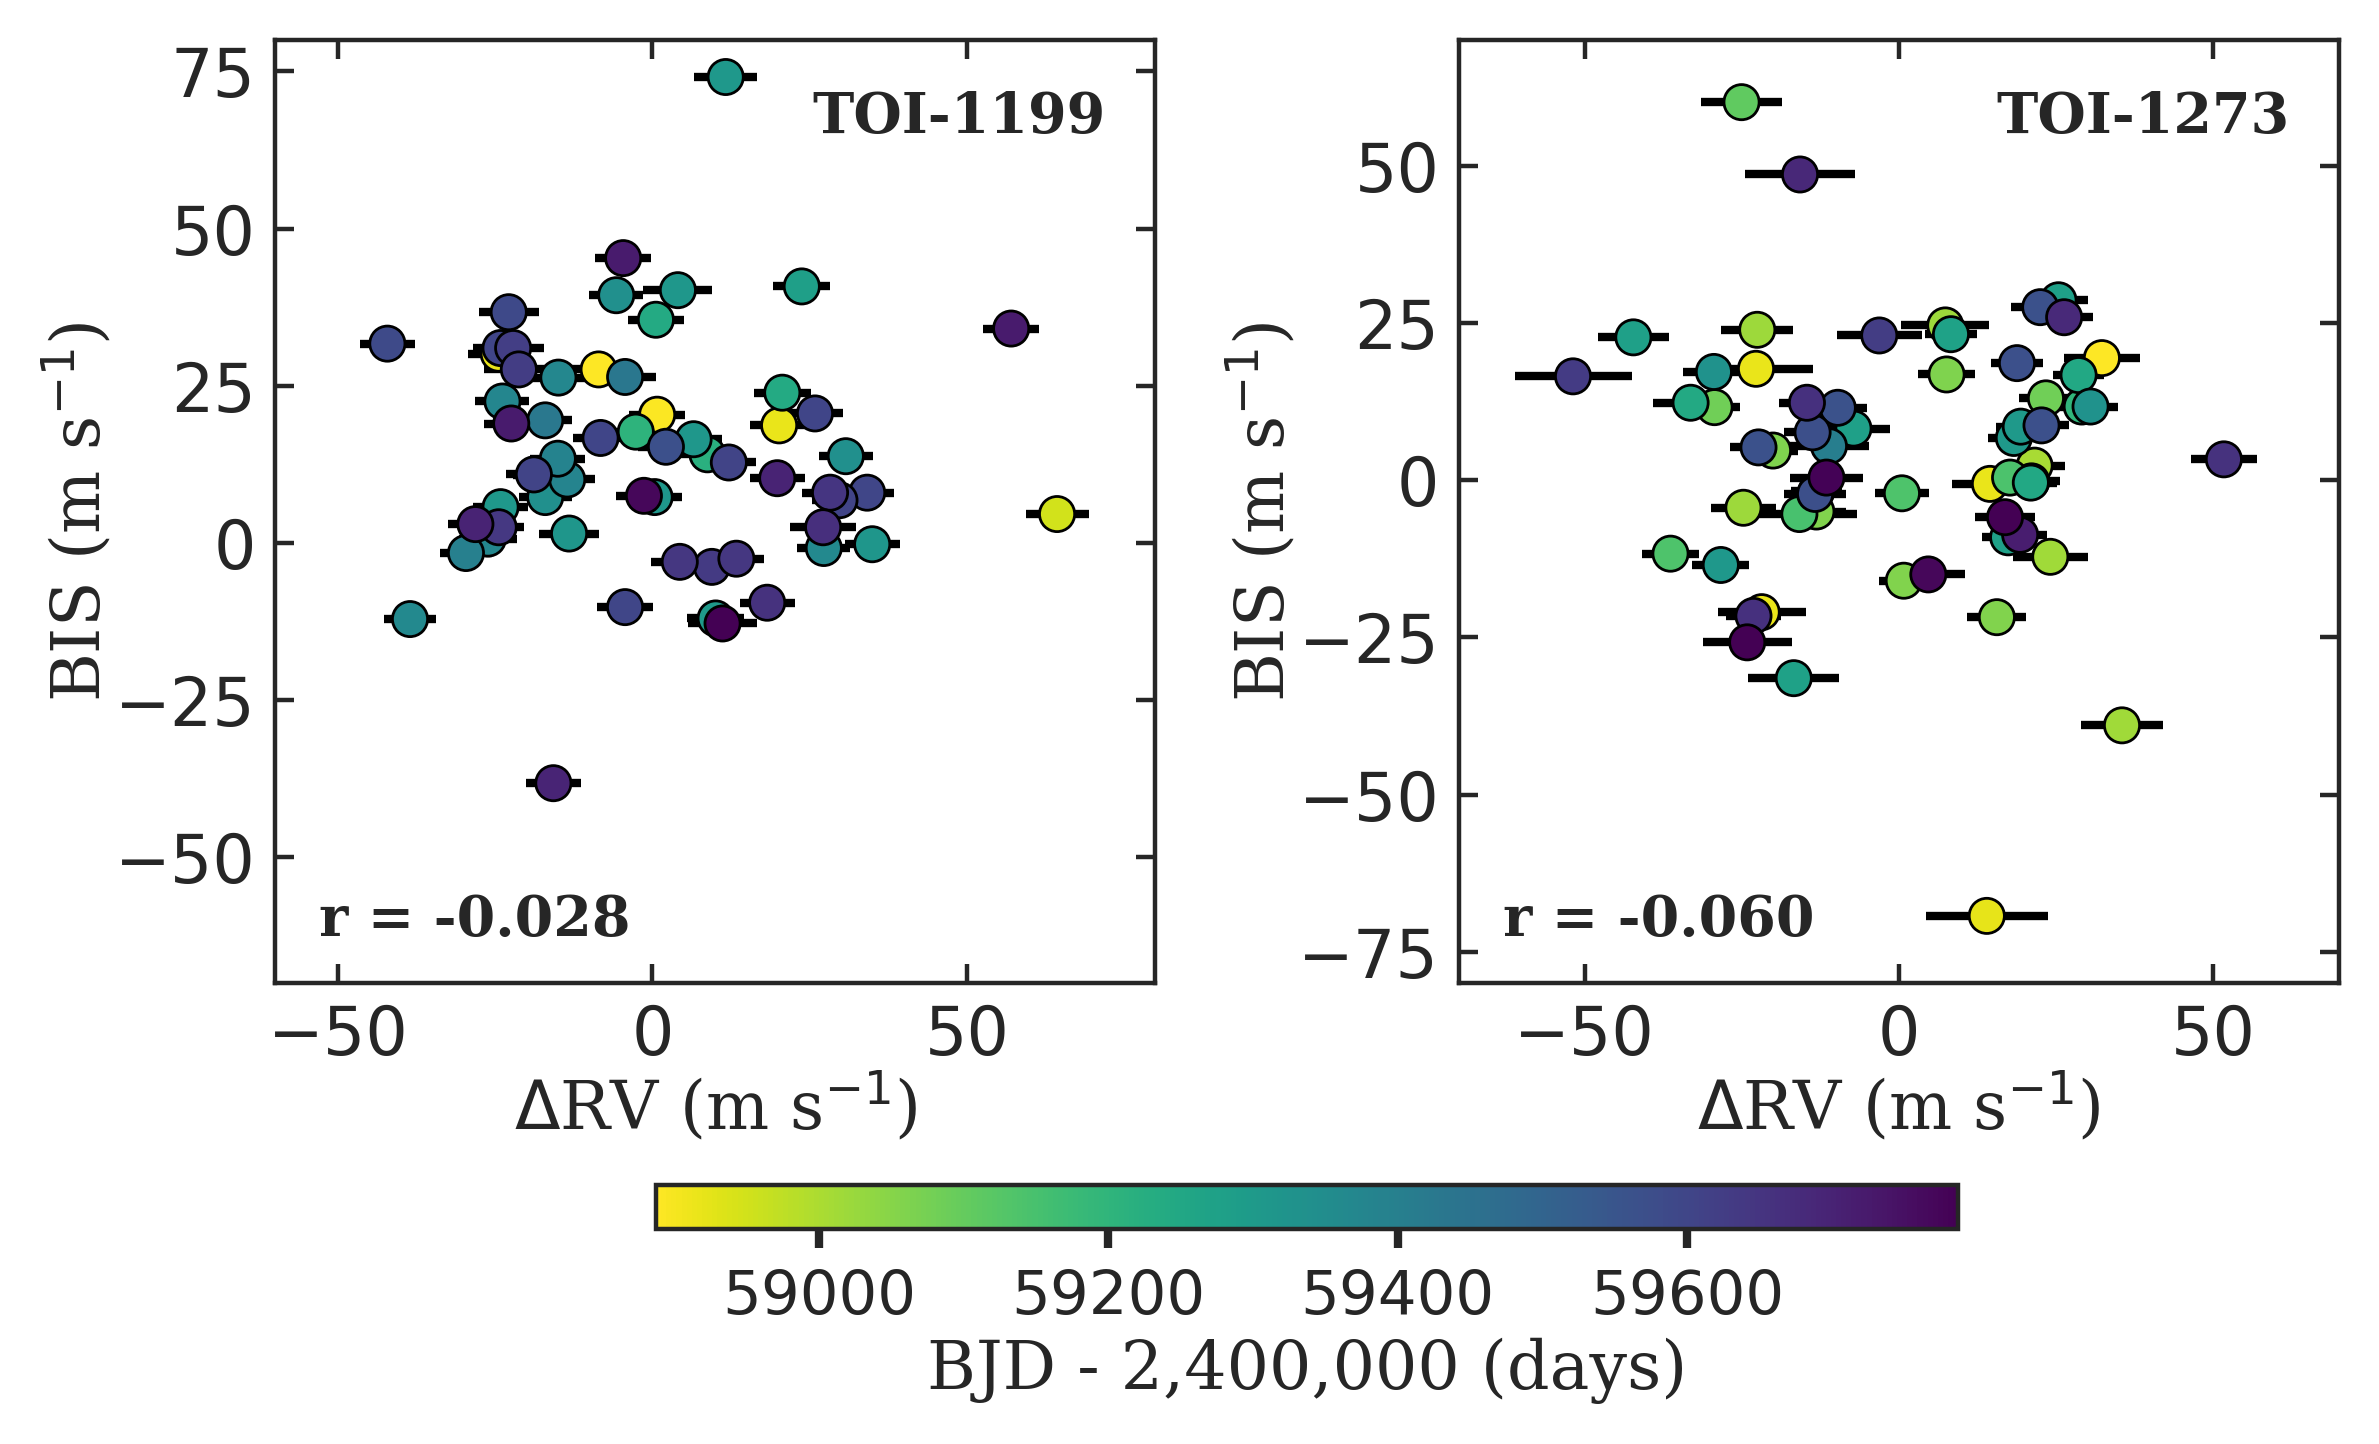
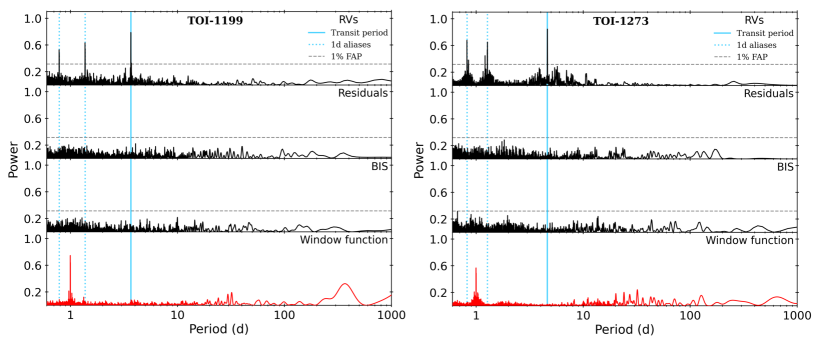
We excluded the 15 bluest spectral orders from the cross-correlations due to their low S/N. We tried different masks characteristic of various stellar types, which all produced results in agreement. This agreement favors the planetary scenario, whereas a transit implying blended stars of different spectral types might produce RV semi-amplitudes varying with the stellar mask. The bisector spans (BISs) of each cross-correlation function were also computed following Queloz et al. (2001). They show no significant variations nor correlation with the RVs (see Fig. 3), also arguing in favor of the planetary scenario for the transit events. Figure 4 shows the generalized Lomb-Scargle999We used the astropy implementation of this method (Astropy Collaboration et al. 2022). (GLS; Zechmeister & Kürster 2009) periodograms of both targets. For the two systems, the RV shows variations in agreement with the periods and phases derived from the photometry (Sect. 2.1 and 2.2). We see no further significant signals in the residuals after removing the best-fit model or in the BISs. From these results, we validate TOI-1199.01 and TOI-1273.01 as planetary transits, and forward refer to the planets as TOI-1199 b and TOI-1273 b. The complete RV and BIS time series for both targets are displayed in Appendix A.
2.4 High-resolution imaging
If an exoplanet host star has a spatially close companion, that companion (bound or line of sight) can create a false-positive transit signal if it is, for example, an eclipsing binary. Moreover, “third-light” flux from the close companion star can lead to an underestimated planetary radius if not accounted for in the transit model (Ciardi et al. 2015), yield incorrect planet and stellar parameters (Furlan & Howell 2017, 2020), and cause non-detections of small planets residing with the same exoplanetary system (Lester et al. 2021). Additionally, the discovery of close, bound companion stars, which exist in nearly one-half of FGK-type stars (Matson et al. 2018) provides crucial information toward our understanding of exoplanetary formation, dynamics, and evolution (Howell et al. 2021). Thus, to search for close-in bound companions unresolved in photometric observations (Sect. 2.1 and 2.2) and undetected from SOPHIE stellar mask and bisector studies (Sect. 2.3), we obtained high-resolution imaging speckle observations of TOI-1199 and TOI-1273.
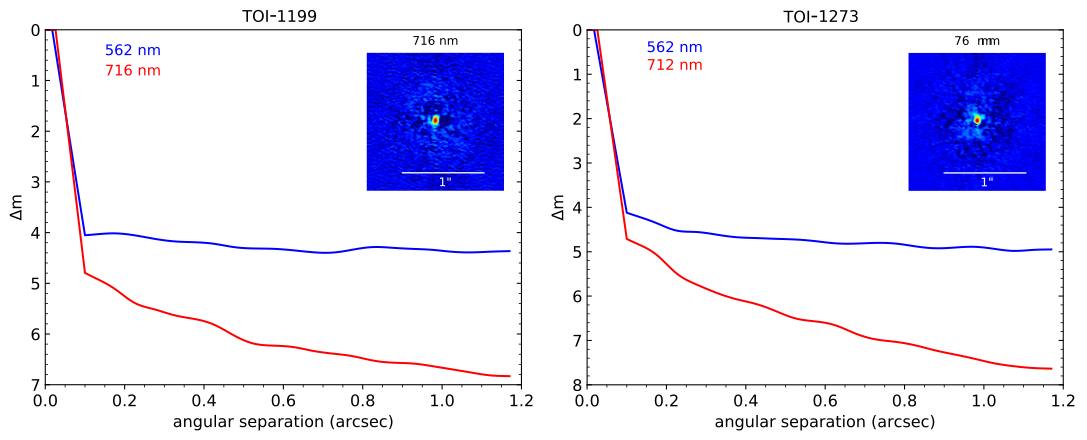
TOI-1199 and TOI-1273 were observed on 15 and 17 February 2020 (respectively) using the ‘Alopeke speckle instrument on the Gemini North 8 m telescope101010https://www.gemini.edu/sciops/instruments/alopeke-zorro/ (Scott et al. 2021). ‘Alopeke provides simultaneous speckle imaging in two bands (562 nm and 832 nm) with output data products including a reconstructed image with robust contrast limits on companion detections (e.g., Howell & Furlan 2022). Four sets of 10000.06 s exposures were collected for each target and subjected to Fourier analysis in our standard reduction pipeline (see Howell et al. 2011). Figure 5 shows our final contrast curves and the 832 nm reconstructed speckle images. We find that both TOI-1199 and TOI-273 are single stars revealing no nearby companion brighter than 5-7 magnitudes below that of the target star from 0.1” out to 1.2”. At the distance of TOI-1199 ( = 247 pc) and TOI-1273 ( = 176 pc) these angular limits correspond to spatial limits of 25-298 AU and 18-212 AU, respectively.
3 Analysis
| TOI-1199 | TOI-1273 | ||
| Parameter | Ref. | ||
| Designations | |||
| TIC | 99869022 | 445859771 | (1) |
| 2MASS | J11073136+6121096 | J14162891+5823255 | (2) |
| Gaia DR3 | 861975270310252416 | 1611685004650291840 | (3) |
| Astrometry | |||
| RA (J2016.0) | 11:07:31.35 | 14:16:29.01 | (3) |
| Dec. (J2016.0) | +61:21:9.24 | +58:23:24.89 | (3) |
| (mas) | (3) | ||
| (mas) | (3) | ||
| Distance (pc) | (4) | ||
| Photometry | |||
| Near-UV | – | (5) | |
| (6) | |||
| (6) | |||
| (6) | |||
| (6) | |||
| (6) | |||
| (3) | |||
| (3) | |||
| (3) | |||
| (2) | |||
| (2) | |||
| (2) | |||
| (7) | |||
| (7) | |||
| (7) | |||
| Bulk Properties | |||
| (K) | (8) | ||
| log | (8) | ||
| (m s-1) | (8) | ||
| (dex) | (8) | ||
| (km s-1) | (8) | ||
| log | (8) | ||
| (8) | |||
| ( erg s-1 cm-2) | (8) | ||
| (Lbol) | (8) | ||
| Radius (R⊙) | (8) | ||
| Mass (M⊙) | (8) | ||
| Age (Gyr) | (8) | ||
| (d) | (8) | ||
| (d) | (8) | ||
3.1 Stellar parameters
TOI-1199 and TOI-1273 are both G-type dwarfs, with V magnitudes of 11 that reside in the vicinity of the Sun, with distances 247.0 pc and 176.0 pc, respectively, as reported by Bailer-Jones et al. (2021) from Gaia parallaxes.
From the combined SOPHIE spectra unpolluted by moonlight the stellar atmospheric parameters (, , , [Fe/H]) were derived using the ARES+MOOG methodology described in Sousa et al. (2021), Sousa (2014), and Santos et al. (2013). We use the latest version of ARES121212The last version, ARES v2, can be downloaded at https://github.com/sousasag/ARES (Sousa et al. 2007, 2015) to measure the equivalent widths of selected iron lines on the combined spectrum of TOI-1199 and TOI-1273. The list of iron lines is the same as the one presented in Sousa et al. (2008). A minimization process is used to find the ionization and excitation equilibrium and converge to the best set of spectroscopic parameters. This process makes use of a grid of Kurucz model atmospheres (Kurucz 1993) and the radiative transfer code MOOG (Sneden 1973). This procedure leads to the following atmospheric parameters: K, , m s-1, dex, and km s-1 for TOI-1199 and K, , m s-1, dex, and km s-1 for TOI-1273. We also derived a more accurate trigonometric surface gravity using recent Gaia data following the same procedure as described in Sousa et al. (2021), leading to and for TOI-1199 and TOI-1273, respectively. The log index were computed following Boisse et al. (2010), indicating low activity for both stars, with values of and for TOI-1199 and TOI-1273, respectively.
As an independent analysis we also derived stellar parameters using spectra obtained with the Tillinghast Reflector Echelle Spectrograph (TRES; Fűrész 2008) on the 1.5 m Tillinghast Reflector at FLWO in Arizona, USA. TRES is an optical (390-910 nm) fiber-fed echelle spectrograph with a resolving power of 44,000. The spectra were extracted using the standard pipeline as described in Buchhave et al. (2010) and stellar parameters were derived using the Stellar Parameter Classification (SPC; Buchhave et al. 2012, 2014) tool. TOI-1199 was observed on 7 January 2020 and 9 January 2020 (with 36 and 35 S/N, respectively) and TOI-1273 was observed on 30 December 2019 and 24 January 2020 (with 34 and 37 S/N, respectively). This analysis led to the following parameters: K, , dex and km s-1for TOI-1199 and K, , dex and km s-1for TOI-1273. All the values agree within 1 with those reported above from the analysis of SOPHIE spectra. For this four parameters we adopt the weighted arithmetic mean from the two analysis (for we combined the three determinations), which are the values reported in Table 2.
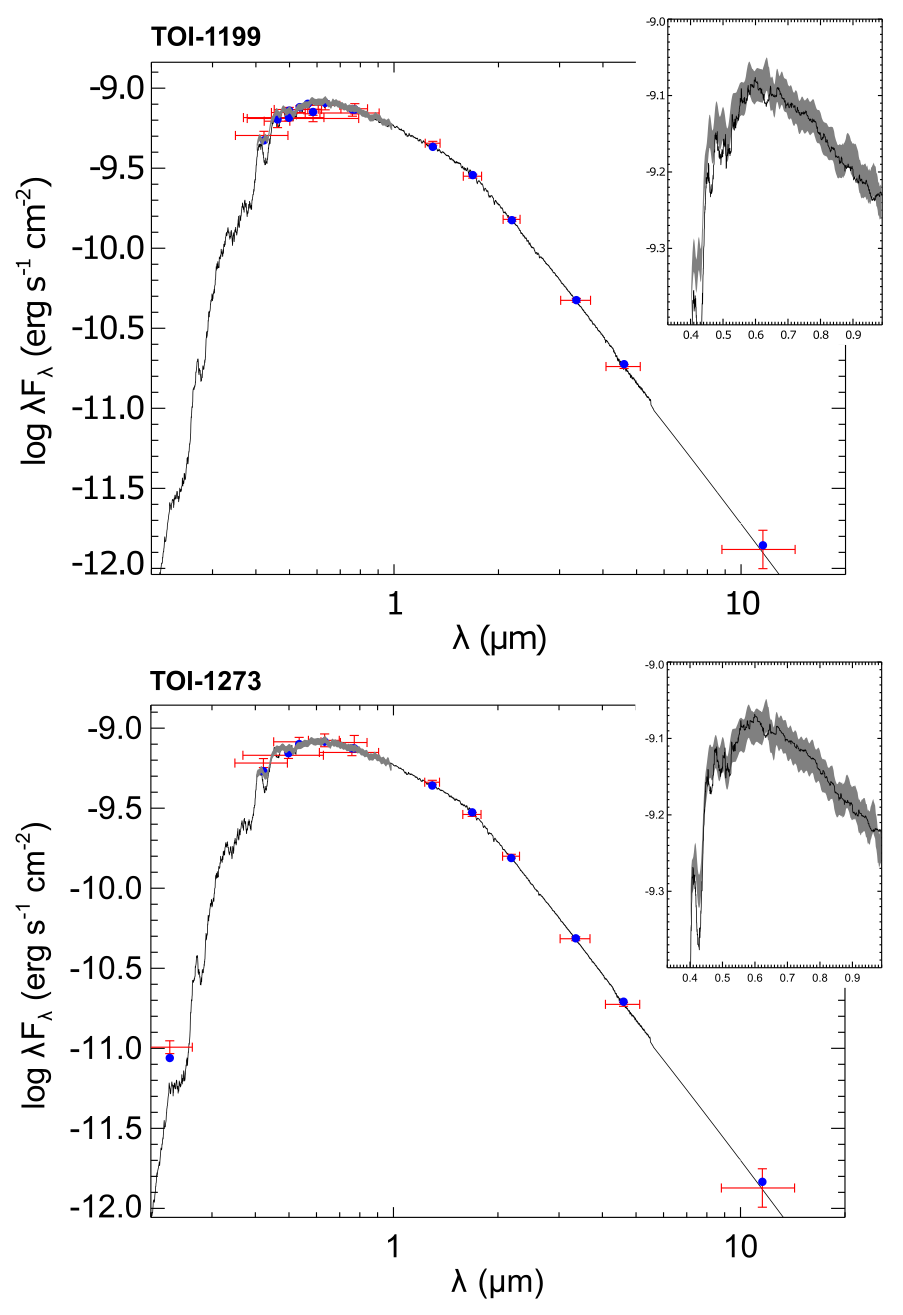
We performed an analysis of the broadband spectral energy distribution (SED) of the stars together with the Gaia DR3 parallax (with no systematic offset applied; see, e.g., Stassun & Torres 2021) to determine an empirical measurement of the stellar radius, following the procedures described in Stassun & Torres (2016), Stassun et al. (2017), and Stassun & Torres (2018). We pulled the JHKS magnitudes from 2MASS, the W1–W3 magnitudes from WISE, the magnitudes from Gaia, the magnitudes from APASS, and where available the near-UV magnitude from GALEX. Together, the available photometry spans the full stellar SED over at least the wavelength range 0.4–10 m and up to 0.2–20 m (see Fig. 6).
We then performed a fit using PHOENIX stellar atmosphere models (Husser et al. 2013), with the main parameters being the effective temperature () and metallicity ([Fe/H]), which we adopted from the spectroscopic values, as well as the extinction , which we limited to maximum line-of-sight value from the Galactic dust maps of Schlegel et al. (1998). The resulting fits (Fig. 6) have a best-fit and for TOI-1199 and TOI-1273, respectively, with a reduced of 1.2 and 1.4, respectively. Integrating the (un-reddened) SED gives the bolometric flux at Earth, erg s-1 cm-2 and erg s-1 cm-2, respectively. Taking the together with the Gaia parallax gives the bolometric luminosity directly, Lbol and Lbol, respectively. The stellar radius then follows from the Stefan-Boltzmann relation, giving R⊙ and R⊙, respectively. In addition, we estimate the stellar mass from the empirical relations of Torres et al. (2010), giving M⊙ and M⊙, respectively.
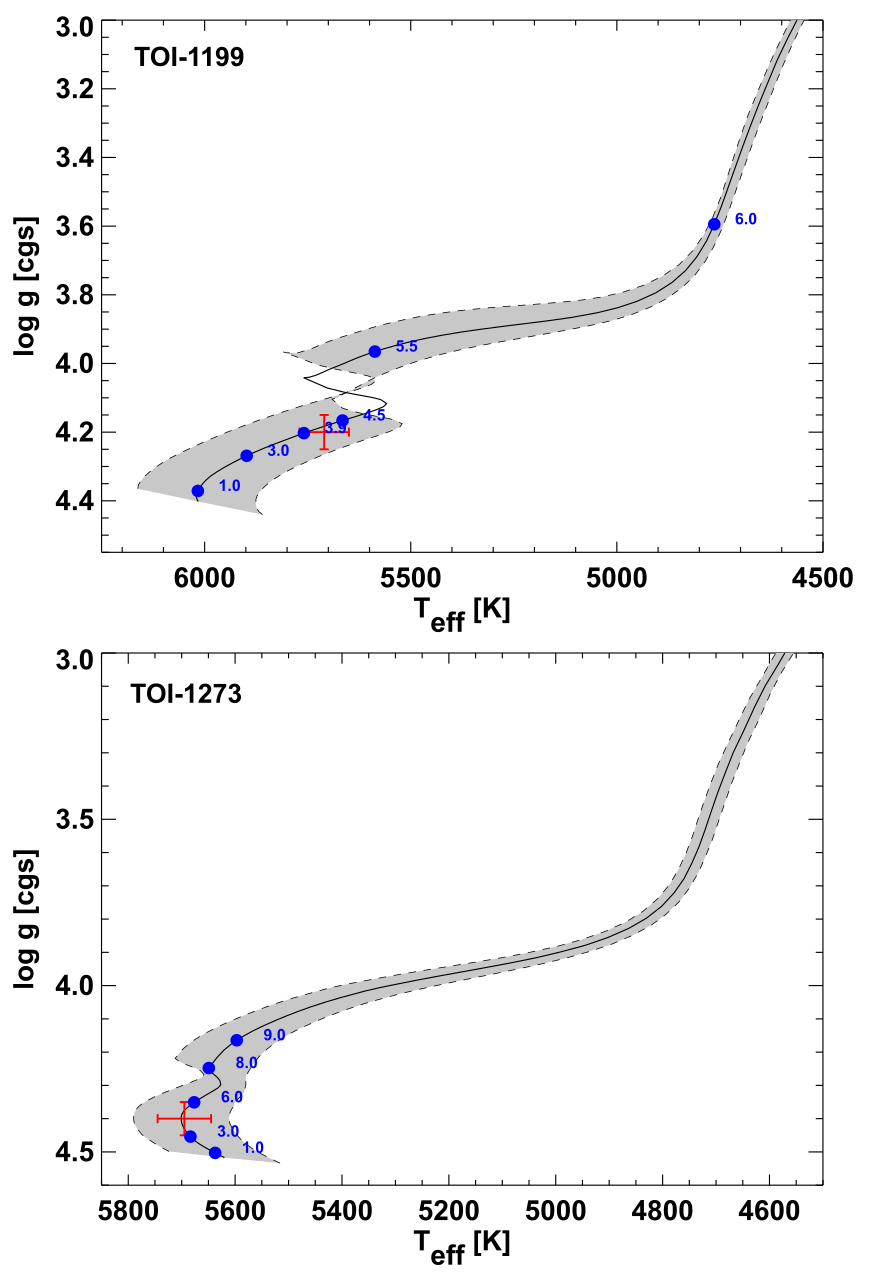
We also estimate the stellar ages from the empirical rotation-activity-age relations of Mamajek & Hillenbrand (2008), as follows. We estimate the projected stellar rotation period from the spectroscopic together with , giving d and d, respectively, which imply gyrochronological ages of Gyr and Gyr, respectively. At the same time, the spectroscopically determined chromospheric activity indices, , imply ages of Gyr and Gyr, respectively, and predict rotation periods of d and d, respectively. However, given the poor constraint on log this estimation is the least reliable. Finally, placing the stars in a Kiel diagram (Fig. 7) against the Yonsei-Yale stellar evolutionary models implies ages of Gyr and Gyr, respectively. The age reported on Table 2 in the case of TOI-1199 is the weighted arithmetic mean between the gyrochronological and the Kiel diagram ages, resulting in an estimated age of Gyr. For TOI-1273 we did the same but we also added a systematic error to each measurement considering that the difference in the values from both methods imply an underestimation of the error bars, the final estimated age is Gyr.
Something to remark is that both stars are solar analogs, the main difference being the really high metallicity of TOI-1199. TOI-1273 has parameters consistent within 2 and 3 to those of the Sun, making it a candidate to solar twin. This makes these two targets more interesting since solar analogs and especially solar twins offer an opportunity to derive more accurate stellar parameters and consequently more accurate planetary parameters. The adopted stellar parameters for both stars are summarized in Table 2.
3.2 Planetary parameters
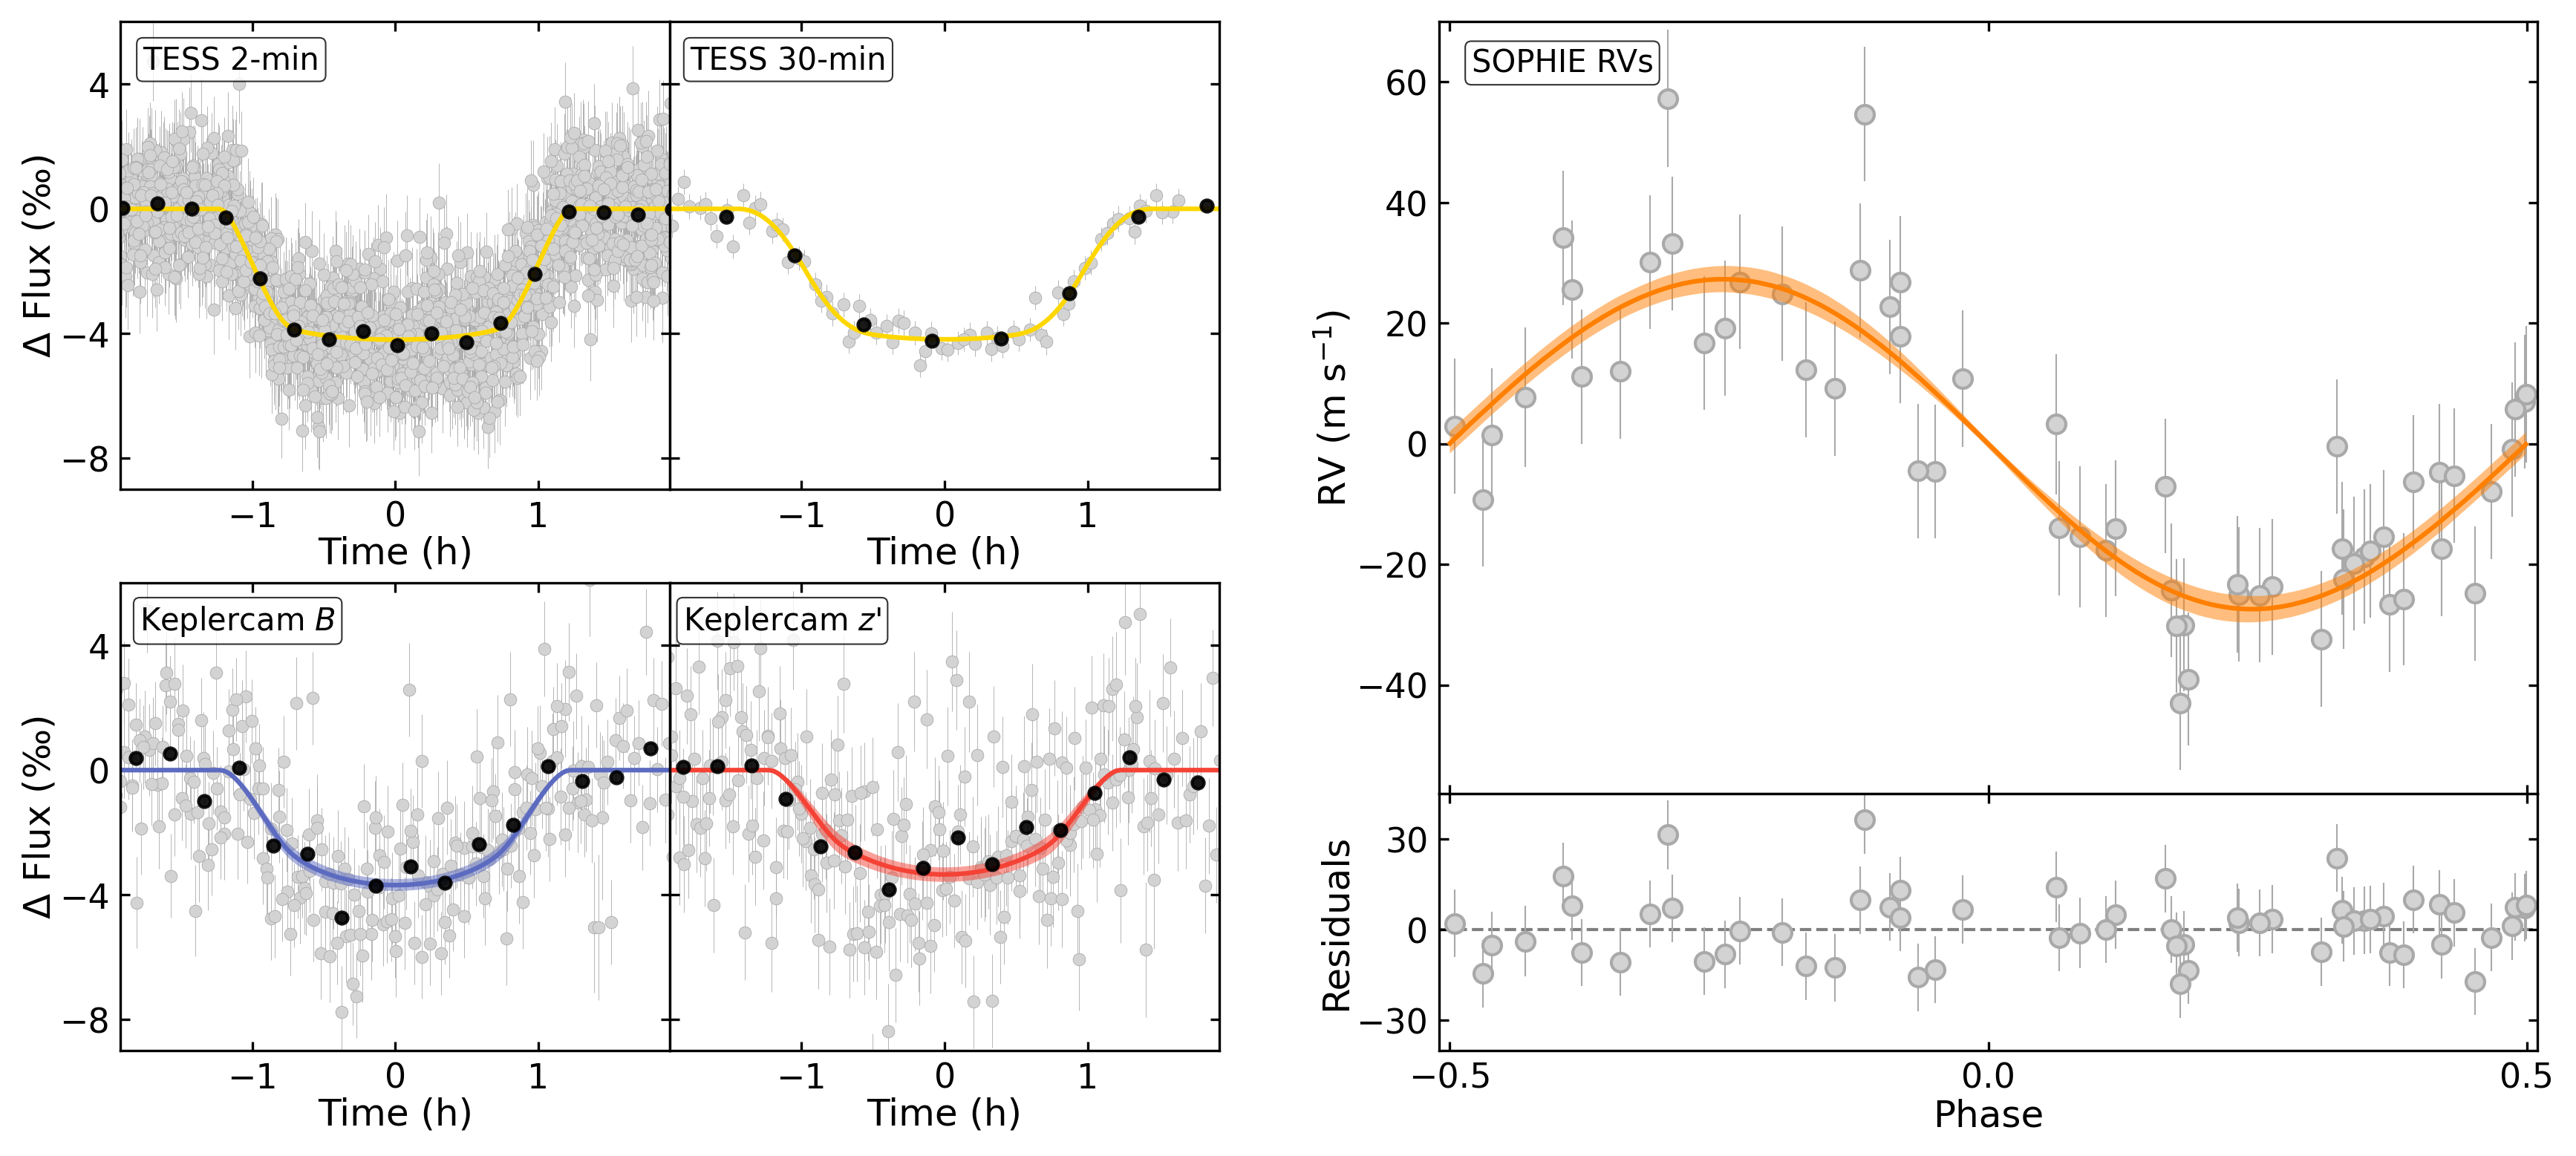
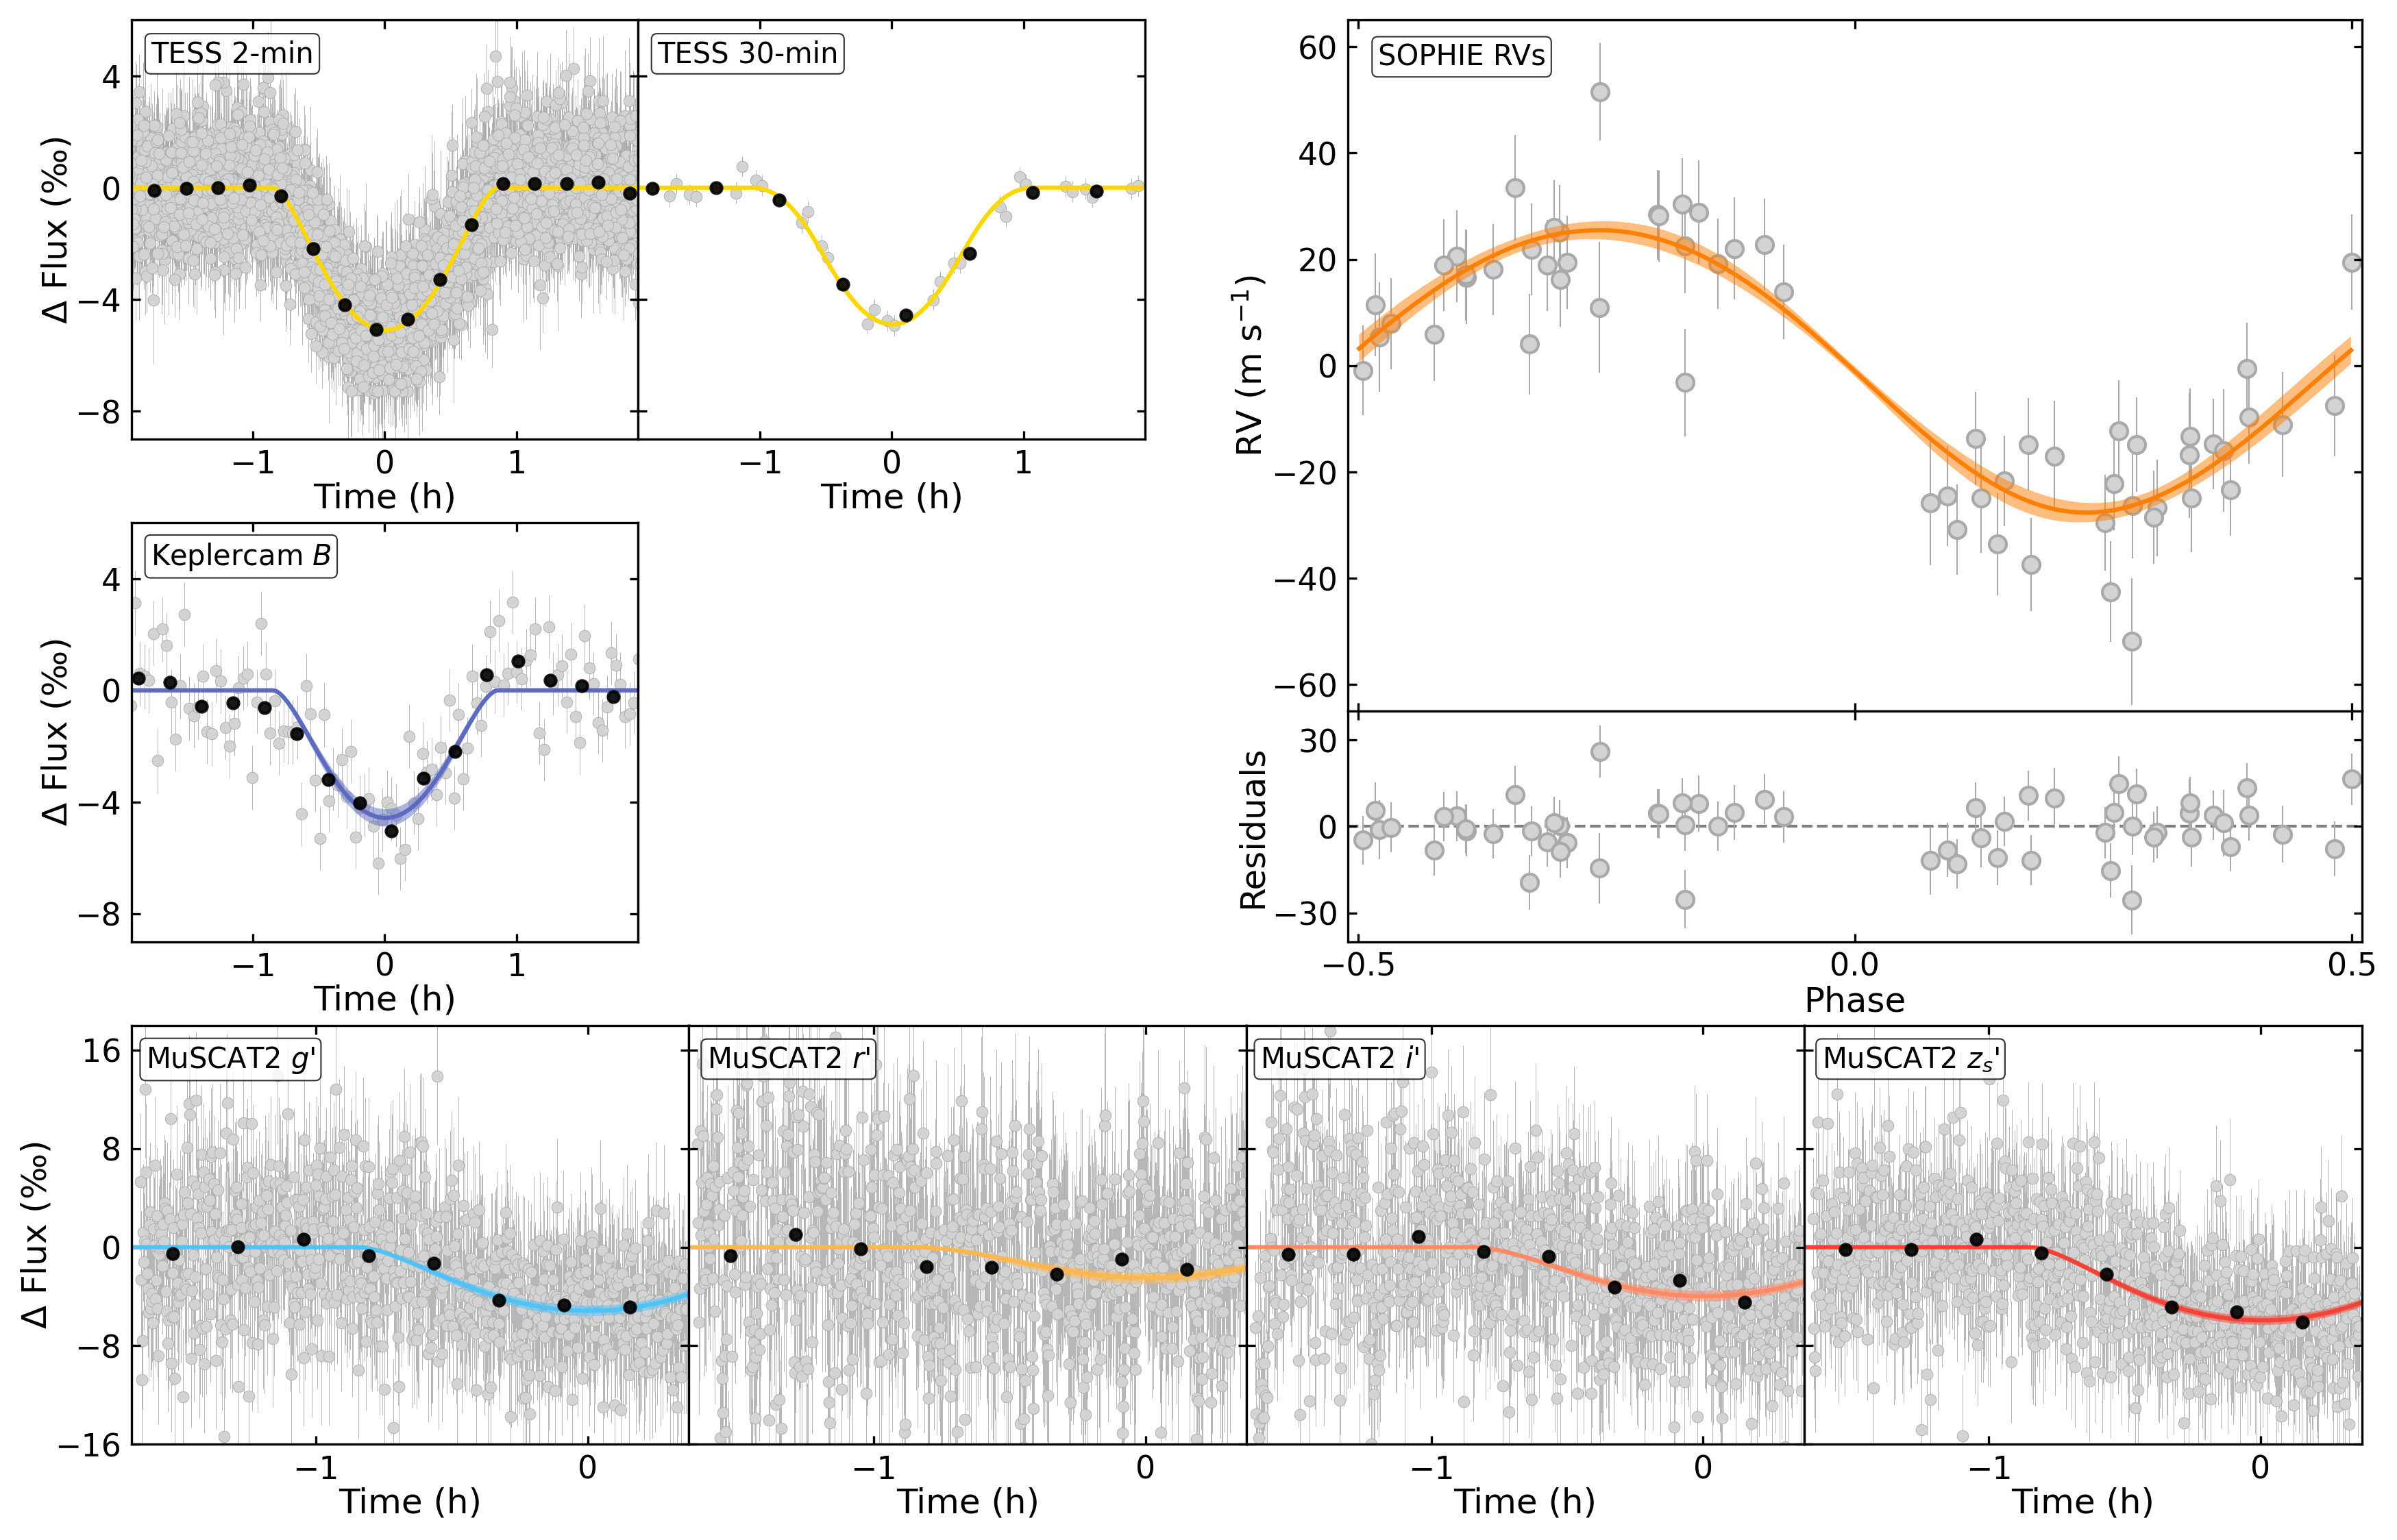
We fit a joint model to the photometric and RV observations of both targets. For TOI-1199 the inputs of the joint model are the 60 SOPHIE RVs, the light curves from four TESS sectors (two 30-minute cadence and two 2-minute cadence) and the KeplerCam light curves in bands B and z’ (Fig. 8). In the case of TOI-1273, we used 60 SOPHIE RVs, TESS light curves from six sectors (five high cadence and one low cadence), one KeplerCam B-band light curve, and four MusCAT2 light curves in bands g’, r’, i’, and z’ (Fig. 9). In the two models we only used the points within 0.1 d from the mid transits.
Bayesian inference was carried out to obtain the planetary parameters from a probabilistic model, and it was similar for both targets. We used the EXOPLANET Python package (Foreman-Mackey et al. 2021), which is built within the framework of PyMC3, a flexible and open source Python probabilistic programming language with a built-in Hamiltonian Monte Carlo Sampler (Salvatier et al. 2016). One advantage of using the EXOPLANET toolkit is that it has many built-in common functions and tools for modeling exoplanetary time series like the solver of the Kepler equation and others.
The prior distributions defined for the parameters of the joint models are shown in Appendix B. The stellar mass and radius have normal priors informed by the analysis presented in Sect. 3.1 and bounded between and . For the limb darkening coefficients and), we used for each bandpass the two-parameter quadratic law parametrization described by Kipping (2013). Additionally, a mean baseline flux and a jitter term is defined for each instrument and bandpass (in the case of TESS also for each cadence), the jitter is introduced in the model by adding it in quadrature to the error of the light curves. From inspecting the transits on Fig. 9, high values for the impact parameters are expected, especially for TOI-1273 where a clear V-shape is observed indicating a grazing transit. Considering this, we set a uniform prior between and 1 to the impact parameter to make sure we include the case of ¿ 1 in the parameter space. For the ratio of radius , we defined a wide log-normal prior that was informed by the measured depth of the transits. In the case of TOI-1273 we also included a lower bound constraint to the planetary bulk density because of the grazing transit, this is discussed in detail in Sect. 3.3.
To account for any possible long-term trends in the RV curves we included a second degree polynomial of time with the three coefficients as free parameters, which are referred as RV trend 2, RV trend 1, and RV trend 0 in Table LABEL:tab:priors2 and are the quadratic, linear, and constant coefficients, respectively. Additionally, an RV jitter term is added with a log-normal prior, and for the RV semi-amplitude we set log-normal priors informed by the estimated value from a preliminary fit on the RV curves. The time of mid transit, and the orbital period, have priors informed by the values obtained from the box least-squares analysis. Finally, because it is well known that sampling directly the eccentricity and the argument of periastron can be problematic for most Markov chain Monte Carlo (MCMC) samplers (Parviainen 2018), we sampled for and instead with a uniform prior within a unit disk, which leads to a uniform prior on as noted by Anderson et al. (2011).
After defining the models, we calculated the local maximum a posteriori solution, which was then used as a starting point for the No-U-Turn Sampler, a variation of a Hamiltonian Monte Carlo method described by Hoffman & Gelman (2011). We sampled the posterior distributions of the parameters with 4000 tuning steps, 4000 draws and 2 independent chains for each model. The MCMCs do not show convergence problems, the Gelman-Rubin statistic is close to 1 for all parameters and well below , which is generally considered the threshold to indicate convergence problems (Gelman et al. 2013).
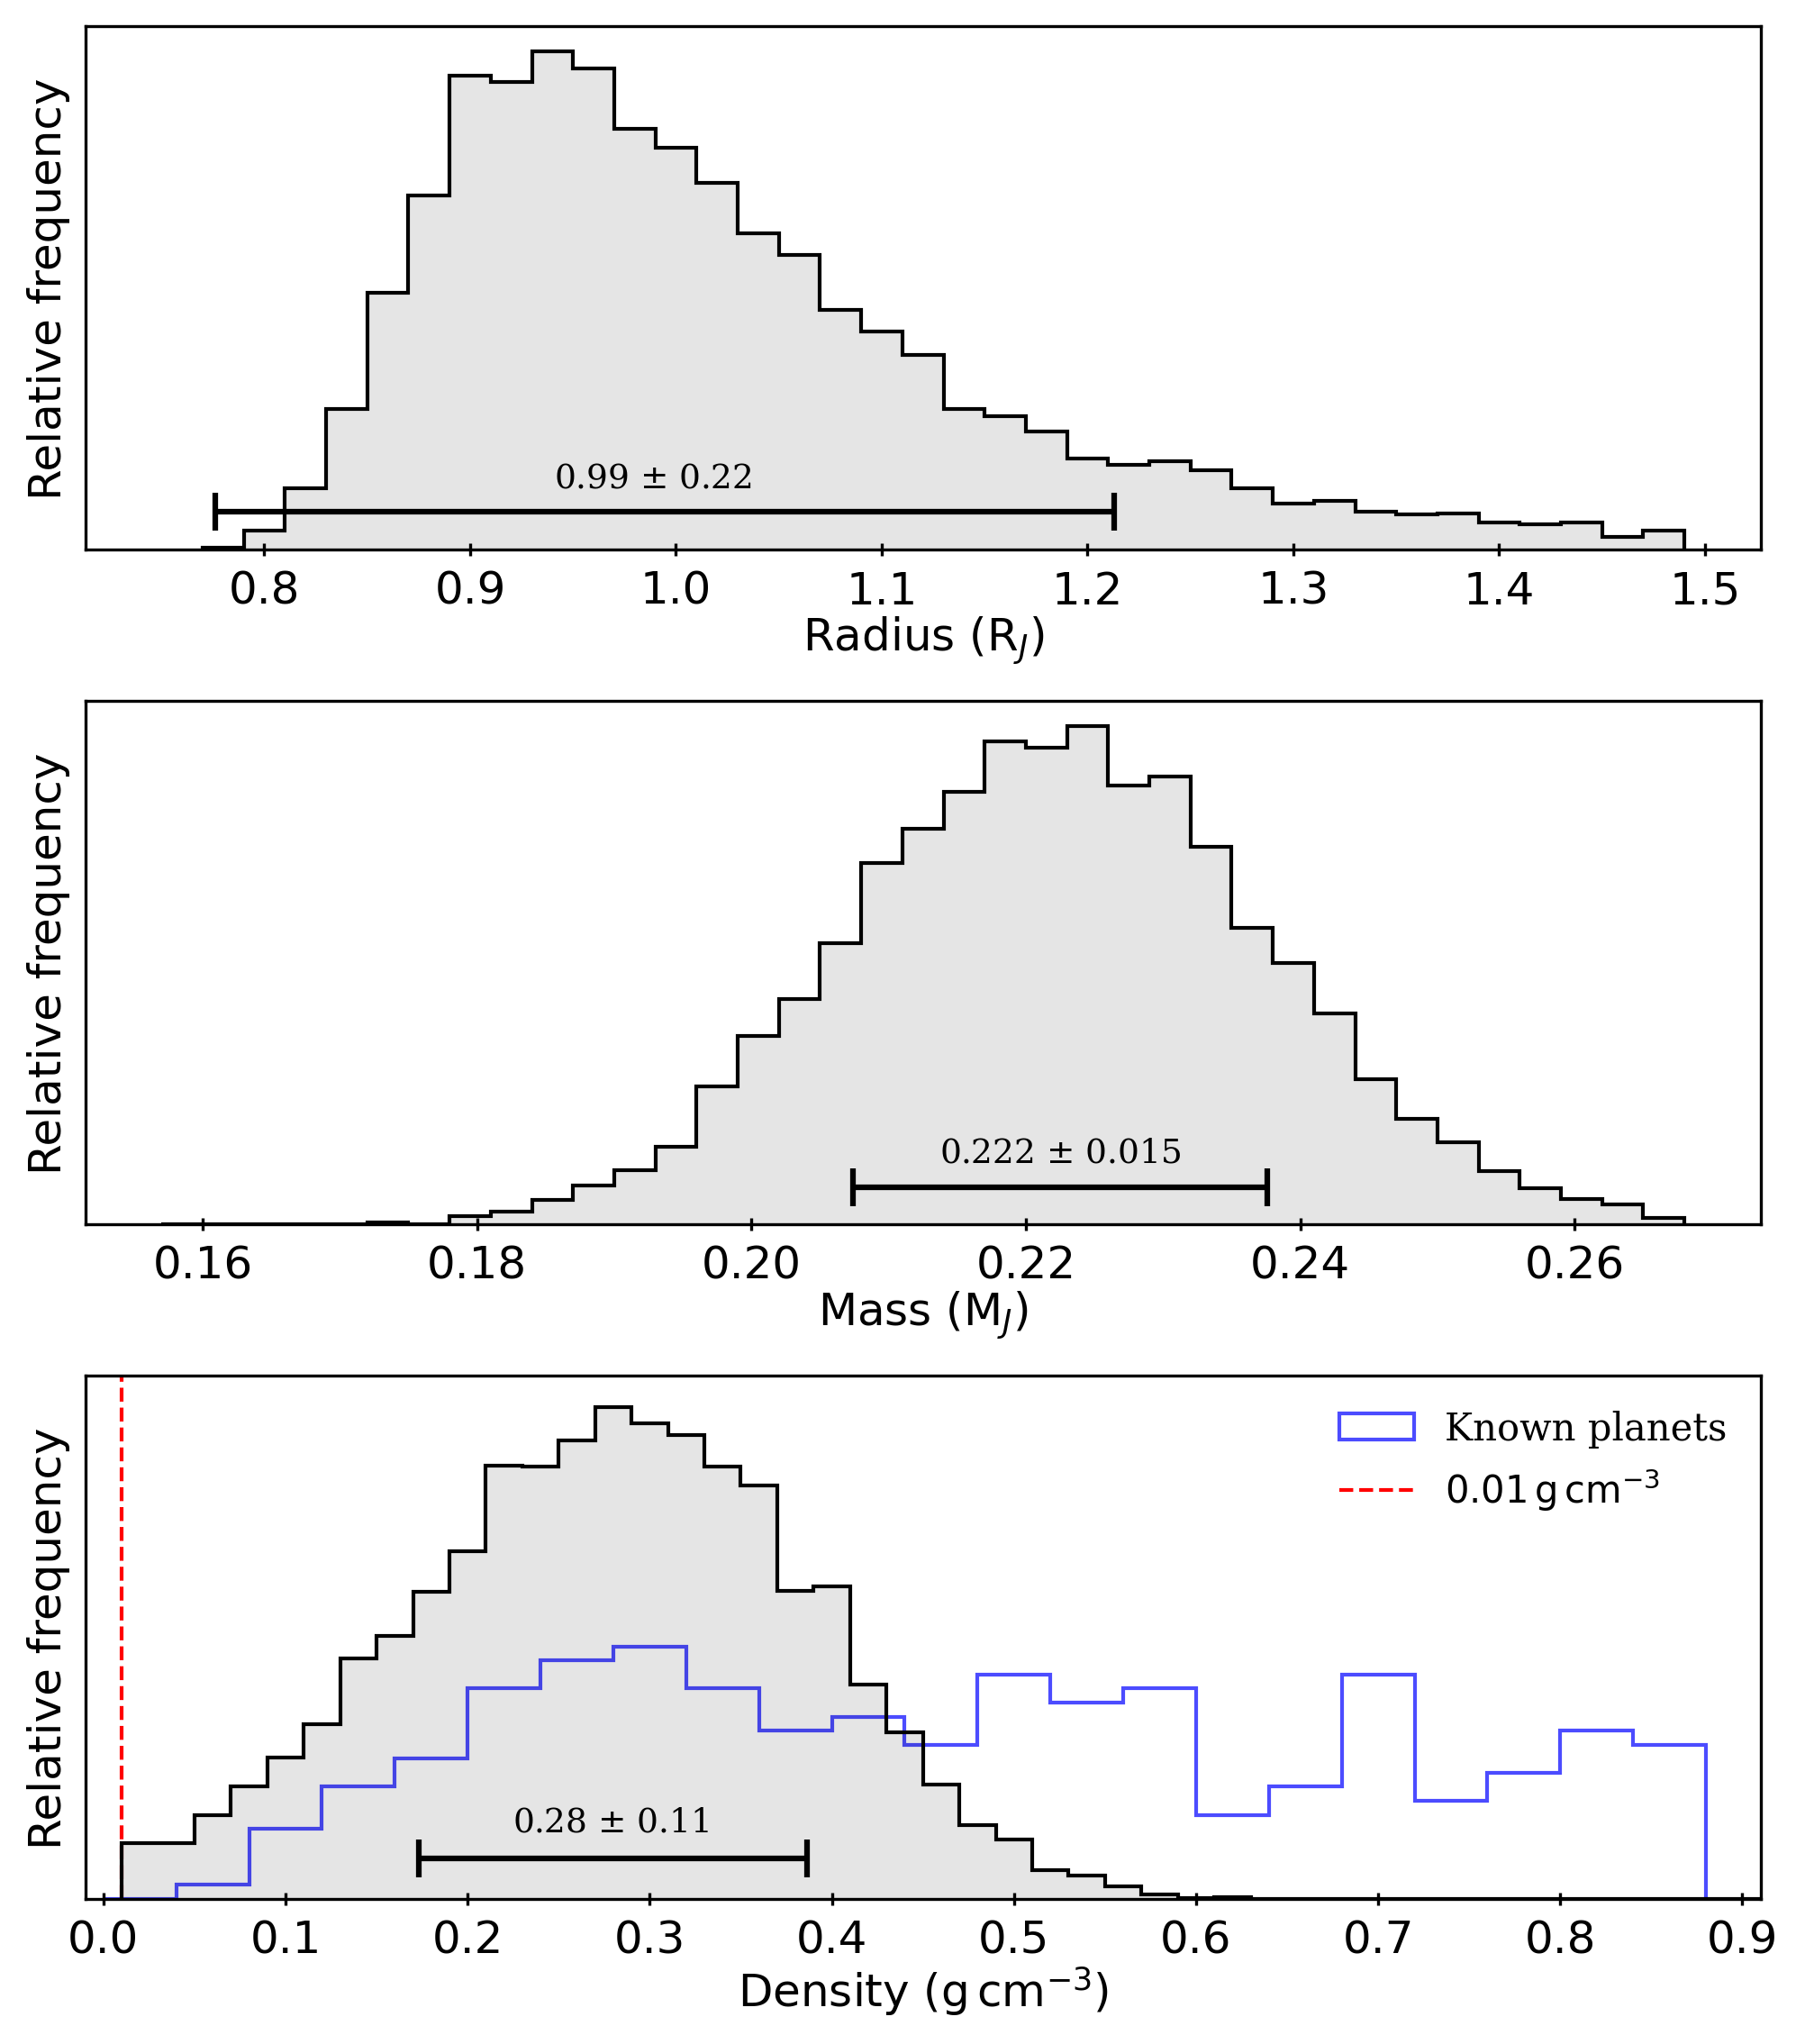
For TOI-1199 b we obtain a well-constrained radius of = 0.938 0.025 RJ and a mass of = 0.239 0.020 MJ, resulting in a bulk density of 0.358 0.041 g cm-3. For TOI-1273 b we constrain its radius to = 0.99 0.22 RJ, where the larger uncertainty is a consequence of the grazing transit. Its mass is well determined to = 0.222 0.015 MJ, giving a bulk density of 0.280.11 g cm-3. Equilibrium temperatures () are calculated for both asuming zero albedo and full day-night heat distribution according to
| (1) |
With these masses and short periods, both planets are located in the hot Saturn parameter space.
TOI-1199 b has an eccentricity of 0.0300.029, which is compatible with zero within 2 and with a 3 upper limit of . For TOI-1273 b we found a slightly larger value of 0.0550.032, also compatible with zero at 2 and with a 3 upper limit of . Considering the low values of eccentricity obtained for both planets we did a run for each fixing to simplify the model and see if this might improve the constraints on other parameters. The results agreed within 1 for all parameters in both targets, we therefore decided to let the eccentricity as a free parameter.
With the available data we find no evidence of additional companions. As shown on Fig. 4, the residuals of the models do not present any further periodic signals. This allows us to discard other short-period planets at least with semi-amplitudes larger than the combined uncertainty from the RV measurements and the RV jitter; this value is 11 m s-1 for TOI-1199 and 9 m s-1 for TOI-1273. Furthermore, the second degree polynomial model provides upper limits for any possible long-term trend. If we assume a circular orbit for a potential outer companion, we can discard planets with semi-amplitudes larger than the RV variation present in the polynomial model, and periods shorter than two times the time-span. With this criteria, we can exclude for TOI-1199 planets with periods shorter than 1800 days and semi-amplitudes larger than 33 m s-1 with 3 confidence, which translates to a lower limit mass of 2.3 MJ. And for TOI-1273 the excluded companions have periods shorter than 1800 days and semi-amplitudes larger than 23 m s-1 at 3, corresponding to a lower limit mass of 1.6 MJ. Additionally, we checked the Gaia DR3 renormalized unit weight error (RUWE) and astrometric excess noise (AEN) for TOI-1199 ( mas, ) and TOI-1273 ( mas, ). Neither show evidence of an accelerated motion signal beyond a 95% confidence level. Thus, there are no hints of a stellar or brown dwarf companion on either object. Maintaining a long-term RV monitoring of both stars is recommended to keep searching for possible companions and we are currently continuing such observations with SOPHIE.
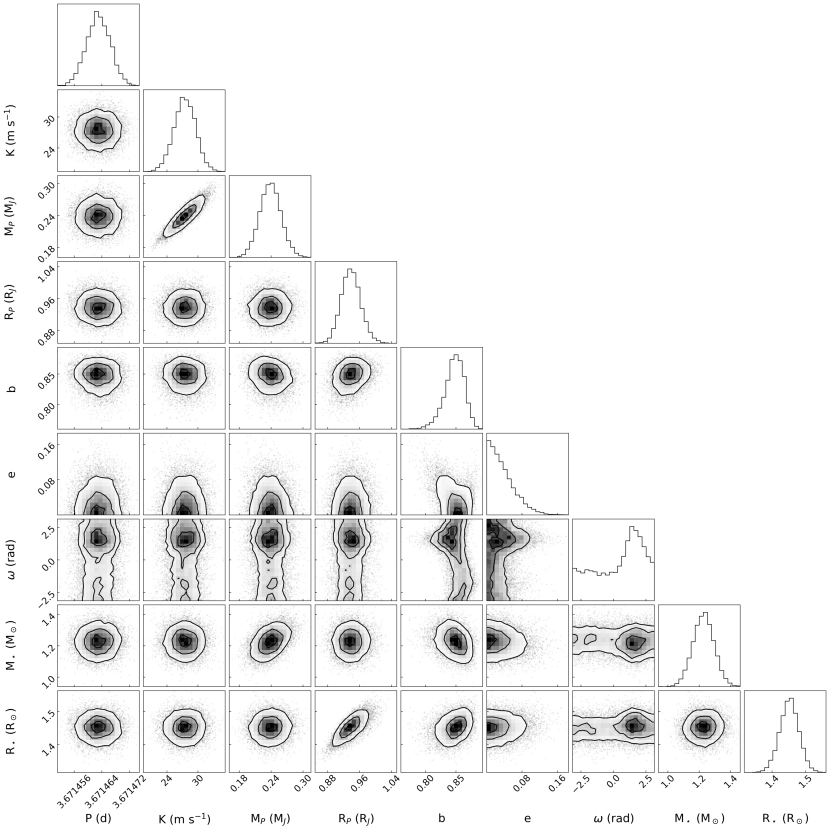
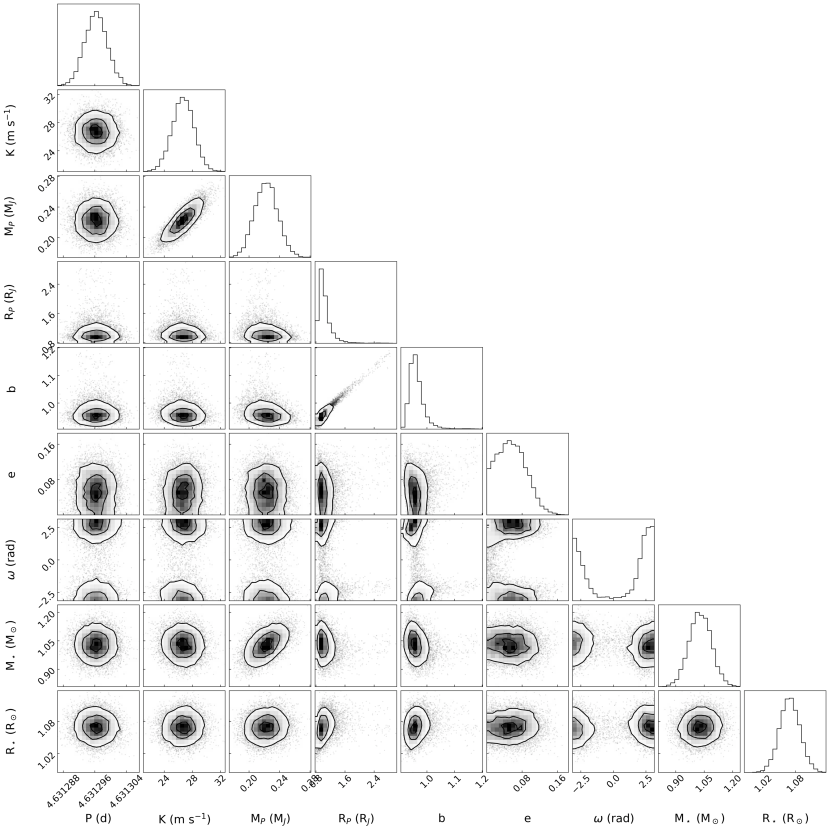
Table 3 shows the orbital and physical parameters obtained for the two planets. The full list of parameters from the joint models is shown in Appendix B and the corner plots of the MCMC sampling of the posterior distributions are shown in Appendix C.
| Parameter | TOI-1199 b | TOI-1273 b |
|---|---|---|
| Fitted parameters | ||
| (d) | ||
| (TBJD) | ||
| (m s-1) | ||
| Derived parameters | ||
| (MJ) | ||
| (RJ) | ||
| (AU) | ||
| (g cm-3) | ||
| (K) | ||
| (rad) | ||
3.3 Prior TOI-1273 b density constraint
Some problems arise with grazing orbits. For example, it causes otherwise uncorrelated parameters and to become highly correlated, making the sampling of this parameters significantly more difficult and also producing higher uncertainties on the derived planet radius and impact parameter. This problem cannot be overcome with re-parametrization. Another thing to consider is that since the transit is so close to the edge of the stellar disk, the model becomes more sensitive to the limb darkening parameters, and as established by Müller et al. (2013) the theoretical knowledge of the limb darkening close to the edge is inaccurate.
Traditional random-walk based MCMC algorithms become inefficient with correlated parameters. Although this is less of a problem for the NUTS sampler (Salvatier et al. 2016), highly correlated parameters remain problematic. In an initial run of the model two problems became evident for TOI-1273 b due to the degeneracy between and : (1) the effective sample size for this two parameters was significantly smaller than on TOI-1199 b; and (2) the two parameters were not well constrained in the parameter space, which resulted in having many samples located in physically unrealistic regions (that is, transits of impossibly big planets for the given mass with consequently large impact parameters, and extremely low densities). To overcome this we set a prior constraint on the planetary density. We limited the model to systems with bulk densities greater or equal to 0.01 g cm-3, we consider this value a reasonable limit for the density. Figure 10 shows the posterior distributions for the radius, mass and density of TOI-1273 b, where the cut at 0.01 g cm-3 is visible in the lower panel. The distribution of bulk densities for all known exoplanets with masses and radii known to better than 20% precision is also shown, where we see that there are no planets with bulk densities lower than 0.01 g cm-3. When applying this restriction to the model we get a better constraint to the radius of TOI-1273 b. The results reported in Tables 3, LABEL:tab:priors, and LABEL:tab:priors2 are from the model with this restriction.
4 Discussion
4.1 Radius–mass diagram
The combined analysis of high-resolution spectroscopy and space- and ground-based photometry allowed the determination of the masses and radii of planetary companions for the two target stars. Their masses and radii are = 0.239 0.020 MJ and = 0.938 0.025 RJ for TOI-1199 b; and = 0.222 0.015 MJ and = 0.99 0.22 RJ for TOI-1273 b. The physical properties of both planets are similar to those of Saturn ( = 0.30 MJ, = 0.83 RJ, and = 0.68 g cm-3) but they lie on short-period orbits (3.67 d and 4.63 d, respectively) and are less dense (0.3580.041 g cm-3 and 0.280.11 g cm-3, respectively). To put them in context, we compared their masses and radii to the known exoplanet population in the range 1 ¡ ¡ 10 d and 60 ¡ ¡ 100 M♁ with masses and radii determined to better than 20% precision (left and middle panels of Fig. 11). We can see that both planets are among the group with the lower densities for this range of masses and periods. In the left panel, the empirical radius-mass relation for volatile rich planets ( ¡ 3.3 g cm-3) found by Otegi et al. (2020) is also shown, where we note that the masses and radii of TOI-1199 b and TOI-1273 b are well described within 1 by this relation. In the middle panel of Fig. 11, TOI-1199 b stands out as one of the planets with the highest host star metallicity among similar known systems. For planets in this range of masses, Enoch et al. (2012) finds a negative correlation between host star metallicity and radius, this tendency is more or less visible here.
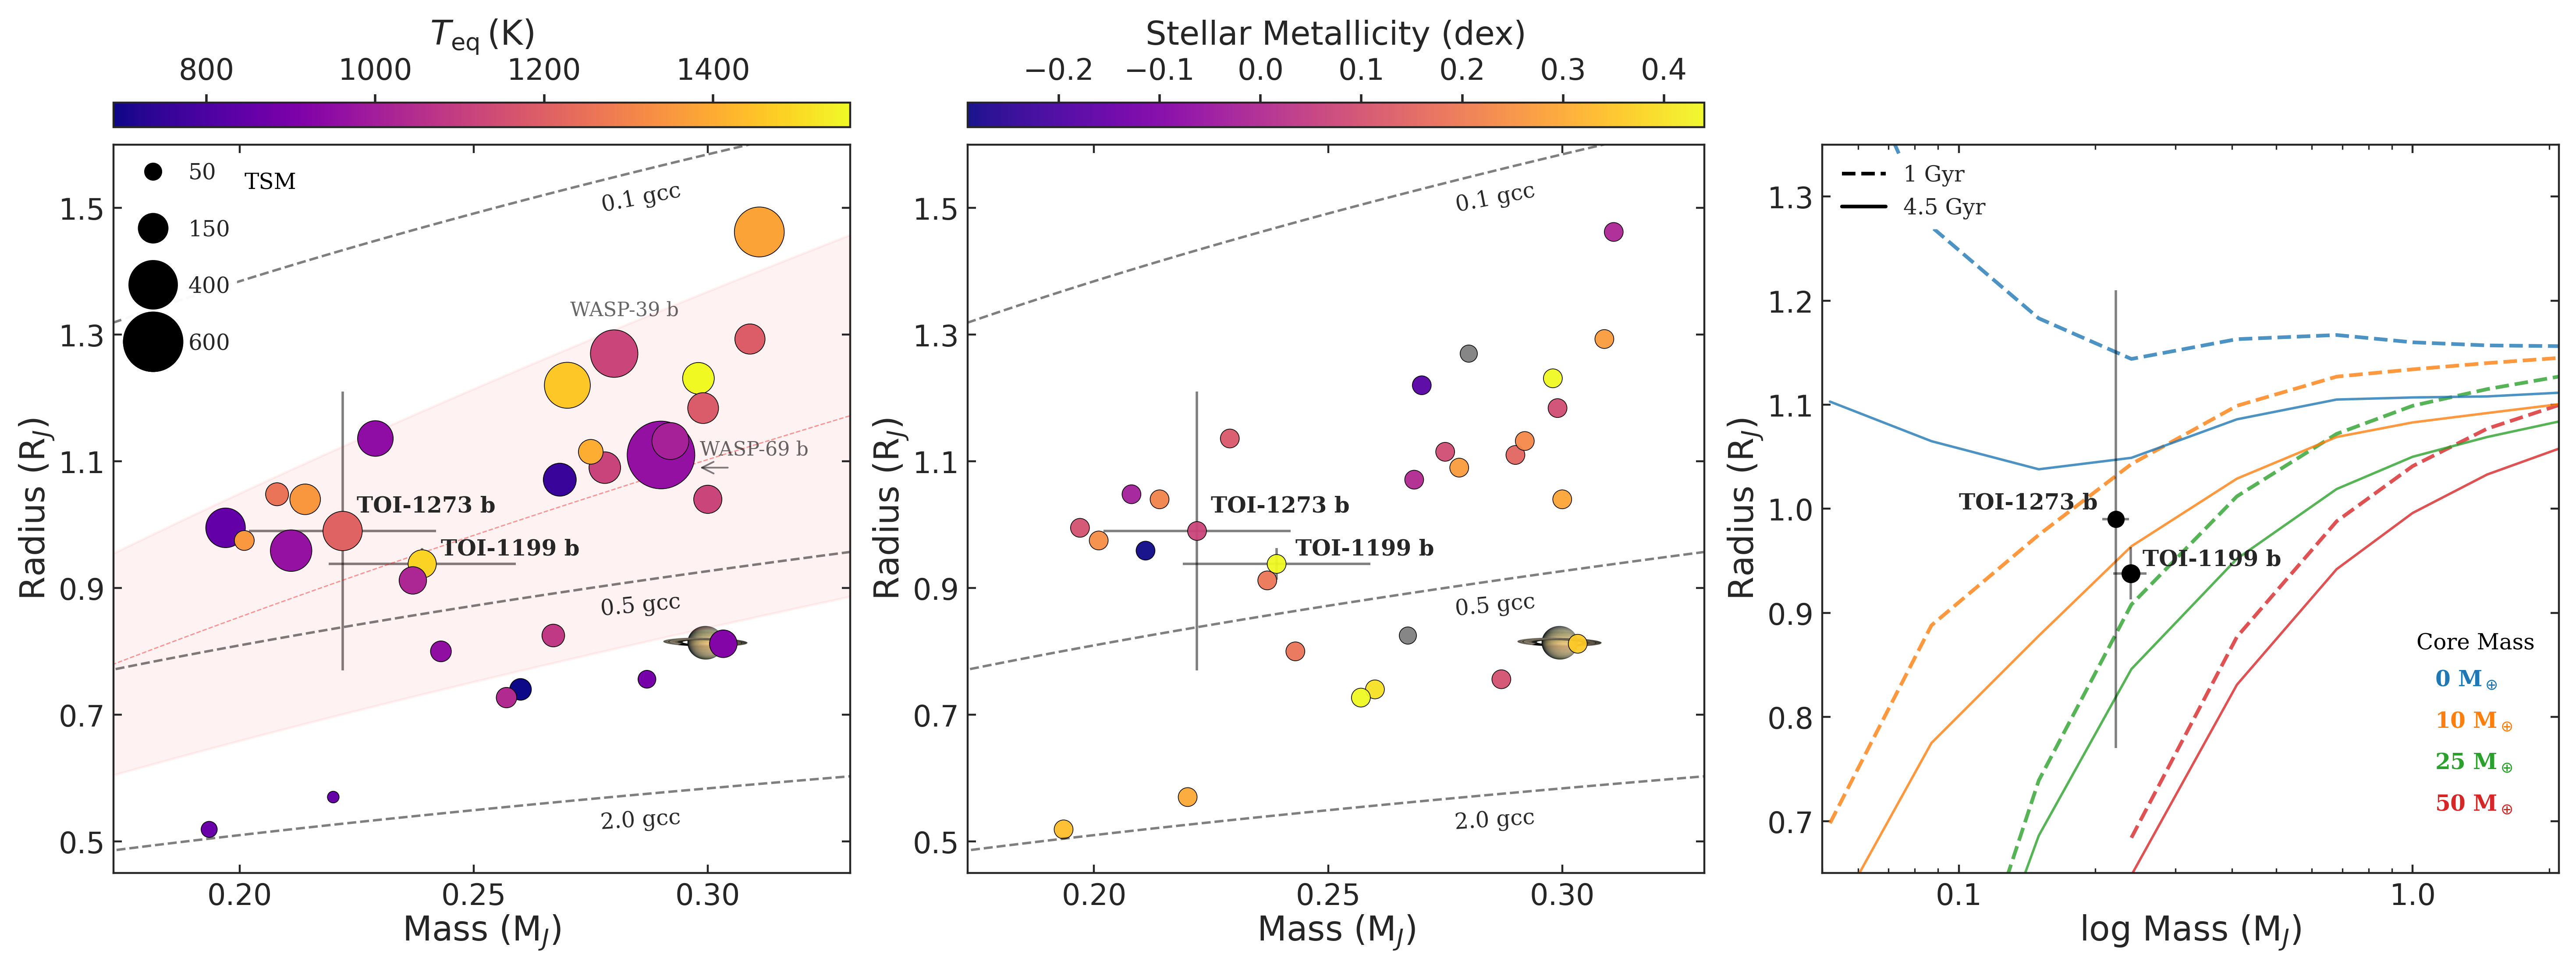
We also compared the mass and radius of our planets to the mass-radius predictions for giant irradiated planets by Fortney et al. (2007), the right panel of Fig. 11 shows the theoretical models with different core masses and ages at a fixed semimajor axis of 0.045 AU ( for TOI-1199 b and for TOI-1273 b). These models assume a heavy elements solid core and a H/He envelope. While the large uncertainty on the radius of TOI-1273 b makes poor the comparison with the models, we see that for the radius, mass and age ( Gyr) of TOI-1199 b, the planet is best described by a structure with a core mass between 10 and 25 M♁.
4.2 Position in the Neptunian desert
The lack of Neptune-sized planets in closed-in orbits is known as Neptunian desert, whose boundaries were determined by Mazeh et al. (2016). Since the principal methods of exoplanet detection should be highly efficient to detect this kind of object, explaining the origin of the desert is an intriguing subject of investigation in the field. It represents an opportunity to explore the possible underlying physical processes that cause it. In Fig. 12 we show the position of TOI-1199 b and TOI-1273 b within the mass-period (top) and radius-period (bottom) boundaries. Owen & Lai (2018) argue that the lower boundary can be explained by photoevaporation, while the upper boundary is supposed to be caused by high eccentricity migration followed by tidal disruption. But Thorngren et al. (2023) arrive at a slightly different conclusion, where photoevaporation can account at least partially on carving out the upper boundary. Mass loss rates have been surveyed on gas giants at the edges of the desert to probe the different paths on planet formation and evolution that lead to the observed population. For instance, Vissapragada et al. (2022) find stability against photoevaporation on a sample of seven planets (with six in the upper edge). They conclude that other mechanisms must be responsibly for the upper edge of the desert. While this discussion is out of the scope of this work, we provide two new hot Saturns on the upper edge with masses determined to better than 10% precision, which will be useful for future studies on the functional dependence of the upper boundary on stellar and planetary properties.
4.3 Transmission spectroscopy metric
The low densities of these planets indicate the presence of gaseous envelopes, which combined with the bright target stars ( 11 mag) makes the prospect of atmospheric characterization worth examining. We calculated their transmission spectroscopy metric131313The TSM is defined in the sub-Jovian population for radius between 4 and 10 R♁. We extrapolated this to the slightly larger than 10 R♁ radii of our planets. (TSM; Kempton et al. 2018) obtaining a value of 134 17 for TOI-1199 b and 261 175 for TOI-1273 b. The large uncertainty for TOI-1273 b comes from TSM , and for this target the metric is overestimated given that as a cause of the grazing transit not all its atmosphere transits the star. However, the value for TOI-1199 b is well determined and is above the threshold of 90 set by Kempton et al. (2018) for sub-Jovians to be considered high quality atmospheric characterization targets.
5 Conclusions
In this work we have reported the discovery and characterization of two new transiting hot Saturns orbiting the nearby and bright G-type stars TOI-1199 and TOI-1273, located at 247.0 pc and 176.0 pc from the Sun, respectively. The joint analysis of TESS and ground-based photometry and RVs from SOPHIE spectroscopic follow-up allowed the validation of the planets and the determination of their orbital and physical properties. TOI-1199 b orbits its host star in a circular compatible orbit ( 0.030 0.029) with a period of 3.67 d and has a mass of 0.239 0.020 MJ and a radius of 0.938 0.025 RJ, giving it a bulk density of = 0.358 0.041 g cm-3. TOI-1273 b is also in a circular compatible orbit ( = 0.055 0.032) with a period of 4.63 d; it has a mass of 0.222 0.015 MJ and a radius of 0.99 0.22 RJ, for a bulk density of = 0.28 0.11 g cm-3. The bulk densities of the two planets are among the lowest known for their kind. This and the fact that they orbit bright stars and have deep transits makes them interesting candidates for future atmospheric studies. TOI-1273 b now has a high uncertainty in its radius, which translates to poor constraints on its inferred bulk density, composition, and TSM. TOI-1199 b, on the other hand, is a solid candidate, with a TSM of 134 17 and in orbit around a high-metallicity host star.
Acknowledgements.
We thank the Observatoire de Haute-Provence (CNRS) staff for their support. This work was supported by the “Programme national de planétologie” (PNP) of CNRS/INSU and CNES.This article is based on observations made with the MuSCAT2 instrument, developed by ABC, at Telescopio Carlos Sánchez operated on the island of Tenerife by the IAC in the Spanish Observatorio del Teide. This work is partly financed by the Spanish Ministry of Economics and Competitiveness through grants PGC2018-098153-B-C31.
This work is partly supported by JSPS KAKENHI Grant Numbers JP17H04574, JP18H01265, and JP18H05439, Grant-in-Aid for JSPS Fellows Grant Number JP20J21872, JST PRESTO Grant Number JPMJPR1775, and a University Research Support Grant from the National Astronomical Observatory of Japan (NAOJ).
This research has made use of the Exoplanet Follow-up Observation Program (ExoFOP; DOI: 10.26134/ExoFOP5) website, which is operated by the California Institute of Technology, under contract with the National Aeronautics and Space Administration under the Exoplanet Exploration Program.
Funding for the TESS mission is provided by NASA’s Science Mission Directorate. KAC acknowledge support from the TESS mission via subaward s3449 from MIT.
Antonio Frasca acknowledges the support from Italian Ministero dell’Universitá e Ricerca through the project PRIN-INAF 2019 “Spectroscopically Tracing the Disk Dispersal Evolution”.
This work made use of tpfplotter by J. Lillo-Box (publicly available in www.github.com/jlillo/tpfplotter), which also made use of the python packages astropy, lightkurve, matplotlib and numpy.
Some of the observations in this paper made use of the High-Resolution Imaging instrument ‘Alopeke and were obtained under Gemini LLP Proposal Number: GN/S-2021A-LP-105. ‘Alopeke was funded by the NASA Exoplanet Exploration Program and built at the NASA Ames Research Center by Steve B. Howell, Nic Scott, Elliott P. Horch, and Emmett Quigley. ‘Alopeke was mounted on the Gemini North telescope of the international Gemini Observatory, a program of NSF’s OIR Lab, which is managed by the Association of Universities for Research in Astronomy (AURA) under a cooperative agreement with the National Science Foundation. on behalf of the Gemini partnership: the National Science Foundation (United States), National Research Council (Canada), Agencia Nacional de Investigación y Desarrollo (Chile), Ministerio de Ciencia, Tecnología e Innovación (Argentina), Ministério da Ciência, Tecnologia, Inovações e Comunicações (Brazil), and Korea Astronomy and Space Science Institute (Republic of Korea).
E.M. acknowledges funding from FAPEMIG under project number APQ-02493-22 and research productivity grant number 309829/2022-4 awarded by the CNPq, Brazil.
We acknowledge funding from the French National Research Agency (ANR) under contract number ANR-18-CE31-0019 (SPlaSH).
We acknowledge funding from the French National Research Agency in the framework of the Investissements d Avenir program (ANR-15-IDEX-02), through the funding of the “Origin of Life” project of the Grenoble-Alpes University.
NCS was acknowledges the funding by the European Union (ERC, FIERCE, 101052347). Views and opinions expressed are however those of the author(s) only and do not necessarily reflect those of the European Union or the European Research Council. Neither the European Union nor the granting authority can be held responsible for them. This work was supported by FCT - Fundação para a Ciência e a Tecnologia through national funds and by FEDER through COMPETE2020 - Programa Operacional Competitividade e Internacionalização by these grants: UIDB/04434/2020; UIDP/04434/2020.
This paper made use of data collected by the TESS mission and are publicly available from the Mikulski Archive for Space Telescopes (MAST) operated by the Space Telescope Science Institute (STScI). Funding for the TESS mission is provided by NASA’s Science Mission Directorate. We acknowledge the use of public TESS data from pipelines at the TESS Science Office and at the TESS Science Processing Operations Center. Resources supporting this work were provided by the NASA High-End Computing (HEC) Program through the NASA Advanced Supercomputing (NAS) Division at Ames Research Center for the production of the SPOC data products.
References
- Aller et al. (2020) Aller, A., Lillo-Box, J., Jones, D., Miranda, L. F., & Barceló Forteza, S. 2020, A&A, 635, A128
- Anderson et al. (2011) Anderson, D. R., Collier Cameron, A., Hellier, C., et al. 2011, ApJ, 726, L19
- Astropy Collaboration et al. (2022) Astropy Collaboration, Price-Whelan, A. M., Lim, P. L., et al. 2022, ApJ, 935, 167
- Bailer-Jones et al. (2021) Bailer-Jones, C. A. L., Rybizki, J., Fouesneau, M., Demleitner, M., & Andrae, R. 2021, AJ, 161, 147
- Bianchi et al. (2011) Bianchi, L., Herald, J., Efremova, B., et al. 2011, Ap&SS, 335, 161
- Boisse et al. (2010) Boisse, I., Eggenberger, A., Santos, N. C., et al. 2010, A&A, 523, A88
- Bouchy et al. (2013) Bouchy, F., Díaz, R. F., Hébrard, G., et al. 2013, A&A, 549, A49
- Bouchy et al. (2009a) Bouchy, F., Hébrard, G., Udry, S., et al. 2009a, A&A, 505, 853
- Bouchy et al. (2009b) Bouchy, F., Isambert, J., Lovis, C., et al. 2009b, in EAS Publications Series, Vol. 37, EAS Publications Series, ed. P. Kern, 247–253
- Buchhave et al. (2010) Buchhave, L. A., Bakos, G. Á., Hartman, J. D., et al. 2010, ApJ, 720, 1118
- Buchhave et al. (2014) Buchhave, L. A., Bizzarro, M., Latham, D. W., et al. 2014, Nature, 509, 593
- Buchhave et al. (2012) Buchhave, L. A., Latham, D. W., Johansen, A., et al. 2012, Nature, 486, 375
- Caldwell et al. (2020) Caldwell, D. A., Tenenbaum, P., Twicken, J. D., et al. 2020, Research Notes of the American Astronomical Society, 4, 201
- Charbonneau et al. (2005) Charbonneau, D., Allen, L., Burrows, A., Megeath, T., & Torres, G. 2005, Direct Study of Exoplanet Thermal Emission, Spitzer Proposal ID 20523
- Charbonneau et al. (2002) Charbonneau, D., Brown, T. M., Noyes, R. W., & Gilliland, R. L. 2002, ApJ, 568, 377
- Ciardi et al. (2015) Ciardi, D. R., Beichman, C. A., Horch, E. P., & Howell, S. B. 2015, ApJ, 805, 16
- Collins (2019) Collins, K. 2019, in American Astronomical Society Meeting Abstracts, Vol. 233, American Astronomical Society Meeting Abstracts #233, 140.05
- Collins et al. (2018) Collins, K., Quinn, S. N., Latham, D. W., et al. 2018, in American Astronomical Society Meeting Abstracts, Vol. 231, American Astronomical Society Meeting Abstracts #231, 439.08
- Collins et al. (2017) Collins, K. A., Kielkopf, J. F., Stassun, K. G., & Hessman, F. V. 2017, AJ, 153, 77
- Courcol et al. (2015) Courcol, B., Bouchy, F., Pepe, F., et al. 2015, A&A, 581, A38
- Cutri et al. (2003) Cutri, R. M., Skrutskie, M. F., van Dyk, S., et al. 2003, VizieR Online Data Catalog, II/246
- Cutri et al. (2021) Cutri, R. M., Wright, E. L., Conrow, T., et al. 2021, VizieR Online Data Catalog, II/328
- Enoch et al. (2012) Enoch, B., Collier Cameron, A., & Horne, K. 2012, A&A, 540, A99
- Fűrész (2008) Fűrész, G. 2008, PhD thesis, University of Szeged, Hungary
- Foreman-Mackey et al. (2021) Foreman-Mackey, D., Luger, R., Agol, E., et al. 2021, The Journal of Open Source Software, 6, 3285
- Fortney et al. (2007) Fortney, J. J., Marley, M. S., & Barnes, J. W. 2007, ApJ, 659, 1661
- Furlan & Howell (2017) Furlan, E. & Howell, S. B. 2017, AJ, 154, 66
- Furlan & Howell (2020) Furlan, E. & Howell, S. B. 2020, ApJ, 898, 47
- Gaia Collaboration et al. (2023) Gaia Collaboration, Vallenari, A., Brown, A. G. A., et al. 2023, A&A, 674, A1
- Gelman et al. (2013) Gelman, A., Carlin, J., Stern, H., et al. 2013, Bayesian Data Analysis, Third Edition, Chapman & Hall/CRC Texts in Statistical Science (Taylor & Francis)
- Guerrero et al. (2021) Guerrero, N. M., Seager, S., Huang, C. X., et al. 2021, ApJS, 254, 39
- Hébrard et al. (2008) Hébrard, G., Bouchy, F., Pont, F., et al. 2008, A&A, 488, 763
- Heidari et al. (2024) Heidari, N., Boisse, I., Hara, N. C., et al. 2024, A&A, 681, A55
- Heidari et al. (2022) Heidari, N., Boisse, I., Orell-Miquel, J., et al. 2022, A&A, 658, A176
- Henden et al. (2015) Henden, A. A., Levine, S., Terrell, D., & Welch, D. L. 2015, in American Astronomical Society Meeting Abstracts, Vol. 225, American Astronomical Society Meeting Abstracts #225, 336.16
- Hoffman & Gelman (2011) Hoffman, M. D. & Gelman, A. 2011, arXiv e-prints, arXiv:1111.4246
- Howell et al. (2011) Howell, S. B., Everett, M. E., Sherry, W., Horch, E., & Ciardi, D. R. 2011, AJ, 142, 19
- Howell & Furlan (2022) Howell, S. B. & Furlan, E. 2022, Frontiers in Astronomy and Space Sciences, 9, 871163
- Howell et al. (2021) Howell, S. B., Scott, N. J., Matson, R. A., et al. 2021, Frontiers in Astronomy and Space Sciences, 8, 10
- Huang et al. (2020a) Huang, C. X., Vanderburg, A., Pál, A., et al. 2020a, Research Notes of the American Astronomical Society, 4, 204
- Huang et al. (2020b) Huang, C. X., Vanderburg, A., Pál, A., et al. 2020b, Research Notes of the American Astronomical Society, 4, 206
- Husser et al. (2013) Husser, T. O., Wende-von Berg, S., Dreizler, S., et al. 2013, A&A, 553, A6
- Jenkins (2002) Jenkins, J. M. 2002, ApJ, 575, 493
- Jenkins et al. (2010a) Jenkins, J. M., Borucki, W. J., Koch, D. G., et al. 2010a, ApJ, 724, 1108
- Jenkins et al. (2010b) Jenkins, J. M., Chandrasekaran, H., McCauliff, S. D., et al. 2010b, in Society of Photo-Optical Instrumentation Engineers (SPIE) Conference Series, Vol. 7740, Software and Cyberinfrastructure for Astronomy, ed. N. M. Radziwill & A. Bridger, 77400D
- Jenkins et al. (2020) Jenkins, J. M., Tenenbaum, P., Seader, S., et al. 2020, Kepler Data Processing Handbook: Transiting Planet Search, Kepler Science Document KSCI-19081-003
- Jenkins et al. (2016) Jenkins, J. M., Twicken, J. D., McCauliff, S., et al. 2016, in Society of Photo-Optical Instrumentation Engineers (SPIE) Conference Series, Vol. 9913, Software and Cyberinfrastructure for Astronomy IV, ed. G. Chiozzi & J. C. Guzman, 99133E
- Jensen (2013) Jensen, E. 2013, Tapir: A web interface for transit/eclipse observability, Astrophysics Source Code Library
- Kempton et al. (2018) Kempton, E. M. R., Bean, J. L., Louie, D. R., et al. 2018, PASP, 130, 114401
- Khalafinejad et al. (2021) Khalafinejad, S., Molaverdikhani, K., Blecic, J., et al. 2021, A&A, 656, A142
- Kipping (2013) Kipping, D. M. 2013, MNRAS, 435, 2152
- Kovács et al. (2016) Kovács, G., Zucker, S., & Mazeh, T. 2016, BLS: Box-fitting Least Squares, Astrophysics Source Code Library, record ascl:1607.008
- Kurucz (1993) Kurucz, R. L. 1993, SYNTHE spectrum synthesis programs and line data
- Lampón et al. (2023) Lampón, M., López-Puertas, M., Sanz-Forcada, J., et al. 2023, A&A, 673, A140
- Lester et al. (2021) Lester, K. V., Matson, R. A., Howell, S. B., et al. 2021, AJ, 162, 75
- Li et al. (2019) Li, J., Tenenbaum, P., Twicken, J. D., et al. 2019, PASP, 131, 024506
- Lightkurve Collaboration et al. (2018) Lightkurve Collaboration, Cardoso, J. V. d. M., Hedges, C., et al. 2018, Lightkurve: Kepler and TESS time series analysis in Python, Astrophysics Source Code Library, record ascl:1812.013
- Mamajek & Hillenbrand (2008) Mamajek, E. E. & Hillenbrand, L. A. 2008, ApJ, 687, 1264
- Matson et al. (2018) Matson, R. A., Howell, S. B., Horch, E. P., & Everett, M. E. 2018, AJ, 156, 31
- Mazeh et al. (2016) Mazeh, T., Holczer, T., & Faigler, S. 2016, A&A, 589, A75
- Müller et al. (2013) Müller, H. M., Huber, K. F., Czesla, S., Wolter, U., & Schmitt, J. H. M. M. 2013, A&A, 560, A112
- Narita et al. (2019) Narita, N., Fukui, A., Kusakabe, N., et al. 2019, Journal of Astronomical Telescopes, Instruments, and Systems, 5, 015001
- Otegi et al. (2020) Otegi, J. F., Bouchy, F., & Helled, R. 2020, A&A, 634, A43
- Ouyang et al. (2023) Ouyang, Q., Wang, W., Zhai, M., et al. 2023, MNRAS, 521, 5860
- Owen & Lai (2018) Owen, J. E. & Lai, D. 2018, MNRAS, 479, 5012
- Parmentier & Crossfield (2018) Parmentier, V. & Crossfield, I. J. M. 2018, in Handbook of Exoplanets, ed. H. J. Deeg & J. A. Belmonte, 116
- Parviainen (2018) Parviainen, H. 2018, in Handbook of Exoplanets, ed. H. J. Deeg & J. A. Belmonte, 149
- Parviainen et al. (2019) Parviainen, H., Tingley, B., Deeg, H. J., et al. 2019, A&A, 630, A89
- Perruchot et al. (2008) Perruchot, S., Kohler, D., Bouchy, F., et al. 2008, in Society of Photo-Optical Instrumentation Engineers (SPIE) Conference Series, Vol. 7014, Ground-based and Airborne Instrumentation for Astronomy II, ed. I. S. McLean & M. M. Casali, 70140J
- Pollacco et al. (2008) Pollacco, D., Skillen, I., Collier Cameron, A., et al. 2008, MNRAS, 385, 1576
- Queloz et al. (2001) Queloz, D., Henry, G. W., Sivan, J. P., et al. 2001, A&A, 379, 279
- Ricker et al. (2015) Ricker, G. R., Winn, J. N., Vanderspek, R., et al. 2015, Journal of Astronomical Telescopes, Instruments, and Systems, 1, 014003
- Rustamkulov et al. (2023) Rustamkulov, Z., Sing, D. K., Mukherjee, S., et al. 2023, Nature, 614, 659
- Salvatier et al. (2016) Salvatier, J., Wieckiâ, T. V., & Fonnesbeck, C. 2016, PyMC3: Python probabilistic programming framework, Astrophysics Source Code Library, record ascl:1610.016
- Santos et al. (2013) Santos, N. C., Sousa, S. G., Mortier, A., et al. 2013, A&A, 556, A150
- Schlegel et al. (1998) Schlegel, D. J., Finkbeiner, D. P., & Davis, M. 1998, ApJ, 500, 525
- Scott et al. (2021) Scott, N. J., Howell, S. B., Gnilka, C. L., et al. 2021, Frontiers in Astronomy and Space Sciences, 8, 138
- Smith et al. (2012) Smith, J. C., Stumpe, M. C., Van Cleve, J. E., et al. 2012, PASP, 124, 1000
- Sneden (1973) Sneden, C. A. 1973, PhD thesis, University of Texas, Austin
- Sousa (2014) Sousa, S. G. 2014, in Determination of Atmospheric Parameters of B, 297–310
- Sousa et al. (2021) Sousa, S. G., Adibekyan, V., Delgado-Mena, E., et al. 2021, A&A, 656, A53
- Sousa et al. (2015) Sousa, S. G., Santos, N. C., Adibekyan, V., Delgado-Mena, E., & Israelian, G. 2015, A&A, 577, A67
- Sousa et al. (2007) Sousa, S. G., Santos, N. C., Israelian, G., Mayor, M., & Monteiro, M. J. P. F. G. 2007, A&A, 469, 783
- Sousa et al. (2008) Sousa, S. G., Santos, N. C., Mayor, M., et al. 2008, A&A, 487, 373
- Stassun et al. (2017) Stassun, K. G., Collins, K. A., & Gaudi, B. S. 2017, AJ, 153, 136
- Stassun et al. (2019) Stassun, K. G., Oelkers, R. J., Paegert, M., et al. 2019, AJ, 158, 138
- Stassun & Torres (2016) Stassun, K. G. & Torres, G. 2016, AJ, 152, 180
- Stassun & Torres (2018) Stassun, K. G. & Torres, G. 2018, ApJ, 862, 61
- Stassun & Torres (2021) Stassun, K. G. & Torres, G. 2021, ApJ, 907, L33
- Stumpe et al. (2014) Stumpe, M. C., Smith, J. C., Catanzarite, J. H., et al. 2014, PASP, 126, 100
- Stumpe et al. (2012) Stumpe, M. C., Smith, J. C., Van Cleve, J. E., et al. 2012, PASP, 124, 985
- Thorngren et al. (2023) Thorngren, D. P., Lee, E. J., & Lopez, E. D. 2023, ApJ, 945, L36
- Torres et al. (2010) Torres, G., Andersen, J., & Giménez, A. 2010, A&A Rev., 18, 67
- Triaud (2018) Triaud, A. H. M. J. 2018, in Handbook of Exoplanets, ed. H. J. Deeg & J. A. Belmonte, 2
- Twicken et al. (2018) Twicken, J. D., Catanzarite, J. H., Clarke, B. D., et al. 2018, PASP, 130, 064502
- Vissapragada et al. (2022) Vissapragada, S., Knutson, H. A., Greklek-McKeon, M., et al. 2022, AJ, 164, 234
- Zechmeister & Kürster (2009) Zechmeister, M. & Kürster, M. 2009, A&A, 496, 577
Appendix A SOPHIE spectroscopy
In this appendix we present the RVs and BISs time series derived from SOPHIE spectroscopy for TOI-1199 and TOI-1273.
| Time (RJD) | RV () | () | BIS () |
|---|---|---|---|
| 58856.67683 | -18.8804 | 0.0048 | 0.0276 |
| 58860.5179 | -18.8711 | 0.0045 | 0.0204 |
| 58885.63826 | -18.8963 | 0.0048 | 0.0301 |
| 58887.55416 | -18.8517 | 0.0046 | 0.0187 |
| 58916.45412 | -18.8075 | 0.005 | 0.0046 |
| 59170.69638 | -18.8745 | 0.0044 | 0.0177 |
| 59183.71984 | -18.8631 | 0.0044 | 0.0141 |
| 59205.70776 | -18.8713 | 0.0044 | 0.0355 |
| 59206.69469 | -18.8512 | 0.0045 | 0.0239 |
| 59245.58813 | -18.8895 | 0.0045 | 0.0108 |
| 59247.64243 | -18.8481 | 0.0045 | 0.0408 |
| 59269.48441 | -18.8618 | 0.0045 | -0.012 |
| 59273.59262 | -18.8602 | 0.005 | 0.0741 |
| 59274.53395 | -18.896 | 0.0044 | 0.0057 |
| 59275.47408 | -18.8653 | 0.0045 | 0.0165 |
| 59277.58059 | -18.8678 | 0.0055 | 0.0402 |
| 59278.53871 | -18.8715 | 0.0044 | 0.0073 |
| 59279.57273 | -18.8369 | 0.0044 | -0.0002 |
| 59281.45623 | -18.8851 | 0.0048 | 0.0015 |
| 59303.45183 | -18.8889 | 0.0042 | 0.0073 |
| 59304.50004 | -18.8776 | 0.0043 | 0.0394 |
| 59305.56791 | -18.8411 | 0.0043 | 0.0138 |
| 59328.45107 | -18.8446 | 0.0042 | -0.0008 |
| 59329.43209 | -18.9104 | 0.0042 | -0.0121 |
| 59336.40591 | -18.8868 | 0.0056 | 0.0263 |
| 59337.46274 | -18.898 | 0.0046 | 0.0007 |
| 59340.39023 | -18.8957 | 0.0043 | 0.0225 |
| 59347.34985 | -18.8854 | 0.0044 | 0.0101 |
| 59348.45563 | -18.8869 | 0.0044 | 0.0134 |
| 59362.45989 | -18.9015 | 0.0041 | -0.0016 |
| 59392.37132 | -18.8889 | 0.0042 | 0.0195 |
| 59396.37382 | -18.8762 | 0.0049 | 0.0264 |
| 59532.6603 | -18.8697 | 0.0045 | 0.0153 |
| 59549.69237 | -18.914 | 0.0044 | 0.0317 |
| 59553.67898 | -18.8947 | 0.0048 | 0.0367 |
| 59561.64096 | -18.8762 | 0.0045 | -0.0102 |
| 59562.64694 | -18.8377 | 0.0043 | 0.008 |
| 59564.64881 | -18.896 | 0.0044 | 0.031 |
| 59565.6739 | -18.8801 | 0.0044 | 0.0167 |
| 59566.694 | -18.846 | 0.0045 | 0.0206 |
| 59568.64331 | -18.8907 | 0.0044 | 0.0109 |
| 59569.68166 | -18.8597 | 0.0044 | 0.0128 |
| 59570.62985 | -18.8421 | 0.0044 | 0.0068 |
| 59586.6029 | -18.894 | 0.0049 | 0.031 |
| 59590.6365 | -18.8931 | 0.0055 | 0.0276 |
| 59598.60044 | -18.8624 | 0.0049 | -0.0038 |
| 59605.52642 | -18.8963 | 0.0041 | 0.0025 |
| 59606.52812 | -18.8585 | 0.0044 | -0.0025 |
| 59609.63379 | -18.8675 | 0.0046 | -0.003 |
| 59610.60665 | -18.8436 | 0.0044 | 0.008 |
| 59621.49835 | -18.8536 | 0.0044 | -0.0095 |
| 59628.39137 | -18.8447 | 0.0052 | 0.0025 |
| 59660.4856 | -18.8876 | 0.0044 | -0.0382 |
| 59662.55404 | -18.852 | 0.0044 | 0.0103 |
| 59663.49547 | -18.9 | 0.0044 | 0.003 |
| 59684.46197 | -18.8148 | 0.0045 | 0.0341 |
| 59685.48672 | -18.8765 | 0.0045 | 0.0453 |
| 59686.54289 | -18.8943 | 0.0044 | 0.019 |
| 59732.37275 | -18.8732 | 0.0044 | 0.0075 |
| 59749.39015 | -18.8607 | 0.0055 | -0.0128 |
| Time (RJD) | RV () | () | BIS () |
|---|---|---|---|
| 58887.60797 | -43.7134 | 0.0061 | 0.0194 |
| 58916.47664 | -43.7684 | 0.0091 | 0.0177 |
| 58917.69296 | -43.7675 | 0.007 | -0.021 |
| 58918.52127 | -43.7312 | 0.0061 | -0.0006 |
| 58919.564 | -43.7317 | 0.0097 | -0.0693 |
| 59006.43351 | -43.7241 | 0.0049 | 0.0023 |
| 59016.42816 | -43.7102 | 0.0065 | -0.039 |
| 59017.45233 | -43.7216 | 0.006 | -0.0122 |
| 59018.44308 | -43.7682 | 0.0057 | 0.0239 |
| 59019.42139 | -43.7704 | 0.0051 | -0.0044 |
| 59020.42867 | -43.7383 | 0.007 | 0.0246 |
| 59056.37566 | -43.7588 | 0.0047 | -0.005 |
| 59057.40103 | -43.7449 | 0.0039 | -0.016 |
| 59058.35427 | -43.7246 | 0.0045 | -0.0002 |
| 59059.36318 | -43.7301 | 0.0047 | -0.0218 |
| 59060.3913 | -43.7657 | 0.004 | 0.0047 |
| 59061.36421 | -43.7588 | 0.004 | -0.0018 |
| 59062.36612 | -43.7381 | 0.0045 | 0.0168 |
| 59081.34487 | -43.7223 | 0.0043 | 0.013 |
| 59083.32672 | -43.775 | 0.004 | 0.0116 |
| 59107.30036 | -43.7707 | 0.0064 | 0.0601 |
| 59139.24583 | -43.782 | 0.0045 | -0.0117 |
| 59140.2521 | -43.7452 | 0.0043 | -0.0021 |
| 59141.24915 | -43.728 | 0.0047 | 0.0004 |
| 59149.24854 | -43.7615 | 0.0091 | -0.0054 |
| 59197.71414 | -43.7166 | 0.0039 | 0.0117 |
| 59245.61019 | -43.7788 | 0.006 | 0.0123 |
| 59247.72159 | -43.7247 | 0.0042 | -0.0004 |
| 59248.6658 | -43.7171 | 0.0041 | 0.0167 |
| 59270.57337 | -43.7374 | 0.0041 | 0.0232 |
| 59273.66344 | -43.7624 | 0.0072 | -0.0315 |
| 59275.55137 | -43.7283 | 0.0041 | -0.0091 |
| 59278.55668 | -43.7879 | 0.0057 | 0.0227 |
| 59279.59967 | -43.7529 | 0.0058 | 0.0082 |
| 59280.62091 | -43.7203 | 0.0047 | 0.0286 |
| 59303.46737 | -43.7274 | 0.0041 | 0.0067 |
| 59304.51413 | -43.7263 | 0.004 | 0.0085 |
| 59306.54667 | -43.774 | 0.0045 | -0.0135 |
| 59327.50658 | -43.7152 | 0.0043 | 0.0117 |
| 59329.47453 | -43.7751 | 0.0049 | 0.0172 |
| 59404.40218 | -43.7568 | 0.0064 | 0.0054 |
| 59561.70916 | -43.7554 | 0.0047 | 0.0115 |
| 59563.71468 | -43.7232 | 0.0047 | 0.0275 |
| 59565.71437 | -43.768 | 0.0045 | 0.0052 |
| 59567.70234 | -43.7269 | 0.0041 | 0.0186 |
| 59568.7174 | -43.723 | 0.0043 | 0.0087 |
| 59569.6996 | -43.7594 | 0.0045 | 0.0076 |
| 59570.69963 | -43.759 | 0.0049 | -0.0022 |
| 59628.55175 | -43.7488 | 0.0068 | 0.023 |
| 59630.6354 | -43.7975 | 0.0093 | 0.0165 |
| 59660.57446 | -43.694 | 0.0052 | 0.0033 |
| 59662.57218 | -43.7603 | 0.0044 | 0.0123 |
| 59663.51279 | -43.7688 | 0.0043 | -0.0216 |
| 59683.51875 | -43.7194 | 0.0046 | 0.0259 |
| 59686.63687 | -43.7614 | 0.0087 | 0.0486 |
| 59715.42352 | -43.7264 | 0.0043 | -0.0087 |
| 59771.39786 | -43.741 | 0.0058 | -0.015 |
| 59783.4065 | -43.7572 | 0.0058 | 0.0004 |
| 59785.43504 | -43.7288 | 0.0047 | -0.0059 |
| 59787.39647 | -43.7698 | 0.0071 | -0.0258 |
Appendix B Prior distributions and posterior values
In this appendix we present the prior distributions used in each model and the resulting values from the MCMC sampling of the posterior distributions for the fitted and derived parameters.
| TOI-1199 b | TOI-1273 b | |||
| Parameter | Prior | Posterior | Prior | Posterior |
| Stellar parameters | ||||
| (M⊙) | ||||
| (R⊙) | ||||
| TESS q1 | ||||
| TESS q2 | ||||
| KeplerCamB q1 | ||||
| KeplerCamB q2 | ||||
| KeplerCamz q1 | – | – | ||
| KeplerCamz q2 | – | – | ||
| MusCAT2g q1 | – | – | ||
| MusCAT2g q2 | – | – | ||
| MusCAT2i q1 | – | – | ||
| MusCAT2i q2 | – | – | ||
| MusCAT2r q1 | – | – | ||
| MusCAT2r q2 | – | – | ||
| MusCAT2zs q1 | – | – | ||
| MusCAT2zs q2 | – | – | ||
| Planetary parameters | ||||
| (days) | ||||
| (TBJD) | ||||
| (m s-1) | ||||
| (MJ) | (derived) | (derived) | ||
| (RJ) | (derived) | (derived) | ||
| (derived) | (derived) | |||
| (AU) | (derived) | (derived) | ||
| (g cm-3) | (derived) | (derived) | ||
| (K) | (derived) | (derived) | ||
| (rad) | (derived) | (derived) | ||
| TOI-1199 b | TOI-1273 b | |||
| Parameter | Prior | Posterior | Prior | Posterior |
| Instrumental parameters | ||||
| RV jitter (m s-1) | ||||
| RV trend 2 | ||||
| RV trend 1 | ||||
| RV trend 0 | ||||
| TESS2 offset | ||||
| TESS2 jitter | ||||
| TESS30 offset | ||||
| TESS30 jitter | ||||
| KeplerCamB offset | ||||
| KeplerCamB jitter | ||||
| KeplerCamz offset | – | – | ||
| KeplerCamz jitter | – | – | ||
| MusCAT2g offset | – | – | ||
| MusCAT2g jitter | – | – | ||
| MusCAT2r offset | – | – | ||
| MusCAT2r jitter | – | – | ||
| MusCAT2i offset | – | – | ||
| MusCAT2i jitter | – | – | ||
| MusCAT2zs offset | – | – | ||
| MusCAT2zs jitter | – | – | ||
Appendix C Posterior distribution plots
In this this appendix we show the MCMC samples through corner plots for the posterior distributions of the planetary parameters.
Appendix D Additional light curves
In this appendix we show the ground light curves that were not used in the model.