Comparing skill of historical rainfall data based monsoon rainfall prediction in India with NCEP-NWP forecasts
Abstract
In this draft we consider the problem of forecasting rainfall across India during the four monsoon months, one day as well as three days in advance. We train neural networks using historical daily gridded precipitation data for India obtained from IMD for the time period , at a spatial resolution of . This is compared with the numerical weather prediction (NWP) forecasts obtained from NCEP (National Centre for Environmental Prediction) available for the period 2011-2022. We conduct a detailed country wide analysis and separately analyze some of the most populated cities in India. Our conclusion is that forecasts obtained by applying deep learning to historical rainfall data are more accurate compared to NWP forecasts as well as predictions based on persistence. On average, compared to our predictions, forecasts from NCEP-NWP model have about 34% higher error for a single day prediction, and over 68% higher error for a three day prediction. Similarly, persistence estimates report a 29% higher error in a single day forecast, and over 54% error in a three day forecast. We further observe that data up to 20 days in the past is useful in reducing errors of one and three day forecasts, when a transformer based learning architecture, and to a lesser extent when an LSTM is used.
A key conclusion suggested by our preliminary analysis is that NWP forecasts can be substantially improved upon through more and diverse data relevant to monsoon prediction combined with carefully selected neural network architecture.
1 Introduction
Accurate rainfall prediction in India during monsoons is crucial for a variety of reasons - for agriculture planning, disaster management, day to day transportation planning and so on. Anecdotally, it is well known that International numerical weather predictors (NWP) do not perform well in rainfall prediction for India (see [1]). On the other hand, it is conjectured that during monsoons, rainfall data across India has spatial-temporal memory so that information on rainfall early on in neighbouring parts may be useful for future rainfall prediction (see [2]).
In this draft, we consider daily gridded precipitation data from India Meteorological Department (IMD) [3] available from , at a spatial resolution of (each degree roughly corresponds to 111 km). We use this to predict rainfall for all of India, one day as well as three days into the future. In addition, we consider the NWP daily and three day forecasts obtained from NCEP (National Centre for Environmental Prediction); see [4]. Data from NCEP is used because it is publically accessible. It also forms the base model for IMD Global Forecasting System (see [5])
We compare and contrast the deep-learning based forecasts generated using historical rainfall data from IMD (referred to as DL-HD forecasts), with the NCEP-NWP forecasts. In an attempt to arrive at improved forecasts, we also combine the NCEP-NWP forecasts with the DL-HD ones, through a simple neural network. Much of the rainfall in India occurs during the four monsoon months June, July, August and September (JJAS), and we focus our forecasts on these.
Our key observations based on forecasts for all of India as well as for 20 most populated cities, are:
-
1.
NCEP-NWP forecasts have a higher error compared to those based upon historical rainfall data (DL-HD forecasts). For all of India, on average, compared to DL-HD, forecasts from NCEP-NWP model have 34.6% higher error for a single day prediction, and 68.6% higher error for a three day prediction.
-
2.
Even forecasts based on persistence (where the rainfall observed on a given day is a forecast for the rainfall the next day, as well as the next three days) often are better than NCEP-NWP forecasts. Persistence estimates for all of India on average, compared to DL-HD, report 29.4% higher error in a single day forecast, and 54.6% error in a three day forecast.
-
3.
NCEP-NWP forecasts can be substantially improved for each region or a grid by pooling the forecasts from the neighbouring grids and feeding them into a neural network as inputs which is then trained to make a forecast for each grid. We call the resulting forecast as NWP+. This reduces the error gap between DL-HD and NWP forecast by about a third for one day forecast and close to half for three day forecasts.
-
4.
We also test to see if DL-HD forecasts can be combined with NWP forecasts to arrive at further improvements in our predictions. We make a negative observation that this combination rarely improves upon those by DL-HD.
-
5.
We compare the ability of different forecasts to warn of heavy rainfall (if the rainfall in a day is above 30 mm, was the forecast higher than 10 mm for 1-day) as well as raise false alarms (if the forecast was above 30 mm, was the actual rainfall less than 10 mm). The lower and upper thresholds for 3-day forecasts are 20 mm and 60 mm respectively. We find that while NCEP-NWP forecasts typically overestimate 1 day rainfall and hence perform better on the first metric (81.1% accuracy), they perform poorly on the false alarm metric (65.6% false alarms). These numbers are more balanced for DL-HD (77.1% and 33.4%, respectively) in comparison to NCEP-NWP as well as other models. For 3-day forecasts, we make a stronger case for DL-HD where it significantly outperforms the other models on the heavy rainfall prediction metric, with 95% accuracy in capturing heavy rainfall, while NCEP-NWP is able to capture only 51.9% of such events. All models show comparable performance in reporting false alarms, but the lowest error is reported by NWP+DL-HD predictions that outperform both DL-HD (35.93%) and NCEP-NWP(37.69%) predictions. We also compute the correlation coeffcient between the different forecasts and IMD Ground truth as in [6]. While DL-HD is well correlated with observed rainfall (0.65 for 1 day forecast, 0.53 for 3 day forecast), these correlations are much lower for NCEP-NWP forecasts (0.24 for 1 day, and 0.32 for 3 day).
-
6.
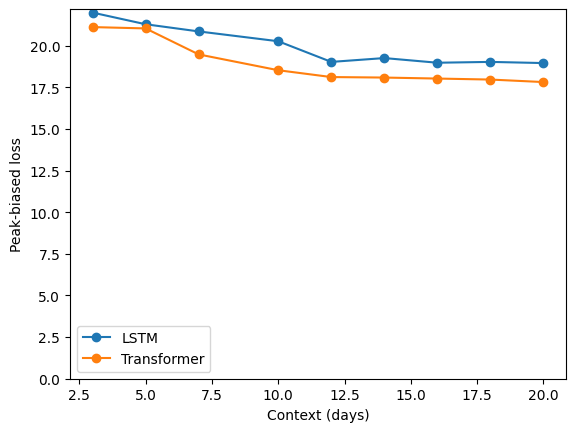
Rainfall in India as recorded by IMD may have long-term memory. The forecasts improve somewhat as the past context corresponding to the historical rainfall data increases from to days, when the transformers based learning architecture is used. The improvement is lesser when Long-Short term memory (LSTM) networks are used.
1.1 Literature Review
Several attempts have been made to predict rainfall using machine learning (ML) techniques. For long-range forecasting of monsoon rainfall in India, Rajeevan et al. [7, 8] employed a host of methods such as multivariate principal component regression, simple neural networks, linear discriminant analysis, ensemble multiple linear regression and projection pursuit regression. They used multimodal data such as air temperature, sea surface temperature, rainfall, air pressure etc. These developments helped support IMD’s two-stage monsoon forecasting system with the first stage forecast given in mid April and an updated second stage forecast given at the end of June.
Kumar et al. [6] conducted a comparative analysis of LSTM models trained using ground-based IMD rainfall data and satellite data from the Tropical Rainfall Measuring Mission for Indian summer monsoon rainfall. They showed correlation coefficients between the observed and predicted rainfall of 0.67 for 1 day and 0.42 for 2 day lead time, respectively, indicating a reasonable skill in short-range precipitation forecasting. However, they observe that the model’s efficiency quickly goes down after 2 days lead time.
Another line of work studies oscillations of weather elements (such as dry spells and active spells of rain, and periods of high and low pressures and temperatures) in monsoons. Goswami and Xavier [2] showed that it is possible to predict dry spells (i.e. periods of scanty rains) in monsoons with a significantly higher lead time of 18 days as compared to 10 days for active spells (i.e. periods of abundant rains). Goswami et al. [9] found a physical mechanism linking Atlantic climate and monsoon, discovering the influence of Atlantic weather oscillations on variability of Indian monsoon on both interdecadal and interannual time scales.
Rao et al. [10] evaluated the skill of NCEP-NWP rainfall forecasts for a few flood-prone basins in India. They observed that as the forecast horizon increased from 1 to 5 days, the bias in rainfall estimation shifted from overestimation to underestimation. They proposed bias correction using a simple multiplicative factor that helped them reduce the mean squared error.
Globally, there has also been an advent of models using sophisticated architectures such as Autoformer [11], GraphCast [12] and ClimaX [13]. Our work adds to the growing literature on using ML for short-term rainfall prediction, primarily using historical IMD data, and benchmarking against NWP forecasts.
2 Data and Experiments
2.1 Data Sources
As mentioned earlier, we use daily gridded precipitation data obtained from IMD [3] spanning the period from 1901 to 2022, at a spatial resolution of . At this resolution, the geographical extent of India is discretized into 357 grids. The NWP benchmark from NCEP is obtained from [4]. It is available more or less on alternate days through the years , capturing about 60% of the days. Thereafter the data is available daily. The NCEP dataset provides gridded forecasts at 6 hour intervals, for three time periods: 1, 2 and 3 days into the future. The spatial resolution of these forecasts is , with predictions recorded as cumulative values over the subsequent 24 hours at 6-hour intervals. Both the datasets are downloaded only for the JJAS months.
2.2 Dataset Preparation
Our analysis focuses on days where both datasets provide forecasts. Specifically, we compare the 6am NCEP forecast for lead time of 1 and 3 days with the corresponding DL-HD forecasts. Note that while both IMD and NCEP datasets share the same spatial resolution of , they are offset to each other by in both latitude and longitude, for example, the IMD reports rainfall for grids whose latitudes and longitudes are multiples of 0.5 deg, for example the coordinates of a sample grid for IMD could be: [(79.5∘, 17.5∘), (80.5∘, 17.5∘), (79.5∘, 18.5∘), (80.5∘, 18.5∘)], while NCEP-NWP reports rainfall prediction for grids having integer coordinates. In order to find the best matching grid for IMD from NCEP-NWP, we first align the two by simply shifting all NWP grids by to the North-West. To establish a correspondence between each IMD grid and its NWP counterpart, we identify the best-matching NWP grid among the aligned set and its 4 surrounding grids, selecting the grid with the lowest forecast error. For DL-HD training, the IMD dataset is partitioned into training and test subsets, covering the periods 1901 to 2011 and 2011 to 2022, respectively. Within the training dataset, individual samples are constructed using a time window approach. Each sample represents contiguous days of rainfall data from all grid points, serving as the input for the model. The corresponding output is the rainfall data for the day at the same grid points.
2.3 Experiments
We outline how forecasts are generated using different models for lead times of 1 and 3 days. All errors are reported for years 2021 and 2022.
-
1.
DL-HD: We generate forecasts for all 357 grids across India using historical rainfall data from IMD, utilizing varying lengths of past information, spanning from 3 to 20 days (). The input dimensions for the models are structured as , capturing the historical rainfall data for all grids over the specified timeframe. The output dimension is 357, representing the forecasted rainfall for the subsequent day at each grid point. This is implemented using two separate architectures, LSTM and Autoformer based (Autoformer has a transformer architecture specifically designed for time series data, as described in [11]). We train the models from 1901 to 2011, while the test forecasts are generated for the subsequent years from 2012 to 2022.
-
2.
NWP: For each grid in the IMD dataset, we identify the best match within the re-aligned set and its four adjacent grids based on the criterion of the lowest forecast error. The forecast error is computed for each candidate grid, and the one with the minimal error is taken as the best matching grid. The forecast associated with this identified grid is considered the NWP forecast for that specific location.
-
3.
NWP+: We combine the NWP forecasts from the re-aligned set and the 4 neighbouring grids using a deep neural network, which is trained to minimize the error between the forecast and IMD ground truth for the particular grid. The resulting forecast is called NWP+ prediction. The model here is trained from 2011 to 2020 and test forecasts are generated for 2021 and 2022.
-
4.
NWP+DL-HD: We combine the DL-HD forecasts, and the NWP forecasts of the 5 grids, to generate an ensemble forecast for each grid. This is done using a deep neural network. The models here are trained from , and forecasts are generated for and .
-
5.
Persistence: This is a naive forecast which estimates the rainfall on day and the average of rainfall in days and as the observed rainfall on day for each grid.
2.4 Loss function
Peak biased loss function for training: Since training on rainfall data is a regression problem, mean squared error (MSE) is the default choice of the loss function. However, to motivate the fact that error of underestimation is more important than the error of overestimation and to be able to capture heavy rainfall better, we assign different exponents to the two errors to obtain the resulting average ’peak-biased’ loss function (). Let denote the observed rainfall and the prediction over time periods. Then,
| (1) |
where denotes the indicator function.
The choice of exponent 1.5 in (1) is empirical. In our experiments, we observed that higher exponents resulted in substantial overestimation of peaks, while lower exponents led to underestimation that did a poor job of tracking high rainfall values.
2.5 Model Configuration and Training
All experiments are conducted in Python, utilizing the TensorFlow and Keras libraries. DL-HD forecasts are made using LSTM and transformer architectures. Both of these are recurrent models and we use past days of historical rainfall data as input, where ranges from 3 to 20. Both models are designed to have nearly the same number of parameters depending roughly linearly on , with the number of parameters being approximately 200M for . The transformer architecture is adopted from [11]. Since there are much fewer data points for NWP-NCEP, the models for NWP+ and NWP+IMD are trained using smaller feed-forward neural networks, with 2 hidden layers. All models are trained using the Adam optimizer, optimizing the peak-biased loss specified in (1). More details on the architecture of these models are given in Table 10 in the appendix. To ensure robustness of our models, each experiment is conducted across 10 independent runs, employing randomly generated seeds to initialize neural network parameters differently. Performance metrics are reported on the average prediction obtained from these 10 runs. The experiments were conducted using the High-Performance Computing (HPC) facility at TIFR.
3 Results
The predictions based upon historical rainfall data DL-HD, NCEP-NWP, NWP+, NWP+DL-HD and persistence are compared with the ground truth daily rainfall data from IMD.
-
1.
Comparison for entire India:
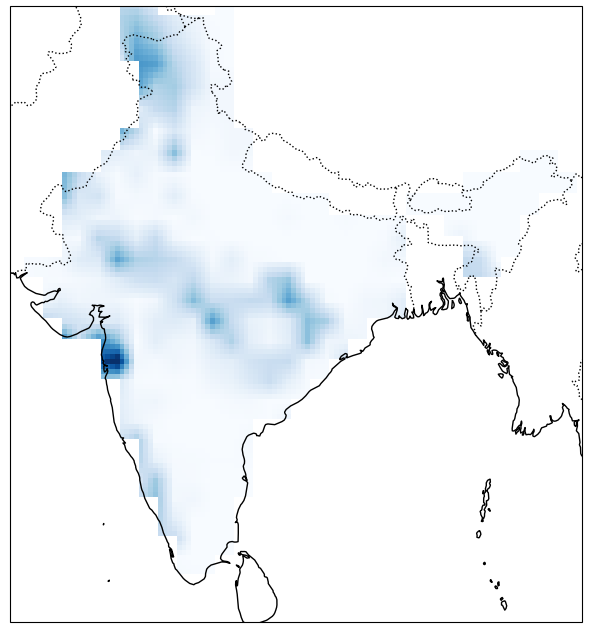
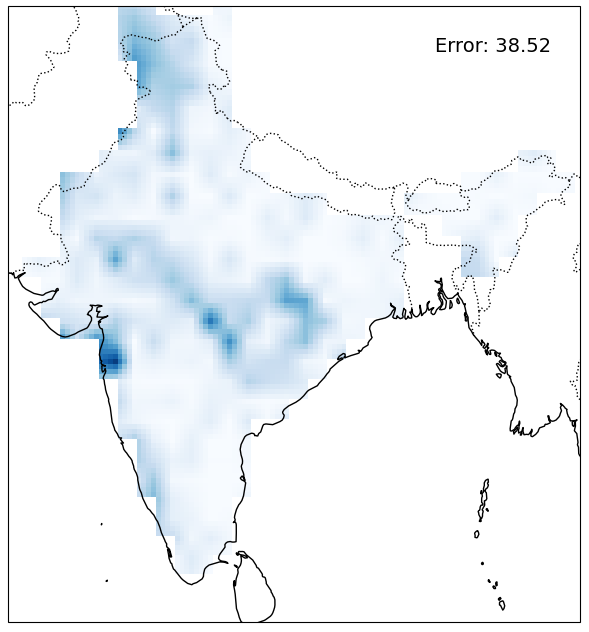
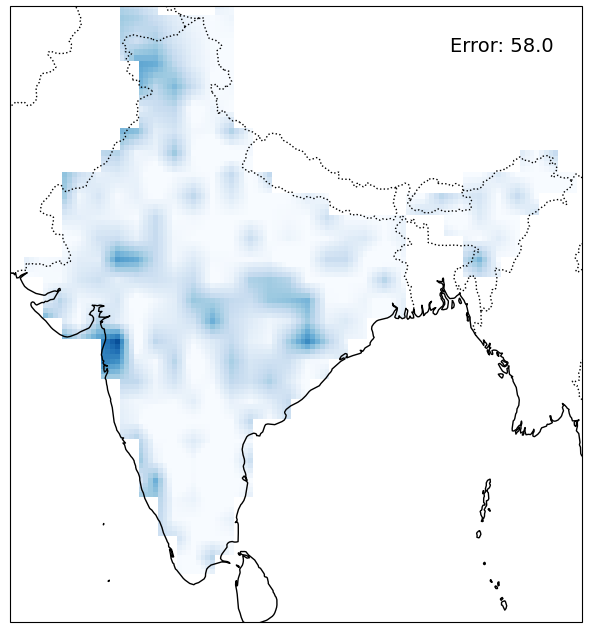
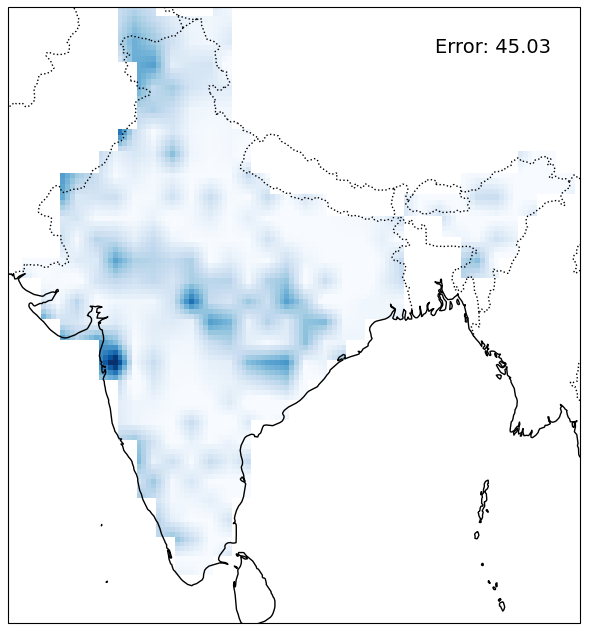
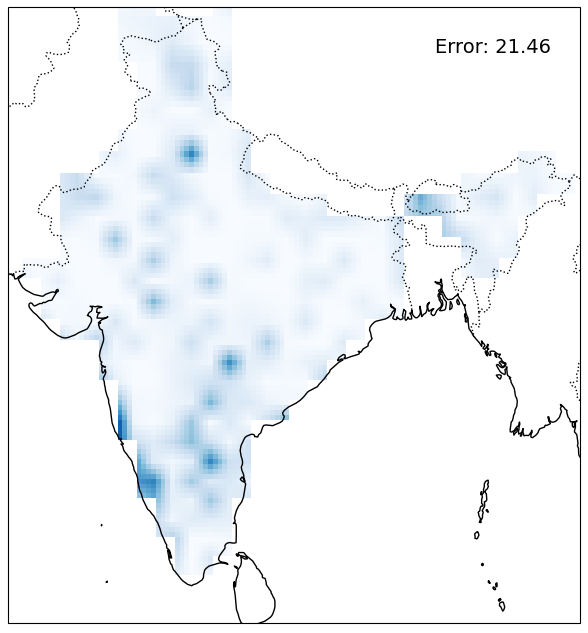
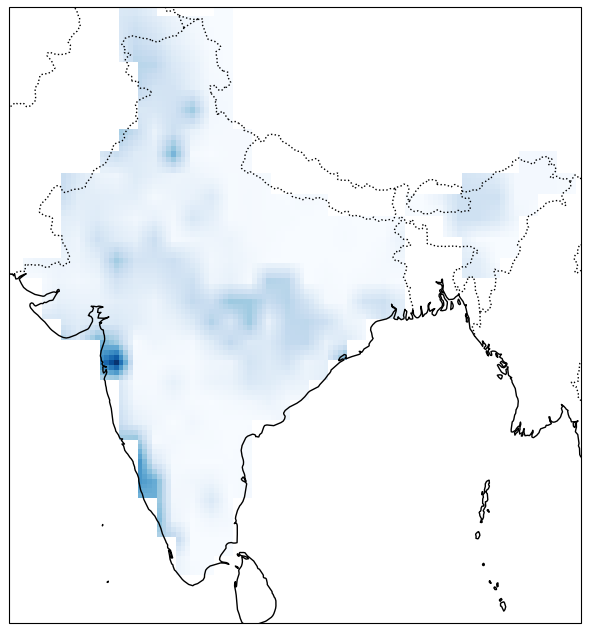
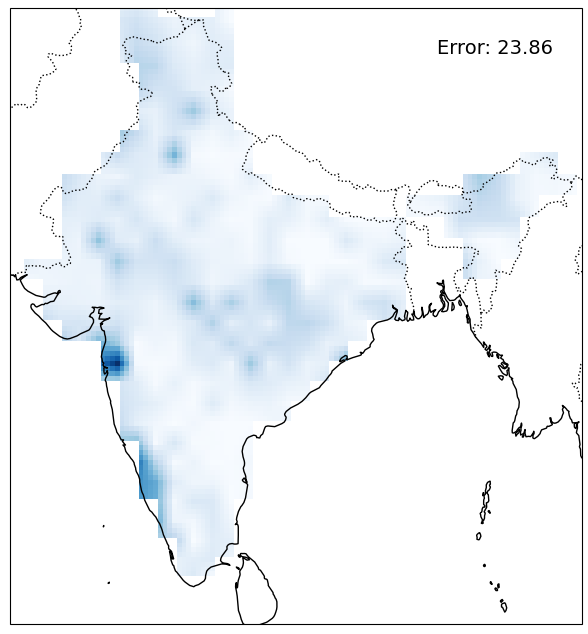
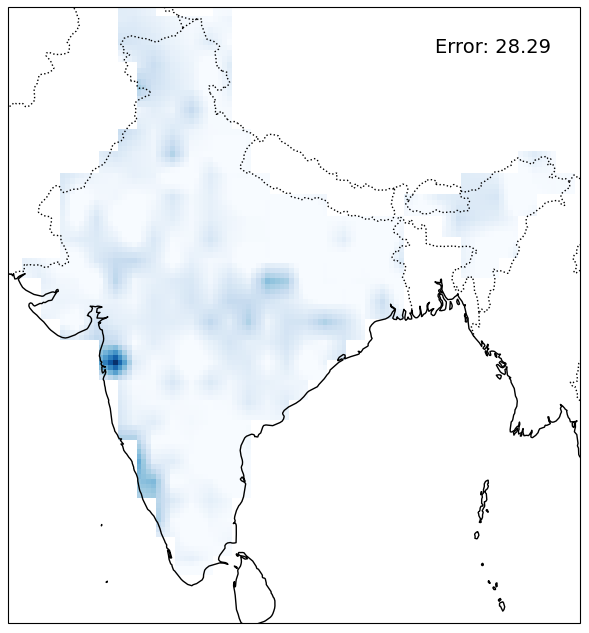
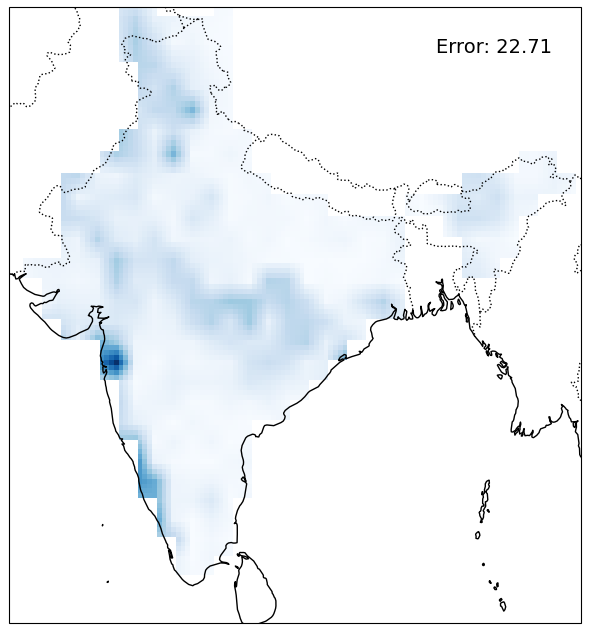
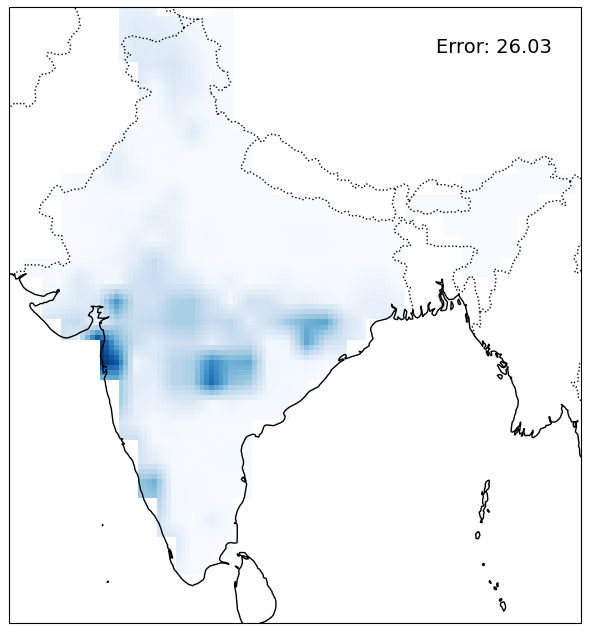
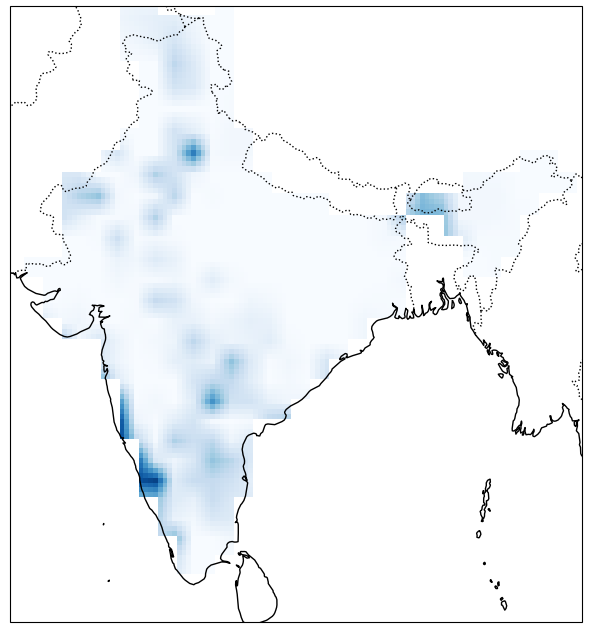
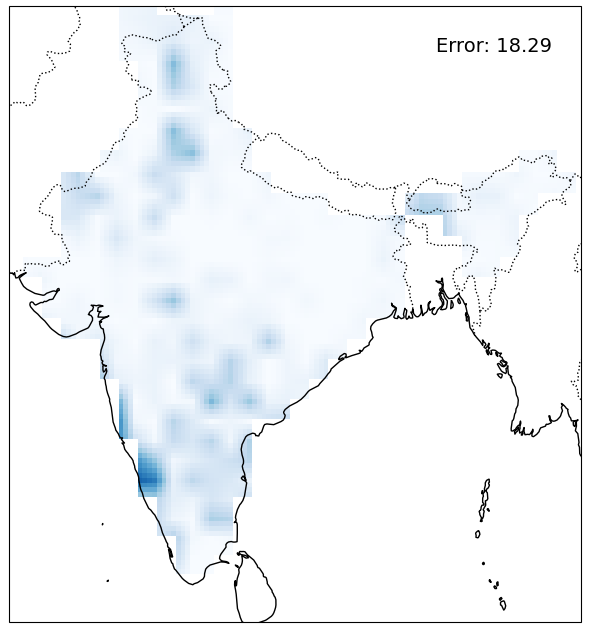
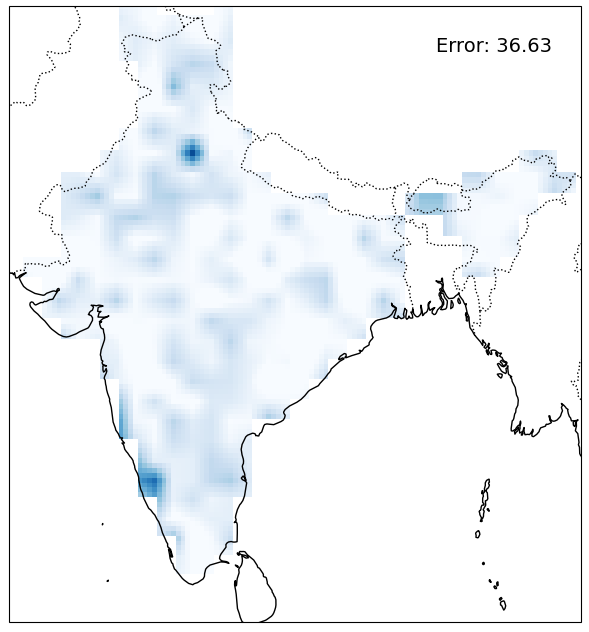
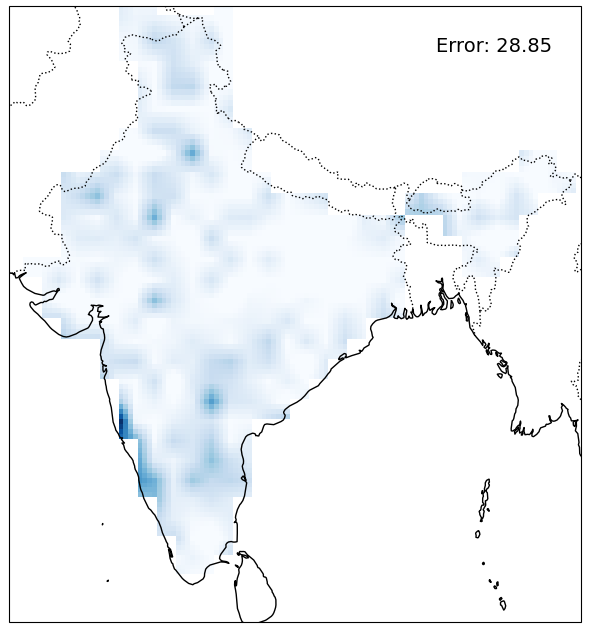
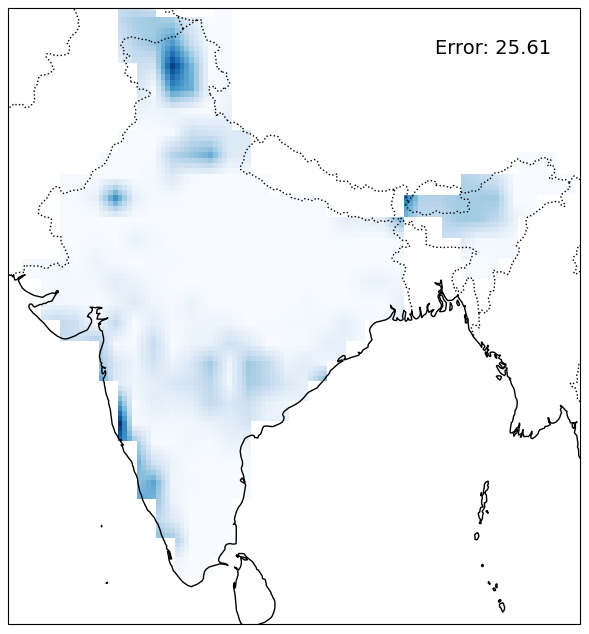
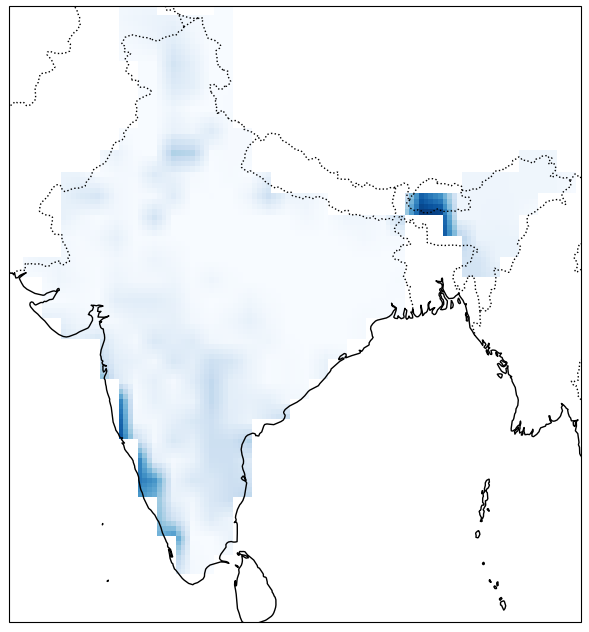
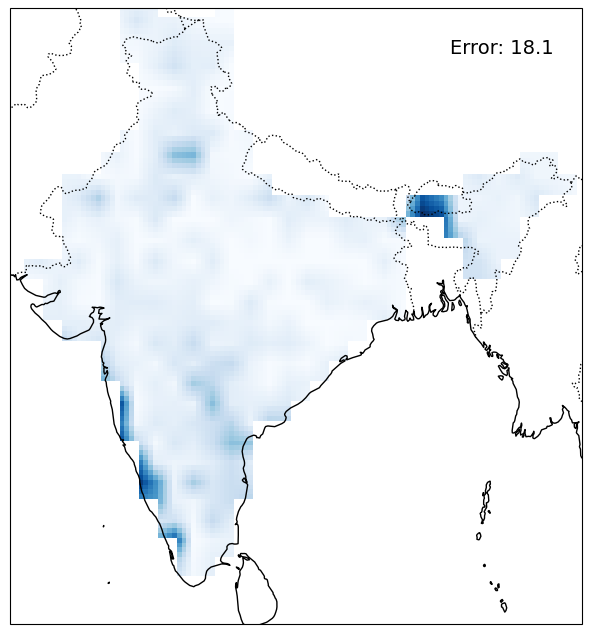
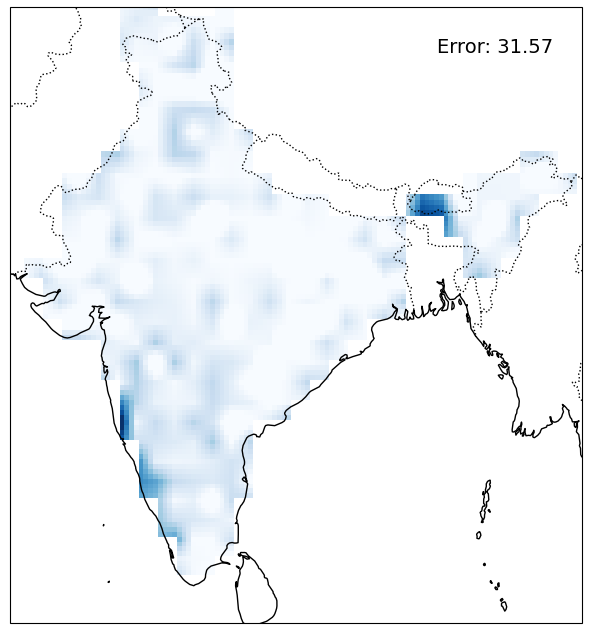
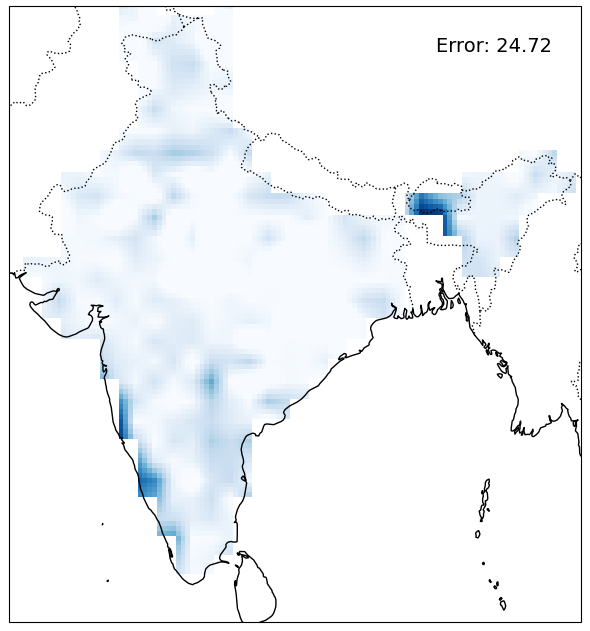
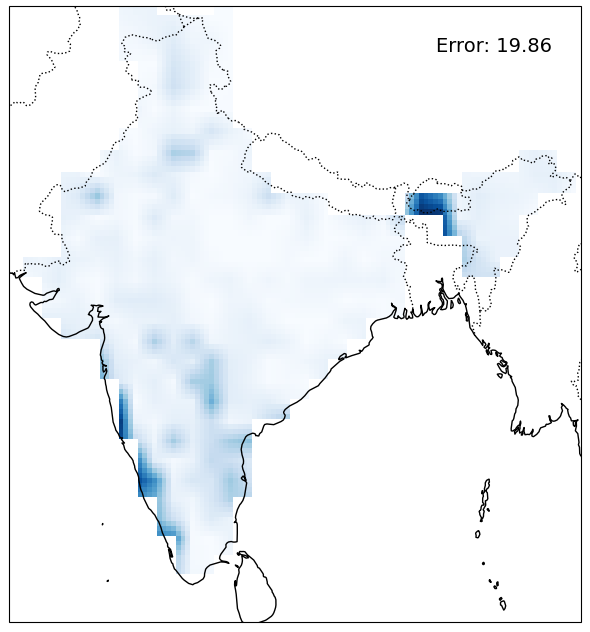
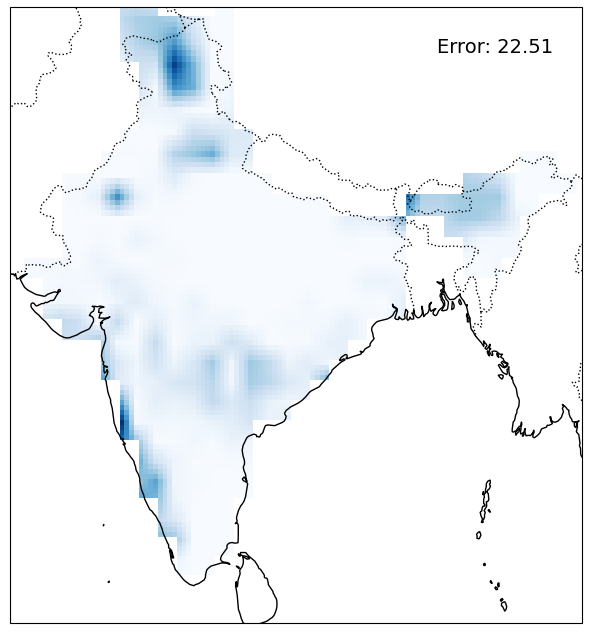
The average peak-biased loss over India for 1-day and 3-day forecasts are presented in Tables 1 and 2, respectively. We also compare the spatial distribution of prediction skill for 1 and 3 day prediction on July 15, 2022 in Figures 1 and 2. In the appendix, we show similar plots for July 15, 2021 in Figures 10 and 11. The average peak-biased loss is also tabulated for a few more dates in the testing period in Tables 11 and 12 in the Appendix. We make the following observations:
-
(a)
DL-HD outperforms other models significantly for both 1-day and 3-day forecasts.
-
(b)
Raw NWP forecasts report the highest error, and are worse than DL-HD 1-day forecasts, and worse for 3-day forecasts. These perform even worse than persistence, which results in a higher error for 1-day forecasts, and higher error for 3-day forecasts.
-
(c)
While pooling surrounding grids to form NWP+ notably reduces errors compared to raw NWP forecasts, these forecasts still report higher errors than DL-HD forecasts by about for 1-day and for 3-day predictions.
-
(d)
The ensemble NWP+DL-HD exhibits improved performance over NWP alone, and is comparable with DL-HD forecasts in most grids. However, it reports slightly higher overall errors, approximately worse than DL-HD for 1-day forecasts and worse for 3-day forecasts.
-
(e)
To check for long-term memory in historical data, we conducted experiments for contexts ranging from 3-20 days. We observed a pattern of small but consistently decreasing errors with increasing lag as shown in Figure 3.
-
(a)
-
2.
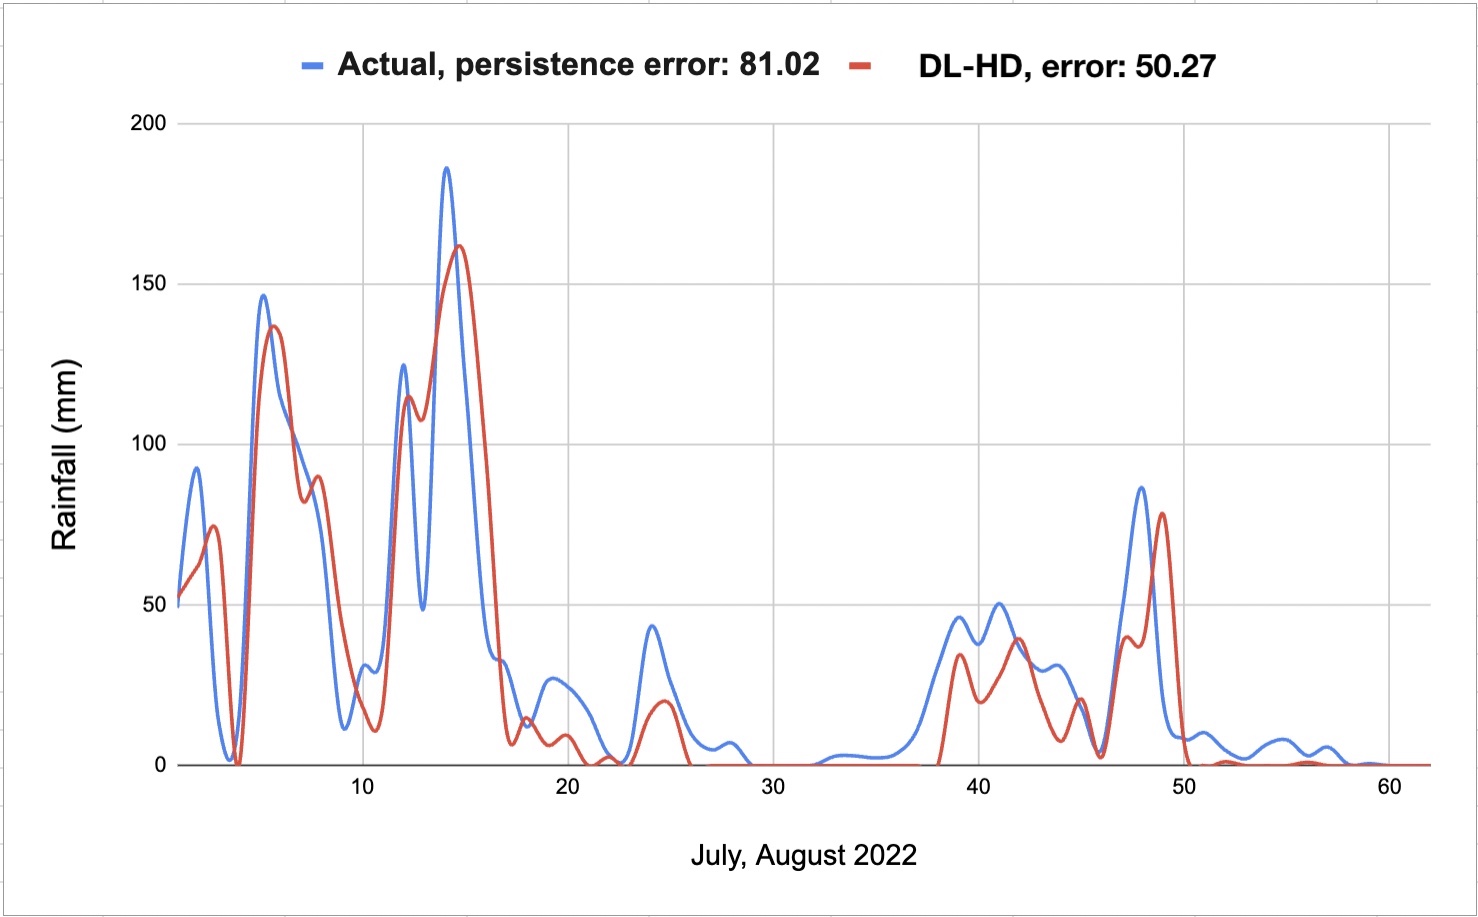
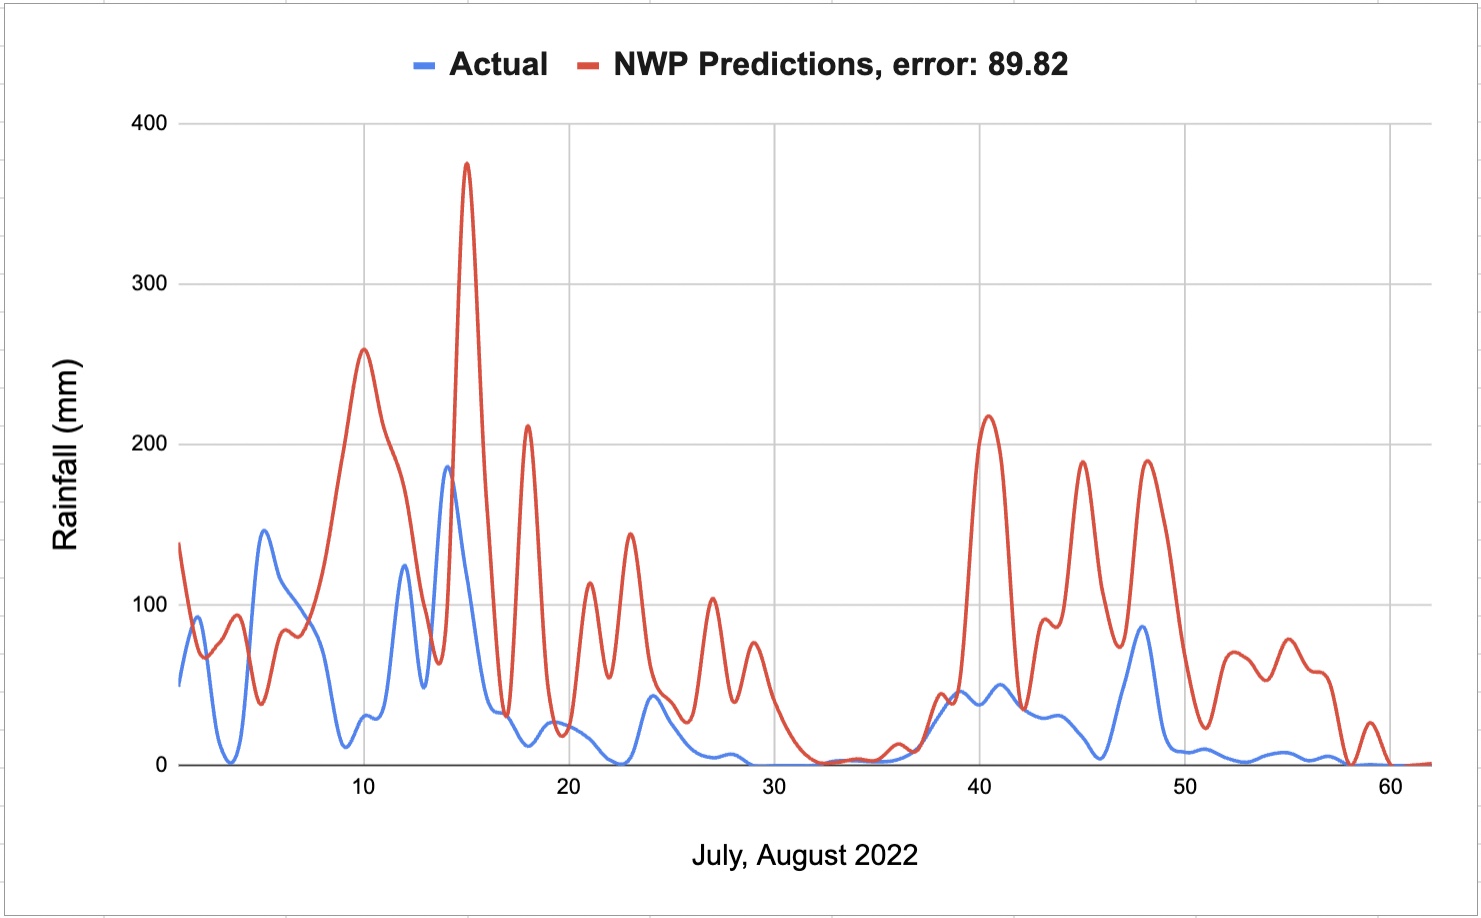
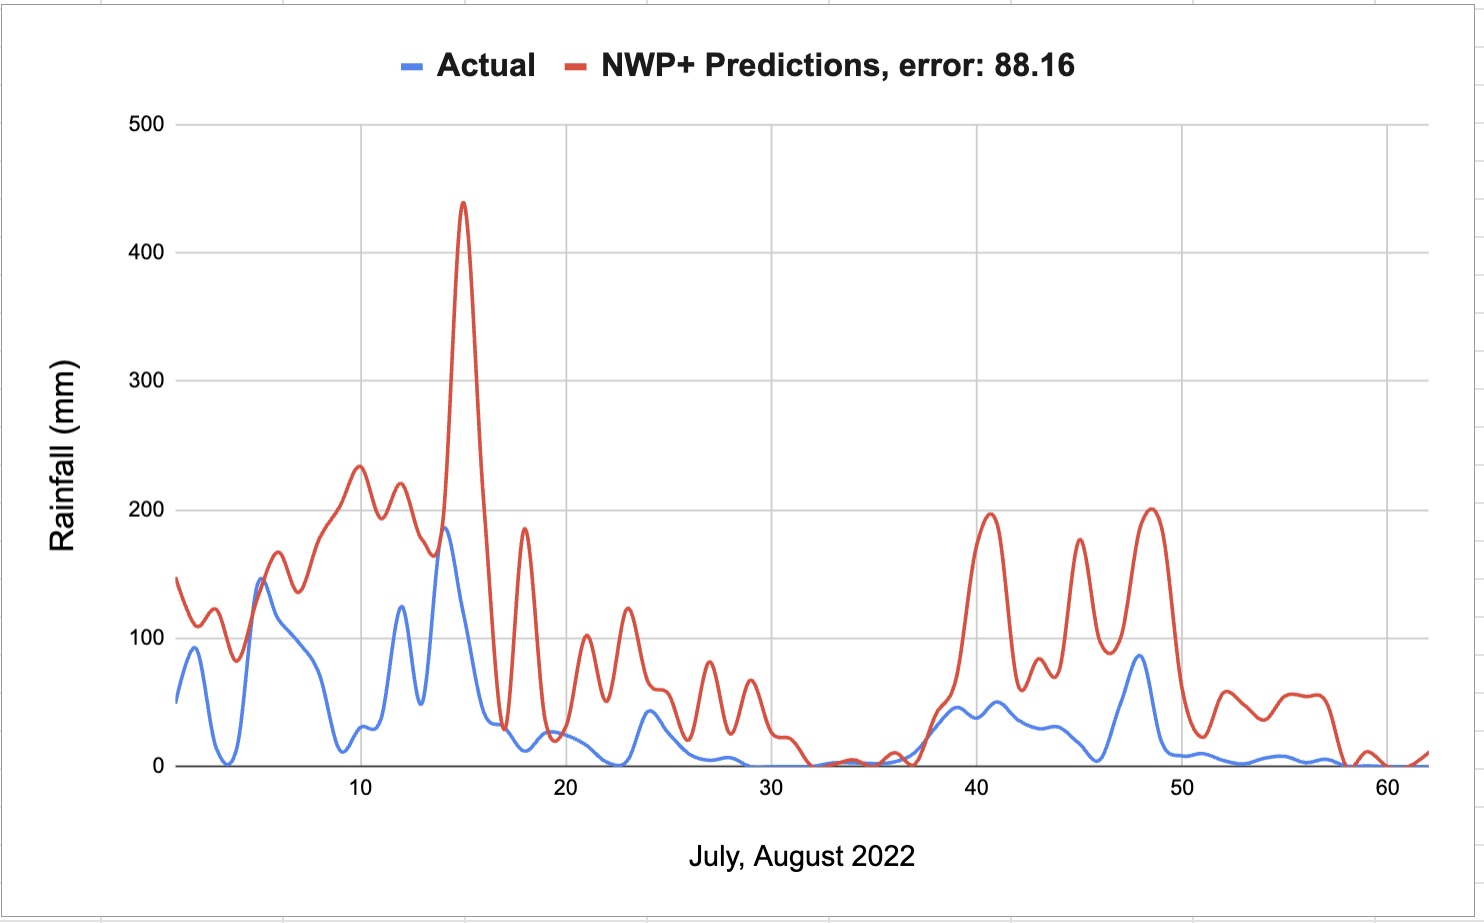
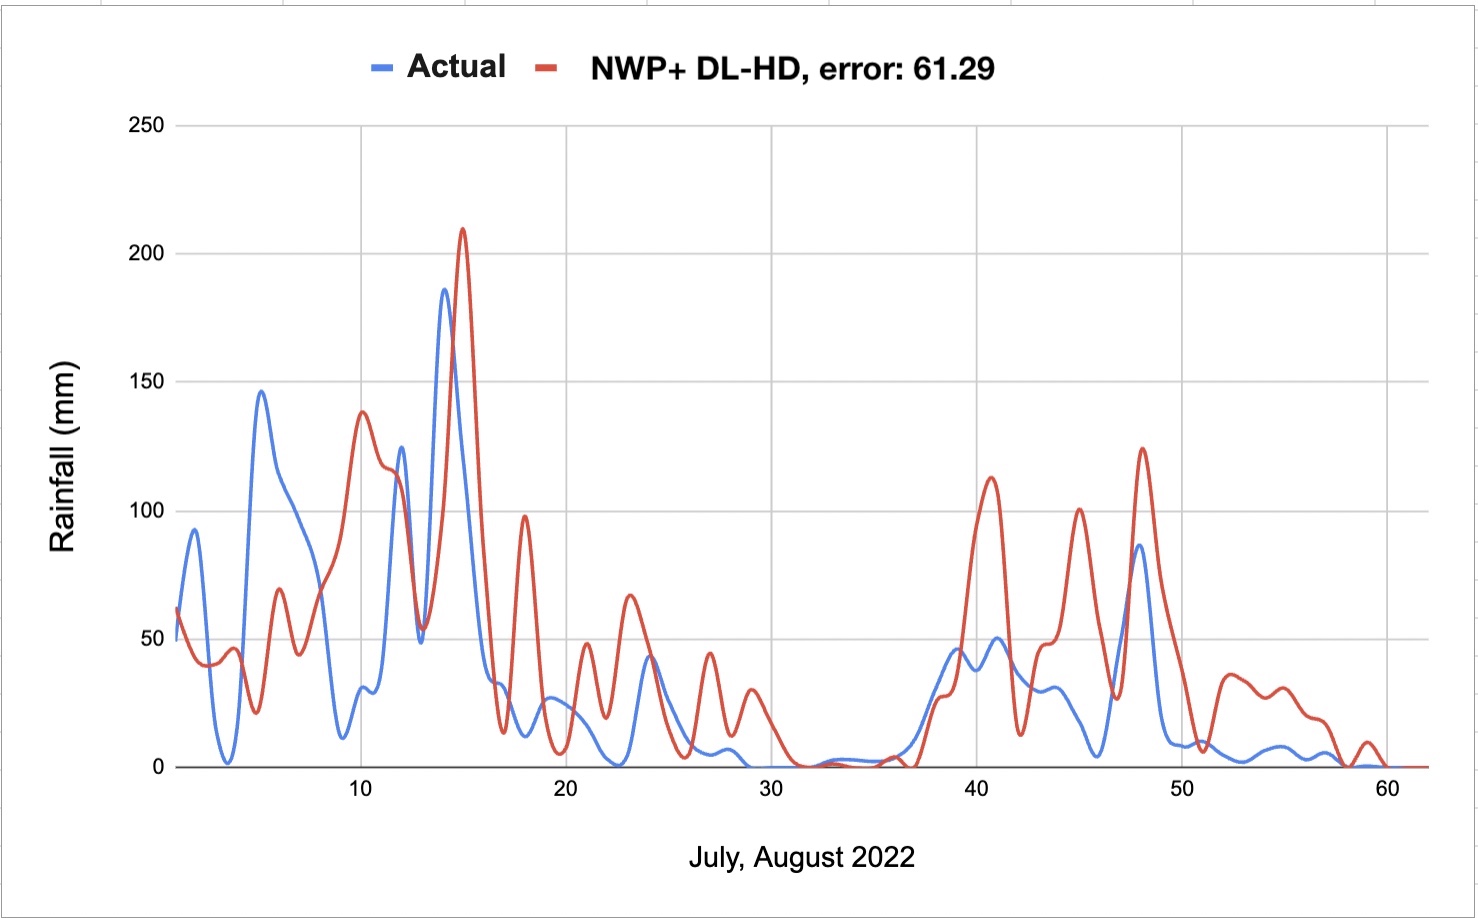
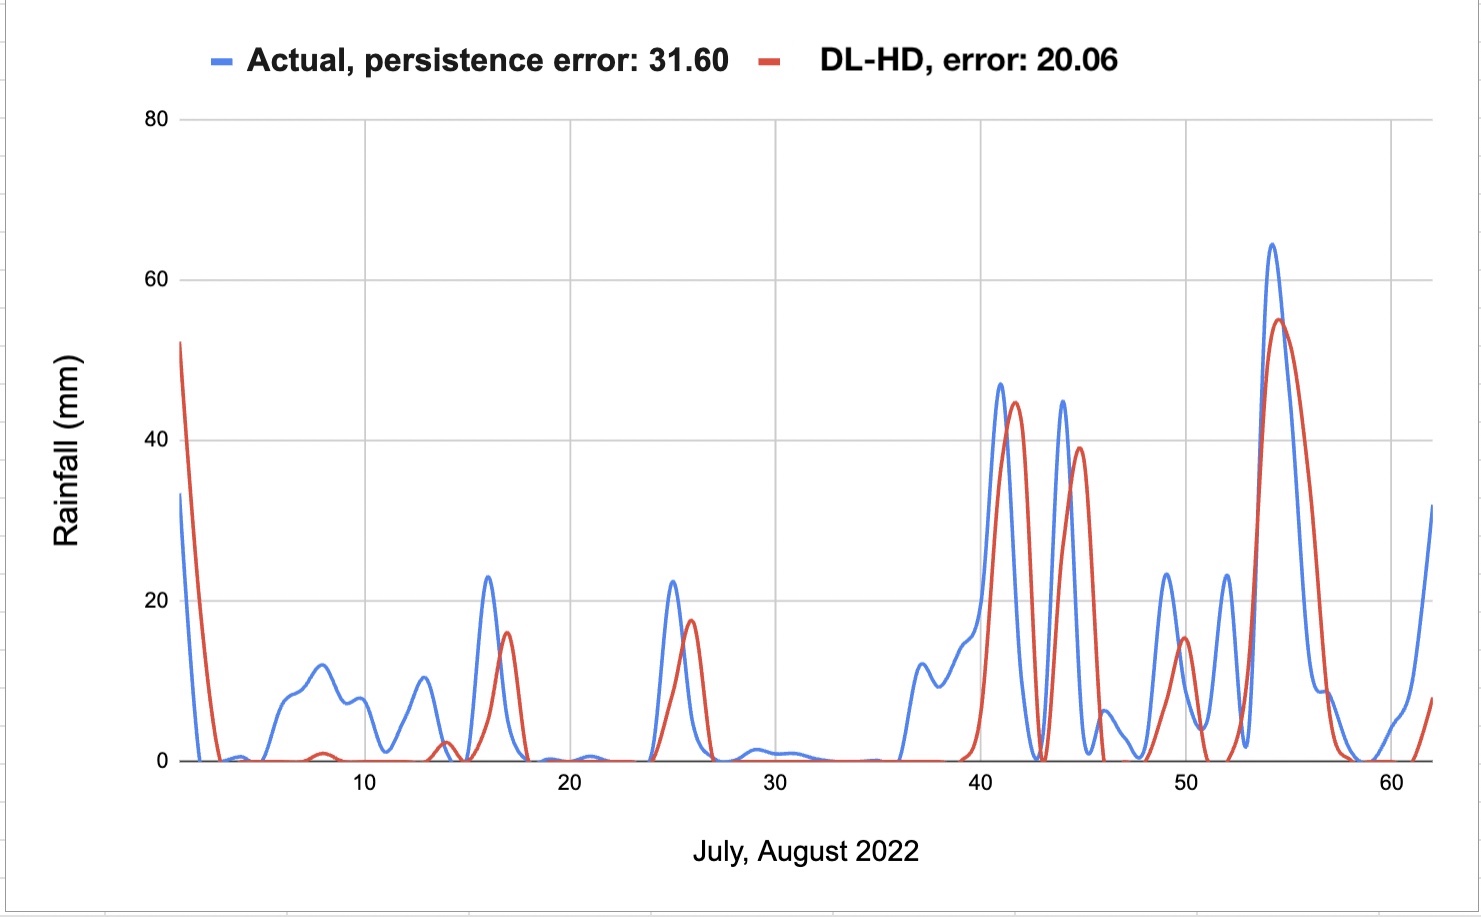
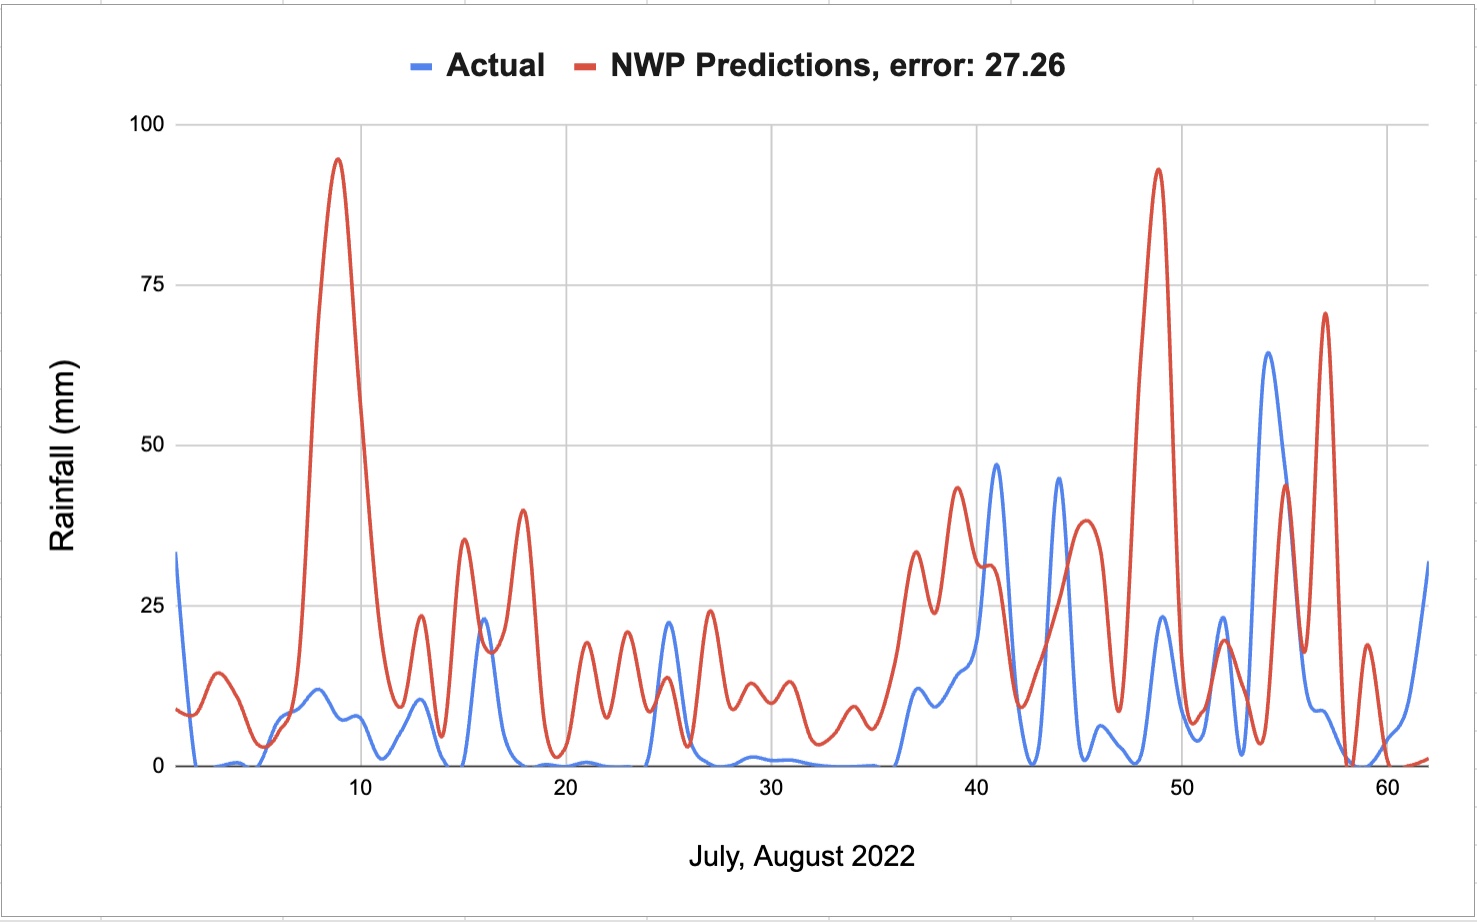
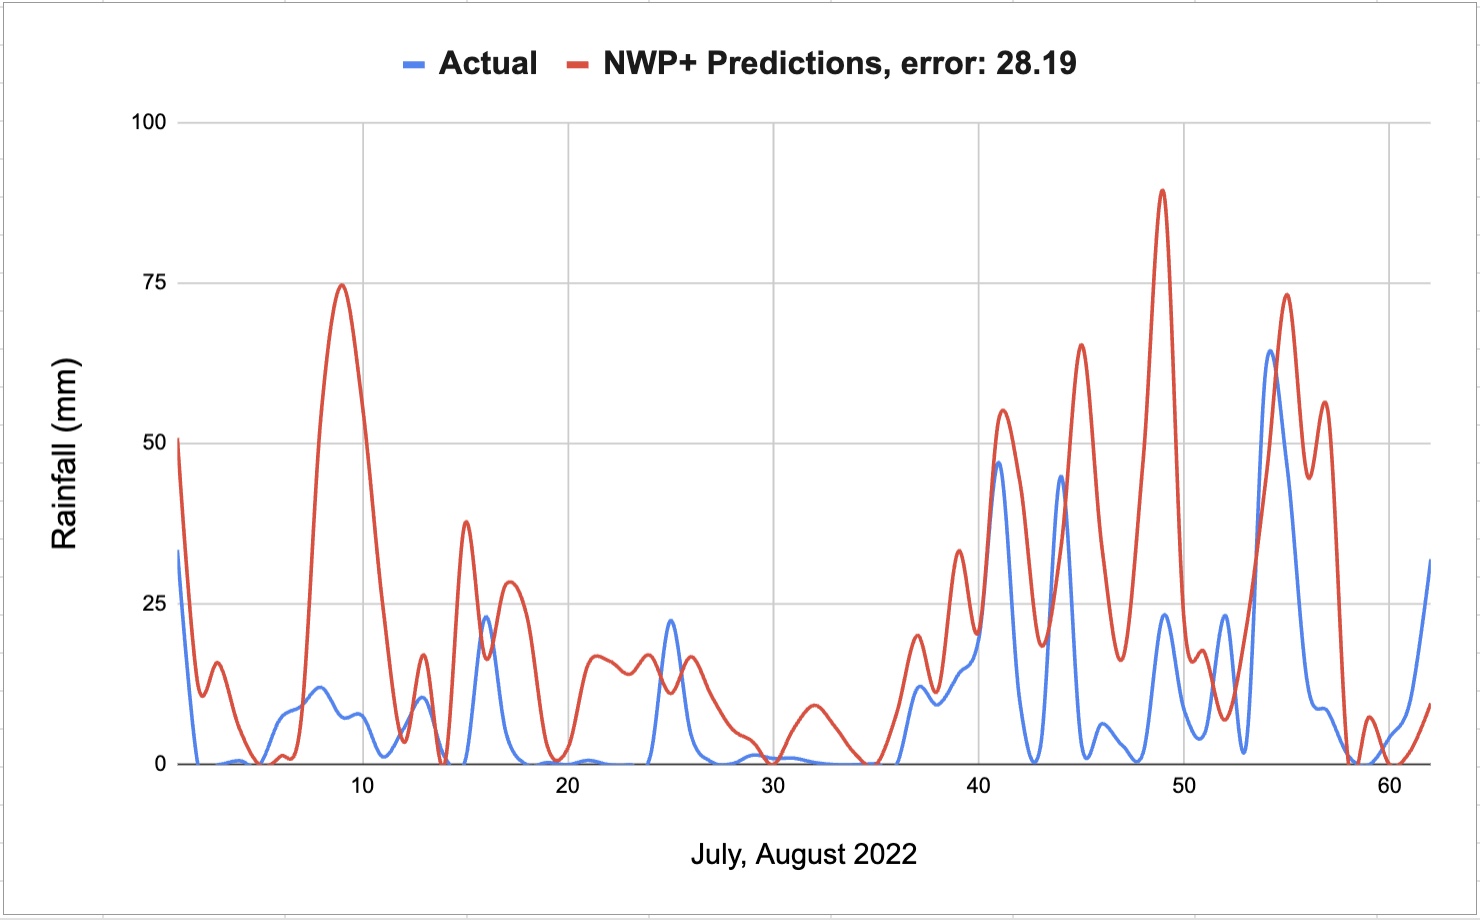
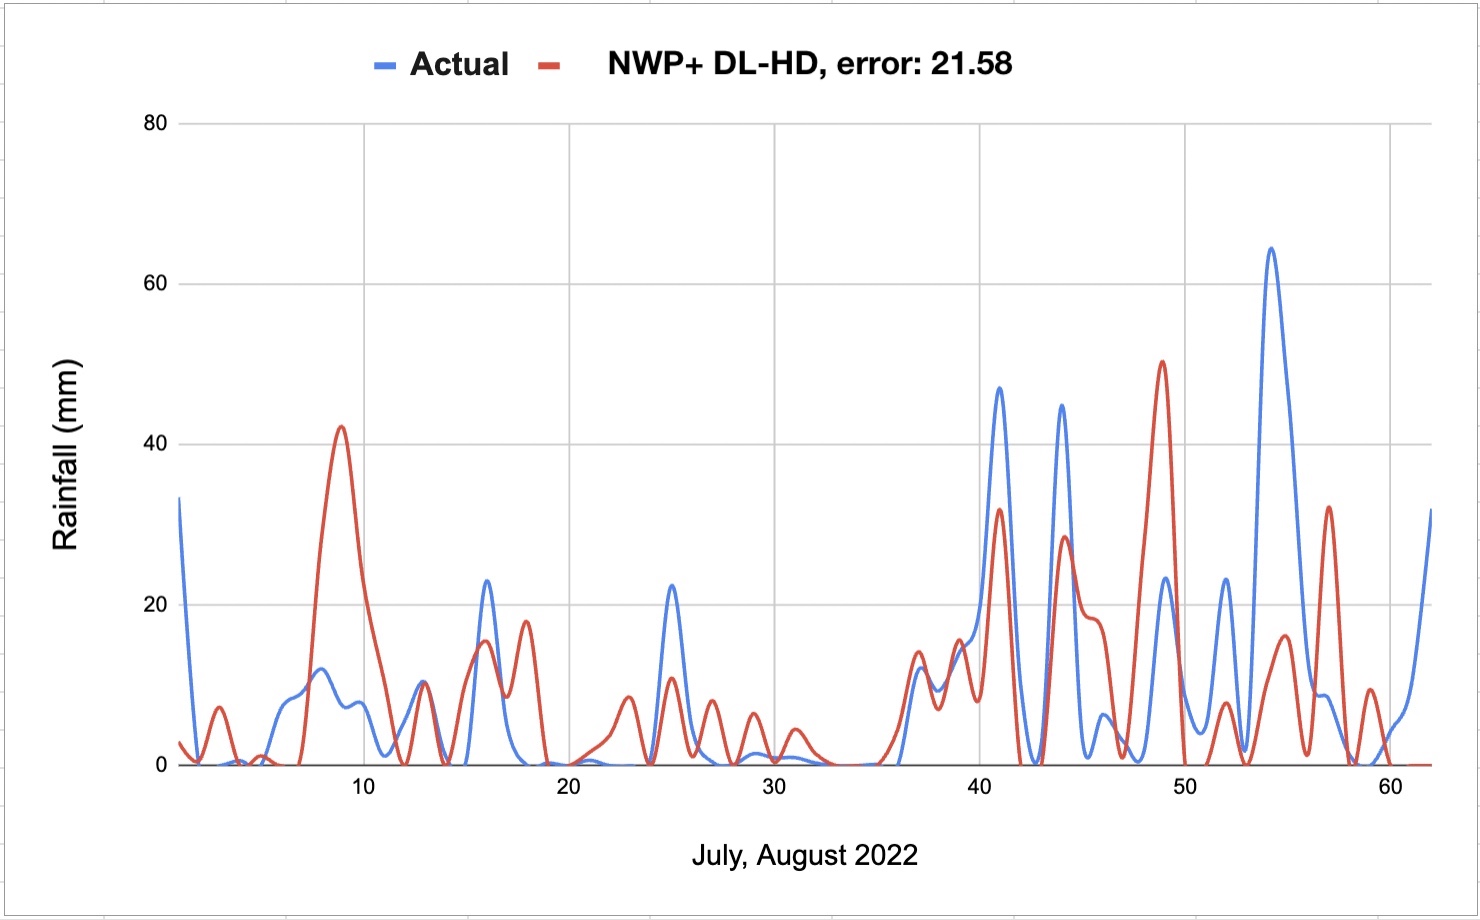
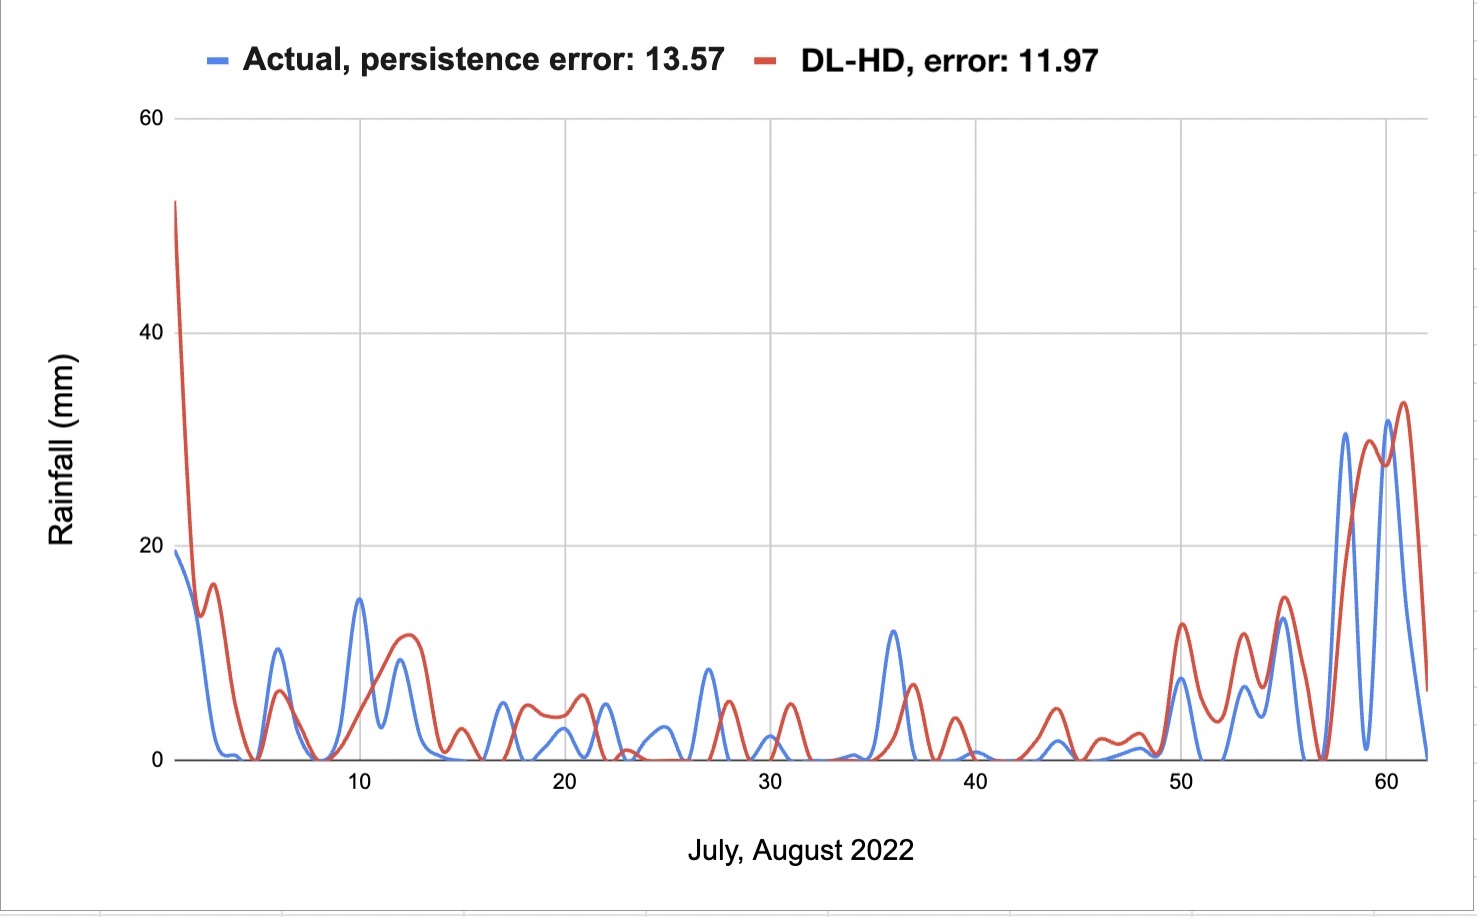
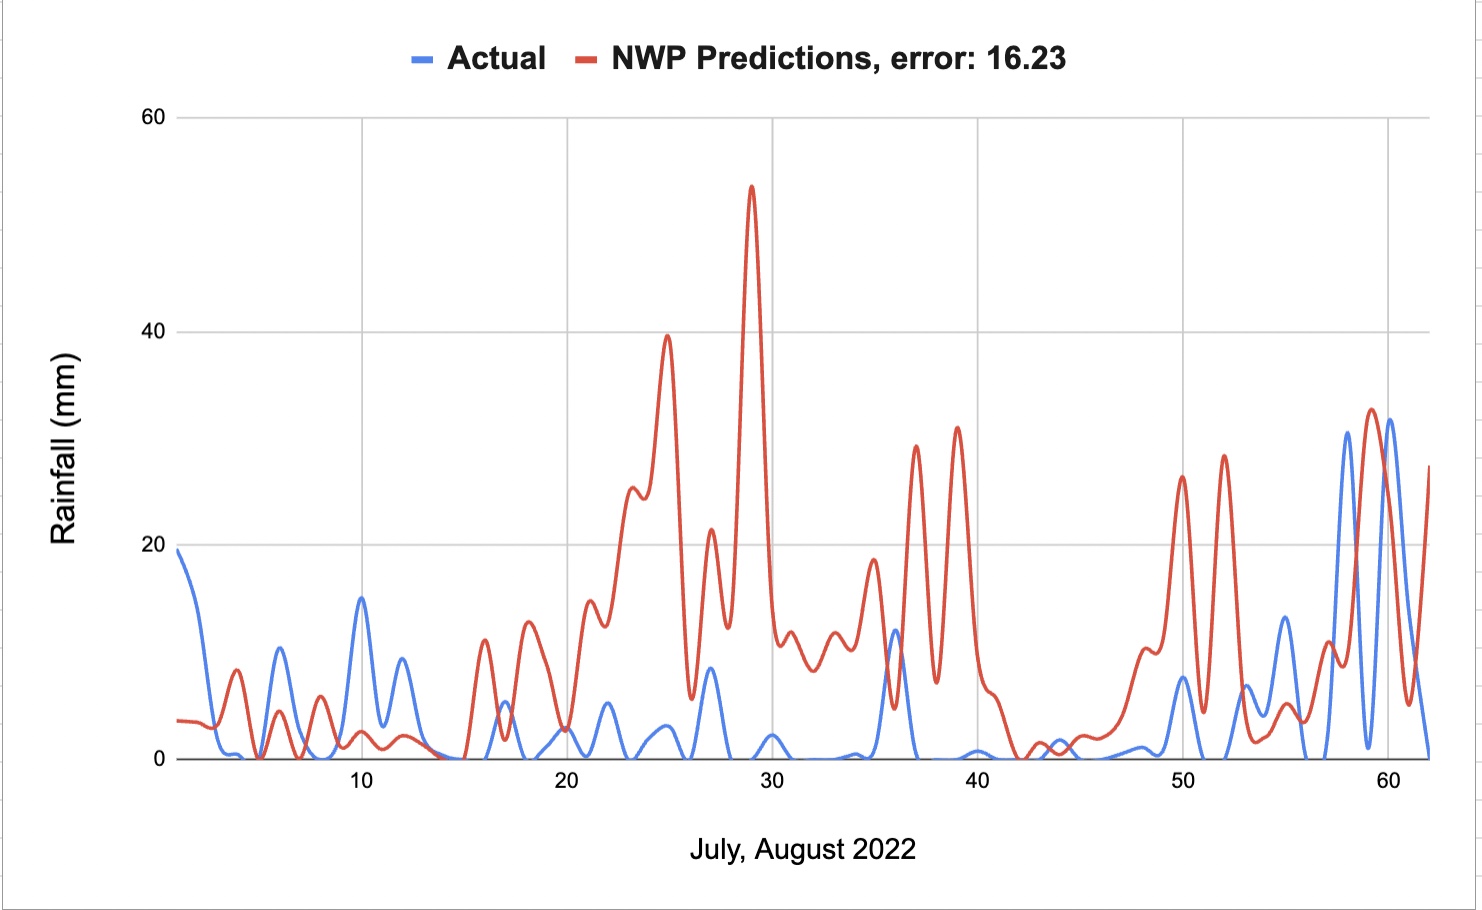
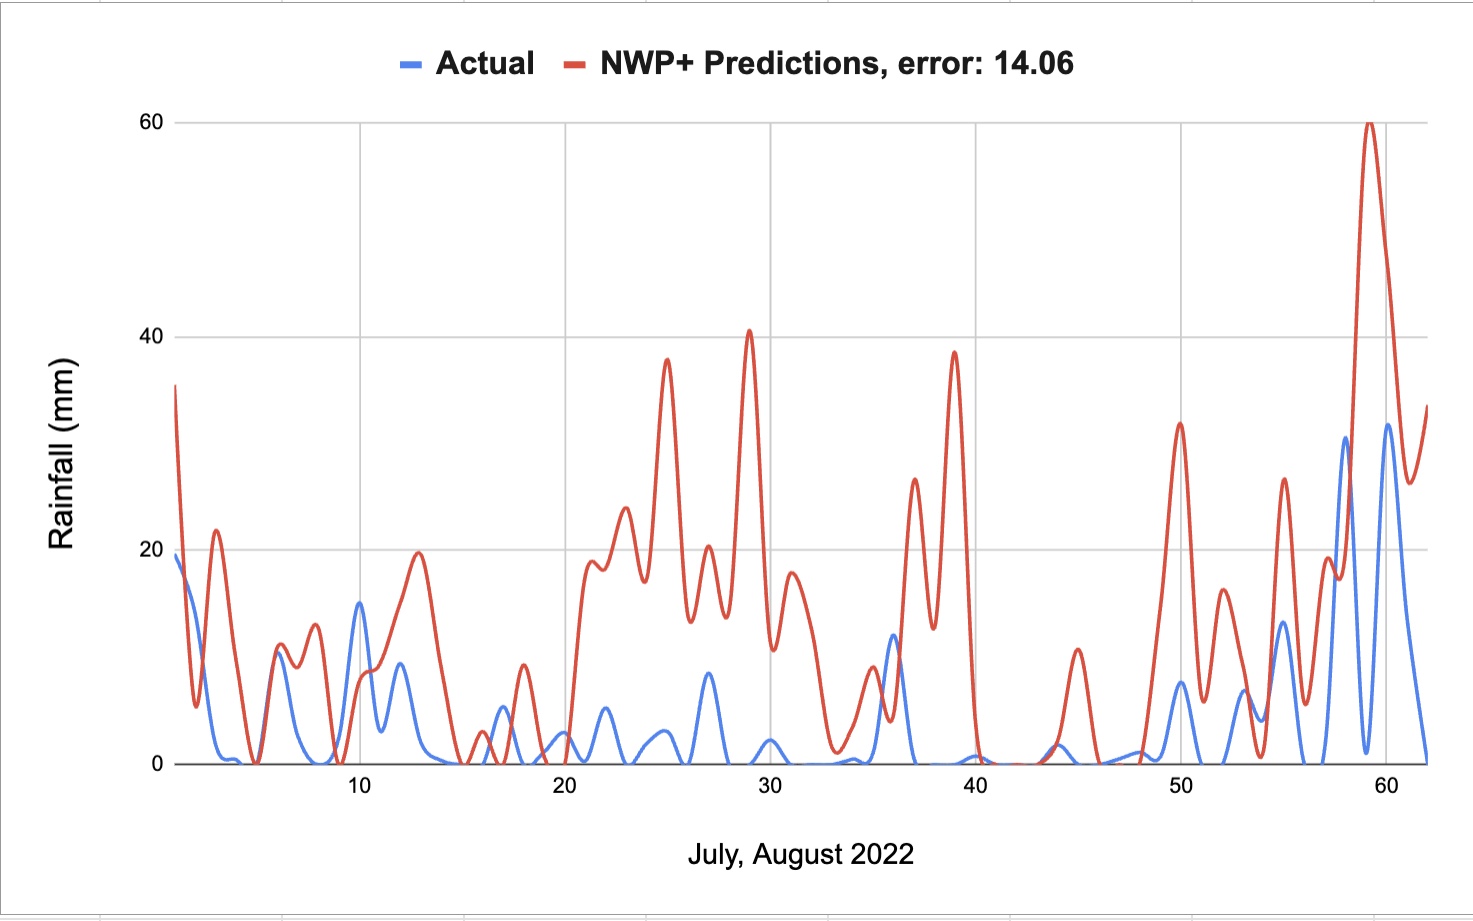
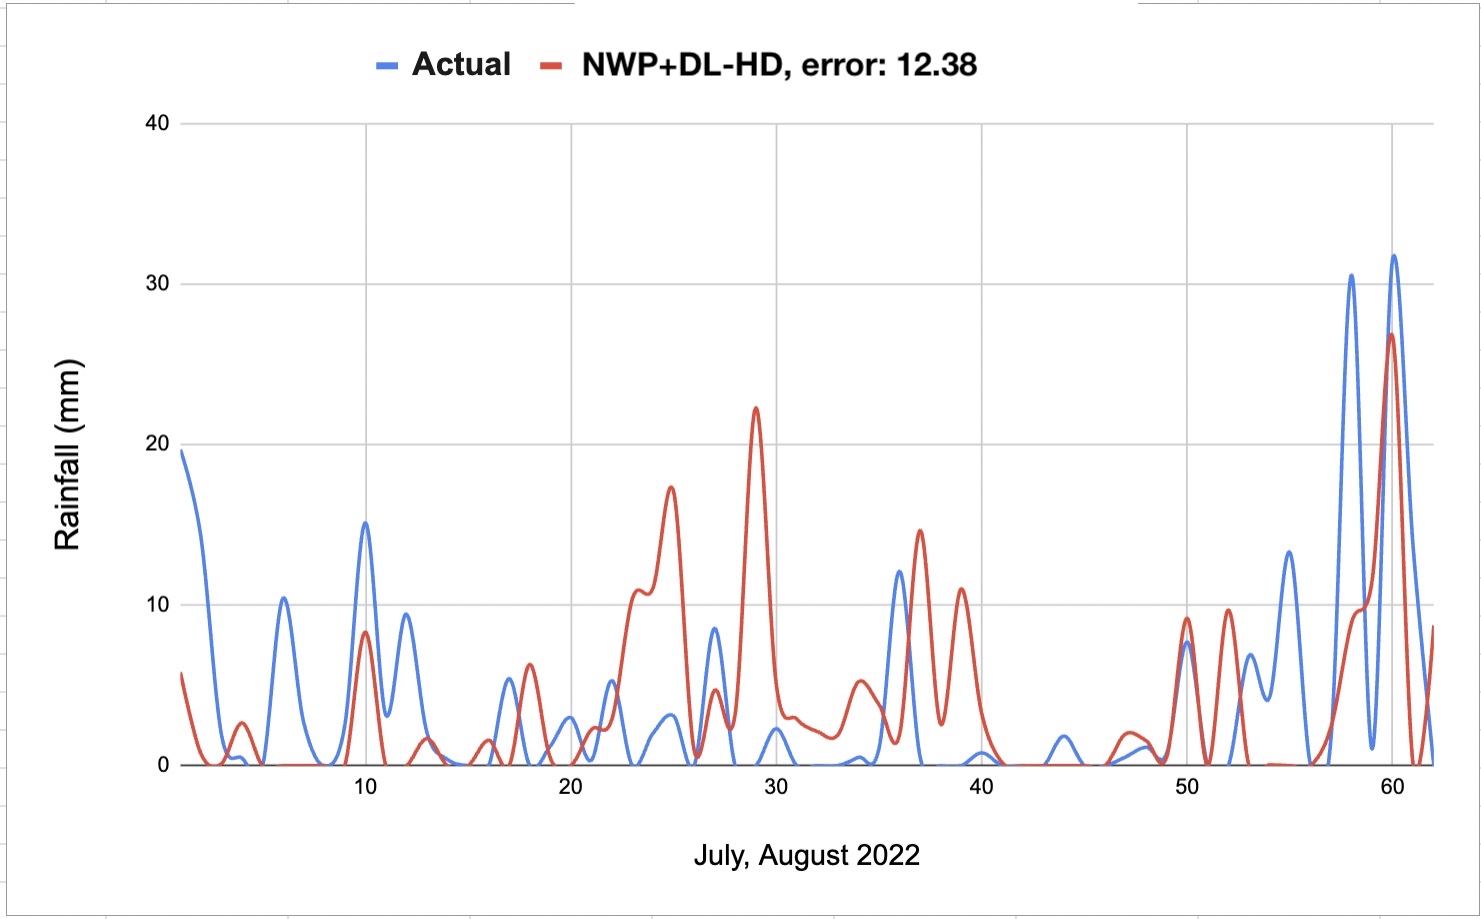
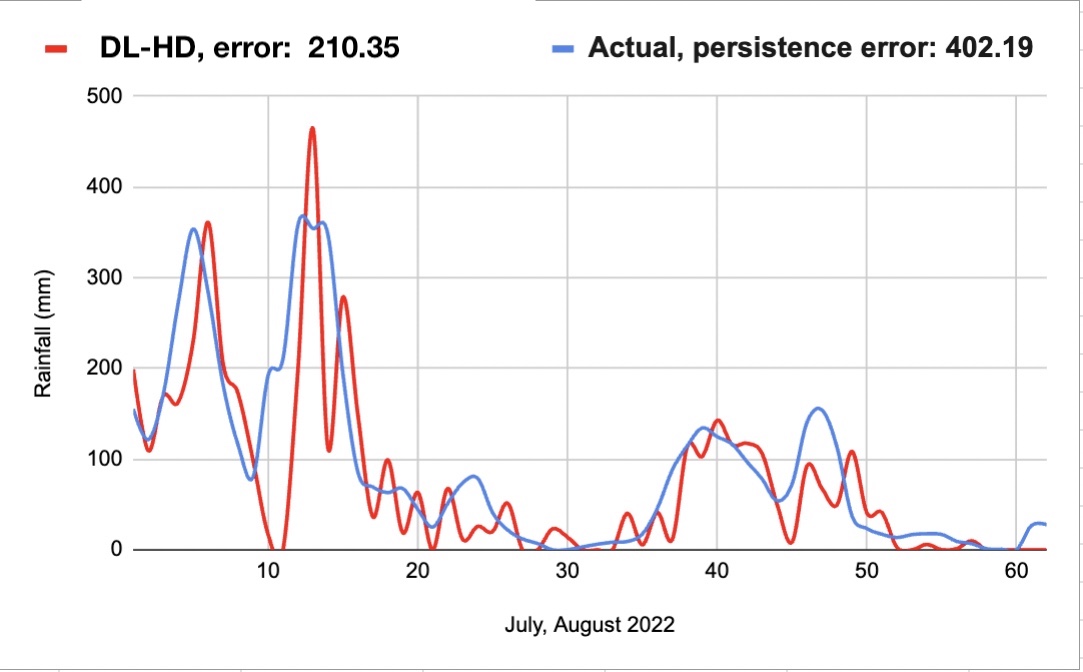
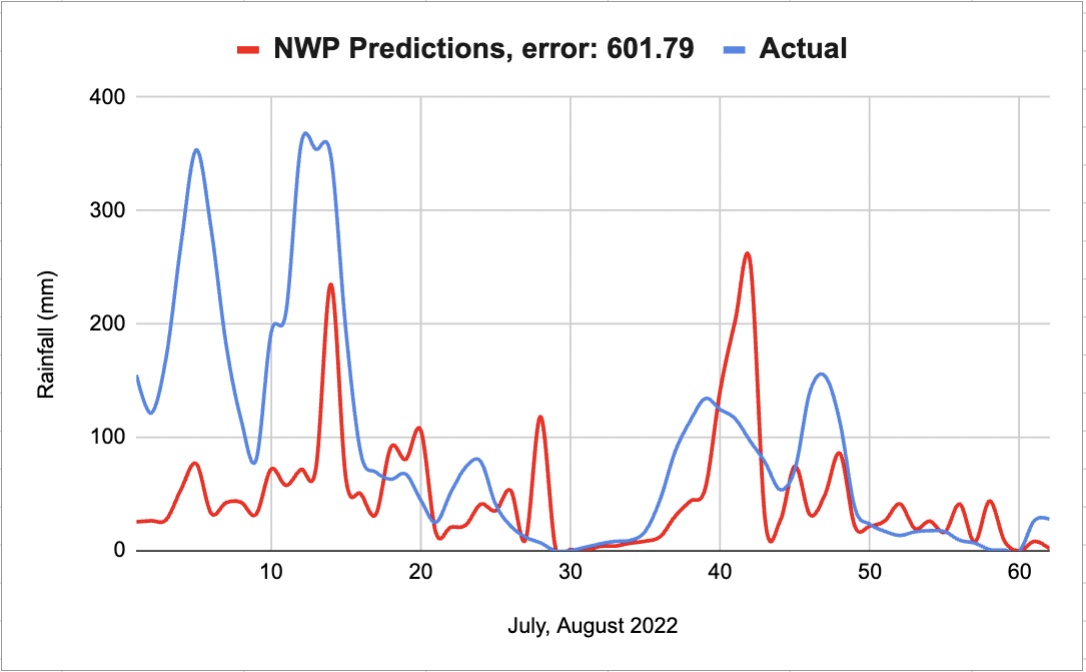
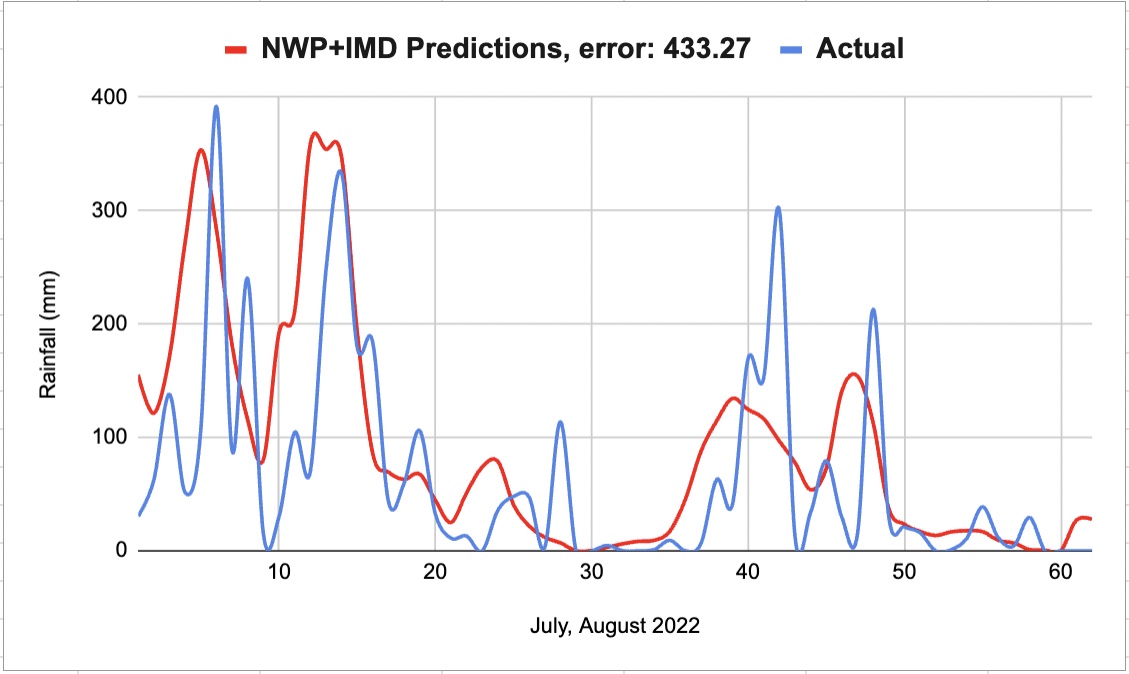
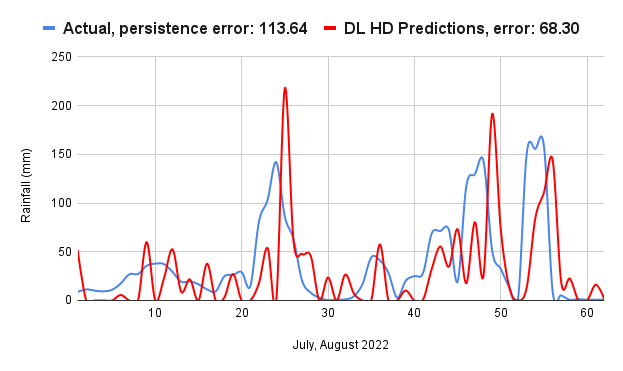
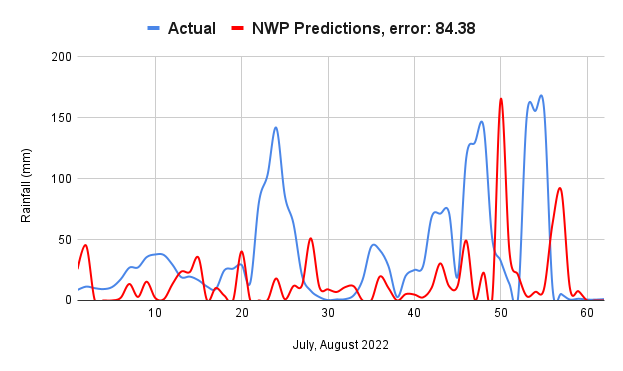
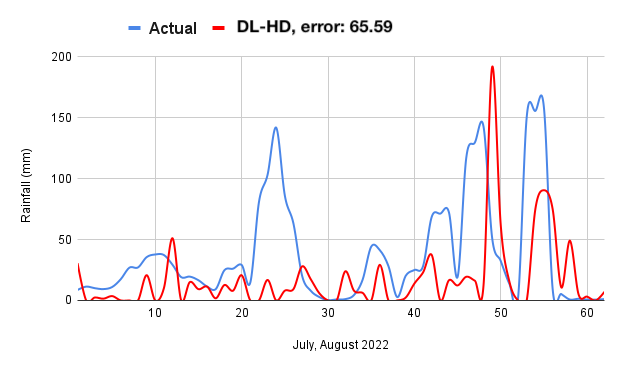
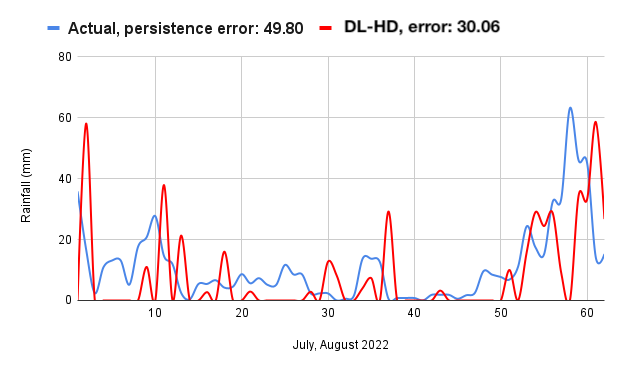
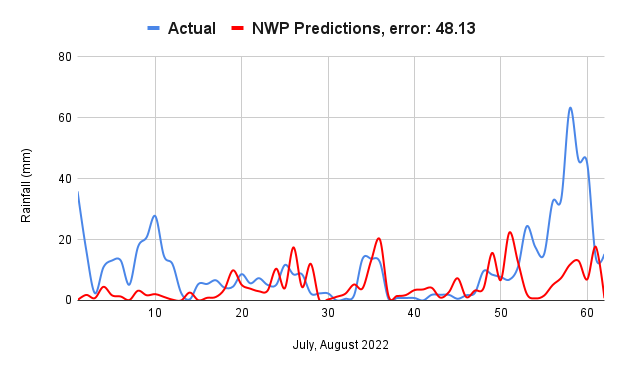
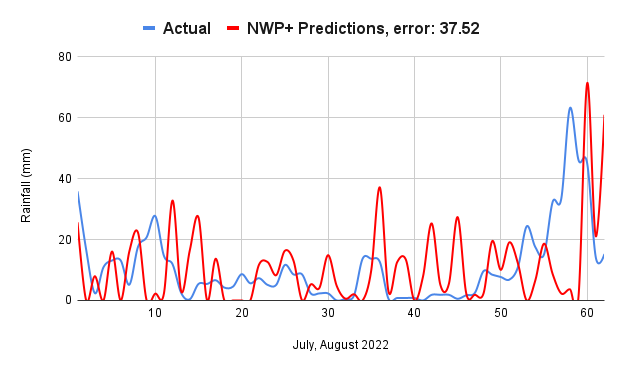
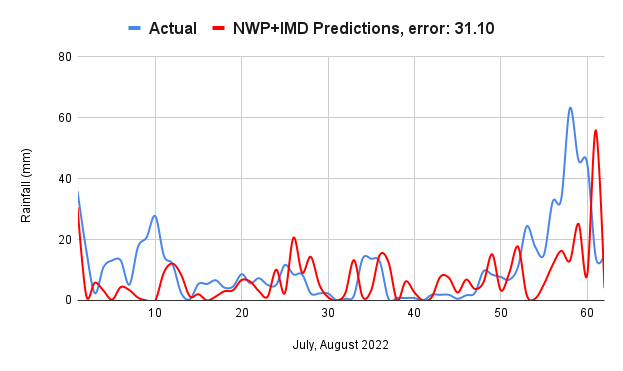
Comparison for key cities: We also analyzed the model performance separately for 20 of the most populated cities spread across India. The average peak-biased loss on these cities is shown in Table 3 for 1-day forecasts, and in Table 4 for 3-day forecasts. The last row in the two figures shows the excess error percentage in the different forecasts compared to DL-HD forecast. We make similar observations here as for whole of India. Figures 4 to 6 graphically compare the different forecasts with the ground truth for cities Mumbai, Ahmedabad and Chennai, for the months of July and August in 2022, for 1-day forecasts. Similar comparisons for 3-day forecasts are shown in Figures 7 to 9. It is clear from the figures that DL-HD forecasts consistently outperform other methods in tracking actual rainfall.
| Model | Peak-biased Loss | %age Higher Error than DL-HD |
|---|---|---|
| DL-HD | 17.81 | - |
| NWP | 23.98 | 34.64 |
| NWP+ | 22.16 | 24.42 |
| NWP + DL-HD | 18.85 | 5.84 |
| Persistence | 23.05 | 29.42 |
| Model | Peak-biased Loss | %age Higher Error than DL-HD |
|---|---|---|
| DL-HD | 77.86 | - |
| NWP | 131.25 | 68.57 |
| NWP+ | 106.94 | 37.35 |
| NWP + DL-HD | 88.13 | 13.19 |
| Persistence | 120.38 | 54.61 |


| City | DL-HD | NWP | NWP+ | NWP+DL-HD | Persistence |
|---|---|---|---|---|---|
| Ahmedabad | 20.06 | 27.26 | 28.19 | 21.58 | 31.6 |
| Bangalore | 13.29 | 17.88 | 16.01 | 13.88 | 15.18 |
| Bhopal | 27.58 | 34.28 | 32.69 | 30.12 | 42.48 |
| Bhubaneswar | 32.96 | 41.56 | 40.24 | 36.02 | 38.89 |
| Chandigarh | 18.19 | 19.31 | 19.57 | 17.55 | 18.65 |
| Chennai | 11.97 | 16.23 | 14.06 | 12.38 | 13.57 |
| Coimbatore | 11.07 | 19.73 | 13.28 | 11.67 | 10.94 |
| Delhi | 9.78 | 22.67 | 12.04 | 10.93 | 11.16 |
| Gangtok | 44.29 | 42.84 | 41.18 | 43.17 | 57.99 |
| Hyderabad | 21.74 | 32.86 | 26.47 | 24.51 | 28.68 |
| Indore | 12.86 | 24.49 | 17.64 | 14.82 | 17.23 |
| Kochi | 23.48 | 30.63 | 28.36 | 25.61 | 27.05 |
| Kolkata | 43.68 | 42.85 | 46.92 | 43.09 | 53.54 |
| Lucknow | 12.53 | 29.34 | 15.83 | 14.53 | 13.65 |
| Mumbai | 50.27 | 89.82 | 88.16 | 61.29 | 81.02 |
| Patna | 14.25 | 17.37 | 14.28 | 14.56 | 15.95 |
| Pune | 18.89 | 48.53 | 28.42 | 24.05 | 19.57 |
| Raipur | 29.84 | 39.87 | 34.98 | 28.42 | 36.21 |
| Shimla | 13.68 | 16.97 | 16.03 | 13.26 | 14.18 |
| Vishakhapatnam | 27.49 | 34.28 | 30.02 | 28.92 | 29.79 |
| Total Error | 457.9 | 648.77 | 564.37 | 490.36 | 577.33 |
| %age higher than DL-HD error | 0 | 41.68 | 23.25 | 7.09 | 26.08 |
| City | DL-HD | NWP | NWP+ | NWP+DL-HD | Persistence |
|---|---|---|---|---|---|
| Ahmedabad | 65.59 | 112.46 | 84.38 | 63.21 | 113.64 |
| Bangalore | 44.26 | 54.53 | 47.39 | 40.03 | 57.12 |
| Bhopal | 132.29 | 240.21 | 143.59 | 129.72 | 202.73 |
| Bhubaneswar | 103.87 | 138.30 | 119.62 | 105.92 | 128.51 |
| Chandigarh | 56.91 | 68.20 | 61.51 | 56.42 | 59.22 |
| Chennai | 30.06 | 48.05 | 37.52 | 31.10 | 49.80 |
| Coimbatore | 37.84 | 52.14 | 44.83 | 37.28 | 40.01 |
| Delhi | 38.22 | 41.98 | 45.28 | 39.04 | 51.86 |
| Gangtok | 133.57 | 147.74 | 140.28 | 135.29 | 162.39 |
| Hyderabad | 51.6 | 84.85 | 75.44 | 49.86 | 97.96 |
| Indore | 40.22 | 64.31 | 51.22 | 39.57 | 86.19 |
| Kochi | 63.11 | 119.39 | 93.75 | 64.78 | 118.85 |
| Kolkata | 139.5 | 183.01 | 168.33 | 144.82 | 169.53 |
| Lucknow | 30.79 | 39.21 | 31.37 | 30.17 | 56.74 |
| Mumbai | 210.35 | 601.79 | 473.55 | 433.27 | 402.19 |
| Patna | 36.12 | 48.92 | 42.46 | 36.70 | 56.83 |
| Pune | 62.37 | 114.65 | 98.57 | 65.87 | 119.72 |
| Raipur | 96.30 | 122.61 | 118.43 | 95.83 | 143.58 |
| Shimla | 45.82 | 105.28 | 76.81 | 49.05 | 82.55 |
| Vishakhapatnam | 77.41 | 98.80 | 87.48 | 75.03 | 110.97 |
| Total Error | 1496.20 | 2486.43 | 2041.81 | 1722.96 | 2310.39 |
| %age higher than DL-HD error | 66.18 | 36.47 | 15.16 | 54.42 |

3.1 Additional performance comparisons
In this section we perform additional comparisons between different predictors related to predicting heavy rainfall and generating false alarms for heavy rainfall. We also measure the correlation of different predictors with observed rainfall. Recall that denotes the observed rainfall and the prediction over time periods.
-
1.
Heavy rainfall predictor (HRP): This is calculated as the fraction of times predicted rainfall exceeds a value when the actual rainfall exceeds a higher value . A higher HRP value indicates that the model is effective in providing warnings for heavy rainfall. This is important in providing early warnings to people and authorities to prepare for contingencies related to high rainfall. For 1-day forecasts we use , and for 3-day forecasts, we use .
(2) -
2.
False alarm rate (FAR): This is given by the fraction of times predicted rainfall was above a large value when the actual rainfall was below a small value . FAR affects the credibility of the model. Higher the FAR, more likely that the warnings of heavy rainfall will be taken less seriously. For 1-day forecasts, we again set and .
(3) -
3.
Correlation Coefficient (CC): As in [6], we also study the correlation between the prediction over time periods and the observed rainfall. A higher absolute value of CC indicates a stronger linear relationship between the predicted and observed time series. Letting , the CC equals
(4)
Table 5 displays these metrics for all of India for 1-day as well as 3-day forecasts. Note that all numbers are reported as average of the respective metrics over all 357 grids. Tables 6 and 7 show the metrics HRP and FAR for 20 key cities in India for 1-day forecasts, and Tables 8 and 9 show these metrics for 3-day forecasts.
We make the following observations:
-
(a)
At all India level, in case of 1-day forecasts, NWP outperforms other models in terms of HRP, detecting about of high rainfall events. This however is due to its tendency to overestimate rainfall on most days. DL-HD at 77.2% displays relatively lower skill in detecting these events; this improves somewhat to 79% when trained along with NWP forecasts. Persistence reports a poor HRP of 57.3%.
-
(b)
The strength of DL-HD lies in that it has a high HRP and at 33.9%, a low FAR. NWP on the other hand has a high FAR of 65.6%. Persistence reports a reasonable FAR of .
-
(c)
For 3-day forecasts, DL-HD reports an impressive 95% HRP compared to 51.9% HRP by NWP and 59.6% HRP by persistence. The ensemble NWP+DL-HD represents a significant improvement over NWP alone, with HRP of .
-
(d)
DL-HD has the highest overall correlation with IMD data, for both 1-day (0.65) as well as 3-day forecasts (0.53). NWP reports much lower respective correlations of (0.24 and 0.32), persistence reports respective correlations (0.28, 0.22).
Model 1-day 3-day FAR (%) HRP(%) Correlation Coefficient FAR (%) HRP(%) Correlation Coefficient DL-HD 33.86 77.19 0.65 35.93 94.92 0.53 NWP 65.59 81.13 0.24 37.69 51.86 0.32 NWP+ 50.93 72.88 0.42 36.04 82.17 0.38 NWP+IMD 41.62 79.03 0.33 31.14 91.83 0.43 Persistence 44.22 57.28 0.28 34.22 59.62 0.22
Grid ACTL 30 DL-HD 10 NWP 10 NWP+ 10 NWP + DL-HD 10 PERST 10 Ahmedabad 9 6 7 4 7 4 Bangalore 10 5 7 3 7 4 Bhopal 25 17 22 19 22 14 Bhubaneswar 17 11 12 13 14 5 Chandigarh 11 7 5 4 5 6 Chennai 8 1 7 1 2 1 Coimbatore 4 2 3 1 0 1 Delhi 6 3 5 1 2 2 Gangtok 41 38 39 38 34 28 Hyderabad 16 7 14 6 8 5 Indore 6 3 4 3 3 3 Kochi 24 19 18 15 21 16 Kolkata 26 18 25 25 25 9 Lucknow 3 1 3 0 1 1 Mumbai 65 61 63 62 64 54 Patna 9 4 8 6 3 3 Pune 19 19 19 17 18 18 Raipur 20 15 14 13 17 11 Shimla 3 1 1 3 2 1 Vishakhapatnam 10 4 7 0 4 4 Total Events 332 242 283 234 259 190 HRP % - 72.89 85.24 70.48 78.01 57.23
Grid \columncolorlightgrayDL-HD 30 \columncolorlightgrayACTL 10 NWP 30 ACTL 10 \columncolorlightgrayNWP+ 30 \columncolorlightgrayACTL 10 NWP+DL-HD 30 ACTL 10 \columncolorlightgray PERST 30 \columncolorlightgrayACTL 10 Ahmedabad \columncolorlightgray23 \columncolorlightgray10 45 28 \columncolorlightgray11 \columncolorlightgray8 22 13 \columncolorlightgray9 \columncolorlightgray6 Bangalore \columncolorlightgray2 \columncolorlightgray0 30 23 \columncolorlightgray7 \columncolorlightgray6 5 4 \columncolorlightgray10 \columncolorlightgray8 Bhopal \columncolorlightgray28 \columncolorlightgray6 97 53 \columncolorlightgray55 \columncolorlightgray26 49 20 \columncolorlightgray25 \columncolorlightgray7 Bhubaneswar \columncolorlightgray26 \columncolorlightgray14 68 47 \columncolorlightgray30 \columncolorlightgray22 24 18 \columncolorlightgray17 \columncolorlightgray10 Chandigarh \columncolorlightgray6 \columncolorlightgray3 17 13 \columncolorlightgray2 \columncolorlightgray2 3 2 \columncolorlightgray11 \columncolorlightgray5 Chennai \columncolorlightgray1 \columncolorlightgray1 31 26 \columncolorlightgray0 \columncolorlightgray0 3 3 \columncolorlightgray8 \columncolorlightgray4 Coimbatore \columncolorlightgray18 \columncolorlightgray12 54 49 \columncolorlightgray0 \columncolorlightgray0 0 0 \columncolorlightgray4 \columncolorlightgray3 Delhi \columncolorlightgray4 \columncolorlightgray1 61 52 \columncolorlightgray0 \columncolorlightgray0 0 0 \columncolorlightgray6 \columncolorlightgray3 Gangtok \columncolorlightgray94 \columncolorlightgray34 162 85 \columncolorlightgray1 \columncolorlightgray0 64 21 \columncolorlightgray41 \columncolorlightgray16 Hyderabad \columncolorlightgray6 \columncolorlightgray5 78 52 \columncolorlightgray12 \columncolorlightgray9 23 13 \columncolorlightgray16 \columncolorlightgray12 Indore \columncolorlightgray18 \columncolorlightgray9 61 43 \columncolorlightgray5 \columncolorlightgray4 7 4 \columncolorlightgray6 \columncolorlightgray3 Kochi \columncolorlightgray44 \columncolorlightgray14 67 35 \columncolorlightgray49 \columncolorlightgray28 41 18 \columncolorlightgray25 \columncolorlightgray7 Kolkata \columncolorlightgray24 \columncolorlightgray13 101 66 \columncolorlightgray53 \columncolorlightgray34 46 28 \columncolorlightgray26 \columncolorlightgray14 Lucknow \columncolorlightgray10 \columncolorlightgray6 80 65 \columncolorlightgray5 \columncolorlightgray5 6 5 \columncolorlightgray3 \columncolorlightgray1 Mumbai \columncolorlightgray102 \columncolorlightgray18 153 60 \columncolorlightgray141 \columncolorlightgray52 111 21 \columncolorlightgray65 \columncolorlightgray9 Patna \columncolorlightgray7 \columncolorlightgray4 42 32 \columncolorlightgray1 \columncolorlightgray0 1 0 \columncolorlightgray9 \columncolorlightgray4 Pune \columncolorlightgray60 \columncolorlightgray11 150 83 \columncolorlightgray50 \columncolorlightgray16 16 0 \columncolorlightgray19 \columncolorlightgray2 Raipur \columncolorlightgray22 \columncolorlightgray7 91 59 \columncolorlightgray16 \columncolorlightgray10 31 13 \columncolorlightgray20 \columncolorlightgray12 Shimla \columncolorlightgray2 \columncolorlightgray1 13 12 \columncolorlightgray16 \columncolorlightgray13 5 4 \columncolorlightgray3 \columncolorlightgray3 Vishakhapatnam \columncolorlightgray7 \columncolorlightgray3 37 34 \columncolorlightgray3 \columncolorlightgray2 4 1 \columncolorlightgray10 \columncolorlightgray5 Total Events \columncolorlightgray504 \columncolorlightgray172 1438 917 \columncolorlightgray457 \columncolorlightgray237 461 188 \columncolorlightgray333 \columncolorlightgray134 % FAR \columncolorlightgray- \columncolorlightgray34.13 - 63.77 \columncolorlightgray- \columncolorlightgray51.86 - 40.78 \columncolorlightgray- \columncolorlightgray40.24
Grid ACTL 60 DL-HD 20 NWP 20 NWP+ 20 NWP+DL-HD 20 PERST 20 Ahmedabad 26 21 7 12 16 9 Bangalore 14 9 7 12 13 9 Bhopal 43 40 16 43 40 28 Bhubaneswar 31 30 12 25 29 14 Chandigarh 15 12 5 7 12 6 Chennai 7 6 1 4 6 2 Coimbatore 2 2 0 0 0 1 Delhi 10 4 1 0 0 1 Gangtok 70 70 52 67 70 49 Hyderabad 16 15 2 5 16 6 Indore 9 9 3 5 9 3 Shimla 6 6 1 6 6 3 Raipur 30 28 6 30 28 16 Pune 39 39 38 39 39 35 Kochi 43 43 24 43 42 25 Kolkata 29 29 14 29 29 17 Lucknow 5 5 4 4 5 1 Mumbai 96 93 66 91 93 74 Patna 9 8 5 7 7 6 Vishakhapatnam 12 12 8 12 11 5 Total Events 512 481 272 441 471 310 % HRP - 93.95 53.13 86.13 91.99 60.55
Grid \columncolorlightgrayDL-HD 60 \columncolorlightgrayACTL 20 NWP 60 ACTL 20 \columncolorlightgrayNWP+ 60 \columncolorlightgrayACTL 20 NWP + DL-HD 60 ACTL 20 \columncolorlightgrayPERST 60 \columncolorlightgrayACTL 20 Ahmedabad \columncolorlightgray49 \columncolorlightgray23 0 0 \columncolorlightgray7 \columncolorlightgray4 16 6 \columncolorlightgray15 \columncolorlightgray8 Bangalore \columncolorlightgray9 \columncolorlightgray7 5 2 \columncolorlightgray10 \columncolorlightgray2 36 22 \columncolorlightgray16 \columncolorlightgray9 Bhopal \columncolorlightgray65 \columncolorlightgray15 15 3 \columncolorlightgray30 \columncolorlightgray7 82 22 \columncolorlightgray48 \columncolorlightgray11 Bhubaneswar \columncolorlightgray86 \columncolorlightgray40 17 8 \columncolorlightgray41 \columncolorlightgray20 83 38 \columncolorlightgray30 \columncolorlightgray11 Chandigarh \columncolorlightgray27 \columncolorlightgray12 1 1 \columncolorlightgray7 \columncolorlightgray5 1 1 \columncolorlightgray17 \columncolorlightgray11 Chennai \columncolorlightgray6 \columncolorlightgray3 1 1 \columncolorlightgray0 \columncolorlightgray0 4 2 \columncolorlightgray11 \columncolorlightgray5 Coimbatore \columncolorlightgray67 \columncolorlightgray55 6 6 \columncolorlightgray0 \columncolorlightgray0 0 0 \columncolorlightgray8 \columncolorlightgray6 Delhi \columncolorlightgray17 \columncolorlightgray11 1 1 \columncolorlightgray1 \columncolorlightgray1 0 0 \columncolorlightgray8 \columncolorlightgray3 Gangtok \columncolorlightgray236 \columncolorlightgray75 35 5 \columncolorlightgray40 \columncolorlightgray5 61 9 \columncolorlightgray65 \columncolorlightgray18 Hyderabad \columncolorlightgray15 \columncolorlightgray7 8 8 \columncolorlightgray23 \columncolorlightgray15 40 20 \columncolorlightgray25 \columncolorlightgray12 Indore \columncolorlightgray46 \columncolorlightgray22 5 5 \columncolorlightgray21 \columncolorlightgray15 58 31 \columncolorlightgray18 \columncolorlightgray13 Kochi \columncolorlightgray179 \columncolorlightgray68 42 15 \columncolorlightgray80 \columncolorlightgray30 0 0 \columncolorlightgray44 \columncolorlightgray7 Kolkata \columncolorlightgray142 \columncolorlightgray66 8 4 \columncolorlightgray53 \columncolorlightgray22 42 17 \columncolorlightgray32 \columncolorlightgray12 Lucknow \columncolorlightgray28 \columncolorlightgray19 7 3 \columncolorlightgray5 \columncolorlightgray2 5 2 \columncolorlightgray12 \columncolorlightgray9 Mumbai \columncolorlightgray175 \columncolorlightgray37 28 4 \columncolorlightgray102 \columncolorlightgray12 152 26 \columncolorlightgray82 \columncolorlightgray6 Patna \columncolorlightgray29 \columncolorlightgray10 6 5 \columncolorlightgray8 \columncolorlightgray5 15 6 \columncolorlightgray13 \columncolorlightgray5 Pune \columncolorlightgray108 \columncolorlightgray19 44 5 \columncolorlightgray59 \columncolorlightgray8 49 1 \columncolorlightgray44 \columncolorlightgray7 Raipur \columncolorlightgray69 \columncolorlightgray24 14 7 \columncolorlightgray68 \columncolorlightgray36 79 35 \columncolorlightgray35 \columncolorlightgray14 Shimla \columncolorlightgray8 \columncolorlightgray5 13 11 \columncolorlightgray23 \columncolorlightgray17 24 16 \columncolorlightgray6 \columncolorlightgray4 Vishakhapatnam \columncolorlightgray24 \columncolorlightgray12 13 10 \columncolorlightgray1 \columncolorlightgray1 13 3 \columncolorlightgray13 \columncolorlightgray8 Total Events \columncolorlightgray1385 \columncolorlightgray530 269 104 \columncolorlightgray579 \columncolorlightgray207 760 257 \columncolorlightgray542 \columncolorlightgray179 % FAR \columncolorlightgray- \columncolorlightgray38.27 - 38.66 \columncolorlightgray- \columncolorlightgray35.75 - 33.82 \columncolorlightgray- \columncolorlightgray33.03
4 Conclusion
In this draft version, we compared monsoon rainfall forecasts across India, one day as well as three days in advance at a spatial resolution of . We trained a deep neural network using historical rainfall data to arrive at DL-HD forecasts. These were compared to persistence based forecasts as well as NWP forecasts obtained from NCEP.
We found that forecasts obtained by DL-HD are substantially more accurate compared to NWP forecasts as well as predictions based on persistence. On average, compared to our predictions. We also discussed the improvement in performance of NWP predictions when they are combined with data from neighbouring grids as well as with DL-HD predictions. We further observed that data up to 20 days in the past is useful in reducing errors of one and three day forecasts, especially when the transformer based learning architecture is used.
As noted in the abstract, a key conclusion suggested by our preliminary analysis is that more and diverse data relevant to monsoon prediction, including satellite and radar based data, combined with carefully selected neural network architecture is likely to substantially improve upon existing NWP forecasts.
Acknowledgements: We would like to thank Sandip Trivedi, TIFR for motivating us to work on weather modelling and for related discussions. We thank MN Rajeevan, Atria University, Debasis Sengupta, ICTS, Rama Govindrajan, ICTS and Partha Mukhopadhyay, IITM for many helpful discussions.
References
- [1] Madhavan Nair Rajeevan. T.N. rains— Predicting extreme rainfall events using probabilistic forecasts. https://www.thehindu.com/sci-tech/science/predicting-extreme-rainfall-events-using-probabilistic-forecasts/article67666205.ece#, 23-12-2023.
- [2] Bhupendra Nath Goswami and Prince K Xavier. Potential predictability and extended range prediction of indian summer monsoon breaks. Geophysical Research Letters, 30(18), 2003.
- [3] Madhaven Rajeevan, Jyoti Bhate, and Ashok K Jaswal. Analysis of variability and trends of extreme rainfall events over india using 104 years of gridded daily rainfall data. Geophysical research letters, 35(18), 2008.
- [4] Copernicus Climate Change Service. Seasonal forecast daily and subdaily data on single levels, 2018.
- [5] IMD. Numerical Weather Prediction Guidance. https://mausam.imd.gov.in/responsive/pdf_viewer_css/met1/Chapter-8%20page%20174-190/Chapter-8%20page%20174-190.pdf, 19-04-2017.
- [6] Bipin Kumar, Namit Abhishek, Rajib Chattopadhyay, Sandeep George, Bhupendra Bahadur Singh, Arya Samanta, BSV Patnaik, Sukhpal Singh Gill, Ravi S Nanjundiah, and Manmeet Singh. Deep learning based forecasting of indian summer monsoon rainfall. algorithms, 9(11):13, 2021.
- [7] M Rajeevan, Pulak Guhathakurta, and V Thapliyal. New models for long range forecasts of summer monsoon rainfall over north west and peninsular india. Meteorology and Atmospheric Physics, 73:211–225, 2000.
- [8] M Rajeevan, DS Pai, R Anil Kumar, and B Lal. New statistical models for long-range forecasting of southwest monsoon rainfall over india. Climate Dynamics, 28:813–828, 2007.
- [9] Bhupendra Nath Goswami, MS Madhusoodanan, CP Neema, and Debasis Sengupta. A physical mechanism for north atlantic sst influence on the indian summer monsoon. Geophysical Research Letters, 33(2), 2006.
- [10] G Venkata Rao, Keesara Venkata Reddy, Venkataramana Sridhar, Raghavan Srinivasan, NV Umamahesh, and Deva Pratap. Evaluation of ncep-gfs-based rainfall forecasts over the nagavali and vamsadhara basins in india. Atmospheric Research, 278:106326, 2022.
- [11] Haixu Wu, Jiehui Xu, Jianmin Wang, and Mingsheng Long. Autoformer: Decomposition transformers with auto-correlation for long-term series forecasting. Advances in Neural Information Processing Systems, 34:22419–22430, 2021.
- [12] Remi Lam, Alvaro Sanchez-Gonzalez, Matthew Willson, Peter Wirnsberger, Meire Fortunato, Ferran Alet, Suman Ravuri, Timo Ewalds, Zach Eaton-Rosen, Weihua Hu, et al. Learning skillful medium-range global weather forecasting. Science, 382(6677):1416–1421, 2023.
- [13] Tung Nguyen, Johannes Brandstetter, Ashish Kapoor, Jayesh K Gupta, and Aditya Grover. Climax: A foundation model for weather and climate. arXiv preprint arXiv:2301.10343, 2023.
5 Appendix
| Parameters | DL-HD (LSTM) | NWP | NWP+ |
|---|---|---|---|
| Batch size | 64 | 24 | 24 |
| Hidden layers | 400-100-50-357 | 32-16-1 | 32-16-1 |
| Activation function | Default-Default-Sigmoid | ReLU-Sigmoid | ReLU-Sigmoid |
| Epochs | 300 | 100 | 100 |
| Early stopping | 20 | 10 | 10 |
| Dates | DL-HD | NWP | NWP+ | NWP+DL-HD | Persistence |
|---|---|---|---|---|---|
| 1-July-2021 | 15.82 | 21.64 | 19.04 | 17.69 | 21.87 |
| 15-July-2021 | 18.29 | 36.63 | 28.85 | 21.46 | 25.61 |
| 30-July-2021 | 31.21 | 48.23 | 39.63 | 29.81 | 39.22 |
| 15-August-2021 | 7.27 | 21.69 | 14.66 | 11.14 | 9.79 |
| 30-August-2021 | 17.59 | 27.68 | 21.98 | 16.24 | 23.56 |
| 1-July-2022 | 26.75 | 43.97 | 37.21 | 33.18 | 34.51 |
| 15-July-2022 | 38.52 | 58.01 | 45.03 | 34.98 | 50.11 |
| 30-July-2022 | 17.63 | 24.33 | 20.39 | 18.22 | 27.22 |
| 15-August-2022 | 42.89 | 59.38 | 64.81 | 47.31 | 76.62 |
| 30-August-2022 | 17.95 | 22.21 | 19.94 | 17.29 | 21.23 |
| Dates | DL-HD | NWP | NWP+ | NWP+DL-HD | Persistence |
|---|---|---|---|---|---|
| 1-July-2021 | 16.91 | 27.72 | 21.28 | 18.44 | 17.51 |
| 15-July-2021 | 18.11 | 31.57 | 24.71 | 19.86 | 22.51 |
| 30-July-2021 | 18.69 | 35.42 | 31.33 | 21.68 | 24.19 |
| 15-August-2021 | 9.38 | 24.48 | 25.97 | 11.89 | 11.01 |
| 30-August-2021 | 18.65 | 29.22 | 23.17 | 18.32 | 25.29 |
| 1-July-2022 | 19.96 | 30.02 | 26.57 | 21.89 | 24.61 |
| 15-July-2022 | 23.86 | 37.15 | 28.29 | 22.71 | 26.03 |
| 30-July-2022 | 15.32 | 27.49 | 20.81 | 14.69 | 19.45 |
| 15-August-2022 | 34.16 | 50.61 | 42.89 | 37.35 | 37.57 |
| 30-August-2022 | 15.23 | 28.64 | 20.58 | 18.92 | 17.18 |