BreakGPT: A Large Language Model with Multi-stage Structure for Financial Breakout Detection
Abstract.
Trading range breakout (TRB) is a key method in the technical analysis of financial trading, widely employed by traders in financial markets such as stocks, futures, and foreign exchange. However, distinguishing between true and false breakout and providing the correct rationale cause significant challenges to investors. Recently, large language models have achieved success in various downstream applications, but their effectiveness in the domain of financial breakout detection has been subpar. The reason is that the unique data and specific knowledge are required in breakout detection. To address these issues, we introduce BreakGPT, the first large language model for financial breakout detection. Furthermore, we have developed a novel framework for large language models, namely multi-stage structure, effectively reducing mistakes in downstream applications. Experimental results indicate that compared to GPT-3.5, BreakGPT improves the accuracy of answers and rational by 44%, with the multi-stage structure contributing 17.6% to the improvement. Additionally, it outperforms ChatGPT-4 by 42.07%. Our Code is publicly available: https://github.com/Neviim96/BreakGPT
1. Introduction
Fundamental and technical analysis are the two primary methods of analysis in the field of financial investment. Due to the ineffectiveness of the Efficient Market Hypothesis in real financial markets (Malkiel, 2003; Stout, 2002; Ball, 2009), the importance of technical analysis is increasingly recognized (Blume et al., 1994; Taylor and Allen, 1992; Lo et al., 2000). Technical analysis typically predicts the price trends of commodities through charts, generally including tools like Moving Average, Moving Average Convergence Divergence, On-Balance Volume, and Trading Range Breakout (Kilgallen, 2012; Singh et al., 2023; Lanbouri and Achchab, 2020; Tsang et al., 2009; Holmberg et al., 2013). Trading Range Breakout (TRB) indicates that commodities will emit buy or sell signals when breaking through their original price range, allowing traders to profit based on these signals.
In previous studies, the performance of TRB ranks among the top in technical analysis (Zhu et al., 2015; Lubnau and Todorova, 2014), making it a favorite among investors. However, breakouts often accompany false signals, leading to losses, and distinguishing between true and false breakouts has become a challenge for investors (Zhang et al., 2020; Elder, 2002). Moreover, the investment field demands high explainability from models, and investors should be able to provide intuitive and reliable reasons for their decisions to corporate executives and government regulatory agencies (Laux et al., 2024; Ben David et al., 2021; Fritz-Morgenthal et al., 2022). Recently, large language models have achieved success in downstream fields such as medicine, education, and natural sciences (Wu et al., 2023; Li et al., 2023; Luo et al., 2022; Bi et al., 2023; Kraljevic et al., 2021; Sarrion, 2023; Liu et al., 2023, 2021), but remain unexplored in the domain of financial breakout detection. In this study, we attempt to address the mentioned challenges using large language models.
Large language models are capable of cross-domain tasks. However, they failed to accurately detect true and false financial breakouts in our experiments, primarily due to three issues: 1) Lack of specialized knowledge. For instance, ChatGPT-3.5 and ChatGPT-4 showed a lack of domain knowledge in responding to breakout detection queries; 2) The appearance of mistakes, which can be categorized into commonsense and non-commonsense mistakes. Commonsense mistakes refer to errors in basic knowledge, such as counting errors, Image recognition error, and calculation mistakes. In financial breakout detection, this often manifests as incorrect identification of resistance levels and historical trends; 3) Unstable outputs. As large language models generate responses based on certain probabilities, the outputs may vary each time. In other downstream tasks like customer service, novel writing, and translation, this inconsistency has minimal impact on performance, as the overall meaning remains similar. However, in the field of financial breakout detection, the inconsistency in specific words or numbers directly affects model performance. For example, ChatGPT-3.5 might output a resistance level of 1000.25 in one trial and 1000.75 in another attempt for the same input. This inconsistency challenges the reliability of the model.
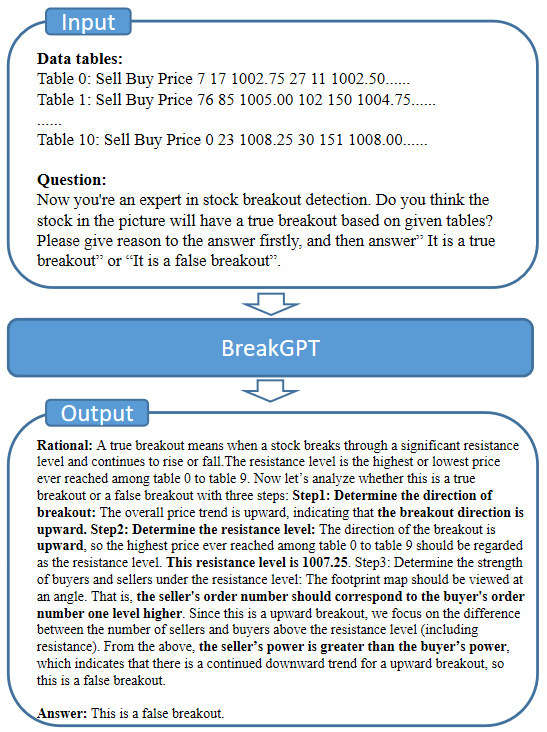
To address these shortcomings, we introduce BreakGPT, the first large language model in the domain of financial breakout detection as shown in Figure 1. BreakGPT supplements breakout detection expertise on top of ChatGPT-3.5. Additionally, to tackle the appearance of mistakes and instability in breakout detection, we propose a Multi-stage framework. We believe that these issues may arise from lengthy single-text outputs. In the multi-stage framework, we segment the rationale itself, allowing BreakGPT to focus on one subtask at a time in each output.
Our experiments demonstrate that BreakGPT outperforms other general large language models in several aspects. Compared to ChatGPT-3.5, BreakGPT shows significant improvement (44%).
In summary, BreakGPT contributes in three major parts:
-
•
We introduce the first financial breakout detection model, BreakGPT, demonstrating the domain knowledge of breakout detection.
-
•
We propose a multi-stage structure which segments the rationale. It can reduce mistakes and stability issues in large labguage models for downstream tasks.
-
•
We create the first dataset for financial breakouts, which is helpful to further researches.
2. related work
2.1. Technical Analysis
Technical analysis refers to the study aimed at predicting future market price movements based on historical chart data (Murphy, 1999). From the perspective of traditional researchers in finance field, the current price of financial products already reflects the market supply and demand relationship, and future trends are akin to a ”random walk,” without any discernible pattern. Under this view, stock price fluctuations are unpredictable, and technical analysis, which relies on historical data, was once overlooked by mainstream scholars (Levy, 1967). The emergence of the Efficient Market Hypothesis argued against the reliability of technical analysis on a theoretical level, further marginalizing technical analysis. According to the Efficient Market Hypothesis, the current price of financial products reflects all available and valuable information at the moment, suggesting that investors cannot achieve excess returns by analyzing historical data (Fama, 1970). However, over time, the limitations of the Efficient Market Hypothesis have become increasingly apparent (Malkiel, 2003; Stout, 2002; Ball, 2009). It assumes that all market participants are rational and that information changes are quickly reflected in prices. In reality, not all investors are rational; for example, retail investors without financial trading knowledge may exhibit herd behavior. Moreover, the speed of information dissemination is limited and cannot be immediately reflected in stock prices. Due to the shortcomings of the Efficient Market Hypothesis, technical analysis has returned to scholars’ focus, validating its profitability in the market.
2.2. Trading Range Breakout
Trading Range Breakout (TRB) is a significant technique in technical analysis. It posits that a struggle for price control exists between bulls and bears at a certain price level. Once the price breaks through this contested level, it forms a strong support, ensuring that the financial product does not fall back in the short term. In real markets, it’s common to observe a stock fluctuating within a price range, and once it breaks out of this range, it tends to continue rising. When employing TRB techniques, it’s crucial to determine the direction of the breakout and the resistance levels. The breakout direction is based on its historical trend, while resistance levels are the contested price points, usually the historical highs or lows. Additionally, according to order flow rules (Chordia et al., 2002; Gosnell et al., 1996), the balance of buying and selling forces around resistance levels can indicate the breakout’s authenticity. For example, in an upward breakout, if there are more buy orders than sell orders above the resistance level, the product is less likely to fall back in the short term, indicating a true breakout.
2.3. Large Language Models
Large language models are massive deep learning models, marking a revolutionary achievement in the field of AI. Large language models, such as Bert (Devlin et al., 2018) and Gpt (Radford et al., 2018, 2019; Brown et al., 2020), utilize complex neural networks and are trained with billions or even trillions of parameters on vast text data, enabling them to perform a wide range of natural language tasks. With technological advancements, the impact of large language models on downstream domains has progressively deepened. They are fine-tuned and have achieved success in downstream fields such as medicine (Kraljevic et al., 2021; Li et al., 2023), education (Sarrion, 2023), finance (Wu et al., 2023; Liu et al., 2021), and natural sciences (Luo et al., 2022; Bi et al., 2023; Liu et al., 2023).
2.4. Chain of Thought
In the application of large models, the occurrence of incorrect answers is a challenge, and Chain of Thought (CoT) is one of the solutions to this problem. The essence of CoT lies in prompting large language models to provide a reasoning process before delivering an answer. In pioneering works in this domain, scholars manually designed examples for large language models to learn the reasoning process in the examples, thus providing correct rationales and answers when addressing the required questions (Wei et al., 2022). Subsequently, scholars have sought new paradigms, such as zero-shot CoT (Kojima et al., 2022) and Auto-CoT (Zhang et al., 2022). However, the use of Chain of Thought can still lead to incorrect responses from large language models. To address this issue, some researchers have attempted to introduce new modalities (Zhang et al., 2023; Lu et al., 2022).
3. problem
Our task is to determine whether a given financial product is experiencing a true breakout or a false breakout based on footprint chart data, using a large language model and the order flow rule, and to provide reasonable rational for our decision. The specific definitions are as follows:
Input
In this study, the input table data consists of the raw data from the footprint charts of financial products. Specifically, it should include all price information for the financial product in each time unit and the number of orders from both buyers and sellers at each price level. Footprint chart data contains more information than single historical price trend data, which aids in more rationally determining the authenticity of breakouts.
Given the complexity of footprint chart data, we have also defined the format for the raw data of footprint charts. Taking eleven time units as an example, the format of the raw data is: table 0: sell buy price 82 265 1001.50; table 1: sell buy price…;…;table 10: sell buy price… Each table, from table 0 to table 10, represents eleven consecutive time units (e.g., eleven minutes, eleven hours), and each table contains three types of data: buy, sell, and price. For instance, table 0: sell buy price 82 265 1001.50 indicates that in that time unit, there were 82 sell orders and 265 buy orders at the price of 1001.50.
Output
The output of the task should be rational and answers. The investment field has high requirements for the explainability of decisions and the readability of reports. Outputting answers alone would diminish the model’s performance in these aspects and cause regulatory issues. Moreover, auditing the rationality of reasons can reduce the overly high accuracy of answers resulting from guesses.
True and False Breakouts
Different time scales can lead to different resistances and authenticity of breakouts. In this study, the highest or lowest price in the ten time ticks prior to the current time ticks (on the verge of a breakout) is considered the resistance level. If the close price does not fall back to the resistance level within the two time units following the current one, it is considered a true breakout; if the close price falls back to the resistance level within these two time units, it is considered a false breakout.
4. method
4.1. Model Overview
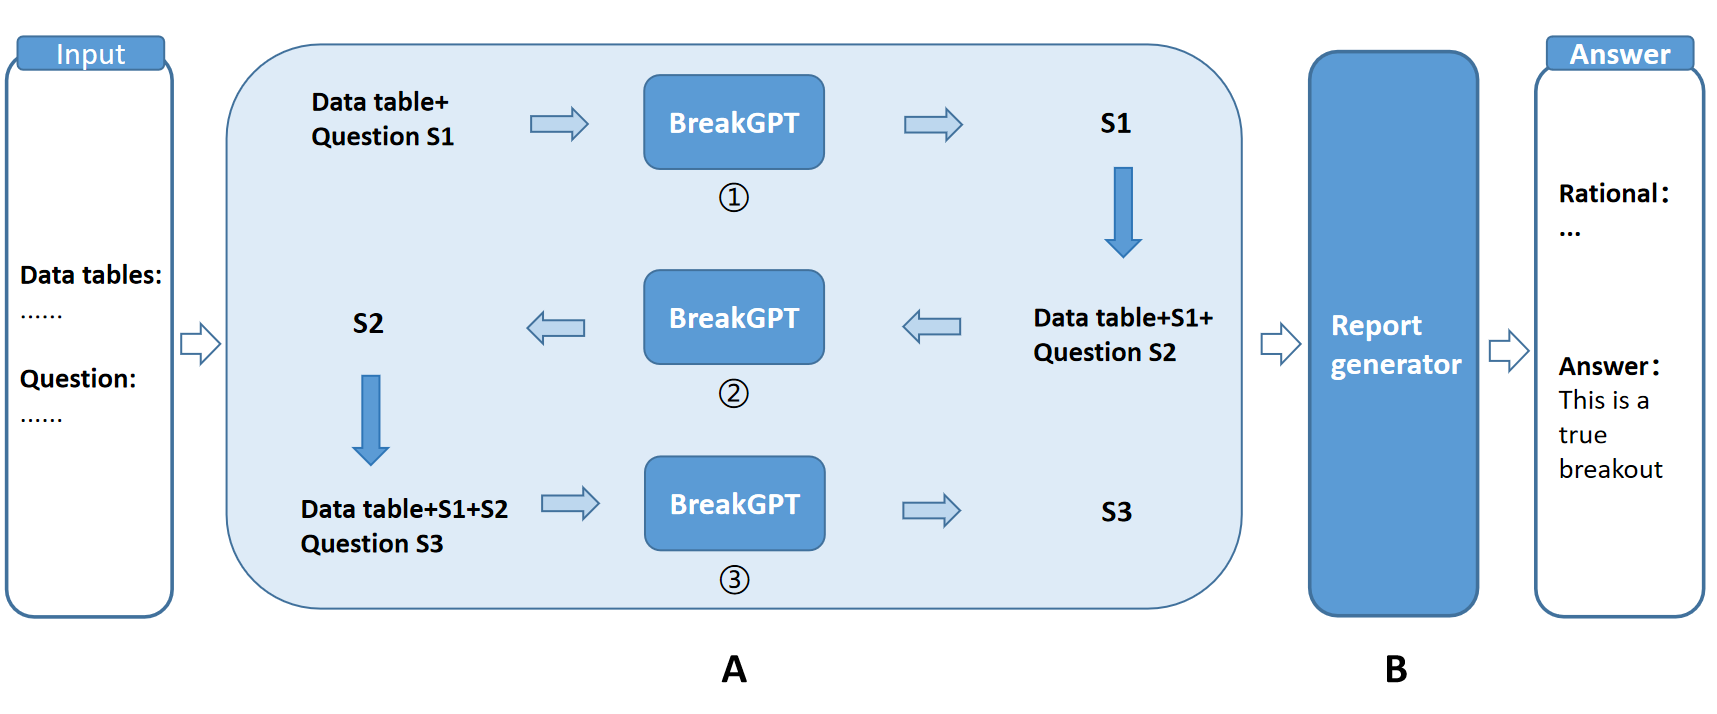
Our model is designed for true and false breakout detection, with inputs being specialized data tables and prompts about the kind of the breakout. The framework is shown in Figure 2. The model employs a Multi-stage structure, consisting of two parts: Part A) Task Flow. This involves a chain of special tasks, including our trained large language model, BreakGPT. The purpose of the Task Flow is to divide the entire task into multiple sub-tasks, outputting the results of each sub-task sequentially rather than providing a complete task result at once. The input to the entire task chain is the model’s input, i.e., the data tables and prompts, with the output being the results of various special sub-tasks; Part B) Report Generator. The role of the report generator is to synthesize the outputs of the Task Flow and provide a conclusion on the authenticity of the breaktout, thereby producing a report with rationale and answers.
4.2. Multi-stage Part A: Task Flow
The Task Flow primarily consists of three parts: Stage 1 (S1) task, Stage 2 (S2) task, and Stage 3 (S3) task. In each part, we use BreakGPT to obtain the results of the tasks. For the breakout detection, we utilize the order flow criterion. Firstly, we need to determine the direction of the entire breakthrough. If the historical price shows an upward trend, it indicates an upward breakout. Conversely, if the historical price trends downward, the direction of the breakout is downward. Secondly, the resistance level of the breakout needs to be identified. Identifying the resistance level depends on the direction of the breakout. For an upward breakthrough, its resistance level is the historical price’s highest value, defined as the highest price point in the ten time units preceding the current time. For a downward breakout, its resistance level is the historical price’s lowest value. Thirdly, we need to compare the forces of buyers and sellers, with the comparison point varying based on the results of the previous two steps. For an upward breakout, we compare the number of buy and sell orders above the resistance level, and vice versa for a downward breakout. The side with more orders is considered the stronger force. These three steps correspond to Task S1, Task S2, and Task S3, respectively.
4.2.1. BreakGPT
In this part, we introduce BreakGPT, the core model of our study. BreakGPT is mainly responsible for completing tasks in Stages 1-3, outputting key evidence for determining the authenticity of the breakout. The base model of BreakGPT uses gpt-3.5-turbo-1106, which performs better than many open-source large models. We fine-tune gpt-3.5 using the API, selecting 10 epochs for training.
Dataset: To train BreakGPT, we created the first dataset for financial breakout detection. The dataset includes 10 training data groups for each of the tasks S1, S2, and S3, totaling 30 groups. Each type of breakout, true and false, has 5 groups. Each training data group consists of three parts: system, user question, and assistant response. The system refers to the introduction of the model, e.g., ”BreakGPT is an expert in stock breakout detection.” The user question is what the model is tasked to do, acting as the model’s input during the task, e.g., in task S1, the content of the user part is the processed data table and the question for task S1. The assistant is the model’s response to the question, e.g., in task S1, the assistant’s response is the basis for determining the breakout direction and the answer. The source data for the user part is collected as minute level S & P 500 future data from the NinjaTrader platform, a professional futures data provider. Due to the complexity of trading data, the source data from NinjaTrader is difficult to adapt to large
language models. Therefore, we processed the collected source data into a unique data table format, making it part of the training data’s question section, which adapts well to large language models. The data of ”assistant” is mainly annotated by professionals, who respond to the user’s questions in S1, S2, and S3 and use these responses as the content for training BreakGPT. Additionally, we ensure the accuracy of human data annotation based on real market situations.
4.2.2. Stage 1 Task
In Stage 1, the trend of the breakout is detected, primarily through BreakGPT. Special data formats and prompts about the direction of the breakthrough are input into BreakGPT, which then outputs the answer for S1. Example: Input: Table 0: Sell Buy Price 0 59 1007.00; Table 1: Sell Buy Price …; …; Table 10: Sell Buy Price … What is the direction of the breakout based on the given tables? Please give the reason for the answer first, and then answer ”upward” or ”downward.” Output: …(Rationale)… The answer: …(Upward/Downward).
4.2.3. Stage 2 Task
Stage 2 is mainly responsible for identifying the resistance level of the breakout. The data format, along with the result of S1, is re-entered into BreakGPT, which then outputs the detected resistance level. Example: Input: Table 0: Sell Buy Price 0 59 1007.00; Table 1: Sell Buy Price …; …; Table 10: Sell Buy Price … Now you’re an expert in stock breakout detection. The direction of the breakout is upward. What is the resistance level based on the given tables? Please give the reason for the answer first, and then answer the question. Output: …(Rationale)… The answer: …(The resistance level).
4.2.4. Stage 3 Task
Stage 3 is used to compare the forces of buyers and sellers above or below the resistance level of the target financial product. The method involves inputting data charts and the results of S1 and S2 into BreakGPT, then determining whether the buyer’s or seller’s side is stronger. Example: Input: Table 0: Sell Buy Price 0 59 1007.00; Table 1: Sell Buy Price …; …; Table 10: Sell Buy Price … Now you’re an expert in stock breakout detection. The direction of the breakout is downward. The resistance level is 1005.75. In terms of the number of orders, which side (buyer/seller) has more orders above the resistance level? Please give the reason for the answer first, and then answer the question. Output: …(Rationale)… The answer: …(Seller side/Buyer side).
4.3. Multi-stage Part B: Report Generator
The Report Generator is another large language model in our study. Its function is to aggregate the answers from BreakGPT in various sub-tasks and output a professional analysis report with the conclusion on the authenticity of the breakthrough. It fundamentally differs from BreakGPT in functionality, hence it is trained separately. The base model of the Report Generator is consistent with BreakGPT, selecting gpt-3.5-turbo-1106, and further fine-tuned using the API.
The training data for the Report Generator mainly includes 10 training data groups, each formatted similarly to BreakGPT, consisting of System, Assistant, and User parts. The Assistant primarily involves the answers from BreakGPT in tasks S1-3 and the prompts for report generation. The User is the breakout analysis report generated based on the answers from S1-3 and the conclusion on the breakout’s authenticity. This part is annotated by humans. We ensured the professionalism of the annotations through professional assessment, and the accuracy of the genuine and false breakthroughs in the training data was verified based on real market information.
5. experiment
In this section, we primarily introduce our experimental methods, followed by presenting the main experimental results, and finally, the ablation study is displayed.
5.1. Experiment Results Highlights
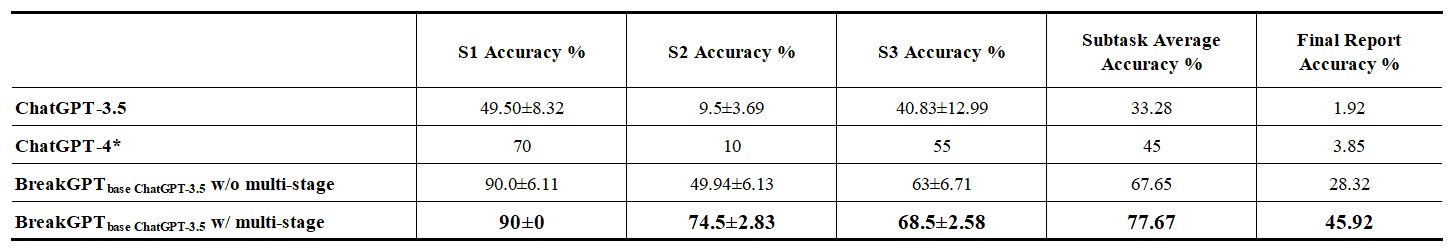
The highlights of the experiment results are shown as figure 3. The results demonstrate that BreakGPT with a Multi-Stage structure significantly outperforms other models in multiple sub-tasks.
BreakGPT with a multi-Stage structure improved by 44% and 42.07% respectively compared to ChatGPT-3.5 and ChatGPT-4, with 17.6% and 24.47% of this improvement attributable to the Multi-Stage structure. The most significant improvement was observed in Stage 2 (judging the resistance level), where BreakGPT with a Multi-Stage structure showed a 65% improvement (from 9.50% to 74.50%) compared to GPT3.5. The effect of the Multi-Stage structure is also evident, contributing 24.56% (from 49.94% to 74.50%).
The accuarcy stability of BreakGPT with a multi-Stage structure is clearly superior in various sub-tasks. For example, in Stage 3, the standard deviation decreased sequentially from 12.99 to 6.71 to 2.58, from before training (ChatGPT3.5), after training (BreakGPT without multi-Stage structure), and after adjustment with the multi-Stage structure, respectively.
This summary provides an overview of the experimental outcomes, highlighting the significant advantages of implementing a Multi-Stage structure in BreakGPT, both in terms of accuracy and stability, across the various stages of the experiment. The addition of GPT-4 into the comparative analysis further emphasizes the performance enhancements achieved through the specialized architecture and training of BreakGPT.
5.2. Main Experiment
In this section, we introduce the main experiment of this study. We sequentially present an overview and the results of the main experiment.
5.2.1. Main Experiment Overview
The experimental subjects, objectives, evaluation methods, and the dataset are introduced as follows.
The experimental subject of the main experiment is BreakGPT with Multi-Stage structure. This model is trained based on GPT-3.5. BreakGPT is the first large language model designed for financial product breakthrough detection, and there are no comparable LLMs with identical functionality. Therefore, we have chosen the commercially available high-performance large language models, ChatGPT-3.5 and ChatGPT-4, as baseline models. Moreover, at the end of the main experiment, the Report Generator is tested. The purpose of this experiment is mainly to demonstrate the performance comparison in terms of specialization, accuracy, and stability between the tested model BreakGPT and the baseline models.
Experimental Method: For the speciality of the model, we use human evaluation to score the results of each tested model. For accuracy and stability tests, we mainly use statistical methods, such as averages and standard deviations.
Dataset: We introduced the first dataset in financial breakout detection. The training set includes 10 sample groups for each of the tasks in stage 1, stage 2, and stage 3, totaling 30 groups of training data. The test set includes 20 sample groups for each of the tasks in stage 1, stage 2, and stage 3, totaling 60 groups of test data. To test the output stability of the models, each group of data will be tested 10 times, resulting in a total of 10*60=600 tests for each tested model.
5.2.2. Specialization Comparison in Main Experiment
We selected 20 test samples from the dataset and input them into BreakGPT, ChatGPT 3.5, and ChatGPT 4, obtaining 20 sets of results, as shown in Figure 4.
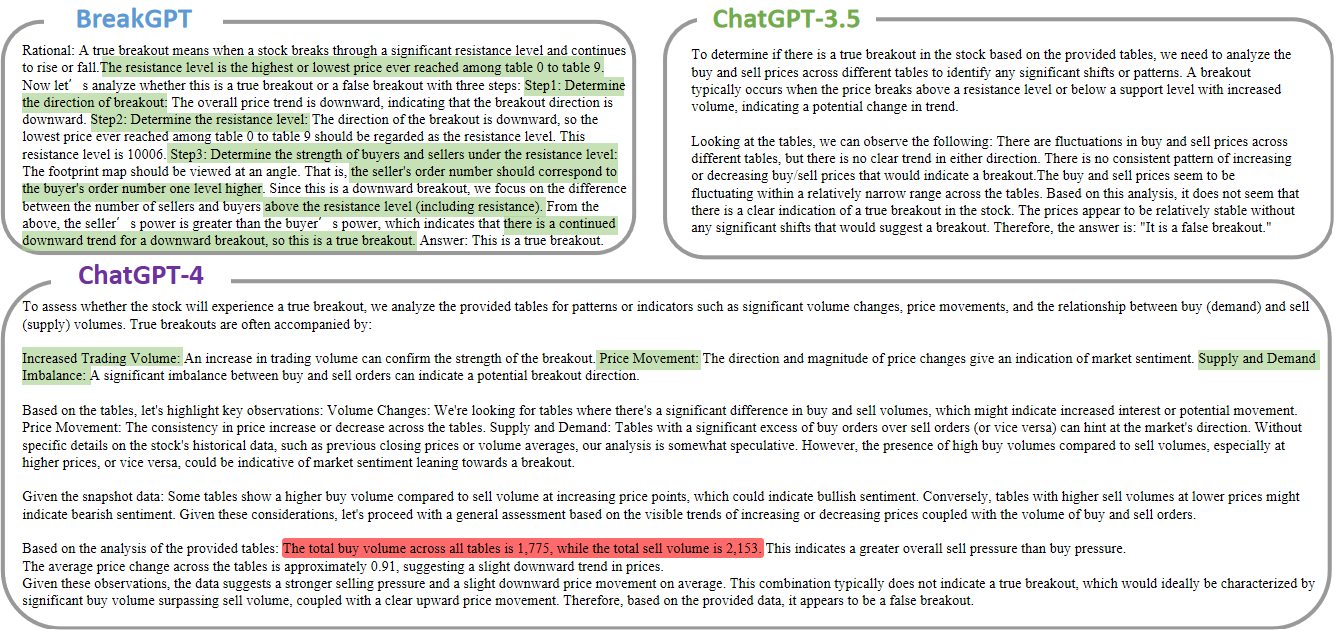
Since the judgment of model answer specialization is subjective, we adopted human scoring to evaluate the specialization of the three models. From the scoring results, it can be seen that BreakGPT scored the highest at 8 out of 10, with ChatGPT-4 averaging at 6, ranking second, and ChatGPT-3.5 with an average score of 3, ranking third.
According to the scoring opinions, BreakGPT showed clear structure and stability in the 20 test samples. The three-step method based on Order flow demonstrated knowledge. ChatGPT-4 showed the need to assess ”Price trend,” ”Volume Analysis,” and ”Consistency” in the tests, which improved its professionalism score. However, its answers often contained much redundant information and failed to clarify the distinction of resistance levels in the direction of breakout, reducing its professionalism. ChatGPT-3.5 was unstable and lacked judgment basis in the tests, showing a lack of domain knowledge.
5.2.3. Accuracy Comparison in Main Experiment
This part mainly compares the accuracy of the tested models in tasks Stage 1-3 and the final report. For tasks in Stage 1, Stage 2, and Stage 3, we used 20 test data sets. Due to the inconsistency of large language model outputs, we tested each set of test data 10 times in tasks S1-3 to avoid overly good or poor model performance. GPT-4 can call other software for analysis assistance during operation. However, due to the complexity of charts, it often encounters errors, and OpenAI has usage frequency limitations for GPT-4 accounts. When testing ChatGPT 4, we only record 20 sets of relatively good results for reference.
The accuracy calculation method for Stages 1-3 is as follows: if the model’s answer is correct, it is recorded as 1, otherwise as 0. The average of the 20 groups’ test results is denoted as X. Since each sample was tested 10 times, there are 10 sets of averages, . The accuracy of the tested model in the current task is
and the standard deviation of accuracy is the standard deviation of the array .
For the final answer’s accuracy, we compare the ”Right answer with correct rationale”. This calculation method aims to avoid falsely high accuracy rates due to random guesses. By using the ”Right answer with correct rationale” metric, we can avoid the situation where guessing leads to artificially high accuracy. The accuracy calculation for ”Right answer with correct rationale” is: S1 accuracy * S2 accuracy * S3 accuracy.
Stage 1-3 accuracy
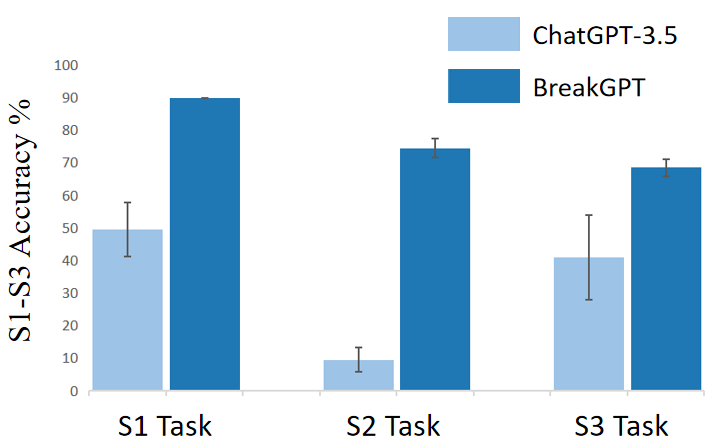
The following are the experimental results for the main trial’s accuracy. S1-3 Task represent three tasks respectively: breakout direction detection, resistance level determination, and comparison of buying and selling forces. As shown in Figure 5, BreakGPT’s performance on these three tasks is significantly better than that of ChatGPT-3.5. The largest gap is observed in Task S2, where BreakGPT achieves an accuracy of 74.5%, while the latter only has 9.5%.
Final Report Accuracy Comparison
To avoid falsely high accuracy due to guessing, this part compares the accuracy of the Report, i.e., the ”Right answer with correct rationale”. The final output results show a clear advantage of BreakGPT, with improvements of 44% compared to the base model, ChatGPT 3.5, and 42.07% compared to ChatGPT 4.
5.2.4. Stability Comparison in Main Experiment
The stability of BreakGPT and ChatGPT-3.5 are tested in this part. Three testing methods are used to better show the output stability differences between models. These testing methods include:
Testing Method A: Using the standard deviation of a (0, 1, 2) table. For sub-tasks S1 and S2, we test 20 groups of data 10 times, totaling 200 tests. The results are categorized into three scenarios: correct answer (1), wrong answer (0), and no answer (2). This calculation method differs slightly from the main experiment’s accuracy calculation because ChatGPT often refuses to answer. For example, if there are 5 wrong answers and 5 refusals to answer out of 10 outputs, recording all as 0 would result in a standard deviation of 0 for that group, falsely indicating high output stability. Assigning 2 to refusals to answer effectively reduces such false indications, making the comparison of model stability more reasonable. The calculation of the standard deviation is by taking the standard deviation of each sample group, then averaging the standard deviations of the 20 groups to represent the output stability of those 20 groups.
Testing Method B: Using the standard deviation of resistance level. For sub-task S2, resistance level judgment, we use the standard deviation of the actual answers as a measure of S2 stability since this task’s answers are not finite, allowing for a more accurate comparison of output stability between ChatGPT-3.5 and BreakGPT.
Testing Method C: Using stability pie charts. Since breakout detection results are used for investment decisions, there’s a demand for high consistency. Therefore, we count how many times out of 10 the outputs are 100% the same, 80% the same, 60% the same, and less than 60% the same for each of the 20 test samples, then draw pie charts. We are particularly interested in 100% consistency, indicating that all 10 outputs for a sample are identical, showing high reliability.
Stage 1 Stability Comparison
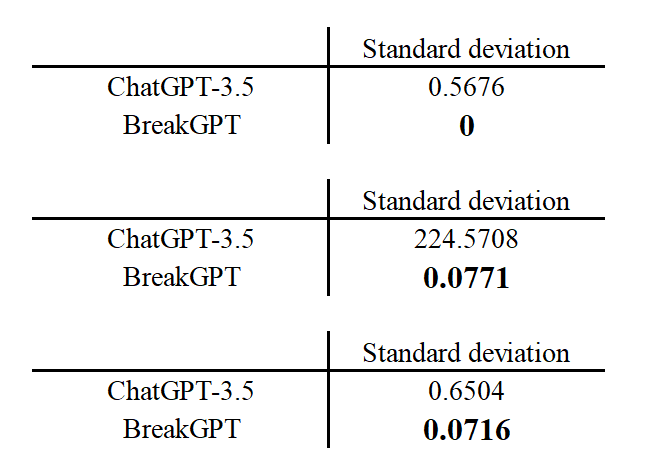
This part will compare the output stability of BreakGPT and ChatGPT-3.5 in the task of detecting the direction of the breakthrough. As shown in Figure 6 (standard deviation table), ChatGPT-3.5’s standard deviation is 0.5676, while BreakGPT’s is 0.
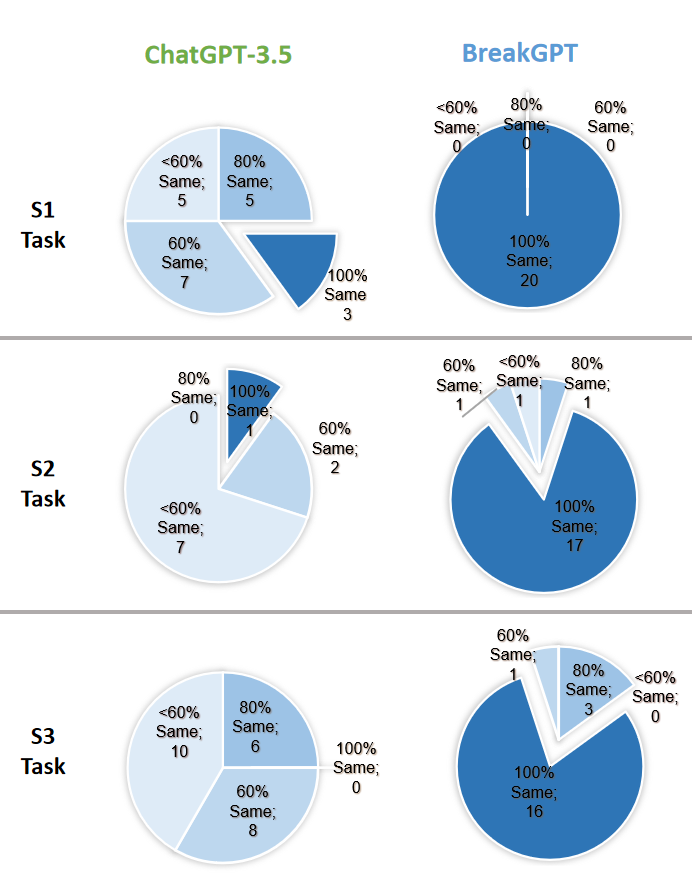
From figure 7, it is evident that all of BreakGPT’s test samples produced consistent outputs in 10 tries, indicating extremely high output stability, whereas ChatGPT’s consistently stable outputs only accounted for 15% of the total samples.
Stage 2 Stability Comparison
In Stage 2, we use the standard deviation of the actual resistance levels as the criterion for measuring model stability. S1 and S2 tasks represent the detection of the breaktout direction and the comparison of buying and selling forces, respectively, both of which have finite outputs (upward/downward breakthrough; stronger buying/stronger selling force), artificially inflating the stability of ChatGPT-3.5. However, the S2 task, which involves detecting the resistance level of the financial product, has non-finite answers and better reflects the output stability of ChatGPT-3.5 compared to BreakGPT.
From Figure 6, it is observed that the standard deviation for BreakGPT in S2 is only 0.0771, whereas ChatGPT-3.5’s standard deviation is as high as 224.57, showing a significant difference. This is because: 1) The output options for the S2 task are not finite; 2) The numerical output variation for ChatGPT-3.5 is large. The resistance levels for the 20 test samples fluctuated around 1000.00 by about 10 units, while ChatGPT-3.5 sometimes provided vastly different figures (e.g., 101, 334, 310), diminishing its performance in this part. In contrast, BreakGPT’s results generally varied within 1000.00-1008.00, showing minor numerical differences even among varied answers.
Moreover, the pie chart visually demonstrates the different output stability between the two models. The pie chart reveals that in 20 sample groups, 17 groups from BreakGPT consistently produced identical outputs, whereas ChatGPT-3.5 could only ensure that one group of test samples was consistent across all outputs.
Stage 3 Stability Comparison
In Stage 3, the standard deviation of the (0, 1, 2) number table is used to represent model stability. As shown in Figure 6, ChatGPT-3.5’s standard deviation is 0.6504, while BreakGPT’s standard deviation is significantly lower than that of ChatGPT-3.5, at 0.0716.
The pie chart shows that in BreakGPT, scenarios where all 10 outputs were consistent accounted for 80% of all samples, whereas for ChatGPT-3.5, this figure was 0%.
5.2.5. Report Generator
At the end of the main experiment, we evaluate the effectiveness of the Report Generator. We also selected 20 groups of test samples, each tested 10 times to verify the accuracy and stability of the Report Generator. In our tests, the Report Generator consistently achieved the expected results, which we attribute to the relatively simple nature of this task. It merely synthesizes the answers to sub-tasks and provides a verdict on the true or false breakthrough.
5.3. Ablation Study
This part of the ablation study is conducted to highlight the superiority of the Multi-stage structure. The subjects of the ablation study are: 1) BreakGPT with Multi-stage structure, and 2) BreakGPT without Multi-stage structure. In the ablation study, we will test and compare the accuracy and stability of the two models in tasks stage 1-3. The experimental method is similar to the main experiment.
5.3.1. Accuracy Comparison
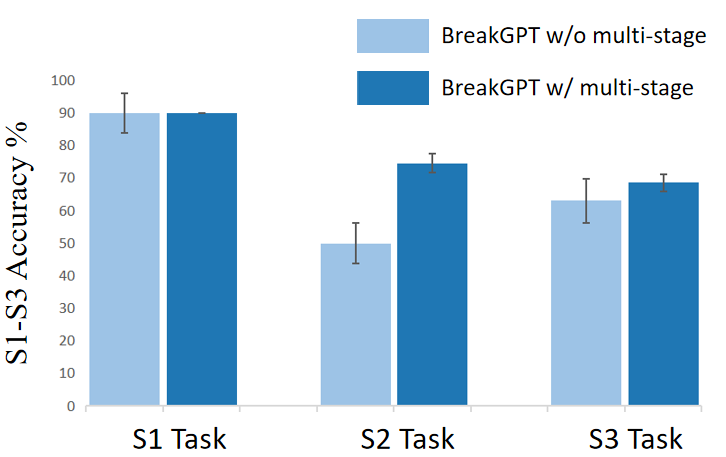
This section primarily showcases the improvement in model accuracy brought by the Multi-stage structure. As shown in figure 8, BreakGPT with Multi-stage structure has a slight advantage in tasks S1 and S2, mainly in the standard deviation of accuracy. In task S2, the improvement effect brought by the Multi-stage structure is evident, with the error bar of BreakGPT with Multi-stage structure above that of BreakGPT without Multi-stage structure. It increased the accuracy by 24.56%, and the standard deviation of accuracy decreased from 6.13 to 2.83.
5.3.2. Stability Comparison
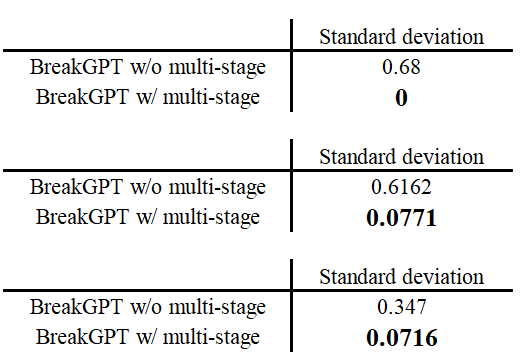
The Multi-stage structure can significantly enhance the output stability of the model. As seen in Figure 9, there is a reduction in the average standard deviation of the 10 outputs for the 20 test samples across tasks S1-3, with the most significant reduction in S1, from 0.68 to 0.
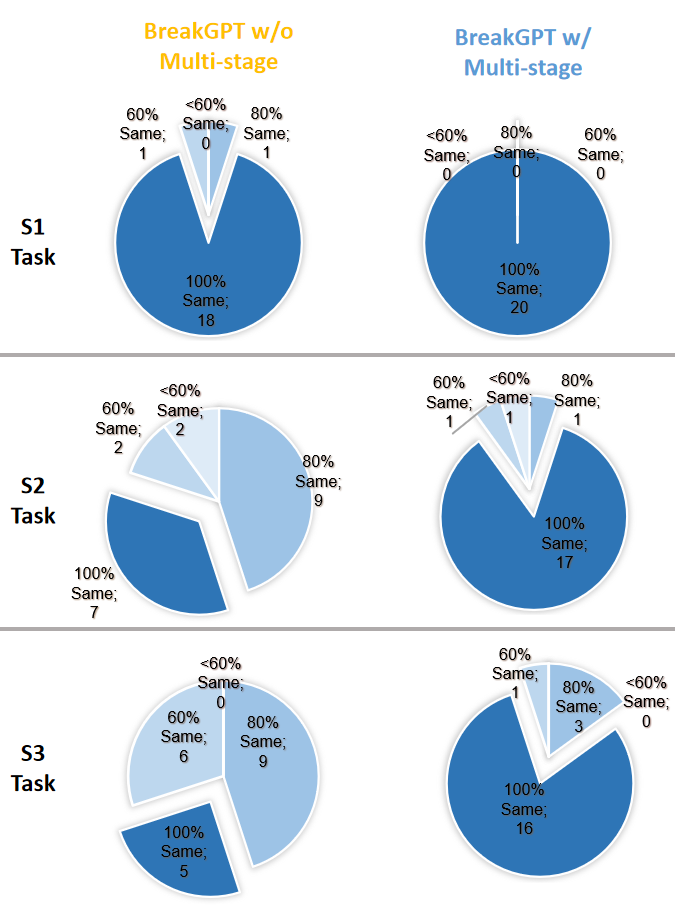
As shown in figure 10, it’s clear that the proportion of samples where 10 outputs were completely consistent in tasks S2 and S3 significantly increased with the Multi-stage structure, going from 35% to 85% in S2 and from 25% to 80% in S3.
6. conclusion
We introduced BreakGPT and Multi-stage structure. Multi-stage structure divides the downstream financial breakout detection task into two main parts and three sub-tasks, demonstrating through empirical evidence that our model outperforms ChatGPT-3.5 by 44%, with 17.6% of this improvement attributable to the Multi-stage structure. Also, it surpasses ChatGPT-4 by 42.07%.
The accuracy of S3 was lower than the other two sub-tasks. In future research, the S3 task could be subdivided more deeply to achieve better results. Moreover, the Multi-stage structure could be further applied to other downstream tasks to prove its compatibility across various tasks.
References
- (1)
- Ball (2009) Ray Ball. 2009. The global financial crisis and the efficient market hypothesis: what have we learned? Journal of Applied Corporate Finance 21, 4 (2009), 8–16.
- Ben David et al. (2021) Daniel Ben David, Yehezkel S Resheff, and Talia Tron. 2021. Explainable AI and adoption of financial algorithmic advisors: an experimental study. In Proceedings of the 2021 AAAI/ACM Conference on AI, Ethics, and Society. 390–400.
- Bi et al. (2023) Zhen Bi, Ningyu Zhang, Yida Xue, Yixin Ou, Daxiong Ji, Guozhou Zheng, and Huajun Chen. 2023. Oceangpt: A large language model for ocean science tasks. arXiv preprint arXiv:2310.02031 (2023).
- Blume et al. (1994) Lawrence Blume, David Easley, and Maureen O’hara. 1994. Market statistics and technical analysis: The role of volume. The journal of finance 49, 1 (1994), 153–181.
- Brown et al. (2020) Tom Brown, Benjamin Mann, Nick Ryder, Melanie Subbiah, Jared D Kaplan, Prafulla Dhariwal, Arvind Neelakantan, Pranav Shyam, Girish Sastry, Amanda Askell, et al. 2020. Language models are few-shot learners. Advances in neural information processing systems 33 (2020), 1877–1901.
- Chordia et al. (2002) Tarun Chordia, Richard Roll, and Avanidhar Subrahmanyam. 2002. Order imbalance, liquidity, and market returns. Journal of Financial economics 65, 1 (2002), 111–130.
- Devlin et al. (2018) Jacob Devlin, Ming-Wei Chang, Kenton Lee, and Kristina Toutanova. 2018. Bert: Pre-training of deep bidirectional transformers for language understanding. arXiv preprint arXiv:1810.04805 (2018).
- Elder (2002) Alexander Elder. 2002. Come into my trading room: A complete guide to trading. Vol. 146. John Wiley & Sons.
- Fama (1970) Eugene F Fama. 1970. Efficient capital markets: A review of theory and empirical work. The journal of Finance 25, 2 (1970), 383–417.
- Fritz-Morgenthal et al. (2022) Sebastian Fritz-Morgenthal, Bernhard Hein, and Jochen Papenbrock. 2022. Financial risk management and explainable, trustworthy, responsible AI. Frontiers in artificial intelligence 5 (2022), 779799.
- Gosnell et al. (1996) Thomas F Gosnell, Arthur J Keown, and John M Pinkerton. 1996. The intraday speed of stock price adjustment to major dividend changes: Bid- ask bounce and order flow imbalances. Journal of Banking & Finance 20, 2 (1996), 247–266.
- Holmberg et al. (2013) Ulf Holmberg, Carl Lönnbark, and Christian Lundström. 2013. Assessing the profitability of intraday opening range breakout strategies. Finance Research Letters 10, 1 (2013), 27–33.
- Kilgallen (2012) Thomas Kilgallen. 2012. Testing the simple moving average across commodities, global stock indices, and currencies. The Journal of Wealth Management 15, 1 (2012), 82–100.
- Kojima et al. (2022) Takeshi Kojima, Shixiang Shane Gu, Machel Reid, Yutaka Matsuo, and Yusuke Iwasawa. 2022. Large language models are zero-shot reasoners. Advances in neural information processing systems 35 (2022), 22199–22213.
- Kraljevic et al. (2021) Zeljko Kraljevic, Anthony Shek, Daniel Bean, Rebecca Bendayan, James Teo, and Richard Dobson. 2021. MedGPT: Medical concept prediction from clinical narratives. arXiv preprint arXiv:2107.03134 (2021).
- Lanbouri and Achchab (2020) Zineb Lanbouri and Said Achchab. 2020. Stock market prediction on high frequency data using long-short term memory. Procedia Computer Science 175 (2020), 603–608.
- Laux et al. (2024) Johann Laux, Sandra Wachter, and Brent Mittelstadt. 2024. Trustworthy artificial intelligence and the European Union AI act: On the conflation of trustworthiness and acceptability of risk. Regulation & Governance 18, 1 (2024), 3–32.
- Levy (1967) Robert A Levy. 1967. The theory of random walks: A survey of findings. The American Economist 11, 2 (1967), 34–48.
- Li et al. (2023) Yuesen Li, Chengyi Gao, Xin Song, Xiangyu Wang, Yungang Xu, and Suxia Han. 2023. DrugGPT: A GPT-based strategy for designing potential ligands targeting specific proteins. bioRxiv (2023), 2023–06.
- Liu et al. (2021) Zhuang Liu, Degen Huang, Kaiyu Huang, Zhuang Li, and Jun Zhao. 2021. Finbert: A pre-trained financial language representation model for financial text mining. In Proceedings of the twenty-ninth international conference on international joint conferences on artificial intelligence. 4513–4519.
- Liu et al. (2023) Zhengliang Liu, Xiaowei Yu, Lu Zhang, Zihao Wu, Chao Cao, Haixing Dai, Lin Zhao, Wei Liu, Dinggang Shen, Quanzheng Li, et al. 2023. Deid-gpt: Zero-shot medical text de-identification by gpt-4. arXiv preprint arXiv:2303.11032 (2023).
- Lo et al. (2000) Andrew W Lo, Harry Mamaysky, and Jiang Wang. 2000. Foundations of technical analysis: Computational algorithms, statistical inference, and empirical implementation. The journal of finance 55, 4 (2000), 1705–1765.
- Lu et al. (2022) Pan Lu, Swaroop Mishra, Tony Xia, Liang Qiu, Kai-Wei Chang, Song-Chun Zhu, Oyvind Tafjord, Peter Clark, and Ashwin Kalyan. 2022. Learn to Explain: Multimodal Reasoning via Thought Chains for Science Question Answering. arXiv:2209.09513 [cs.CL]
- Lubnau and Todorova (2014) Thorben Lubnau and Neda Todorova. 2014. Technical trading revisited: evidence from the asian stock markets. Corporate Ownership & Control 11, 2 (2014), 511–532.
- Luo et al. (2022) Renqian Luo, Liai Sun, Yingce Xia, Tao Qin, Sheng Zhang, Hoifung Poon, and Tie-Yan Liu. 2022. BioGPT: generative pre-trained transformer for biomedical text generation and mining. Briefings in Bioinformatics 23, 6 (2022), bbac409.
- Malkiel (2003) Burton G Malkiel. 2003. The efficient market hypothesis and its critics. Journal of economic perspectives 17, 1 (2003), 59–82.
- Murphy (1999) John J Murphy. 1999. Technical analysis of the financial markets: A comprehensive guide to trading methods and applications. Penguin.
- Radford et al. (2018) Alec Radford, Karthik Narasimhan, Tim Salimans, Ilya Sutskever, et al. 2018. Improving language understanding by generative pre-training. (2018).
- Radford et al. (2019) Alec Radford, Jeffrey Wu, Rewon Child, David Luan, Dario Amodei, Ilya Sutskever, et al. 2019. Language models are unsupervised multitask learners. OpenAI blog 1, 8 (2019), 9.
- Sarrion (2023) Eric Sarrion. 2023. The Implications of ChatGPT on Employment and Society. In Exploring the Power of ChatGPT: Applications, Techniques, and Implications. Springer, 73–82.
- Singh et al. (2023) Bhupinder Singh, Santosh Kumar Henge, Sanjeev Kumar Mandal, Manoj Kumar Yadav, Poonam Tomar Yadav, Aditya Upadhyay, Srinivasan Iyer, and Rajkumar A Gupta. 2023. Auto-regressive integrated moving average threshold influence techniques for stock data analysis. International Journal of Advanced Computer Science and Applications 14, 6 (2023).
- Stout (2002) Lynn A Stout. 2002. The mechanisms of market inefficiency: An introduction to the new finance. J. Corp. L. 28 (2002), 635.
- Taylor and Allen (1992) Mark P Taylor and Helen Allen. 1992. The use of technical analysis in the foreign exchange market. Journal of international Money and Finance 11, 3 (1992), 304–314.
- Tsang et al. (2009) William Wai Him Tsang, Terence Tai Leung Chong, et al. 2009. Profitability of the on-balance volume indicator. Economics Bulletin 29, 3 (2009), 2424–2431.
- Wei et al. (2022) Jason Wei, Xuezhi Wang, Dale Schuurmans, Maarten Bosma, Fei Xia, Ed Chi, Quoc V Le, Denny Zhou, et al. 2022. Chain-of-thought prompting elicits reasoning in large language models. Advances in Neural Information Processing Systems 35 (2022), 24824–24837.
- Wu et al. (2023) Shijie Wu, Ozan Irsoy, Steven Lu, Vadim Dabravolski, Mark Dredze, Sebastian Gehrmann, Prabhanjan Kambadur, David Rosenberg, and Gideon Mann. 2023. Bloomberggpt: A large language model for finance. arXiv preprint arXiv:2303.17564 (2023).
- Zhang et al. (2022) Zhuosheng Zhang, Aston Zhang, Mu Li, and Alex Smola. 2022. Automatic Chain of Thought Prompting in Large Language Models. arXiv:2210.03493 [cs.CL]
- Zhang et al. (2023) Zhuosheng Zhang, Aston Zhang, Mu Li, Hai Zhao, George Karypis, and Alex Smola. 2023. Multimodal chain-of-thought reasoning in language models. arXiv preprint arXiv:2302.00923 (2023).
- Zhang et al. (2020) Zihao Zhang, Stefan Zohren, and Roberts Stephen. 2020. Deep reinforcement learning for trading. The Journal of Financial Data Science (2020).
- Zhu et al. (2015) Hong Zhu, Zhi-Qiang Jiang, Sai-Ping Li, and Wei-Xing Zhou. 2015. Profitability of simple technical trading rules of Chinese stock exchange indexes. Physica A: Statistical Mechanics and its Applications 439 (2015), 75–84.