Assessing Generalization for Subpopulation Representative Modeling
via In-Context Learning
Abstract
This study evaluates the ability of Large Language Model (LLM)-based Subpopulation Representative Models (SRMs) to generalize from empirical data, utilizing in-context learning with data from the 2016 and 2020 American National Election Studies. We explore generalization across response variables and demographic subgroups. While conditioning with empirical data improves performance on the whole, the benefit of in-context learning varies considerably across demographics, sometimes hurting performance for one demographic while helping performance for others. The inequitable benefits of in-context learning for SRM present a challenge for practitioners implementing SRMs, and for decision-makers who might come to rely on them. Our work highlights a need for fine-grained benchmarks captured from diverse subpopulations that test not only fidelity but generalization.
Assessing Generalization for Subpopulation Representative Modeling
via In-Context Learning
Gabriel Simmons University of California, Davis gsimmons@ucdavis.edu Vladislav Savinov Independent Researcher vlad.al.savinov@gmail.com
(1in,)
Accepted for publication at the 1st PERSONALIZE workshop at EACL 2024
1 Introduction
Natural language processing research has plunged headlong into the new alchemical science of prompt engineering Liu et al. (2023). Ask OpenAI’s ChatGPT to “think step-by-step” and behold its improved reasoning performance Wei et al. (2023). Tell it to behave as an expert and witness its expertise increasing Salewski et al. .
The responsiveness of foundation models to prompt engineering has led researchers from diverse disciplines to explore their applications. This is certainly true in political science, where several recent studies investigate whether the malleability of LLMs would allow them to simulate the attitudes and behaviors of human subpopulations (Chu et al., 2023; Jiang et al., 2022; Kim and Lee, 2023; Simmons and Hare, 2023; Linegar et al., 2023).
Polling plays an important role in opinion aggregation, acting as a cornerstone of governance Shapiro (2011). The use of LLMs as subgroup simulators has hypothesized benefits including decreased cost and increased sample sizes Argyle et al. . As response rates to traditional survey methods decline, social scientists are encouraged to explore new methods Ziems et al. . More than a dozen examples of the subpopulation representative modeling approach are found in academic research Simmons and Hare (2023), and the approach has already garnered attention at local Tal and national levels ION .
1.1 Limitations of LLMs as Subpopulation Representative Models
While the potential benefits are considerable, applying LLMs as a substitute or complement for polling should be taken with caution. Recent work shows that prompting LLMs with demographic information leaves much to be desired. Bisbee et al. show that when ChatGPT (gpt-3.5-turbo)111https://openai.com/blog/chatgpt is prompted with demographic information from the ANES Survey222The American National Election Studies (ANES) are national surveys of voters in the United States, conducted before and after presidential elections, with data since 1948 ANES and asked to complete a Feeling Thermometer333The ANES Feeling Thermometer measures respondent affinity to various political groups in the United States., its responses are more extreme and less variable than the responses collected from human participants (Bisbee et al., ). Santurkar et al. show that overall fidelity444Santurkar et al. refer to this as alignment. We use “fidelity” since alignment take several meanings. to human response distributions is low for OpenAI’s ChatGPT when the model is not prompted with a demographic descriptor, that prompting is more effective for some population subgroups than others, and that the fidelity obtained using demographic prompting, while higher than without, is still far from perfect. These studies express a pessimistic stance about the potential of LLMs for subpopulation representative modeling, one that is rightly held based on the experimental evidence to date.
1.2 In-Context Learning for Better Fidelity
We contend here that we should not be prematurely pessimistic. As with chain-of-thought Wei et al. (2023) and expert prompting, perhaps a straightforward technique to improve the performance of LLMs as subpopulation representative models has been overlooked. A hallmark of LLMs is their capability for in-context learning (ICL; Brown et al. ; Dong et al. 2023). One popular mode of in-context learning is few-shot learning, where task examples are provided in the context window to condition generation Song et al. (2023). Few-shot learning improves performance relative to prompting without examples, on tasks including translation and question answering Brown et al. , clinical information extraction Agrawal et al. (2022), reading comprehension and natural language inference Chowdhery et al. (2022), and improves factual accuracy of model responses Semnani et al. (2023).
The subpopulation representative modeling (SRM) task involves predicting the distribution of some response variables, such as candidate preference Palakodety et al. (2020), feeling thermometer Argyle et al. or stance on divisive issues Kim and Lee (2023) for a population subgroup (target demographic) identified by a combination of demographic variables. Applying LLMs to this task typically involves prompting the language model with a natural language description of the demographic and adding instructions to encourage the model to predict the response distribution. Importantly, this zero-shot approach does not leverage observed data from the subpopulation other than its demographic descriptors.
The most straightforward way to apply ICL to the SRM task would be to condition the model with data from the target subpopulation and demographic variables. With sufficient grounding in the target task, we expect that models could become representative. However, in this setup the practitioner has gained little, since they have to provide data from the target subpopulation and response variables to elicit desirable performance.555This setup could still be used for synthetic data generation for the subpopulation and response variables, similar to missing data imputation in Kim and Lee (2023) For this reason, we expect that SRM practitioners would be enthusiastic to use available data to improve performance on unrelated subpopulations or unrelated response variables. In other words, generalization beyond the data presented in the few-shot examples would allow practitioners to apply SRMs with improved performance even if data was not abundant for the subpopulation of interest.
1.3 The Importance of Generalization
For the subpopulation representative modeling task, generalization can occur along two axes: (1) generalization across response variables and (2) generalization across demographics. If a model can generalize across response variables, this means that conditioning on observed response variables improves fidelity for unobserved response variables. If a model can generalize across demographics, this means that conditioning on observed demographics improves fidelity for unobserved demographics. If these capabilities are demonstrated, the outlook for subpopulation representative modeling via LLMs may not be as dire as it seems. In-context learning could mitigate known issues such as extremism Bisbee et al. or lack of representativeness Santurkar et al. .
Successful generalization alone does not imply that LLMs are suitable for use as SRMs. However, we argue that if generalization were possible, it would encourage further development of LLM-based SRM technology. Integrating LLMs into the political infrastructure could have serious social consequences. For that reason, we believe that machine learning practitioners, social scientists, and policymakers should understand the viability of the technology, as greater viability may translate to an increased chance of real-world use. This motivates our study of the generalization capabilities of LLMs for the subpopulation representative modeling task.
| Demographic Variables | Response Variables |
|---|---|
| age | The Democratic Party |
| race | The Republican Party |
| gender | Black Americans |
| income | White Americans |
| education | Hispanic Americans |
| political party | Asian Americans |
| Muslims | |
| Christians | |
| Jews | |
| Liberals | |
| Conservatives |
Research Questions
We address the following research questions:
-
•
RQ 1 (Generalization across Response Variables): How does the fidelity of LLMs to some target demographic vary with the number of response variables from the target demographic used for conditioning? We address this in Section 3.
-
•
RQ 2 (Generalization across Demographics): How does the fidelity of LLMs to some target demographic vary with the number of examples from other demographics used for conditioning? We investigate this in Section 4.
2 Methods
This section documents methods shared across both studies. Specific methods for each study are documented in Section 3 and Section 4.
2.1 Data
We use data from the American National Election Studies (ANES). We used the time series cumulative data file for the ANES Survey666available at https://electionstudies.org/data-center/anes-time-series-cumulative-data-file/, which contains six demographic variables (age, race, gender, income, education, and political party), and 11 Feeling Thermometer variables shown in Table 1. The ANES Feeling Thermometer is a series of ratings questions where survey participants rate their affinity towards various political groups on a continuous scale from 0-100. Across all years, the ANES data contains 68,224 observations. We selected observations from the years 2016 and 2020, yielding 12,550 observations. After removing observations with missing values, the dataset used for experiments contained 4,397 observations. See Appendix B for additional details on data processing steps applied before prompting.
2.2 The Subpopulation Representative Modeling Task
Subpopulation data consists of a number of observations of some set of variables , with each observation corresponding to a single individual. Often, this set of variables contains some subset that describe the demographic characteristics of each individual, and some other subset capturing individual behaviors or attitudes. At a high level, the goal for the SRM task might be to approximate the distribution of conditioned on . However, it is equally likely that practitioners are interested in predicting a specific behavior and have some other behavioral data available for conditioning, requiring generalization across response variables. We investigate this setting in Section 3. Additionally, practitioners may have some paired (demographic, behavior) data available for certain demographic cells and want to predict the behavior for other demographic cells. We investigate generalization across demographics in Section 4.
2.3 Measuring Fidelity Error
| (1) |
| (2) |
We are interested in assessing how LLM fidelity to some target demographic varies with the amount of empirical data used to condition the model. We use the term fidelity error () to refer to the gap between the LLM response and ground truth data observed from humans in the demographic of interest. In our setting, the behavioral variables are Feeling Thermometer ratings across 11 political groups. To explore generalization across response variables, we select some to be used for conditioning. The LLM is tasked to predict the remaining variables .
To obtain ground truth for at the demographic level, we obtain an average respondent profile for each demographic cell by calculating the mean responses for each of the 220 demographic cells in the ANES data.
We define fidelity error for some target demographic as the difference between the empirical mean and the LLM-predicted response, averaged over the Feeling Thermometer variables included in . In general this error varies by the conditioning variables (), see Equation 1. The term is the empirical mean Feeling Thermometer for demographic towards group . The term is the LLM-predicted Feeling Thermometer data for demographic towards group , conditioned on variables and few-shot data . In other words, Equation 1 describes the fidelity error of the model conditioned on a specific set of few-shot examples.
Equation 2 estimates the overall fidelity error of the model by sampling sets of few-shot examples from the observed data. In our experiments we used . The term is the set of sets of conditioning variables having elements that are available for demographic . The term is the set of sets of few-shot examples having elements that are available for demographic .
2.4 Generating LLM Responses
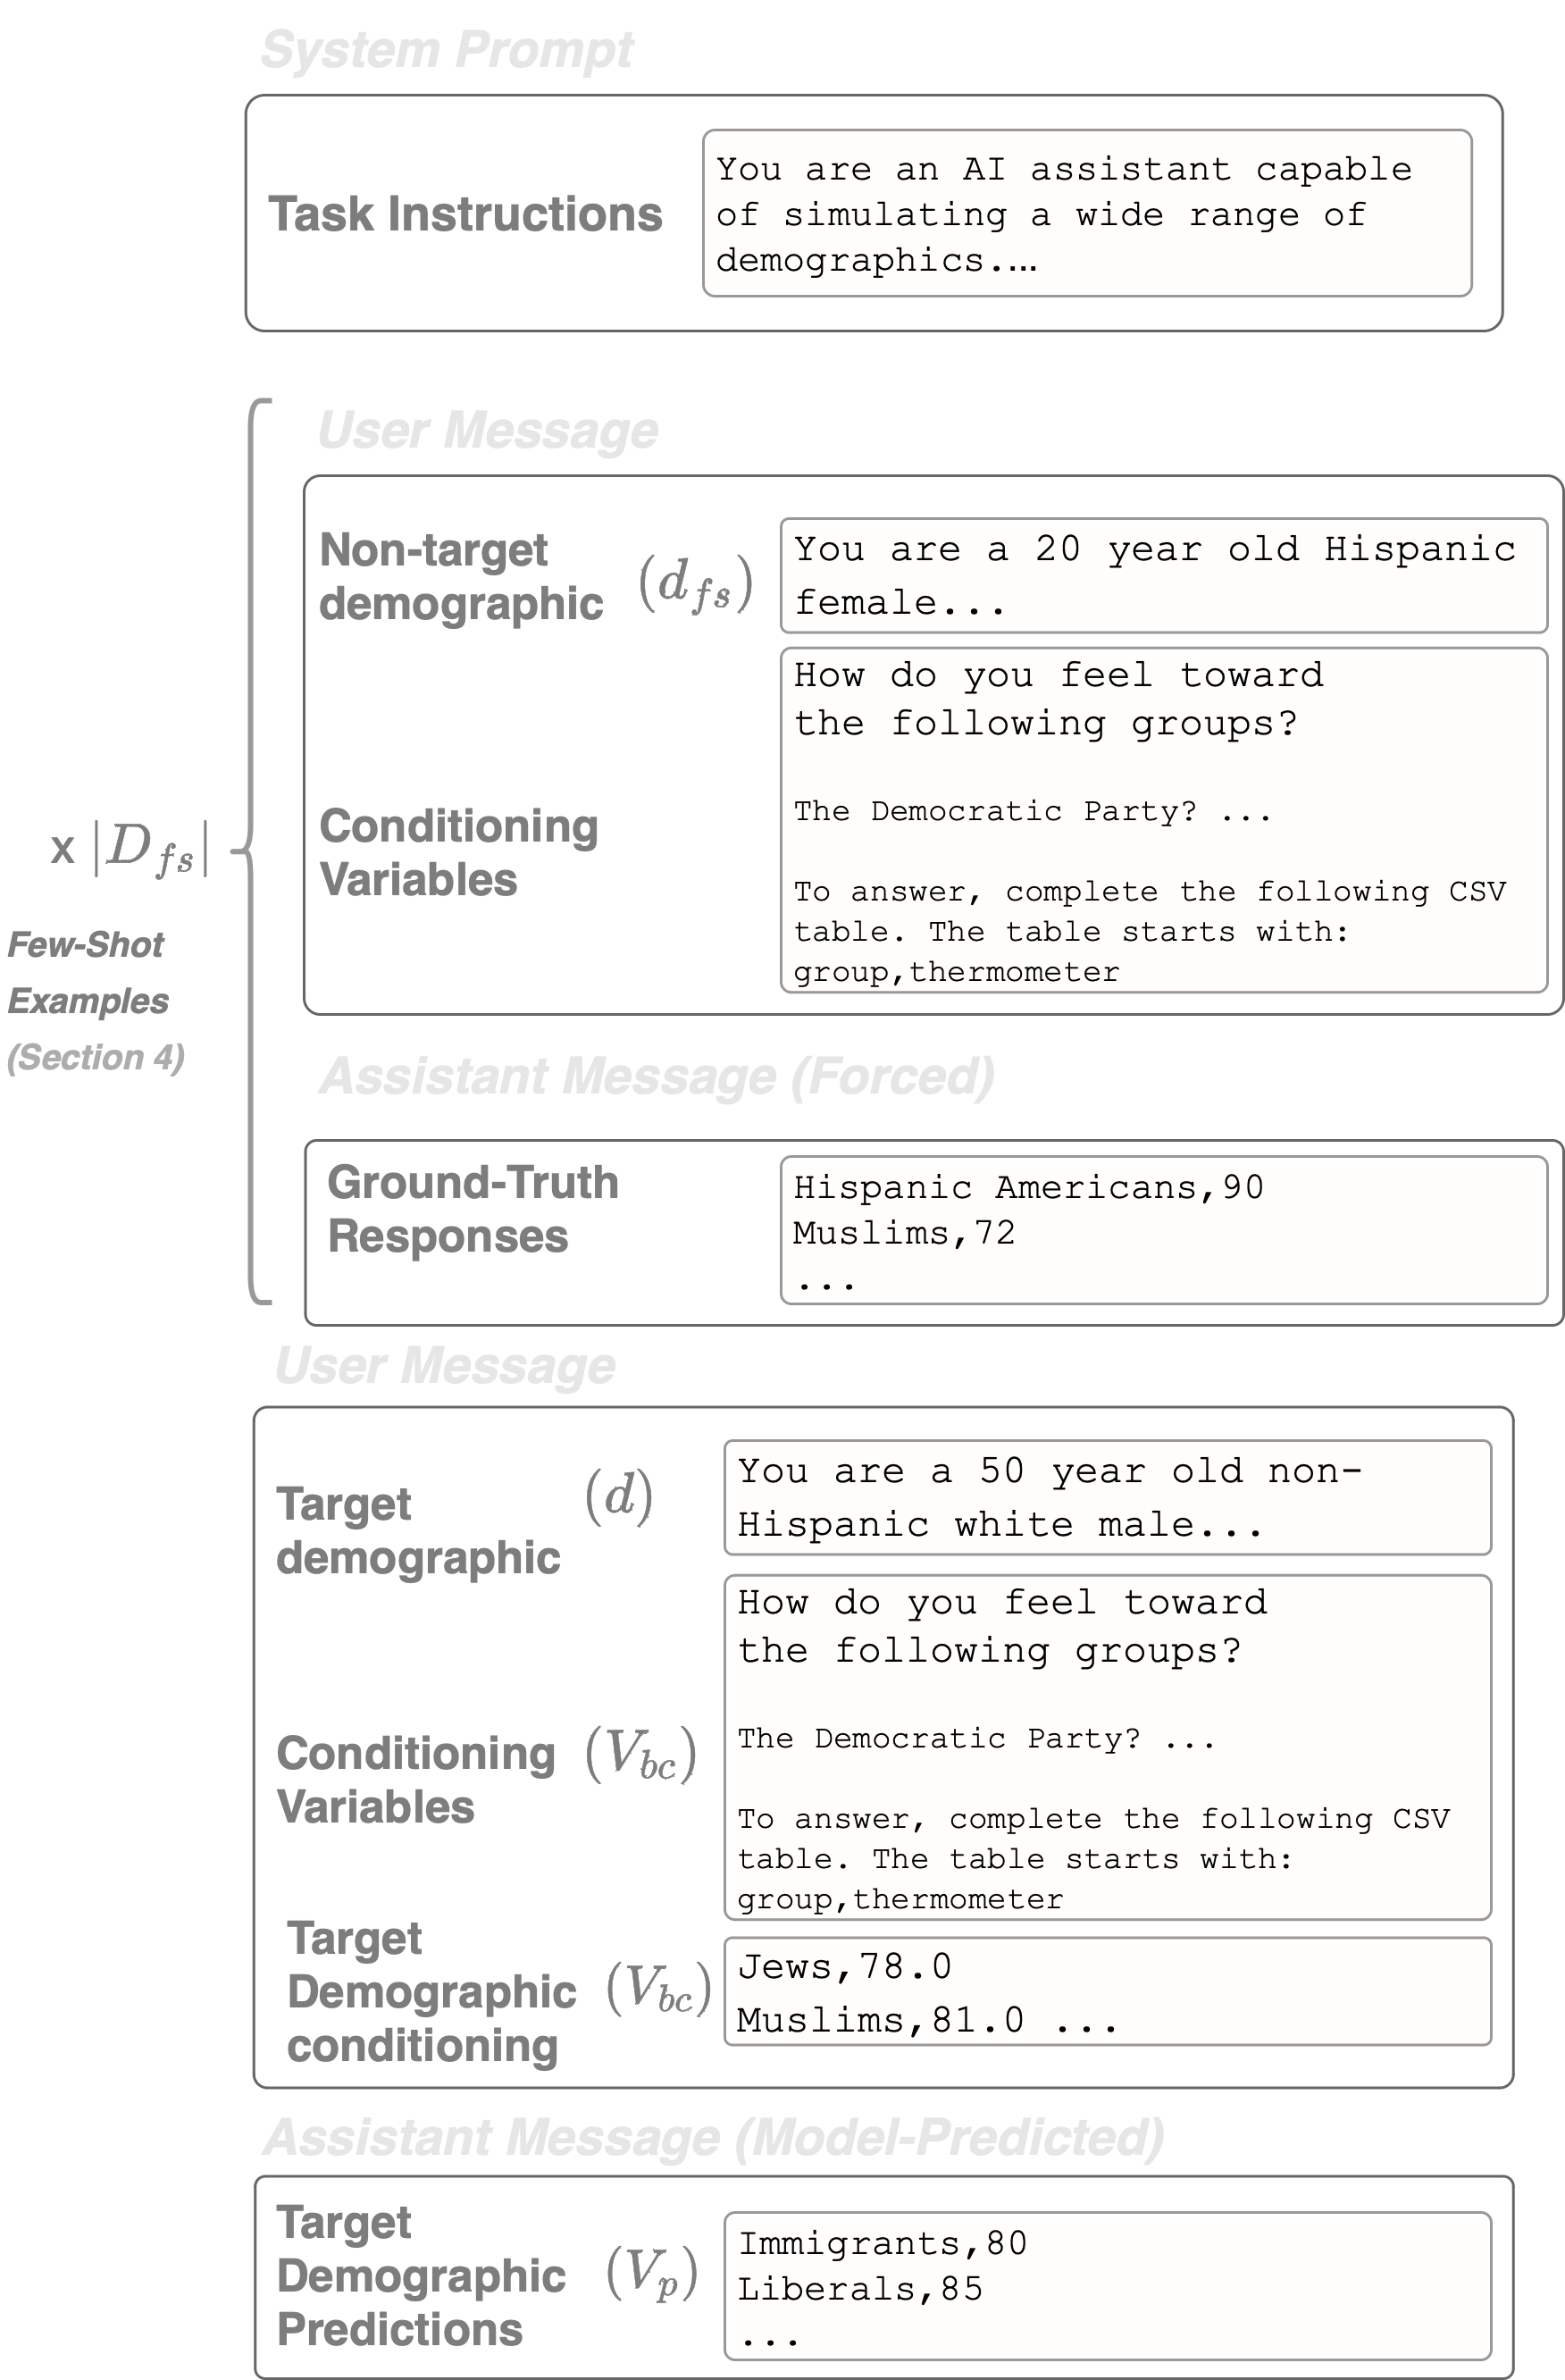
Our prompting strategy is briefly outlined here and in Figure 1. In this study, we utilize OpenAI’s gpt-3.5-turbo, accessed via the API. We adapt a similar prompting strategy to Bisbee et al. , altering prompts to accommodate Research Questions 1 and 2. This approach comprises a consistent system prompt for directing the model’s behavior and a variable user prompt, tailored for each research question. For RQ 1, each query features a single user prompt with an incomplete Feeling Thermometer table. For RQ 2, we supply the model with multiple user prompts, each paired with an example model response which contains a Feeling Thermometer table with ground truth data.
For a detailed view of our prompting setup, refer to the Appendix A.
3 Generalization of In-Context Learning Across Response Variables
This study investigates the generalization of in-context learning across response variables (Research Question 1). We are interested in finding out to what extent increasing the number of conditioning variables improves fidelity to unobserved response variables.
3.1 Methods
Each prompt includes all demographic variables, plus a subset of the behavioral variables . We are interested in relating the number of behavioral variables used for conditioning () to the fidelity error. For each demographic cell, we compute the mean empirical response data. Then for each possible value of , we randomly sample sets of conditioning variables. The empirical mean response data for these variables are presented in each prompt as a partially-completed Feeling Thermometer table in CSV format, as shown in Figure 8. The model then completes the remaining rows of the table. For each prompt, we parse the model-completed portion of the Feeling Thermometer table into CSV format. We then calculate the fidelity error for each prompt by comparing these responses to the empirical mean response data for variables .
3.2 Fidelity Error Decreases with Increasing Conditioning Variables
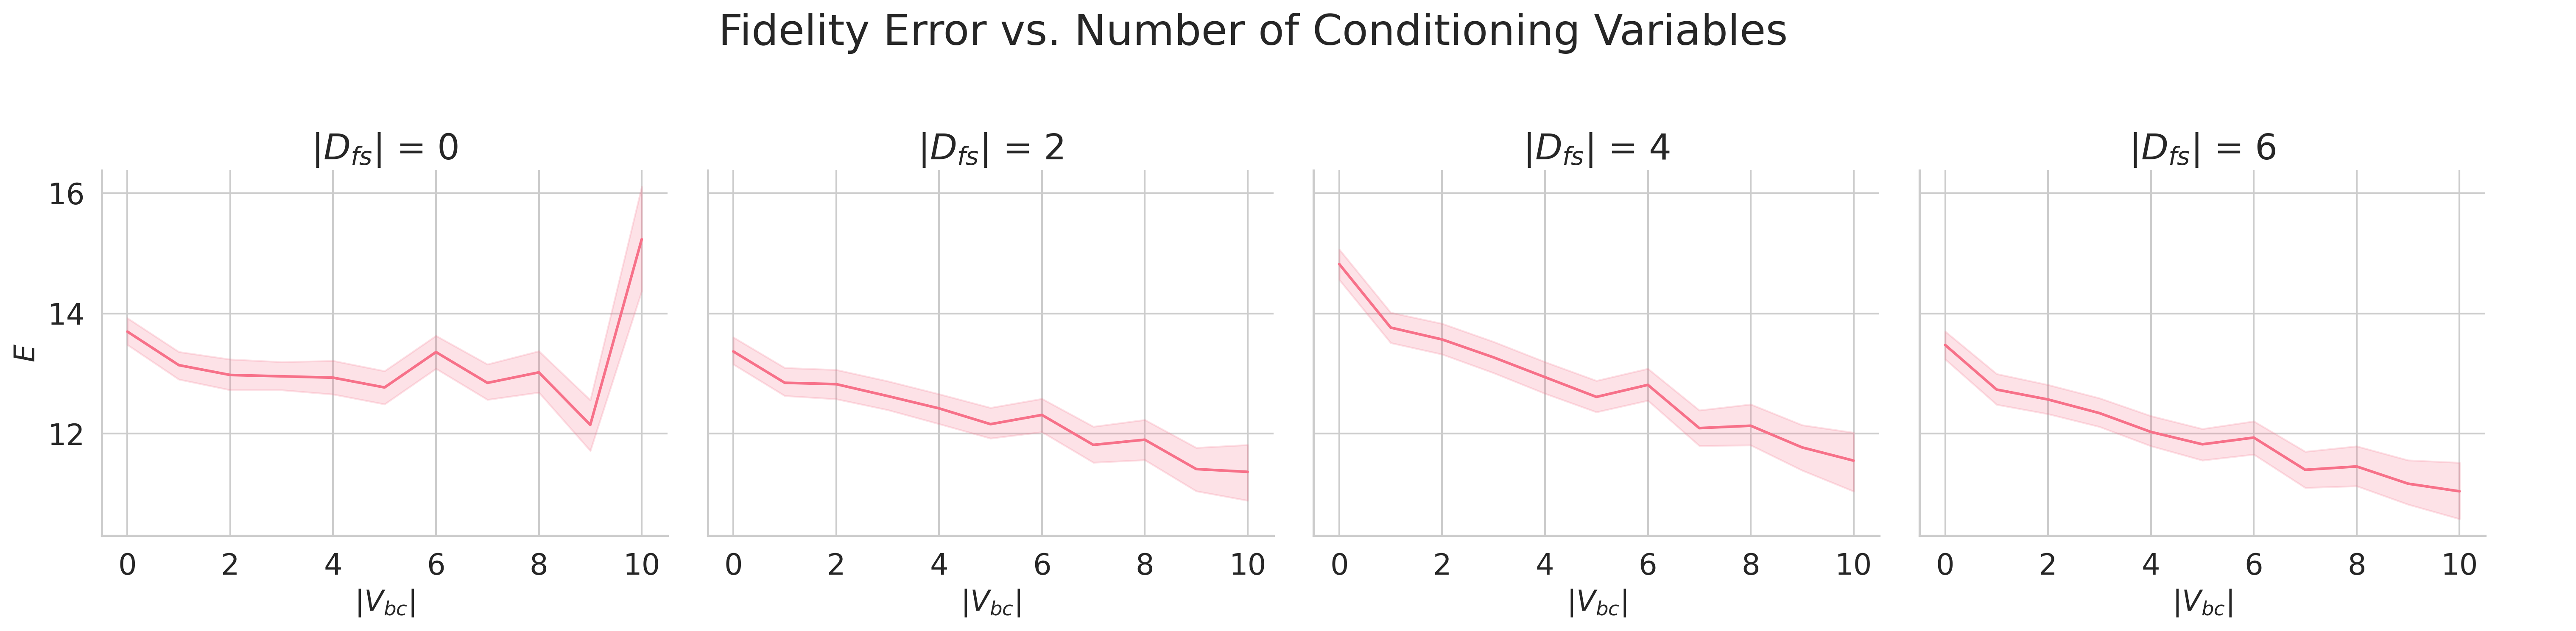
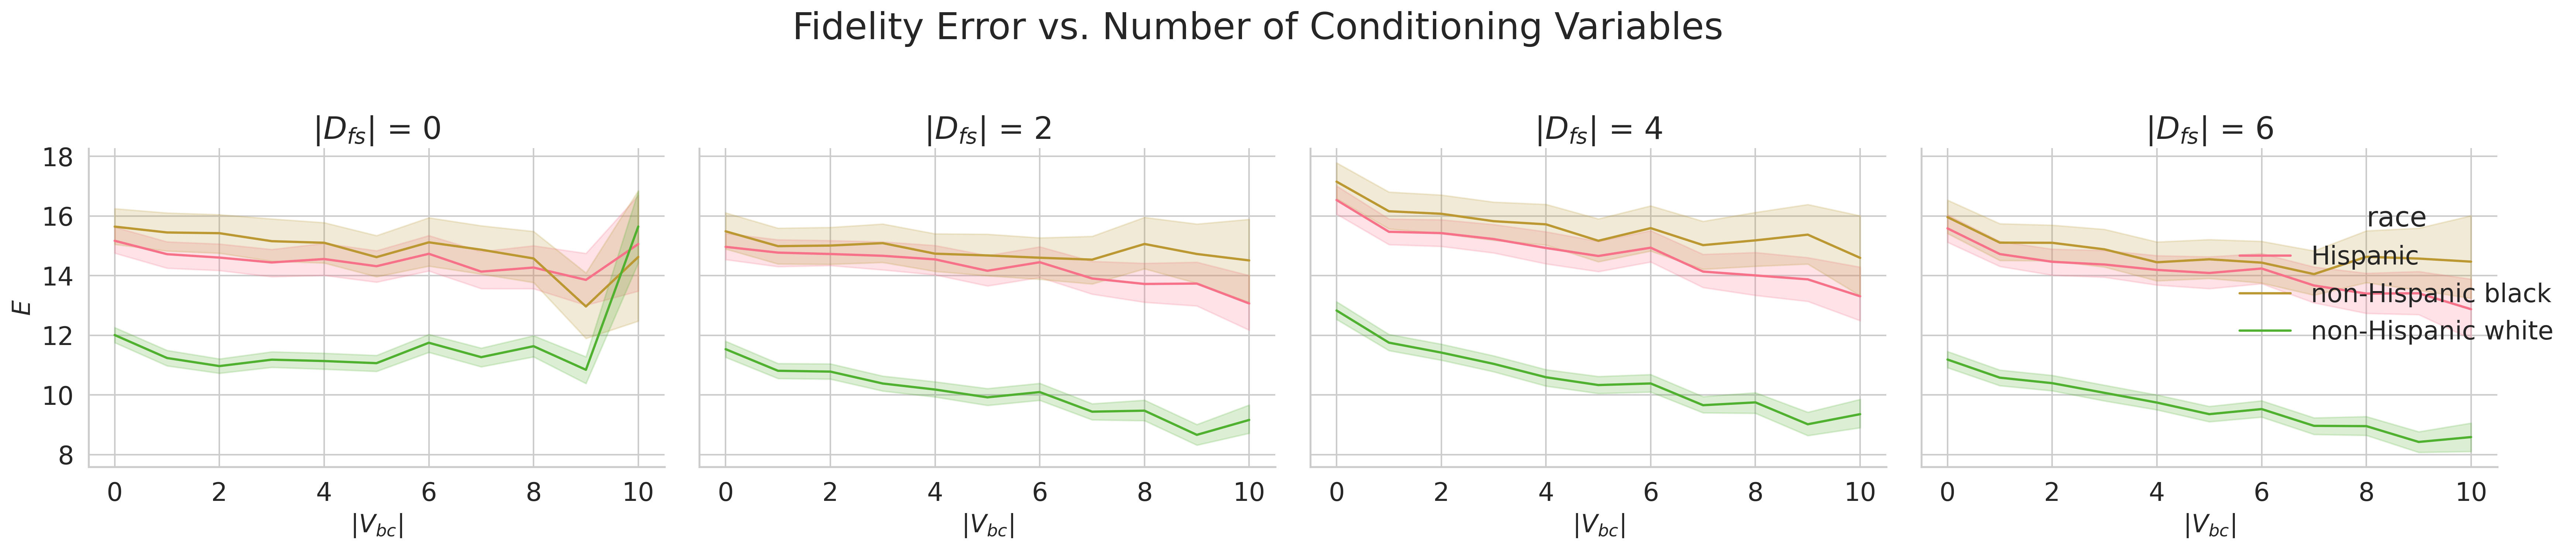
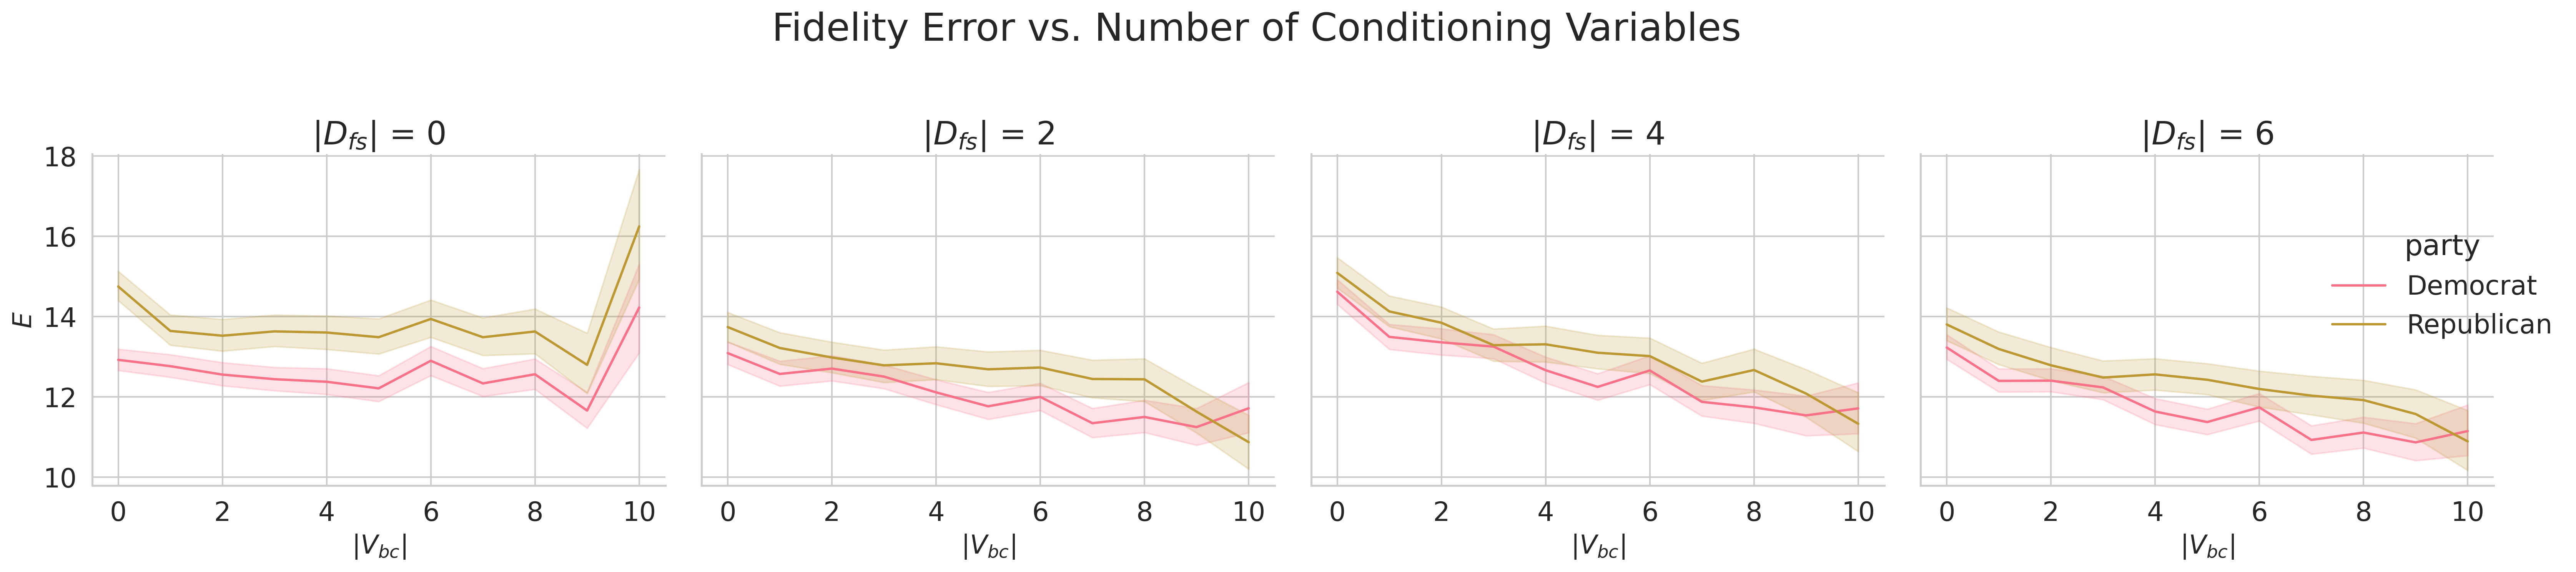
Figure 2 shows the relationship between number of conditioning variables and the fidelity error for varying number of few-shot examples. In general, in-context conditioning on observed behavioral variables improves fidelity to unobserved behavioral variables, with error decreasing as the number of conditioning variables increases.
3.3 Effectiveness of Response Variable Conditioning Varies by Demographic
We can observe discrepancies in error rates between demographics. For example, error rates are lower in general for non-Hispanic Whites than for other racial groups (Figure 3), and for Democratic party in comparison to the Republican one (Figure 4).
Reduction in error as a result of increased conditioning varies by demographic. For instance, error rates are roughly constant for , then increase for the non-Hispanic black demographic, while continuing to decrease for the non-Hispanic white demographic (Figure 3). This suggests that conditioning on behavioral variables may be more effective for some demographics than for others.
Refer to Appendix C for figures showing relationships between the fidelity error and number of conditioning variables for other demographics.
4 Generalization of In-Context Learning Across Demographics
4.1 Methods
In this study, we investigate the generalization of in-context learning across demographics.
In this case, we select some empirical data to be used as few-shot examples. Each prompt was constructed by selecting a target demographic, as in the previous study. Then few-shot examples of complete demographic and Feeling Thermometer information for non-target demographics were randomly selected.
Selecting few-shot examples naturally raises the question of which examples to select. Few-shot example selection can be viewed as an information retrieval task, and many of the well-known methods from IR are applicable here. These include semantic similarity methods Nan et al. (2023) as well as classic information retrieval algorithms such as max marginal relevance (MMR) Carbonell and Goldstein (1998). Few-shot example selection is also related to the problem of representative sampling in the social sciences Manheim et al. (1981); stratified sampling by demographic could be applied Barreto et al. (2018). Additionally, the recent trend towards larger models and LLM-as-a-service APIs has encouraged methods that maximize the number of few-shot examples to be included when the model input is restricted by total length Sel .
However, the most straightforward approach is to sample uniformly at random from the observed data, and in this work we opt for this setup. Since the use of LLMs for SRM is relatively new and may be applied by practitioners who are not familiar with the aforementioned methods, we think it is important to consider the performance of naive methods. We are aware that the choice of sampling method could influence the results of this study; see the Discussion for commentary on the effects of sampling strategy and our suggestions for additional experiments.
4.2 Fidelity Error Decreases with Increasing Few-Shot Examples
Figure 6 shows fidelity error as it relates to the number of few-shot examples. In general, fidelity error decreases with increasing number of few-shot examples.
4.3 Effectiveness of Few-Shot Learning Varies by Demographic
We can again observe discrepancies in error rates between various demographics, including race, age income, and party. For instance, from Figure 5 it can be seen that not only the fidelity error for non-Hispanic whites is smaller in general, but also that in-context learning is more efficient for this ethnicity.
We draw heavily on the prompting methods used in Bisbee et al. - this was done intentionally, for the sake of comparison. The key difference is the use of conditioning based on ground-truth data. Bisbee et al. ’s study is one of the sharpest criticisms of LLM-based SRMs to date and raises important questions about the viability of LLM-based SRMs. If the deficiencies highlighted in this work are ameliorated by in-context learning, this would be an important consideration. We use similar methods so that results are attributable to the use of in-context learning, rather than differences in prompting strategy.
5 Discussion: Subpopulation Representative Modeling via In-Context Learning
Recent criticisms have argued that Large Language Models do not sufficiently represent the opinions or behaviors of human subpopulations when these subpopulations are specified in the context Santurkar et al. ; Bisbee et al. . However, extant work neglects the capability for models to learn via in-context learning.
Our experiments demonstrate that LLMs can learn the subpopulation representative modeling task in-context. The experiments in Section 3 show that providing the model with partial information about subpopulation behavior improves model fidelity on unobserved response variables. Section 4 shows that providing the model with information about other subpopulations can improve model fidelity to an unrelated subpopulation of interest.
In this experiment, we selected few-shot examples uniformly at random. This is only one of several few-shot example selection strategies available to the practitioner (see Section 4, Methods). We believe it is likely that the example selection strategy has some influence over the performance disparities between majority and minority groups. Appendix Figure 13 shows that the ANES data is imbalanced with repsect to the demographic variables – for example, approximately three fourths of respondents were non-Hispanic white, as opposed to Hispanic or non-Hispanic black. The minority categories account for approximately 1/8th of the observations each. For a given target example, the likelihood to select a few-shot example with the same race is proportional to the distribution of the data over the race variable. In general, it is more likely that a randomly-selected few-shot example will share demographic values with the target example when the target example belongs to the majority demographic. Assuming that the similarity between few-shot examples correlates to their utility for the predictive task, this dataset bias could result in few-shot prompting being more effective for majority groups. This applies both in absolute terms, and in terms of the marginal benefit of additional few-shot examples. We encourage further investigation of the relationship between demographic representation in the few-shot data, performance discrepancies across demographics, and few-shot example selection strategies, and plan to explore this theme in future work.
These aggregate results seem promising for the potential of LLMs to perform the subpopulation modeling task. However, upon closer analysis, we find that the effectiveness of in-context learning is variable across demographics. While additional conditioning data boosts performance for some demographics, it has negligible or even deleterious effects for others. This result extends prior work showing variation across demographics in the exaggeration of stereotypical response patterns (Bisbee et al., ) and the fidelity of LLMs to human responses without conditioning (Santurkar et al., ). The subgroup-specific effectiveness of in-context learning for SRM presents challenges for SRM practitioners, as well as decision-makers using the results of SRMs. We suggest three directions for future work. The inequitable performance of LLMs on subpopulation simulation calls the ethicality of the endeavor into question. In tasks like recidivism prediction, theoretical results indicate mutual unsatisfiability of model bias criteria Kleinberg et al. (2016); Chouldechova (2017). These impossibility results influence why the field views machine learning models as appropriate for certain use cases and possibly unfit for others. We encourage similar investigation into the ethical nature of the subpopulation representative modeling task. This should take into consideration the dual-use nature of subpopulation representative models – that they could be leveraged for positive use cases (improving existing political representation processes) as well as negative (used to steer misinformation campaigns). Secondly, our results highlight the need for fine-grained benchmarking for subpopulation representative models, in terms of generalization performance in few-shot settings as studied here, as well as absolute performance in zero-shot settings. Finally, we note that several approaches have been proposed to ameliorate issues with existing subpopulation representation techniques Santurkar et al. ; Lahoti et al. (2023). We see potential for further research in this area of improving subpopulation representative model performance.
References
- (1) ION - Primul Consilier cu Inteligen\textcommabelowtă Artificială al Guvernului. https://ion.gov.ro/.
- (2) Select by length - langchain.
- (3) Talk to the City. https://ai.objectives.institute/talk-to-the-city.
- Agrawal et al. (2022) Monica Agrawal, Stefan Hegselmann, Hunter Lang, Yoon Kim, and David Sontag. 2022. Large language models are few-shot clinical information extractors. In Proceedings of the 2022 Conference on Empirical Methods in Natural Language Processing, pages 1998–2022, Abu Dhabi, United Arab Emirates. Association for Computational Linguistics.
- (5) ANES. History.
- (6) Lisa P. Argyle, Ethan C. Busby, Nancy Fulda, Joshua R. Gubler, Christopher Rytting, and David Wingate. Out of One, Many: Using Language Models to Simulate Human Samples. pages 1–15.
- Barreto et al. (2018) Matt A. Barreto, Lorrie Frasure-Yokley, Edward D. Vargas, and Janelle Wong. 2018. Best practices in collecting online data with Asian, Black, Latino, and White respondents: Evidence from the 2016 Collaborative Multiracial Post-election Survey. Politics, Groups, and Identities, 6(1):171–180.
- (8) James Bisbee, Joshua Clinton, Cassy Dorff, Brenton Kenkel, and Jennifer Larson. Artificially Precise Extremism: How Internet-Trained LLMs Exaggerate Our Differences.
- (9) Tom Brown, Benjamin Mann, Nick Ryder, Melanie Subbiah, Jared D Kaplan, Prafulla Dhariwal, Arvind Neelakantan, Pranav Shyam, Girish Sastry, Amanda Askell, Sandhini Agarwal, Ariel Herbert-Voss, Gretchen Krueger, Tom Henighan, Rewon Child, Aditya Ramesh, Daniel Ziegler, Jeffrey Wu, Clemens Winter, Chris Hesse, Mark Chen, Eric Sigler, Mateusz Litwin, Scott Gray, Benjamin Chess, Jack Clark, Christopher Berner, Sam McCandlish, Alec Radford, Ilya Sutskever, and Dario Amodei. Language Models are Few-Shot Learners. In Advances in Neural Information Processing Systems, volume 33, pages 1877–1901. Curran Associates, Inc.
- Carbonell and Goldstein (1998) Jaime Carbonell and Jade Goldstein. 1998. The use of MMR, diversity-based reranking for reordering documents and producing summaries. In Proceedings of the 21st Annual International ACM SIGIR Conference on Research and Development in Information Retrieval, pages 335–336, Melbourne Australia. ACM.
- Chouldechova (2017) Alexandra Chouldechova. 2017. Fair Prediction with Disparate Impact: A Study of Bias in Recidivism Prediction Instruments. Big Data, 5(2):153–163.
- Chowdhery et al. (2022) Aakanksha Chowdhery, Sharan Narang, Jacob Devlin, Maarten Bosma, Gaurav Mishra, Adam Roberts, Paul Barham, Hyung Won Chung, Charles Sutton, Sebastian Gehrmann, Parker Schuh, Kensen Shi, Sasha Tsvyashchenko, Joshua Maynez, Abhishek Rao, Parker Barnes, Yi Tay, Noam Shazeer, Vinodkumar Prabhakaran, Emily Reif, Nan Du, Ben Hutchinson, Reiner Pope, James Bradbury, Jacob Austin, Michael Isard, Guy Gur-Ari, Pengcheng Yin, Toju Duke, Anselm Levskaya, Sanjay Ghemawat, Sunipa Dev, Henryk Michalewski, Xavier Garcia, Vedant Misra, Kevin Robinson, Liam Fedus, Denny Zhou, Daphne Ippolito, David Luan, Hyeontaek Lim, Barret Zoph, Alexander Spiridonov, Ryan Sepassi, David Dohan, Shivani Agrawal, Mark Omernick, Andrew M. Dai, Thanumalayan Sankaranarayana Pillai, Marie Pellat, Aitor Lewkowycz, Erica Moreira, Rewon Child, Oleksandr Polozov, Katherine Lee, Zongwei Zhou, Xuezhi Wang, Brennan Saeta, Mark Diaz, Orhan Firat, Michele Catasta, Jason Wei, Kathy Meier-Hellstern, Douglas Eck, Jeff Dean, Slav Petrov, and Noah Fiedel. 2022. PaLM: Scaling Language Modeling with Pathways.
- Chu et al. (2023) Eric Chu, Jacob Andreas, Stephen Ansolabehere, and Deb Roy. 2023. Language Models Trained on Media Diets Can Predict Public Opinion.
- Dong et al. (2023) Qingxiu Dong, Lei Li, Damai Dai, Ce Zheng, Zhiyong Wu, Baobao Chang, Xu Sun, Jingjing Xu, Lei Li, and Zhifang Sui. 2023. A Survey on In-context Learning.
- Jiang et al. (2022) Hang Jiang, Doug Beeferman, Brandon Roy, and Deb Roy. 2022. CommunityLM: Probing Partisan Worldviews from Language Models. In Proceedings of the 29th International Conference on Computational Linguistics, pages 6818–6826, Gyeongju, Republic of Korea. International Committee on Computational Linguistics.
- Kim and Lee (2023) Junsol Kim and Byungkyu Lee. 2023. AI-Augmented Surveys: Leveraging Large Language Models for Opinion Prediction in Nationally Representative Surveys. ArXiv:2305.09620 [cs].
- Kleinberg et al. (2016) Jon Kleinberg, Sendhil Mullainathan, and Manish Raghavan. 2016. Inherent Trade-Offs in the Fair Determination of Risk Scores.
- Lahoti et al. (2023) Preethi Lahoti, Nicholas Blumm, Xiao Ma, Raghavendra Kotikalapudi, Sahitya Potluri, Qijun Tan, Hansa Srinivasan, Ben Packer, Ahmad Beirami, Alex Beutel, and Jilin Chen. 2023. Improving Diversity of Demographic Representation in Large Language Models via Collective-Critiques and Self-Voting. ArXiv:2310.16523 [cs].
- Linegar et al. (2023) Mitchell Linegar, Rafal Kocielnik, and R. Alvarez. 2023. Large language models and political science. Frontiers in Political Science, 5.
- Liu et al. (2023) Pengfei Liu, Weizhe Yuan, Jinlan Fu, Zhengbao Jiang, Hiroaki Hayashi, and Graham Neubig. 2023. Pre-train, Prompt, and Predict: A Systematic Survey of Prompting Methods in Natural Language Processing. ACM Computing Surveys, 55(9):195:1–195:35.
- Manheim et al. (1981) Jarol B. Manheim, R. Rich, Lars Willnat, Donna Bahry, and Philip A. Schrodt. 1981. Empirical Political Analysis: Research Methods in Political Science.
- Nan et al. (2023) Linyong Nan, Yilun Zhao, Weijin Zou, Narutatsu Ri, Jaesung Tae, Ellen Zhang, Arman Cohan, and Dragomir Radev. 2023. Enhancing Few-shot Text-to-SQL Capabilities of Large Language Models: A Study on Prompt Design Strategies.
- Palakodety et al. (2020) Shriphani Palakodety, Ashiqur R. KhudaBukhsh, and J. Carbonell. 2020. Mining Insights from Large-Scale Corpora Using Fine-Tuned Language Models. https://www.cs.cmu.edu/ akhudabu/ECAI-2019-BERTElection.pdf.
- (24) Leonard Salewski, Stephan Alaniz, Isabel Rio-Torto, Eric Schulz, and Zeynep Akata. In-Context Impersonation Reveals Large Language Models’ Strengths and Biases.
- (25) Shibani Santurkar, Esin Durmus, Faisal Ladhak, Cinoo Lee, Percy Liang, and Tatsunori Hashimoto. Whose Opinions Do Language Models Reflect?
- Semnani et al. (2023) Sina Semnani, Violet Yao, Heidi Zhang, and Monica Lam. 2023. WikiChat: Stopping the Hallucination of Large Language Model Chatbots by Few-Shot Grounding on Wikipedia. In Findings of the Association for Computational Linguistics: EMNLP 2023, pages 2387–2413, Singapore. Association for Computational Linguistics.
- Shapiro (2011) R. Y. Shapiro. 2011. Public Opinion and American Democracy. Public Opinion Quarterly, 75(5):982–1017.
- Simmons and Hare (2023) Gabriel Simmons and Christopher Hare. 2023. Large Language Models as Subpopulation Representative Models: A Review.
- Song et al. (2023) Yisheng Song, Ting Wang, Puyu Cai, Subrota K. Mondal, and Jyoti Prakash Sahoo. 2023. A Comprehensive Survey of Few-shot Learning: Evolution, Applications, Challenges, and Opportunities. ACM Computing Surveys, 55(13s):1–40.
- Wei et al. (2023) Jason Wei, Xuezhi Wang, Dale Schuurmans, Maarten Bosma, Brian Ichter, Fei Xia, Ed Chi, Quoc Le, and Denny Zhou. 2023. Chain-of-Thought Prompting Elicits Reasoning in Large Language Models.
- (31) Caleb Ziems, William Held, Omar Shaikh, Zhehao Zhang, Diyi Yang, and Jiaao Chen. Can Large Language Models Transform Computational Social Science?
Appendix A Prompting Setup
This section provides specific prompts used for our study, further explaining Figure 1. Our strategy is adapted from the methodology used in Bisbee et al. , with several modifications to better suit our research objectives.
The prompting setup consists of task instructions (the system prompt) and the user prompt. The system prompt is a constant element in all the requests, designed to guide the AI model towards displaying a subpopulation representative behavior (see Figure 9 for the exact structure of the system prompt). User prompts vary based on the research question. For research question 1, a single user prompt is used. This prompt consists of three parts:
-
1.
Target demographic description (), which provides demographic data to the model (see Figure 10);
-
2.
A number of conditioning variables, constant across all requests, posing a concrete question with respect to the current study (see Figure 11);
-
3.
Target demographic conditioning, providing a partial Feeling Thermometer table of variables into the model (see Figure 8).
For research question 2, multiple user prompts are employed, each paired with an example model response. The structure of additional user prompts remains consistent with that of the RQ 1, but instead of the target demographic data, a non-target demographic conditioning is used. All but one of these prompts serve as few-shot examples. In RQ 2, a single few-shot example consists of:
-
1.
Non-target demographic data (), fed into the model in the same format as in the Figure 10;
-
2.
A number of conditioning variables, similarly to RQ 1 (refer to Figure 11);
-
3.
Ground-truth responses from the cleaned ANES data – a Feeling Thermometer table for the same non-target demographic. The format is the same as in Figure 8.
Few-shot examples are followed by the final user prompt (same as in the RQ 1), soliciting a model prediction for the feeling thermometer table for the target demographic.
Appendix B Notes on Data Processing
Many observations in the ANES data were incomplete. Missing value rates for the data are shown in Figure 12. Counts of observations for each demographic variable are shown in Figure 13. Removing rows containing missing demographic and response variables, and observations with variable values other than those in Table 1 resulted in 4,397 observations, with 570 unique demographic cells. The end-to-end data processing pipeline is shown in Figure 7.
Appendix C Figures
Figures LABEL:fig:appendix:few_shot_age, LABEL:fig:appendix:num_groups_age, LABEL:fig:appendix:few_shot_education, LABEL:fig:appendix:num_groups_education, LABEL:fig:appendix:few_shot_gender, LABEL:fig:appendix:num_groups_gender, LABEL:fig:appendix:few_shot_income, LABEL:fig:appendix:num_groups_income, LABEL:fig:appendix:few_shot_party, LABEL:fig:appendix:num_groups_party, LABEL:fig:appendix:few_shot_race and LABEL:fig:appendix:num_groups_race show our findings for different demographic variables.
in age, education, gender, income, party, race

