Impact of oxygen ordering on titanium lattice parameters
Abstract
Variations with oxygen concentration of titanium lattice parameters are obtained by means of ab initio calculations, considering the impact of oxygen ordering. The quasi harmonic approximation is used to take into account the thermal expansion at finite temperature. Results show that lattice parameters depend mainly on oxygen concentration and to a lesser extent to the ordering state. Knowing these theoretical variations, one can get insights on the composition of ordered compounds existing in Ti-O binary alloys from their lattice mismatch measured experimentally by X-ray diffraction. The approach is used in a binary alloy containing 6000 ppm in weight of oxygen. It is concluded that the ordered compounds, which are observed after a recrystallization heat treatment, do not have the expected Ti6O stoichiometry but have a composition close to the nominal concentration. Oxygen ordering proceeds therefore before oxygen partitioning in titanium.
I Introduction
Oxygen is one of the major hardening elements of titanium, used to strengthen the hexagonal close-packed (hcp) phase [1]. With a high solubility limit, more than 30 at.% at room temperature [2], titanium can incorporate a large amount of oxygen in its matrix. But suboxide compounds with a Ti6O and a Ti3O stoichiometry are known to exist below the solubility limit [3, 4, 5]. These suboxides correspond to an ordering of the oxygen atoms which occupy the octahedral interstitial sites of the hcp lattice [6, 7]. Ab initio calculations predict that these ordered compounds are the ground states in the titanium rich part of the Ti-O phase diagram [8, 9, 10]. Although known for a long time now, one hardly considers the existence of these ordered compounds when discussing the effect of oxygen on titanium properties, in particular mechanical properties [11, 12, 13, 14, 15, 16]. One generally assumes that all oxygen is dissolved in solid solution for the low concentrations encountered in titanium alloys which are usually lower than 1 at.% (0.5 and 1 at.% respectively in grade-2 and -4 commercially pure Ti). But recent experiments have shown that ordered compounds can exist at room temperature in titanium for an oxygen concentration as low as 0.5 at.% [17], with potentially important consequences on titanium mechanical properties [18, 6, 7, 19]. These ordered compounds could be imaged by transmission electron microscopy through the superlattice reflections arising from oxygen ordering. Lattice mismatches between the ordered precipitates and the matrix could also be measured at room temperature with X-ray diffraction (XRD). But no information on their composition could be obtained. In particular, it remains unclear if these ordered precipitates have a Ti6O composition, as expected from thermodynamics [10], or if their oxygen content is lower, with oxygen ordering proceeding before oxygen partitioning i.e. with the formation of compounds having the same long-range order as Ti6O ordered compounds but without reaching the Ti6O stoichiometry. As oxygen addition is known to increase the lattice parameters of the Ti -phase, one can attempt to deduce the composition of ordered compounds from the lattice mismatches measured by XRD. But one needs first to better know the impact of oxygen ordering on titanium lattice parameters, in particular to be able to separate variations arising from oxygen ordering and from oxygen enrichment.
The aim of this article is to use ab initio calculations to fully relate the variations of titanium lattice parameters to oxygen concentration and order state. We first perform ab initio calculations at 0 K and then extend them at finite temperature, considering thermal expansion through the quasi-harmonic approximation. The theoretical variations obtained for lattice parameters are finally compared to the ones measured by XRD in a Ti-O binary alloy at different temperatures, allowing to conclude on the composition of the ordered compounds observed in this alloy.
II Phase stability and lattice parameters at 0 K
II.1 DFT parameters
Ab initio calculations are performed within non-spin polarized density functional theory (DFT) using the Vasp code [20]. The exchange and correlation functional is described with the generalized gradient approximation (GGA) as formulated by Perdew, Burke and Ernzerhof (PBE) [21]. Considering the local density approximation (LDA) instead of GGA leads to the same impact of oxygen on titanium lattice parameters at 0 K (appendix B). Interactions between core and valence electrons are accounted for by the projector augmented wave (PAW) method [22], with , , , and orbitals treated as valence states for Ti and and for O. A plane wave cutoff energy equal to 500 eV is used for wave functions. A 242418 -point grid generated with the Monkhorst-Pack [23] method is used for primitive hcp Ti unit cell and grids with similar -point density for supercells. Integration is performed with the Methfessel-Paxton broadening scheme, using a 0.1 eV width. According to our convergence tests, this leads to a precision better than 1 meV per atom on total energy differences. Each structure is fully relaxed, i.e. both periodicity vectors and atomic coordinates, to achieve a force convergence lower than 0.02 eV/Å and an energy convergence of 10-6 eV. Although the supercells can theoretically become monoclinic during the relaxation, the underlying lattices remain always close to the initial HCP crystal, with only a small orthorhombicity, which may appear when the symmetry of the initial structure allows for different relaxations in different directions of the basal plane.
II.2 Phase stability
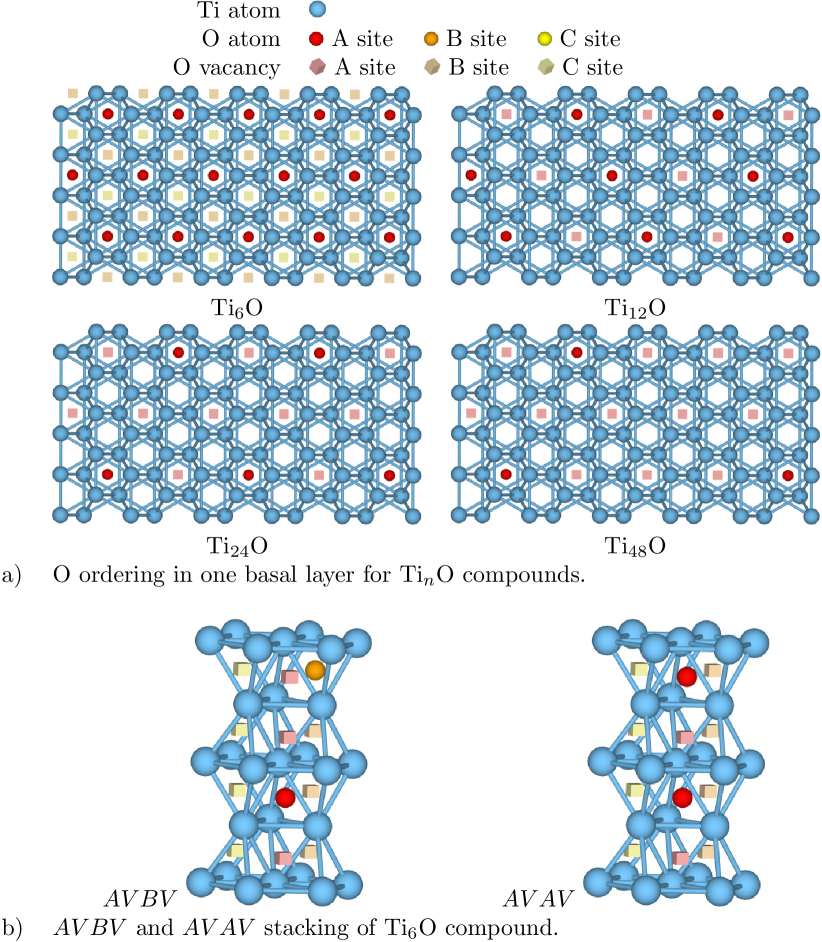
Oxygen occupies the octahedral interstitial sites of the hcp lattice formed by Ti atoms. The ground state with the lowest oxygen content is known to have Ti6O stoichiometry [6, 7, 8, 9, 10]. It corresponds to a stacking along the \hkl¡c¿ axis of basal layers with one third of their octahedral sites occupied by oxygen atoms alternating with oxygen free layers. Enriched basal layers are ordered with occupied octahedral sites separated by \hkl¡1-100¿ periodicity vectors (see Ti6O structure in Fig. 1a). Denoting , , and the three different octahedral sites in a basal layer, the Ti6O ground state can be described by a periodic stacking along the \hkl¡c¿ axis, with corresponding to a basal layer where octahedral sites are occupied by O atoms and meaning a layer where all octahedral sites are empty (Fig. 1b).
We check that our ab initio approach predicts the right ground state in the concentration range , where is the occupation of the octahedral interstitial sites 111One can also define the oxygen concentration, , i.e. the ratio of the number of oxygen atoms to the total number of atoms.. To this aim we calculate the formation energy of different ordered and disordered compounds. Disordered structures are built from a supercell corresponding to the repetition of the conventional hcp unit cell, with 96 Ti atoms. Oxygen atoms are placed on the octahedral sites with the special quasirandom structures (SQS) method [24] to obtain a random Ti-O solid solution. Ordered TinO structures with are built in the same supercell, starting from the Ti6O ordered compound and depleting oxygen atoms regularly in the basal layer, with either a or stacking along the \hkl¡c¿ axis (Fig. 1). Finally, some partially ordered structures are also considered, using a larger supercell with 216 Ti atoms and incorporating some oxygen vacancies in the ordered Ti6O compound.
Formation energies are calculated with reference to pure Ti and to TiO compound, i.e. structures with all octahedral sites either empty () or occupied by oxygen atoms (). Considering that the alloy is actually an oxygen-vacancy binary system on the octahedral interstitial sites of the hcp lattice formed by the Ti atoms, all formation energies are defined per interstitial site, leading to
where and are the energy of pure Ti and TiO in the same supercell as the TinOm compound.
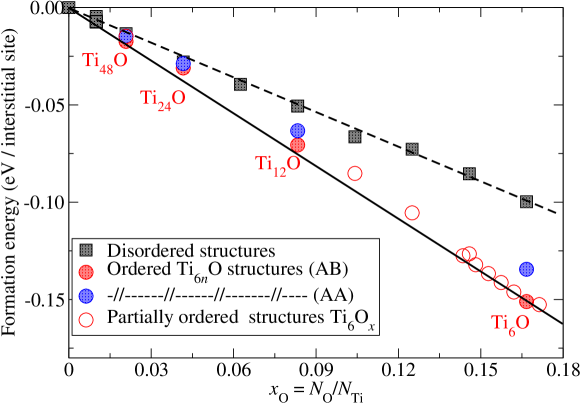
Fig. 2 shows that ordered structures are always more stable than disordered solid solutions, confirming the ordering tendency of oxygen in titanium as seen experimentally [4, 5, 25, 6, 17]. No intermediate compound is found below the convex hull linking Ti and Ti6O, indicating that a supersaturated Ti(O) solid solution should decompose in an oxygen-depleted solution and an ordered Ti6O compound at low temperature.
| Stacking | (meV/site) |
|---|---|
Considering now the different possible stackings along the \hkl¡c¿ axis of oxygen enriched basal layers, ordered compounds with an stacking are always more stable than stacking, in agreement with previous ab initio calculations [8, 9, 10] and with the stable structure known experimentally for Ti6O. Nevertheless, the stacking of these basal layers offers more possibilities. Ab initio calculations for Ti6O show that stackings in which two successive occupations of oxygen layers are different, i.e. , , , lead almost to the same formation energy, with an energy difference lower than 1 meV/site, thus below the expected DFT accuracy (Tab. 1). These ordered structures appear therefore degenerate, with stacking having the smallest wave-length along \hkl¡c¿ direction, leading to Devil’s staircases [9] disordering at finite temperature.
II.3 Variations of lattice parameters
Ab initio calculations show that both and lattice parameters increase with the oxygen content (Fig. 3), with the parameter increasing more rapidly than , in agreement with experiments [2, 26]. The comparison between experimental and theoretical values (Fig. 3) shows that ab initio calculations correctly predict the increase rates of both lattice parameters with the oxygen concentration, despite a slight underestimation of the absolute value. As ab initio calculations are performed at 0 K while experimental data have been obtained at room temperature, such an underestimation is indeed expected. Besides, DFT approximation is known to be not fully quantitative when predicting absolute values for lattice parameters, with a dependence on the functional used for the electronic exchange and correlation (see appendix B).
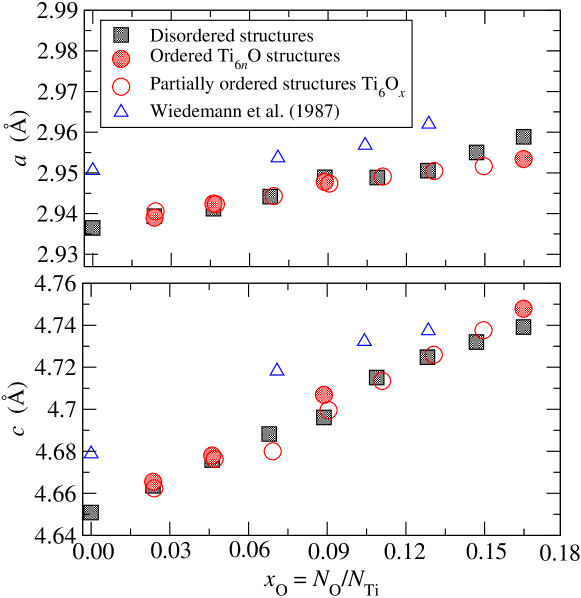
According to these ab initio calculations, the lattice parameters mainly depend on the oxygen concentration, with a marginal impact of the ordering state: for a same oxygen composition, a random solid solution and an ordered compound have almost the same lattice parameters at 0 K (Fig. 3). The only noticeable impact is for the highest oxygen concentrations, in particular for Ti6O, where larger and smaller parameters are obtained for ordered compounds than for disordered solid solutions.
III Modeling at finite temperatures
III.1 Methods
To go beyond 0 K calculations, we now take into account thermal expansion by including the contribution of atomic vibrations in the formation free energy of the different compounds. Calculations are performed in the quasi-harmonic approximation, as described below, considering different structures in the same supercell containing 72 Ti atoms and defined by the periodicity vectors \hkl[-2200], \hkl[0-220], and \hkl[-1103].
This is done by coupling Phonopy [27] with Vasp DFT calculations, so as to obtain phonons for different volumes and ratios of the supercell. A finite displacement of 0.01 Å is used in Phonopy to calculate the supercell force constants. Dynamical matrices are then calculated by Fourier transformation on a regular grid with points and diagonalized to obtain the pulsations of the eigenmodes. The vibration energy, defined per interstitial octahedral site, of a supercell containing Ti atoms and O atoms is finally given by
| (1) |
A grid is used for Fourier transform. Comparison with results obtained with and grids shows that this is enough for the supercell considered in this work.
| Free energies (meV/site) | ||||
|---|---|---|---|---|
| Pure Ti | Ti6O | |||
| (K) | ||||
| 0 | ||||
| 300 | ||||
| 600 | ||||
| 900 | ||||
The total free energy is obtained by adding the cohesive energy directly given by DFT calculations. One could also consider the contribution of electronic excitations to this free energy [28, 29, 30], but calculations performed for pure Ti and for the ordered Ti6O compound show that this contribution can be neglected compared to the cohesive and vibrational contributions (Tab. 2). The same conclusion was reached by Argaman et al. in pure Ti [31].
a)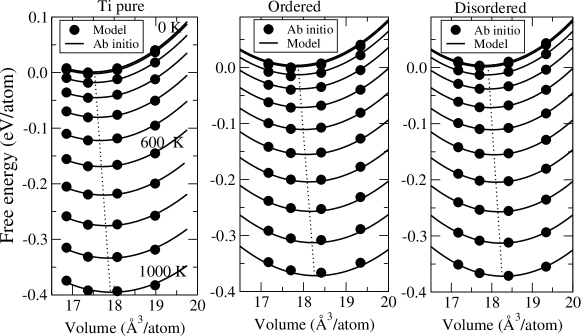
b)
For each structure, the phonon spectrum is calculated on a grid corresponding to 4 different volumes and 4 different ratios choosing a variation around the equilibrium values of the cohesive energy. The free energy can then be defined on this grid for each temperature and a continuous representation obtained thanks to a smooth interpolation with second rank polynomials (Fig. 4). Minimization of this free energy finally leads to the equilibrium lattice parameters and . As shown in appendix A, this approach predicts lattice expansion in pure Ti in agreement with experimental data (Fig. 10).
III.2 Variations of lattice parameters
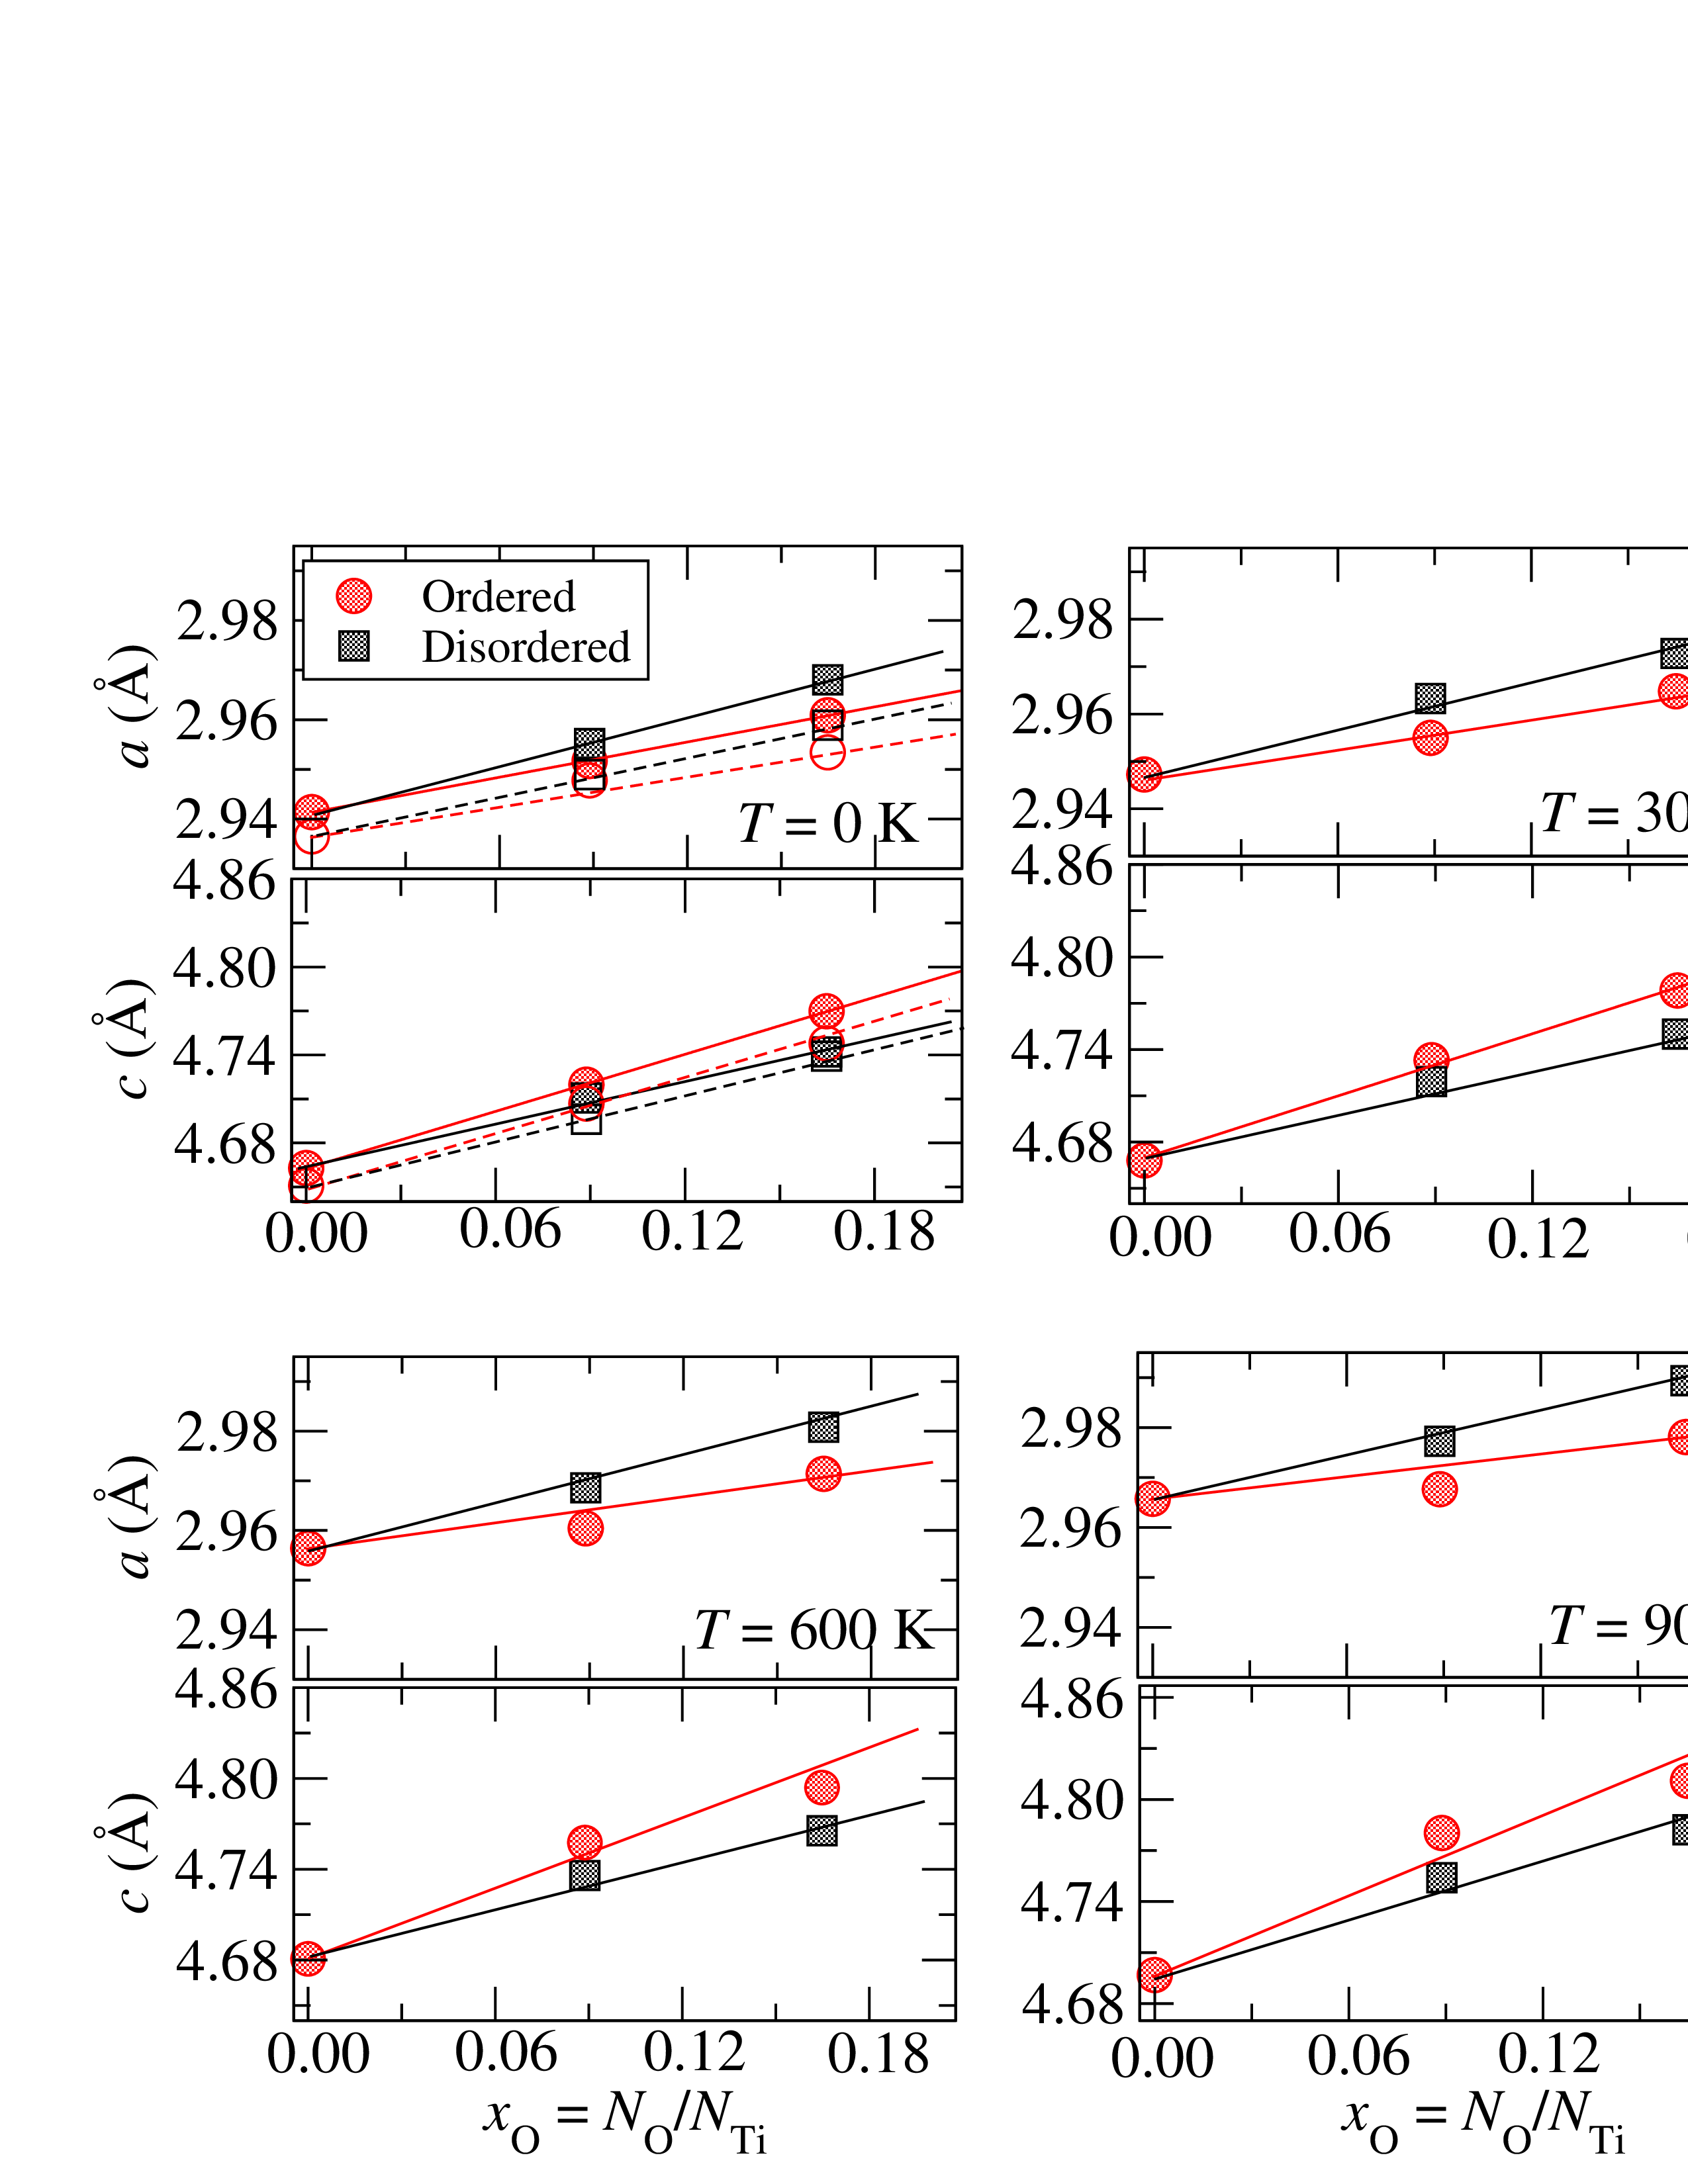
Variations of lattice parameters with temperature are calculated for two different oxygen compositions, Ti6O and Ti12O, in addition to pure Ti. For each composition, we considered a random solid solution, as given by SQS method, and a fully ordered structure with the most stable stacking of basal planes (Fig. 1). At 0 K, in absence of atomic vibrations, the same variations of the lattice parameters with O concentration and ordering state (open symbols in Fig. 5) are observed as in previous section (Fig. 3), thus showing that the obtained lattice parameters do not depend on the supercell used to model the different structures. Accounting for atomic vibrations does not modify how these lattice parameters vary qualitatively. Results confirm that lattice parameters increase with the oxygen content at all temperatures (Fig. 5), with variations which can be considered linear both in the disordered and the ordered states. The impact of oxygen ordering is the same as the tendency observed at 0 K for the highest concentrations: the ordered state has larger and lower lattice parameter than the disordered solid solution at the same oxygen concentration. This impact of oxygen ordering slightly increases with the temperature, as can be seen from the values of the slopes and given in table 3. The difference between the values for the ordered and the disordered states increases with the temperature both for and . But this variation remains small and can be considered as second order compared to the variation with the oxygen concentration.
| 0 K | 300 K | 600 K | 900 K | ||
|---|---|---|---|---|---|
| Ordered TiOx | 0.040 | 0.035 | 0.028 | 0.022 | |
| Disordered TiOx | 0.055 | 0.055 | 0.049 | 0.048 | |
| Ordered TiOx | 0.139 | 0.147 | 0.155 | 0.159 | |
| Disordered TiOx | 0.106 | 0.111 | 0.115 | 0.116 |
To a good approximation, one can neglect the variations with the temperature of the increase rates and . The variations of the lattice parameters with the temperature and with the oxygen concentration are then reasonably well described by the equations
| (2) | ||||
| (3) |
showing that the increases with temperature and with oxygen concentration can be factorized. Parameters given in Table 4 obtained through a fit of ab initio calculations confirm that and lattice parameters increase with the oxygen content, with a slightly higher (respectively lower) increase rate of the (respectively ) parameter for the ordered than the disordered states.
| Pure Ti | Å | Å |
|---|---|---|
| K-1 | K-1 | |
| Ordered TiOx | ||
| Disordered TiOx |
IV Experiments and discussion
IV.1 Material and methods
X-ray diffraction (XRD) measurements are performed on titanium and a Ti-O binary alloy. The titanium, hereafter denoted pure titanium, contains only 600 wppm oxygen, corresponding to an atomic composition at.% and to an occupation of interstitial octahedral sites %, while the oxygen nominal concentration in the Ti-O alloy is 6000 wppm ( at.% and %). These concentrations are confirmed by inert gas fusion analysis. Both pure Ti and Ti-O alloy are first hot- and cold-rolled with a thickness reduction of 75% and 40% respectively to finally obtain 1 mm thick plates. The samples are then recrystallized in molten salt baths (Li2CO3, Na2CO3, K2CO3) at 1023 K during 600 s. After water quenching, both pure titanium and Ti-O samples present fully recrystallized grains with a 90 and 30 m size respectively. The samples are then polished with SiC grinding papers, before a final polishing with colloidal silica suspension.
XRD patterns are obtained with an XPert Pro Panalytical instrument operating at 40 kV and 40 mA. A cobalt source ( Å and Å) is used. A first diffractogram is recorded at room temperature without the heating chamber, so that the sample height can be adjusted after installing the chamber by comparing the peak positions. After the measurement at room temperature, an Anton Paar HTK 1200N furnace with a resistive system is used to heat the sample holder up to 473 K and then to different temperatures between 473 and 773 K at 10 K/min. The temperature measured on the sample holder could slightly differ from the sample temperature. The heating chamber is kept under argon flow to prevent oxidation. After one hour of heating stabilization for each temperature, diffractograms are recorded in the 40-90∘ -range with a 0.016∘ step size during 80 s. 5 scans are recorded at each temperature step and then summed up for the analysis.
Lattice parameters of both matrix and ordered precipitates are determined thanks to a Rietveld refinement using the Maud software. The refinement takes account of the non-monochromatic feature of the X-ray beam and allows to assign the shoulder on the right of the peaks to the ray of the cobalt source. The Caglioti parameters of the diffractometer are first calibrated with a LaB6 powder. The COD (Crystallographic Open Database) ID #9008517 is chosen for the crystal structure of the matrix. Ordered precipitates have a Ti6O structure, which corresponds to an ordering of the oxygen atoms in the octahedral interstitial sites of the hcp Ti-lattice [17]. XRD pattern of the precipitate phase should theoretically display the same principal peaks as the matrix, with some additional peaks arising from oxygen ordering. However, a previous study on the same Ti-O samples [17] has shown that these additional peaks cannot be detected by XRD because of their too low intensity and that Ti6O-type precipitates can be characterized only by shoulders on the left of the matrix peaks, corresponding to slightly larger and lattice parameters of the underlying hcp lattice. Therefore, the same COD ID is used in the Rietveld refinement for the ordered precipitates as for the matrix. Finally, the sample holder in alumina leads to some additional peaks which are taken into account in the Rietveld refinement by considering an Al2O3 phase (COD ID #1000059).
IV.2 Results
TEM observations confirm the presence of precipitates with a nanometric size (Fig. 6). These precipitates, which have been previously imaged in dark-field conditions using the superlattice diffraction of the Ti6O ordered structure [32, 17], can also be imaged in bright field mode, thanks to their elastic strain field. This strain field arises from the lattice misfit between the ordered precipitates and the surrounding titanium matrix.

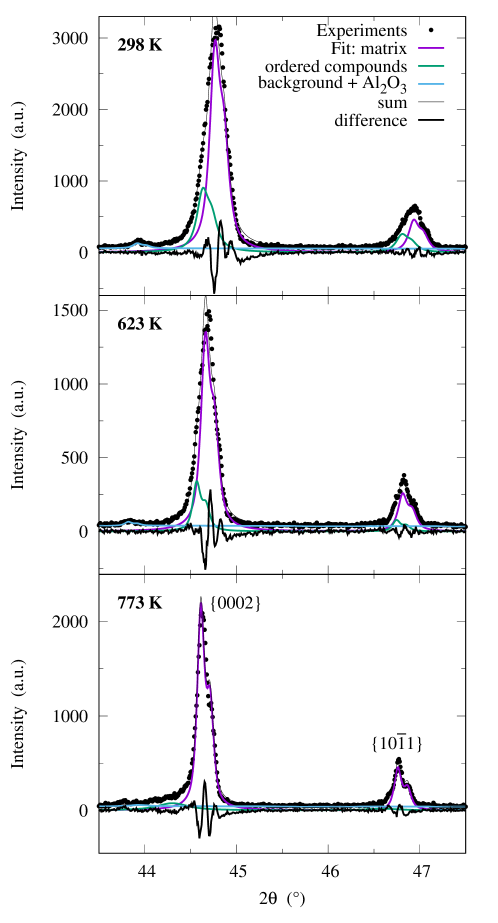
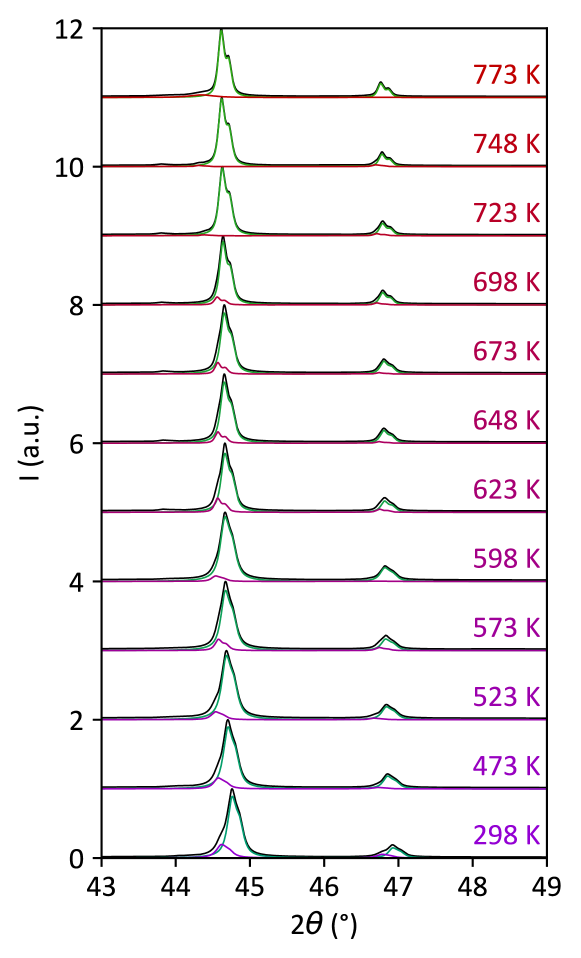
This lattice misfit leads to the presence of shoulders on the diffraction peaks in the XRD diffractograms (Fig. 7 and Fig. 12 in appendix C). This shoulder can be clearly seen on the left of the diffraction peak corresponding to the basal \hkl0002 planes (). It is the signature of the larger lattice parameter of the ordered compounds compared to the one of the matrix. Note that this shoulder appearing for the basal \hkl0002 planes cannot be explained by a martensitic transformation of the hexagonal phase to the orthorhombic phase as such a transformation will lead to a splitting of all diffraction peaks except the ones corresponding to basal planes. This shoulder on \hkl0002 diffraction peaks can be explained only by a mixture of two phases with different lattice parameters. Such a left shoulder is also visible on the peak corresponding to pyramidal \hkl10-11 planes (). On the other hand, because of the sample texture, the intensity of the peaks corresponding to \hkl10-10 prismatic planes is not high enough to detect any shoulder. It is also observed that the signature of the ordered compounds is not very intense and almost disappears at 723 K and above (Fig. 12 in appendix C), making analysis at these temperatures difficult. This is an indication that the ordered compounds have started to dissolve and that O solubility limit at these temperatures is higher than the sample nominal concentration, i.e. 6000 wppm, which looks reasonable according to the theoretical phase diagram [10]. Such a dissolution of ordered precipitates have also been seen recently in a Ti-Zr-O alloy using TEM and resistivity with in situ heating experiments [34].
| (K) | sample | phase | (Å) | (Å) | |||||
|---|---|---|---|---|---|---|---|---|---|
| 298 | pure Ti | matrix | 2.9536 | 4.6850 | |||||
| Ti-O | matrix | 2.9501 | 4.6929 | 0.012 | |||||
| Ti-O | compounds | 2.9575 | 4.7061 | 0.030 | |||||
| 473 | pure Ti | matrix | 2.9586 | 4.6913 | |||||
| Ti-O | matrix | 2.9551 | 4.6999 | 0.013 | |||||
| Ti-O | compounds | 2.9566 | 4.7125 | 0.029 | |||||
| 523 | pure Ti | matrix | 2.9596 | 4.6937 | |||||
| Ti-O | matrix | 2.9567 | 4.7022 | 0.013 | |||||
| Ti-O | compounds | 2.9642 | 4.7146 | 0.030 | |||||
| 573 | pure Ti | matrix | 2.9610 | 4.6960 | |||||
| Ti-O | matrix | 2.9577 | 4.7045 | 0.013 | |||||
| Ti-O | compounds | 2.9651 | 4.7132 | 0.025 | |||||
| 598 | pure Ti | matrix | 2.9613 | 4.6966 | |||||
| Ti-O | matrix | 2.9594 | 4.7060 | 0.015 | |||||
| Ti-O | compounds | 2.9624 | 4.7156 | 0.027 | |||||
| 623 | pure Ti | matrix | 2.9616 | 4.6977 | |||||
| Ti-O | matrix | 2.9600 | 4.7075 | 0.016 | |||||
| Ti-O | compounds | 2.9634 | 4.7170 | 0.027 | |||||
| 648 | pure Ti | matrix | 2.9621 | 4.6986 | |||||
| Ti-O | matrix | 2.9608 | 4.7087 | 0.017 | |||||
| Ti-O | compounds | 2.9645 | 4.7169 | 0.026 | |||||
| 673 | pure Ti | matrix | 2.9626 | 4.6993 | |||||
| Ti-O | matrix | 2.9607 | 4.7086 | 0.015 | |||||
| Ti-O | compounds | 2.9640 | 4.7170 | 0.025 | |||||
| 698 | pure Ti | matrix | 2.9630 | 4.7002 | |||||
| Ti-O | matrix | 2.9623 | 4.7115 | 0.019 | |||||
| Ti-O | compounds | 2.9671 | 4.7186 | 0.026 | |||||
| 723 | pure Ti | matrix | 2.9636 | 4.7014 | |||||
| Ti-O | matrix | 2.9625 | 4.7128 | 0.019 | |||||
| Ti-O | compounds | 2.9642 | 4.7224 | 0.029 | |||||
| 748 | pure Ti | matrix | 2.9642 | 4.7025 | |||||
| Ti-O | matrix | 2.9632 | 4.7083 | 0.010 | |||||
| Ti-O | compounds | 2.9643 | 4.7451 | 0.059 | |||||
| 773 | pure Ti | matrix | 2.9646 | 4.7036 | |||||
| Ti-O | matrix | 2.9646 | 4.7150 | 0.020 | |||||
| Ti-O | compounds | 2.9739 | 4.7493 | 0.065 | |||||
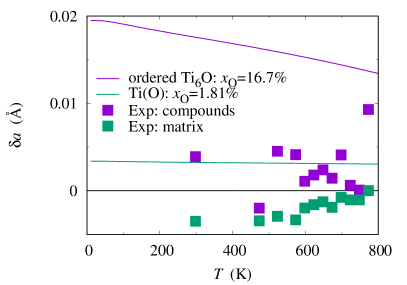
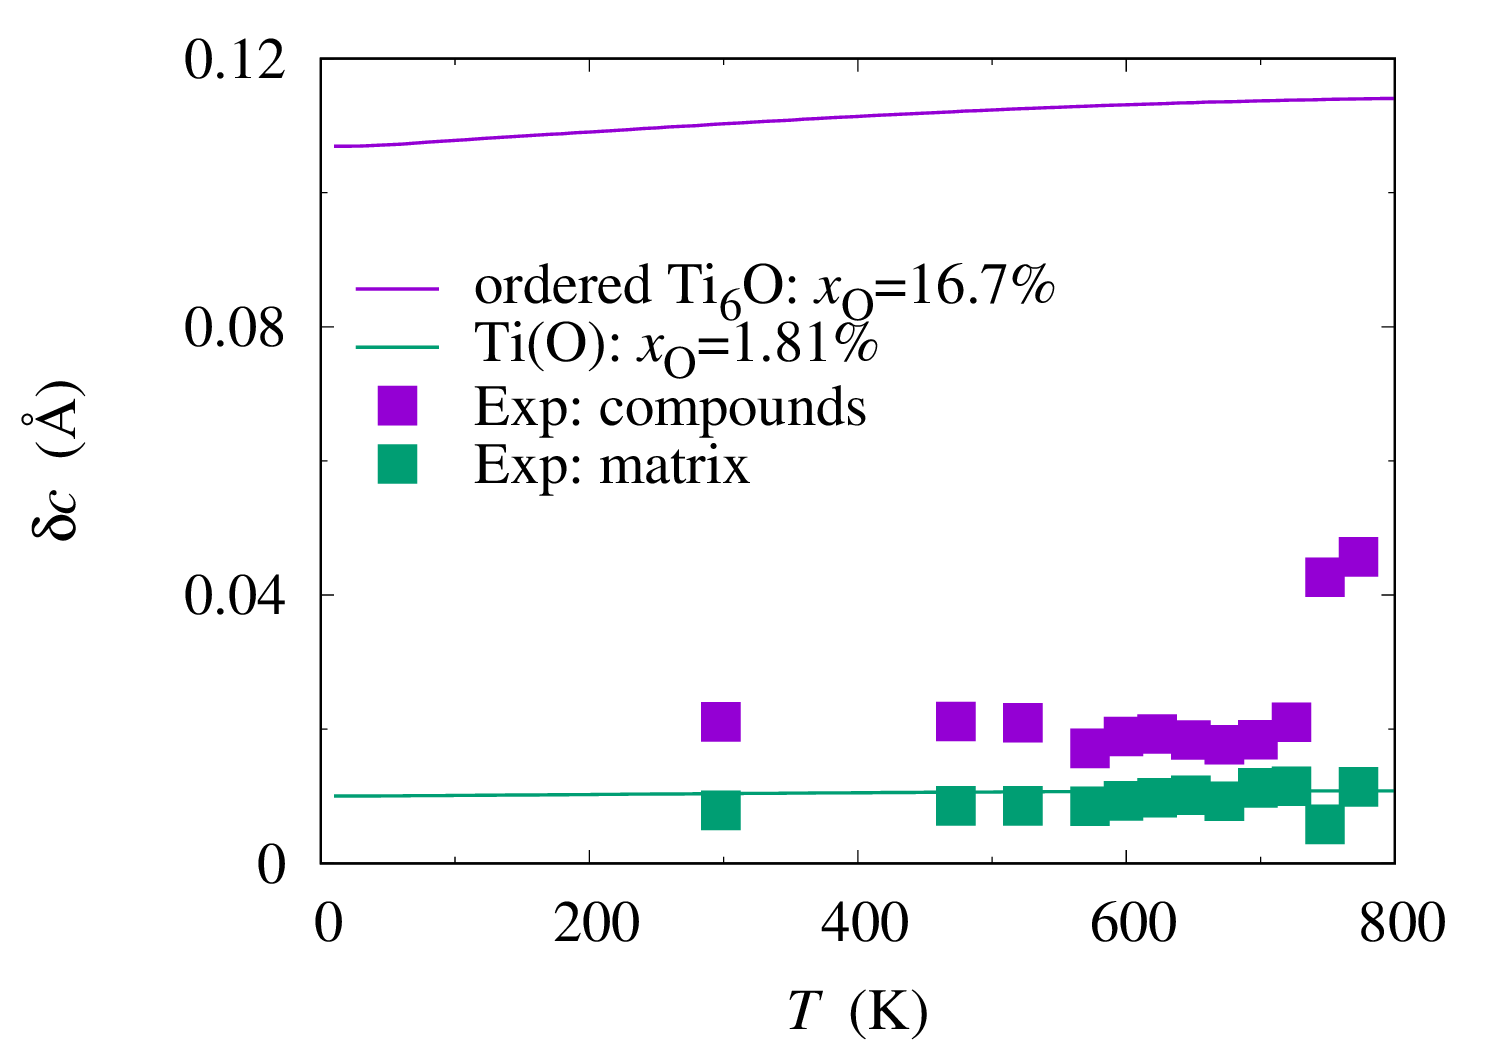
Rietveld refinement of XRD diffractograms allows extracting the lattice parameters and of pure Ti, as well as of both the matrix and the ordered compounds in the Ti-O alloy (Tab. 5). As expected, the ordered compounds have larger lattice parameters than the matrix in the Ti-O alloy for all the considered temperatures. To compare the lattice parameters measured in the Ti-O alloy with the ones deduced from ab initio calculations, we compute the differences and between the parameters measured in the alloy and in pure Ti at the same temperature, as these variations are less sensitive to the choice of the exchange-correlation functional used for ab initio calculations than absolute values and (cf appendix B). We neglect, for experimental data, the presence of 0.18 at.% oxygen in pure Ti, as it only has a marginal impact on the obtained and values. and characterize the increase of lattice parameters induced by the presence of oxygen. The increase measured for the matrix phase is almost constant with the temperature and its value corresponds to the theoretical one obtained for a random solid solution with the same nominal concentration as the Ti-O alloy (Fig. 8). This is a strong indication that there is no real oxygen depletion in the matrix despite the presence of ordered compounds. The experimental lattice increases obtained for the compounds are higher than the ones of the matrix but do not reach the theoretical values expected for ordered compounds with a Ti6O stoichiometry (Fig. 8). Although these compounds are enriched in oxygen, they do not have the expected 1/6 stoichiometry. The same conclusions could be drawn from the obtained lattice increase although things are less clear. The uncertainty comes from the smallest expected values for than for , because the impact of oxygen is smaller on than as already shown before (Fig. 5). Besides, because of the sample texture leading to the absence of the prismatic peak, the experimental precision on is not as high as on , explaining why slightly negative values are obtained for in the matrix while a lattice increase is expected.
IV.3 Discussion
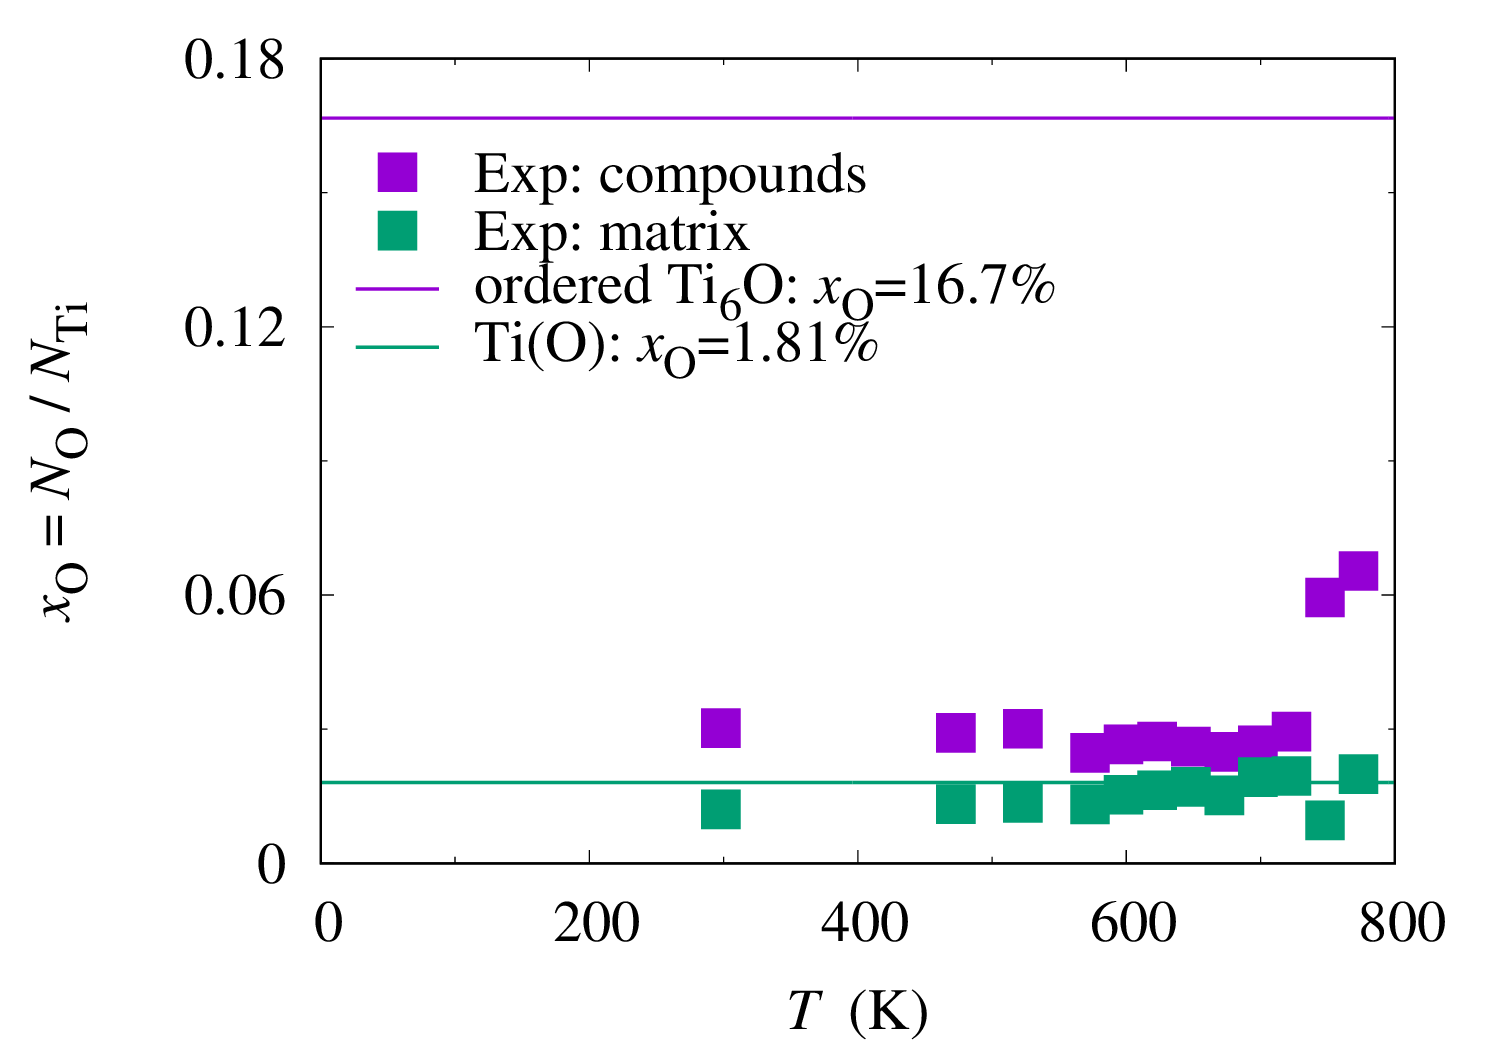
Despite the uncertainty existing on both the theoretical and experimental variations of Ti lattice parameters with oxygen content and with ordering state, one can try to determine the composition of the ordered compounds and of the matrix from the increases and of the lattice parameters, which have been measured by XRD at the different temperatures. A least square fit of both and parameters leads to the following expression for the occupation of the octahedral interstitial sites
| (4) |
Using the lattice parameters of pure Ti, and , determined experimentally at each temperature with the theoretical lattice increase and given in table 4, thus neglecting their variations with the temperature, one obtains the compositions given in table 5 and shown in Fig. 9. These results confirm that the ordered compounds have a lower composition than the expected value corresponding to Ti6O stoichiometry. Their composition starts to rise at the two highest temperatures considered in this study, 748 and 773 K, but without reaching the Ti6O composition. However, as noted before, the intensity of the diffraction peaks assigned to the ordered compounds is not very intense at these two temperatures (Fig. 12 in appendix C) and one cannot expect an accurate determination of the corresponding lattice parameters at these high temperatures where the ordered compounds have probably started to dissolve. Fig. 9 also illustrates that this approach to determine the composition of the matrix and of the ordered compounds cannot be considered fully quantitative: at low temperature, one observes an oxygen depletion of the matrix and an enrichment of the compounds, as expected, but at the highest temperatures, both phases are enriched, which violates conservation law. This uncertainty on the obtained composition arises from the difficulty to deconvoluate the X-ray diffraction pattern to associate different lattice parameters to different phases, the closer the lattice parameters, the more difficult. It is also hard to reach a precision high enough in the ab initio determination of the increase rates and , especially for such small variations of the lattice parameters. Finally, when deriving a composition from measured lattice parameters, we assume that the different phases are free of stress, which is not true for coherent compounds embedded in a matrix. Nevertheless, despite all the remaining uncertainties, the approach allows concluding that the ordered compounds do not have the Ti6O composition and are only slightly enriched with oxygen compared to the surrounding matrix.
As shown in Ref. [17] with electronic diffraction, these ordered compounds, which can be found in binary Ti-O alloys, have a crystallographic structure corresponding to the one known for Ti6O crystal (space group P31c). Although the binary phase diagram predicts that the equilibrium composition of these ordered compounds should be close to Ti6O stoichiometry [10], the present work shows that these precipitates do not have this composition. One possibility is that oxygen diffusion is not fast enough to reach thermal equilibrium. Considering the oxygen diffusion coefficient with an activation energy kJ mol-1 and a diffusion pre-exponential constant m2 s-1 [35], one can estimate the mean square displacement of oxygen atoms when diffusing a time laps , . For the recrystallization heat treatment ( K and s), the oxygen mean square displacement is 3 m, thus showing that equilibrium is reached. But, according to the theoretical phase diagram [10], this temperature is too high for Ti6O ordered compounds to be stable. The disappearance of the signature of this ordered phase in the diffraction patterns above 723 K is also a strong indication that Ti6O compounds are not stable at the recrystallization temperature. The ordered compounds should rather appear during the quench, when the temperature becomes low enough to lead to the decomposition of the initial homogeneous solid solution in a depleted solid solution and an ordered phase with Ti6O-type crystallographic structure. If the subsequent quench is fast enough, which should be true for the water quench used here, one does not expect that the forming precipitates reach equilibrium, thus explaining why the observed ordered compounds have a lower composition than the expected Ti6O stoichiometry.
Considering now the stays ( s) at different temperatures for the XRD measurements, the composition of the precipitates remains almost unchanged up to 723 K (Fig. 9), with the signature of the ordered compounds in the XRD pattern disappearing at this temperature and above (Fig. 12 in appendix C). Oxygen diffusion should be too slow below 723 K to allow for a change of precipitates. This appears reasonable as the oxygen mean square displacement is only 60 nm at K. At this temperature and above, it appears high enough to allow for precipitate evolution, in particular their dissolution, but not below. Better characterization of the kinetic evolution of the ordered compounds will require additional experimental techniques like synchrotron XRD with in situ heating to follow more precisely the evolution of the matrix and compounds lattice parameters, and hence of their composition, during the different heat treatments. In situ heating experiments in a TEM are also appealing to image the evolution of these precipitates, in particular of their size, shape, and density. Once the thermal conditions have been found to get closer to equilibrium without dissolving the precipitates, it should be possible to use analytical TEM or atom probe tomography to check that equilibrium precipitates have a composition close to Ti6O stoichiometry, as expected from the equilibrium phase diagram [10].
V Conclusions
Ab initio calculations correctly predict an increase of titanium lattice parameters with the oxygen concentration for compositions between pure Ti and Ti6O. The increase is more important for than for parameter, in agreement with experiments. The ordering state of oxygen atoms in the octahedral sites of the hcp lattice has an influence on these lattice parameters, but the impact is less important than the one of oxygen concentration: for a same oxygen composition, an ordered compound has a slightly larger (respectively lower) parameter (respectively parameter). This is true both at 0 K and at finite temperature, when lattice expansion is considered in the ab initio approach through the quasi-harmonic approximation.
Knowing the impact of both oxygen concentration and oxygen ordering on lattice parameters, it is theoretically possible to relate the lattice mismatches of ordered compounds existing in Ti-O binary alloys to their composition. Although the approach cannot be fully quantitative, because of the limited accuracy of ab initio phonon calculations and their difficulty to predict small variations of lattice parameters, it nevertheless leads to new information on the composition of the different phases. Applying the approach to an alloy containing 6000 wppm O (%), one can conclude that the ordered compounds, which are present after a heat treatment at 1023 K followed by a water quench, do not have the expected Ti6O stoichiometry but a composition close to the alloy nominal concentration. This makes these precipitates undetectable by experimental techniques which are sensitive only to chemistry, like analytical TEM or atom probe tomography. Oxygen ordering proceeds therefore at a faster pace than partitioning in this alloy: these precipitates have a long-range order corresponding to the Ti6O structure, as has been previously shown with TEM [17], but their composition is lower than the equilibrium one corresponding to Ti6O stoichiometry. These precipitates, which are out of equilibrium and probably appear during the quench following the recrystallization heat treatment, do not evolve until reaching temperatures high enough to allow for significant diffusion of oxygen, i.e. above 723 K. It remains to be found in more details how the thermo-mechanical processing, in particular the temperature and duration of the annealing or the cooling speed, impact the composition of these ordered compounds.
Appendix A Lattice expansion of pure Ti
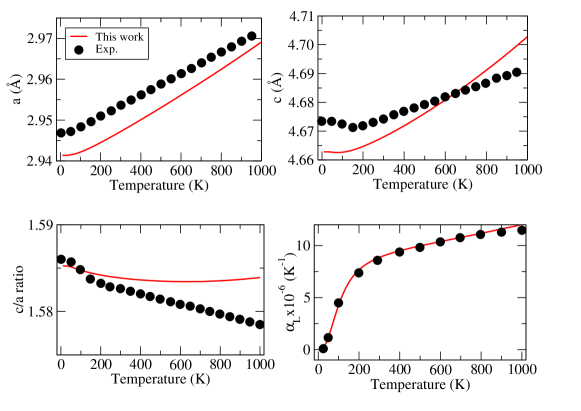
We examine in this appendix how quantitative is our modeling approach relying on ab initio calculations and the quasi-harmonic approximation to predict the variations with temperature of the lattice parameters, considering pure Ti for which experimental data can be found [36]. Calculations have been performed in a supercell containing 96 Ti atoms which is a replication of the conventional hcp unit cell. As shown in Fig. 10, the model reproduces reasonably well the experimental data, in particular the anisotropy of the linear expansion characterized by a decreasing ratio with temperature and a contraction of parameter at very low temperature, in agreement with previous ab initio calculations [37, 38, 31]. The best agreement is found for the variations of the volume with the temperature, as characterized by the average linear expansion
Appendix B Impact of exchange-correlation functional
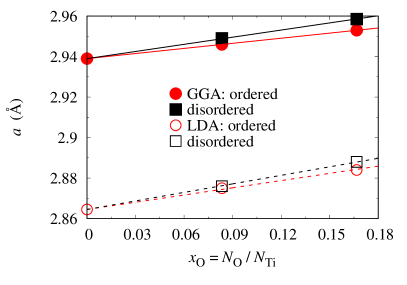
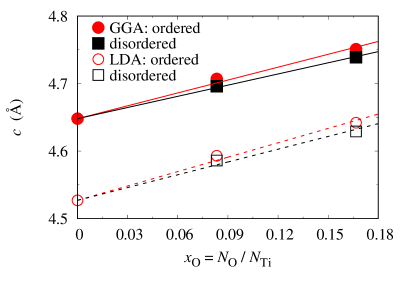
Equilibrium lattice parameters obtained from ab initio calculations are known to depend on the functional used to describe the electronic exchange and correlation. To test how the exchange-correlation functional impacts the obtained variations of the lattice parameters, we have performed additional calculations using the local density approximation (LDA) with the parameterization of Perdew and Zunger [39]. Except for the exchange-correlation functional, the ab initio parameters are the same as for GGA calculations. Calculations have been performed at 0 K, neglecting atomic vibrations, for pure Ti, Ti12O, and Ti6O, considering a disordered (SQS) and an ordered state. The structures, which rely on a 72 atoms supercell, are the sames as the ones described in section III.1. As expected, the LDA functional leads to slightly smaller lattice parameters than GGA (Fig. 11). But looking now to relative variations, one sees that LDA and GGA lead to the same linear variations with the oxygen content. The lines describing these linear variations are parallel, with only an offset corresponding to the different lattice parameters predicted by LDA and GGA for pure Ti. This is true both for the ordered and disordered states, with the increase rate of (respectively ) lattice parameter being slightly higher (respectively lower) for the disordered than for the ordered state. As long as one works with the lattice increases and induced by oxygen, there is thus no impact of the exchange-correlation functional used for ab initio calculations, at least when considering LDA and GGA-PBE functionals.
Appendix C XRD data
Acknowledgements.
This work was performed using HPC resources from GENCI-IDRIS and -TGCC (Grants 2022-096847). The French National Research Agency (ANR) is acknowledged for the funding of TiTol Project [ANR-19-CE08-0032]. Y. Millet from the Timet company is gratefully acknowledged for providing the alloys studied in this work.References
- Conrad [1981] H. Conrad, Effect of interstitial solutes on the strength and ductility of titanium, Prog. Mater. Sci. 26, 123 (1981).
- Murray and Wriedt [1987] J. L. Murray and H. A. Wriedt, The O-Ti (oxygen-titanium) system, Bull. Alloy Phase Diagr. 8, 148 (1987).
- Kornilov and Glazova [1965] I. I. Kornilov and V. V. Glazova, Phase diagram of the system Ti-O2 and some properties of the alloys of this system, in Physical metallurgy of titanium, edited by I. I. Kornilov (1965) pp. 12–28.
- Yamaguchi et al. [1966] S. Yamaguchi, M. Koiwa, and M. Hirabayashi, Interstitial superlattice of Ti6O and its transformation, J. Phys. Soc. Jpn. 21, 2096 (1966).
- Yamaguchi [1969] S. Yamaguchi, Interstitial order-disorder transformation in the Ti-O solid solution. I. Ordered arrangement of oxygen, J. Phys. Soc. Jpn. 27, 155 (1969).
- Hirabayashi et al. [1974] M. Hirabayashi, S. Yamaguchi, H. Asano, and K. Hiraga, Order-disorder transformations of interstitial solutes in transition metals of IV and V groups, in Order-Disorder Transformations in Alloys (Springer, Berlin Heidelberg, 1974) pp. 266–302.
- Banerjee and Mukhopadhyay [2007] S. Banerjee and P. Mukhopadhyay, Phase transformations: examples from titanium and zirconium alloys, edited by R. W. Cahn, Pergamon Materials Series, Vol. 12 (Elsevier Science, 2007).
- Ruban et al. [2010] A. V. Ruban, V. I. Baykov, B. Johansson, V. V. Dmitriev, and M. S. Blanter, Oxygen and nitrogen interstitial ordering in hcp Ti, Zr, and Hf: An ab initio study, Phys. Rev. B 82, 134110 (2010).
- Burton and van de Walle [2012] B. P. Burton and A. van de Walle, First principles phase diagram calculations for the octahedral-interstitial system TiOx, 0 , Calphad 39, 97 (2012).
- Gunda et al. [2018] N. S. H. Gunda, B. Puchala, and A. V. der Ven, Resolving phase stability in the Ti-O binary with first-principles statistical mechanics methods, Phys. Rev. Mater. 2, 033604 (2018).
- Yu et al. [2015] Q. Yu, L. Qi, T. Tsuru, R. Traylor, D. Rugg, J. W. Morris, M. Asta, D. C. Chrzan, and A. M. Minor, Origin of dramatic oxygen solute strengthening effect in titanium, Science 347, 635 (2015).
- Barkia et al. [2015] B. Barkia, V. Doquet, J.-P. Couzinié, I. Guillot, and E. Héripré, In situ monitoring of the deformation mechanisms in titanium with different oxygen contents, Mater. Sci. Eng., A 636, 91 (2015).
- Barkia et al. [2017] B. Barkia, J.-P. Couzinié, S. Lartigue-Korinek, I. Guillot, and V. Doquet, In situ TEM observations of dislocation dynamics in titanium: Effect of the oxygen content, Mater. Sci. Eng., A 703, 331 (2017).
- Chaari et al. [2019] N. Chaari, D. Rodney, and E. Clouet, Oxygen-dislocation interaction in titanium from first principles, Scr. Mater. 162, 200 (2019).
- Chong et al. [2020] Y. Chong, M. Poschmann, R. Zhang, S. Zhao, M. S. Hooshmand, E. Rothchild, D. L. Olmsted, J. W. Morris, D. C. Chrzan, M. Asta, and A. M. Minor, Mechanistic basis of oxygen sensitivity in titanium, Sci. Adv. 6, eabc4060 (2020).
- Chong et al. [2023] Y. Chong, R. Gholizadeh, T. Tsuru, R. Zhang, K. Inoue, W. Gao, A. Godfrey, M. Mitsuhara, J. W. Morris, A. M. Minor, and N. Tsuji, Grain refinement in titanium prevents low temperature oxygen embrittlement, Nat. Commun. 14, 404 (2023).
- Poulain et al. [2022] R. Poulain, S. Delannoy, I. Guillot, F. Amann, R. Guillou, S. Lartigue-Korinek, D. Thiaudière, J.-L. Béchade, E. Clouet, and F. Prima, First experimental evidence of oxygen ordering in dilute titanium–oxygen alloys, Mater. Res. Lett. 10, 481 (2022).
- Kornilov [1973] I. I. Kornilov, Effect of oxygen on titanium and its alloys, Met. Sci. Heat Treat. 15, 826 (1973).
- Amann et al. [2023a] F. Amann, R. Poulain, S. Delannoy, J.-P. Couzinié, E. Clouet, I. Guillot, and F. Prima, An improved combination of tensile strength and ductility in titanium alloys via oxygen ordering, Mater. Sci. Eng. A 867, 144720 (2023a).
- Kresse and Furthmüller [1996] G. Kresse and J. Furthmüller, Efficiency of ab-initio total energy calculations for metals and semiconductors using a plane-wave basis set, Comput. Mater. Sci. 6, 15 (1996).
- Perdew et al. [1996] J. P. Perdew, K. Burke, and M. Ernzerhof, Generalized gradient approximation made simple, Phys. Rev. Lett. 77, 3865 (1996).
- Blöchl [1994] P. E. Blöchl, Projector augmented-wave method, Phys. Rev. B 50, 17953 (1994).
- Monkhorst and Pack [1976] H. J. Monkhorst and J. D. Pack, Special points for Brillouin-zone integrations, Phys. Rev. B 13, 5188 (1976).
- van de Walle et al. [2013] A. van de Walle, P. Tiwary, M. de Jong, D. L. Olmsted, M. Asta, A. Dick, D. Shin, Y. Wang, L.-Q. Chen, and Z.-K. Liu, Efficient stochastic generation of special quasirandom structures, Calphad 42, 13 (2013).
- Yamaguchi et al. [1970] S. Yamaguchi, K. Hiraga, and M. Hirabayashi, Interstitial order-disorder transformation in the Ti-O solid solution. IV. A neutron diffraction study, J. Phys. Soc. Jpn. 28, 1014 (1970).
- Wiedemann et al. [1987] K. E. Wiedemann, R. N. Shenoy, and J. Unnam, Microhardness and lattice parameter calibrations of the oxygen solid solutions of unalloyed -titanium and Ti-6Al-2Sn-4Zr-2Mo, Metall. Trans. A 18, 1503 (1987).
- Togo and Tanaka [2015] A. Togo and I. Tanaka, First principles phonon calculations in materials science, Scripta Mater. 108, 1 (2015).
- Wolverton and Zunger [1995] C. Wolverton and A. Zunger, First-principles theory of short-range order, electronic excitations, and spin polarization in Ni-V and Pd-V alloys, Phys. Rev. B 52, 8813 (1995).
- Zhang et al. [2017] X. Zhang, B. Grabowski, F. Körmann, C. Freysoldt, and J. Neugebauer, Accurate electronic free energies of the , , and transition metals at high temperatures, Phys. Rev. B 95, 165126 (2017).
- Cottura and Clouet [2018] M. Cottura and E. Clouet, Solubility in Zr-Nb alloys from first-principles, Acta Mater. 144, 21 (2018).
- Argaman et al. [2016] U. Argaman, E. Eidelstein, O. Levy, and G. Makov, Ab initio study of the phononic origin of negative thermal expansion, Phys. Rev. B 94, 174305 (2016).
- Poulain [2020] R. Poulain, Conception et développement d’une nouvelle famille d’alliages de titane à haute résistance mécanique et biocompatibilité optimisée pour l’implantologie dentaire, Ph.D. thesis, Université PSL (2020).
- Toby [2006] B. H. Toby, factors in Rietveld analysis: How good is good enough?, Powder Diffr. 21, 67 (2006).
- Amann et al. [2023b] F. Amann, R. Poulain, S. Delannoy, R. Guillou, M. Talla Noutack, Z. Kloenne, S. Nowak, J.-P. Couzinié, F. De Geuser, D. Thiaudière, J.-L. Béchade, E. Clouet, H. Fraser, I. Guillot, and F. Prima, On the oxygen ordering mechanisms in dilute Ti-Zr-O systems, in World Conference on Titanium, Vol. in press (2023).
- Liu and Welsch [1988] Z. Liu and G. Welsch, Literature survey on diffusivities of oxygen, aluminum, and vanadium in alpha titanium, beta titanium, and in rutile, Metall. Trans. A 19, 1121 (1988).
- Touloukian et al. [1975] Y. S. Touloukian, R. K. Kirby, R. Taylor, and P. D. Desai, Thermal expansion - metallic elements and alloys, in Thermophysical Properties of Matter Thermal Expansion, Vol. 12 (Plenum, New York, 1975).
- Souvatzis et al. [2007] P. Souvatzis, O. Eriksson, and M. I. Katsnelson, Anomalous thermal expansion in -titanium, Phys. Rev. Lett. 99, 015901 (2007).
- Mei et al. [2009] Z.-G. Mei, S.-L. Shang, Y. Wang, and Z.-K. Liu, Density-functional study of the thermodynamic properties and the pressure–temperature phase diagram of Ti, Phys. Rev. B 80, 104116 (2009).
- Perdew and Zunger [1981] J. P. Perdew and A. Zunger, Self-interaction correction to density-functional approximations for many-electron systems, Phys. Rev. B 23, 5048 (1981).