Medium Resolution 0.97-5.3 m spectra of Very Young Benchmark Brown Dwarfs with NIRSpec onboard the James Webb Space Telescope
Abstract
Spectra of young benchmark brown dwarfs with well-known ages are vital to characterize other brown dwarfs, for which ages are in general not known. These spectra are also crucial to test atmospheric models which have the potential to provide detailed information about the atmospheres of these objects. However, to optimally test atmospheric models, medium-resolution, long-wavelength coverage spectra with well-understood uncertainties are ideal, such as the spectra provided by the NIRSpec instrument onboard the James Webb Space Telescope. In this paper, we present the medium-resolution JWST/NIRSpec spectra of two young brown dwarfs, TWA 28 (M9.0) and TWA 27A (M9.0), and one planetary-mass object, TWA 27B (L6.0), members of the TW Hydrae Association (10 Myr). We show the richness of the atomic lines and molecular bands present in the spectra. All objects show signs of a circumstellar disk, via near-infrared excess and/or via emission lines. We matched a set of cloudless atmospheric spectra (ATMO), and cloudy atmospheric spectra (BT-Settl) to our NIRSpec spectra, and analyzed which wavelength ranges and spectral features both models reproduce best. Both models derive consistent parameters for the three sources, and predict the existence of at 3.35 m in TWA 27B. Nonetheless, in contrast to other slightly older objects with similar spectral type, like PSO 318.5–22 and VHS 1256b, this feature is not present in the spectrum of TWA 27B. The lack of the feature might suggest that the L/T transition of very young dwarfs starts at later spectral types than for older brown dwarfs.
1 Introduction
Brown dwarfs are canonically defined as substellar objects intermediate between low-mass stars and planets (), never reaching high enough core temperature to fuse hydrogen. Thus, since they are born, brown dwarfs cool down with time (Burrows et al., 2001; Baraffe et al., 2002). Due to their evolution, given any brown dwarf, it is challenging in general to determine its age or its mass (age-mass degeneracy), which turns the accurate physical characterization of brown dwarfs into a challenge, since most brown dwarfs are free-floating, and therefore their ages and/or masses are highly unconstrained. For this reason, spectra of brown dwarfs with well-determined ages, i.e. members of open clusters, young associations, young moving groups, or companions to higher-mass objects, are of key importance for the characterization of brown dwarfs as a whole.
Dozens of spectra of young benchmark brown dwarfs, younger than 200 Myr, and with a reliable estimation of their age (i.e. companions to stars, bona fide members of young moving groups, members of open cluster associations), were published in the literature since the discovery of brown dwarfs (e.g. Allers & Liu 2013; Bonnefoy et al. 2014; Manjavacas et al. 2014; Faherty et al. 2016; Manjavacas et al. 2020; Miles et al. 2023). Nevertheless, most of those spectra are limited to the optical and the near-infrared in the best cases, and the majority have been obtained using ground-based facilities, which limits the precision of their calibrations, due to the fast-varying nature of telluric absorptions of the Earth’s atmosphere. Although tellurics can be corrected up to some extent, their removal is usually not perfect. In addition, direct comparison between brown dwarf spectra of the same objects obtained with ground-based facilities and the Hubble Space Telescope show differences in colors and in the shape of the water band at 1.4 m (Manjavacas et al., 2019).
Although ground-based brown dwarf spectra remain extremely useful, they are not ideal for atmospheric model testing, since the majority just cover near-infrared wavelengths or near-infrared and optical wavelengths in the best case, providing a limited coverage of their spectral energy distribution (SED). In addition, there are few ground-based brown dwarf spectral libraries that cover the mid-infrared. Having a wide wavelength coverage is particularly important for deriving accurate bolometric luminosities, and for testing synthetic spectra derived using atmospheric models. In particular for testing retrieval models, having, in addition, reliable flux uncertainties is crucial, since their results rely on the uncertainties of the spectra being accurate to enable a probabilistic assessment of their fitted parameters and their uncertainties. Thus, medium-resolution, accurately-calibrated, long-wavelength coverage spectra, like those provided by the recently commissioned near- and mid-infrared instruments onboard the James Webb Space Telescope (JWST) are needed to properly test atmospheric models.
Finally, even though addressing this question is beyond the scope of this work, atmospheric models allow us to provide further constraints on the formation mechanism for brown dwarfs and planets via the measurement of the C/O ratios. A brown dwarf atmosphere could have a supersolar C/O ratio if it formed via core or pebble accretion, but will have a solar C/O ratio if formed via gravitational instability (Öberg et al., 2011). Carbon- and oxygen-bearing molecules (, CO, , and ) are the primary absorbers of the emitted spectra of brown dwarfs, and the main carbon and oxygen-bearing species. For an accurate determination of C/O ratios long wavelength coverage spectra that allow us to measure the abundances of most of the carbon- and oxygen-bearing molecules in brown dwarf spectra are also crucial.
In this paper, we present the medium-resolution 0.97-5.3 m NIRSpec/JWST spectra of two benchmark young M9.0 brown dwarfs members of the TW Hydrae association (102 Myr, Mamajek 2005; Barrado Y Navascués 2006; Luhman 2023), TWA 28 and TWA 27A, and its planetary-mass companion, TWA 27B, which are the higher signal-to-noise, broader wavelength coverage, and higher resolution spectra of young benchmark brown dwarfs up date. We present a comparison to cloudy and cloudless atmospheric models. In Section 2 we describe the main physical characteristics of the three brown dwarfs presented in this paper as presented in the literature. In Section 3, we describe the JWST/NIRSpec observations carried out for our targets. In Section 4 we describe the data reduction. In Section 5 we identify the atomic lines and molecular bands present in the spectra of TWA 28, TWA 27A and TWA 27B. In Section 6 we compare our spectra with cloudy and cloudless models, and derive their effective temperatures and surface gravities. In Section 7 we discuss our results. Finally, in Section 8 we summarize our conclusions.
2 Targets
Both TWA 28 and TWA 27A were classified as M9.0 dwarfs by Venuti et al. (2019) using 0.30-2.50 m X-shooter spectra (resolution R = 9700-11600), reporting very similar atmospheric and physical parameters for both objects. Venuti et al. (2019) obtained X-Shooter spectra of eleven TWA members with infrared excess with spectral types between M0 and M9, and masses between 0.58 and 0.02 . They derived the individual extinction, stellar parameters, and accretion parameters for each object simultaneously, and they measured the luminosity of Balmer lines and forbidden emission lines to probe the physics of the star-disk interaction environment.
Venuti et al. (2019) derived an effective temperature of 2660 K, and a log g = 4.1, for TWA 28, with an estimated mass of 0.020 (20.92 ), and a radius of 0.29 (2.9), with a measured luminosity of log L = -2.47 . Signs of a circumstellar disk were found for TWA 28 due to a near-infrared excess observed in its X-shooter spectrum, and emission lines were found mostly in UV and optical wavelengths. Venuti et al. (2019) measured an accretion rate estimate of = -12.24 .
For TWA 27A, Venuti et al. (2019) estimated an effective temperature of 2640 K, and a log g = 3.75, sightly smaller than for TWA 28. Venuti et al. (2019) estimated the mass of TWA 27A in 0.019 (19.9 ), and a radius of 0.35 (3.5), also bigger than TWA 28 radius. Venuti et al. (2019) measured a luminosity of log L = -2.19 for TWA 27A. Similarly, as for TWA 28, TWA 27A also showed signs of a circumstellar disk due to near-infrared excess and emission lines in its X-shooter spectrum, measuring an accretion rate of = -11.23 . In addition, using ALMA observations, Ricci et al. (2017) detected emission from dust continuum at 0.98 mm from the = 3 – 2 rotational transition of the CO from a very compact disk around TWA 27A with a dust mass of approximate 0.1 . Ricci et al. (2017) argue that the small radius of the TWA 27A disk is due to the truncation due to the tidal interaction with its planetary-mass companion, TWA 27B.
TWA 27B is the first directly-imaged planetary-mass companion (M = 52 , Chauvin et al. 2005). TWA 27A and b are separated by 0.”77, corresponding to 40.6 au at a distance of 52.8 pc as estimated by Ducourant et al. (2008). TWA 27B has a L6.0 spectral type and an effective temperature of 1300 K (Luhman et al., 2023). Its JWST/NIRSpec near-infrared spectrum shows emission lines suggesting the existence of a circumstellar disk (Luhman et al., 2023). Using ALMA observations, Ricci et al. (2017) estimated an upper limit of 1 for the mass of the dust surrounding TWA 27B.
The coordinates, spectral types, magnitudes, distances and other fundamental parameters of our targets are summarized in Table 1.
| Name | RA | DEC | SpT | log g | Parallax (mas) | Age (Myr) | Mass () | log L () | References | |
|---|---|---|---|---|---|---|---|---|---|---|
| TWA 28 | 11 02 09.83 | -34 30 35.56 | 13.0 | M9.0 | 4.10 | 16.870.13 | 102 | 20.96 | -2.47 | 1, 2, 3 |
| TWA 27A | 12 07 33.46 | -39 32 54.01 | 13.0 | M9.0 | 3.75 | 15.460.12 | 102 | 19.95 | -2.19 | 1, 2, 3 |
| TWA 27B | 12 07 33.50 | -39 32 54.40 | 19.5 | L6.0 | 3.50 | 15.460.12 | 102 | 5.02 | -4.47 | 2, 3, 4 |
3 Observations
TWA 28, TWA 27A and TWA 27B were observed using the NIRSpec (Jakobsen et al., 2022) Integral Field Unit (IFU, Böker et al. 2022) onboard the James Webb Space Telescope (JWST, Gardner et al. 2023), as part of the Guaranteed Time Observations (GTO) 1270 (P.I. Birkmann). The observations were obtained on February 7, 2023. The data were obtained using the medium-resolution gratings with a resolution of R2700 at 2.20 m, and a total wavelength coverage of 0.97–5.3 m. The combination of gratings and filters used was: G140H/F100LP (0.97-1.89 m), G235H/F170LP (1.66-3.17), and G395H/F290LP (2.87–5.27 m). The observations were performed using the NRSIRS2RAPID readout pattern, with 32 groups for G140H/F100LP and G395H/F290LP, and 31 groups for G235H/F170LP, with 4 dithers. The total resulting observation time was 1900 s. The position angle of the telescope was designed to avoid bright stars in the field falling inside the Multi-shutter assembly, which would contaminate the IFU spectra of our targets. Both TWA 27A and TWA 27B fitted inside the field of the IFU (3.1” X 3.2”). TWA28 was used to extract the spectrum of TWA 27B, since it has a similar spectral type to TWA 27A. The JWST data presented in this paper were obtained from the Mikulski Archive for Space Telescopes (MAST) at the Space Telescope Science Institute. The specific observations analyzed can be accessed via https://doi.org/10.17909/gp39-v372 (catalog DOI: 10.17909/gp39-v372).
4 Data Reduction
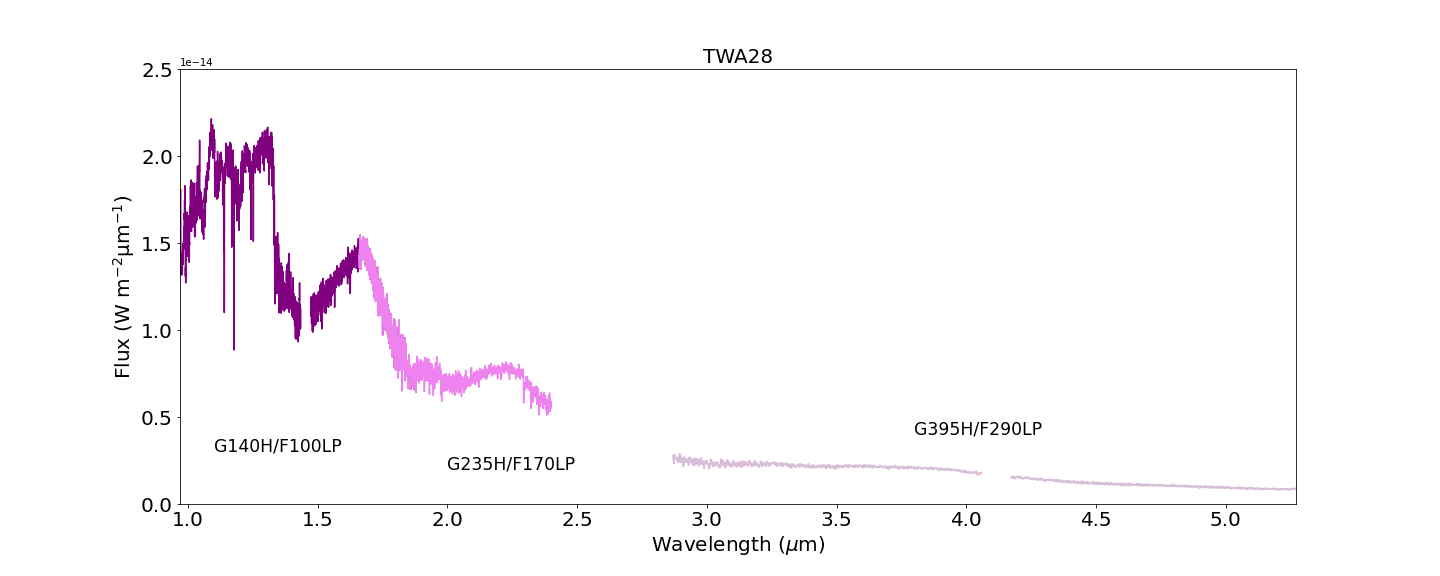
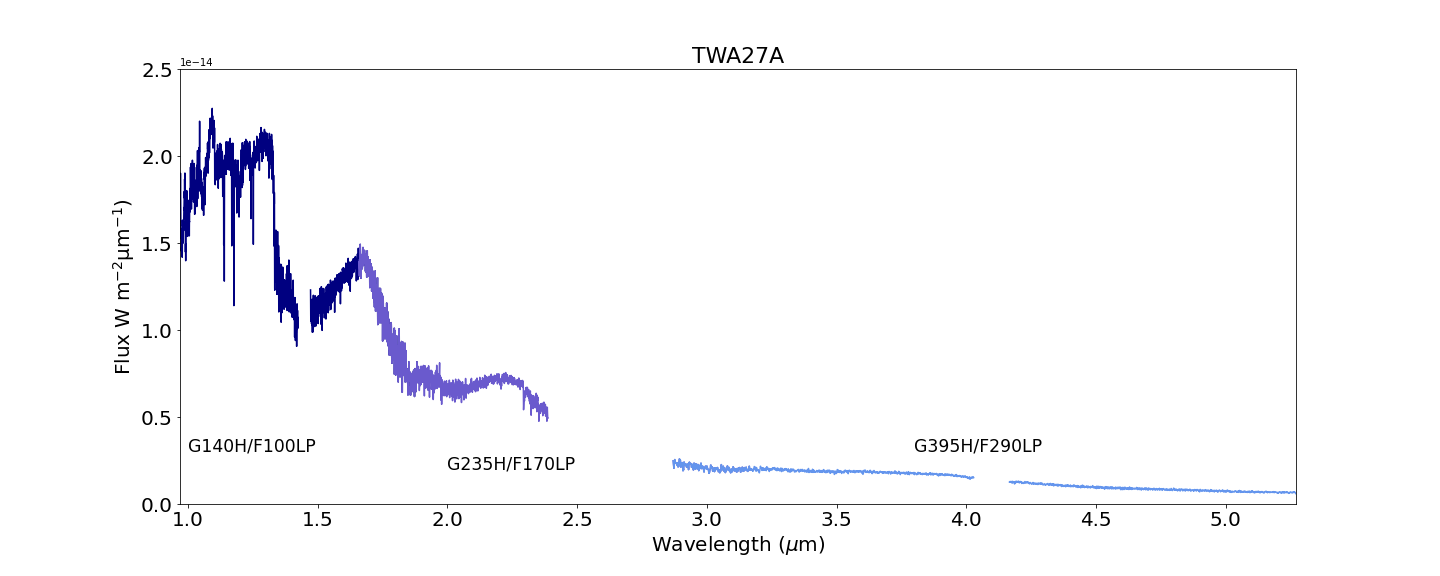
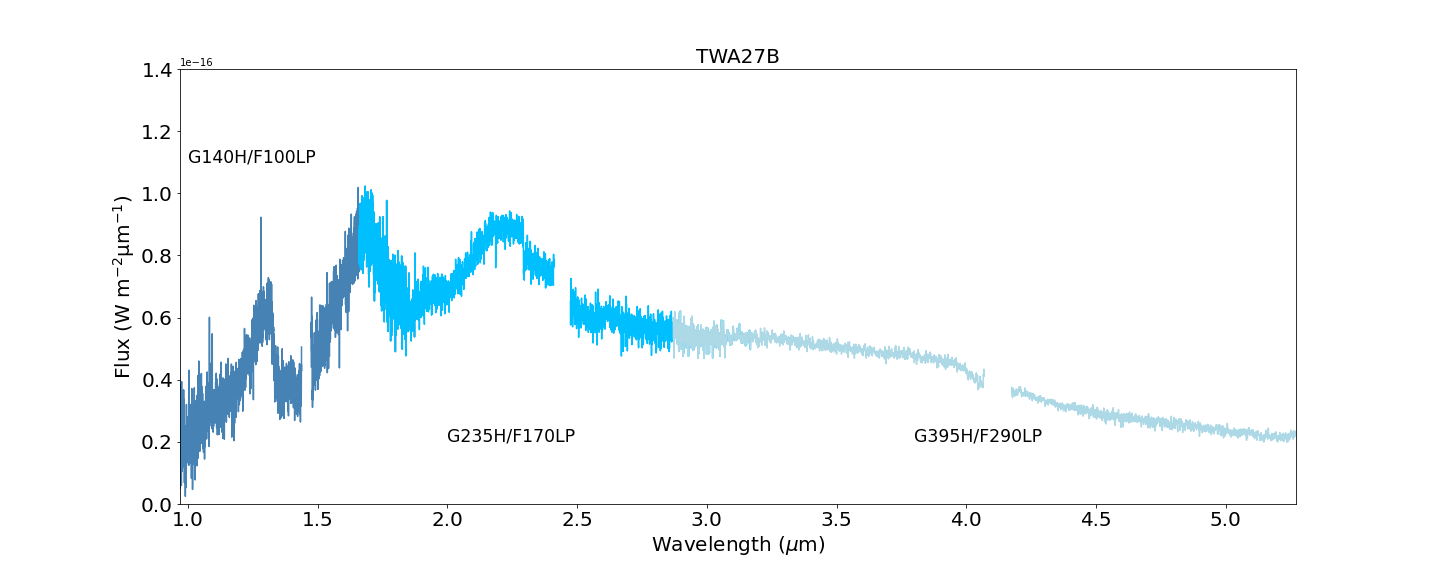
For the data reduction, we started with the ramps (‘uncal’ files in STScI pipeline notation) ‘raw’ data as downloaded from MAST and performed the ramps-to-slopes processing using the ESA Instrument Development Team pipeline, as it features a better correction for ‘snowballs’ and correction for residual correlated noise in IFU data. These count rate maps (‘rate’ files in STScI pipeline notation) were then used as inputs to the JWST calwebb_spec2 pipeline (version 1.9.4) with the default processing steps, including assignment of WCS, flat fielding, and aperture correction. We then flagged outliers in the resulting ‘cal’ files using statistical methods, before building the IFU data cubes using the calwebb_spec3 pipeline with outlier detection disabled/skipped. The latter was necessary as currently, the pipeline’s outlier detection is not working properly, resulting in many erroneously flagged data points and poor final cubes. The cubes were built with a spaxel size of 0.1” in the ‘ifualign’ coordinate system, in order to have the same PSF orientation between observations. Spectra for TWA 27A and TWA 28 were extracted from these cubes with an aperture radius of 4 spaxels, and we used the scaled and shifted TWA 28 cube to subtract from TWA 27A to get a contamination-free spectrum of TWA 27B. We performed the same reduction steps on standard star P330E observed in program 1538 observation 62 with the NIRSpec IFU in the same gratings/filters and verified the flux calibration with the apertures used. The minimum signal-to-noise of the reduced spectra for TWA 28 and TWA 27B is about 150, and 30 for TWA 27B. We need to note that the quality and signal-to-noise of the spectra might improve as the NIRSpec calibrations and the pipeline are improved in the upcoming cycles. The flux-calibrated reduced data are shown in Figure 1. In all the figures through the paper in which these spectra are shown, the spectrum of TWA 28 will be consistently shown in purple, the spectrum of TWA 27A will be shown in dark blue, and the spectrum of TWA 27B in light blue. The reduced spectra will be available in the electronic version of this article.
5 Data Analysis
In this Section, we show the original resolution spectra of TWA 27A, TWA 27B, and TWA 28. We identify the most relevant atomic lines and molecular bands in each object. We performed a spectral indices analysis for the three objects to confirm their surface gravity. Finally, we will perform a modeling fitting to cloudy and cloudless modeled spectra.
5.1 Identification of Spectral Lines and Molecular Bands
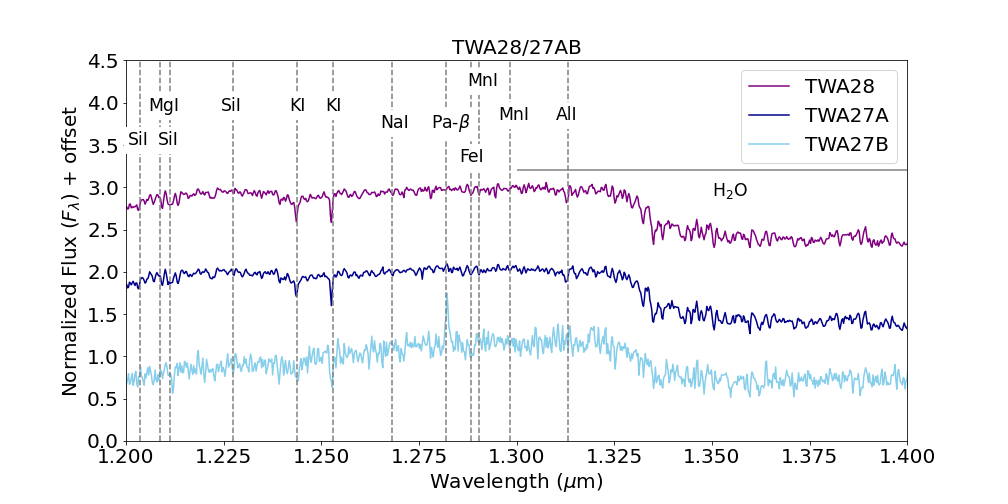
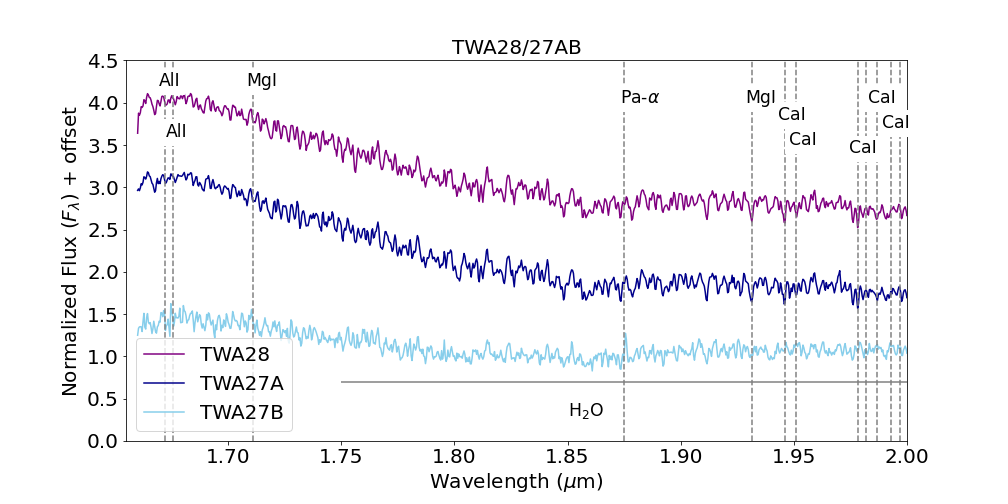
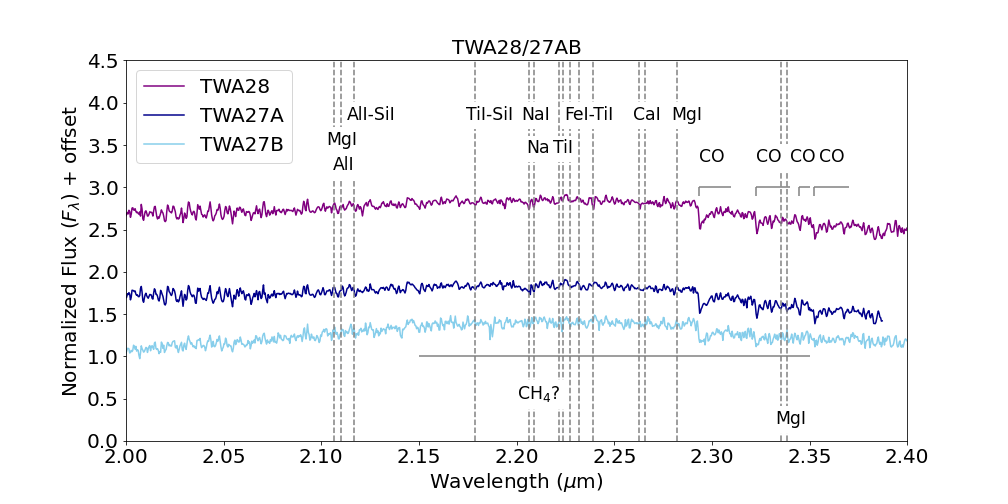
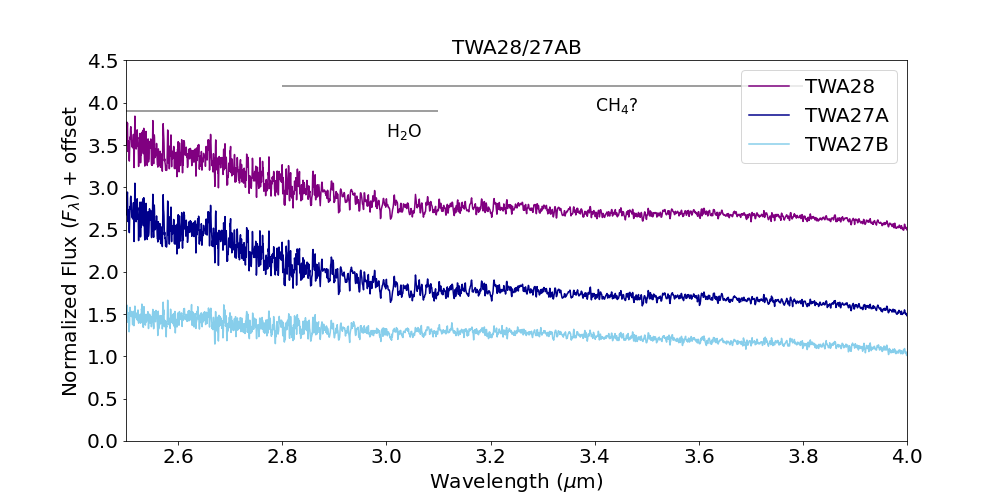
Together with the spectrum of VHS1256 b (Miles et al., 2023), the JWST/NIRSpec spectra presented in this paper for TWA 28, TWA 27A and TWA 27B have the highest signal-to-noise ratio, resolution, and broadest spectral coverage of all the available brown dwarfs and planetary-mass objects to date. In this Section, we will visually identify the wealth of atomic and molecular lines identified in the spectra of these three young brown dwarfs/planetary-mass objects. To be able to analyze in more detail the different spectral characteristics that appear in each object, we will zoom in on each wavelength range of interest. For visualization purposes, we normalize all spectra to its median flux value in each range and apply an offset to show them together in the same plot. We list the expected atomic lines and molecular bands as described in Cushing et al. (2005). We also measure the equivalent width of the most prominent absorption lines, namely, the K I, Na I alkali lines. In addition, we will measure the prominent Paschen , , and , together with the He I lines that are related to the potential existence of an accretion disk around TWA 27B.
5.1.1 0.97–1.20 m wavelength range
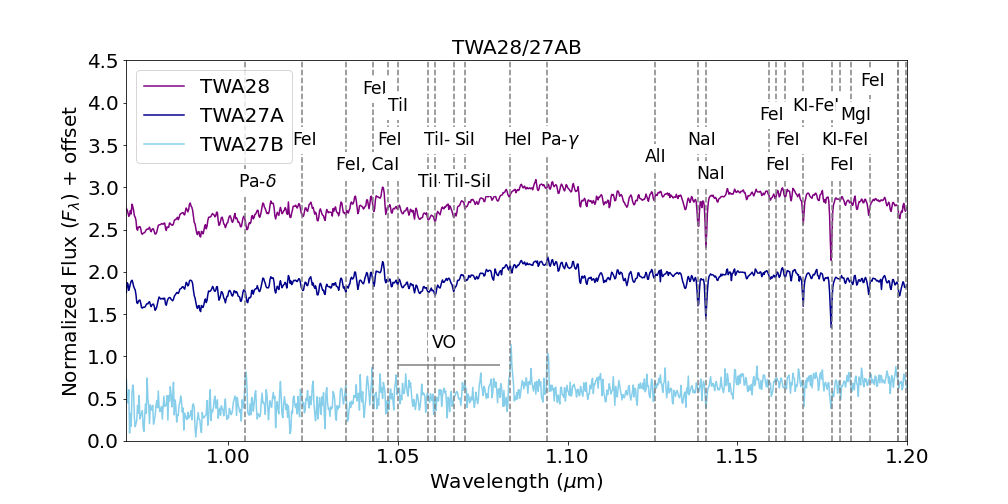
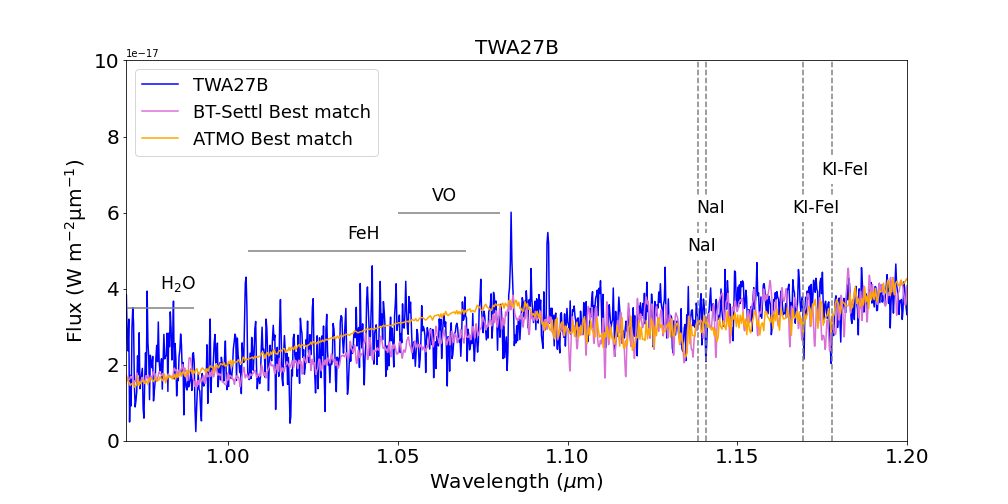
In the top panel of Fig. 2 we show the spectra of TWA 28, TWA 27A, and TWA 27B in the wavelength range between 0.97–1.20 m. We marked the expected atomic lines, and molecular bands as listed in Cushing et al. (2005), although not all of them are clearly detected. In TWA 28 and TWA 27A, the most prominent absorption lines are: the Na I doublet at 1.138 and 1.140 m, the K I-Fe I doublet at 1.169 and 1.178 m, the Fe I line at 1.180 m, the Fe I line at 1.0347 m, and the Ti I–Si I line at 1.0664 m. Finally, we identify the VO molecular band between 1.05 and 1.08 m.
The spectrum of TWA 27B has lower signal-to-noise, but we can still identify some prominent absorption lines: the Na I doublet at 1.138 and 1.140 m, and the K I-Fe I doublet at 1.169 and 1.178 m. For TWA 27B, the emission lines are quite prominent indicating the potential existence of an accretion disk, namely, these lines are the Paschen- line at 1.005 m, the He I at 1.0830 m, and the Paschen- at 1.094 m.
5.1.2 1.20–1.40 m wavelength range
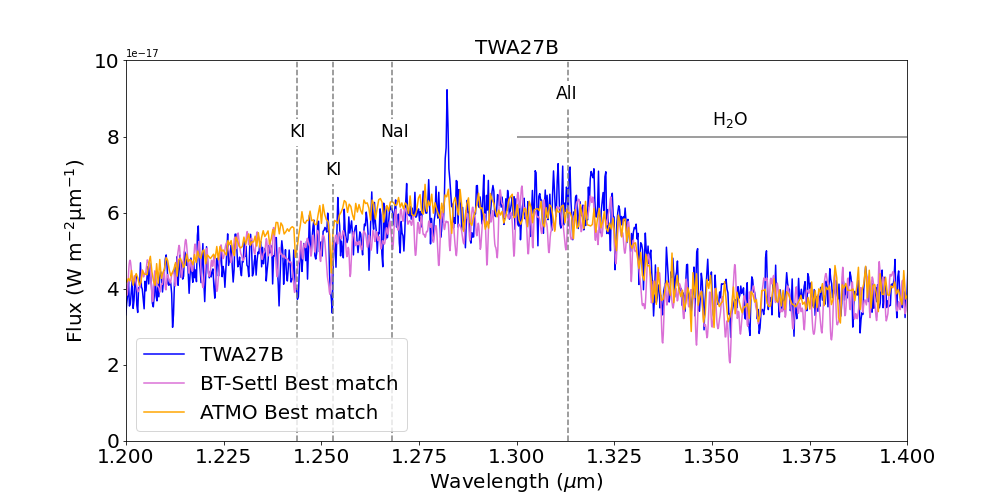
In the middle panel of Fig. 2 we show the spectra of TWA 28, TWA 27A, and TWA 27B in the wavelength range between 1.20–1.40 m, with the expected atomic lines, and molecular bands as listed in Cushing et al. (2005). In TWA 28 and TWA 27A, the most prominent absorption lines are: the K I doublet at 1.243 m and 1.252 m, the Al I line at 1.313 m, the Na I line at 1.268 m, and the Fe I line at 1.288 m. Finally, from 1.3–1.51 m, we identify the band.
As for the previous wavelength range, the spectrum of TWA 27B has lower signal-to-noise, but we can still identify the K I doublet at 1.243 m and 1.252 m. For emission lines, we identify a very prominent Paschen- line at 1.282 m, and also the band from 1.3–1.51 m.
5.1.3 1.65–2.00 m wavelength range
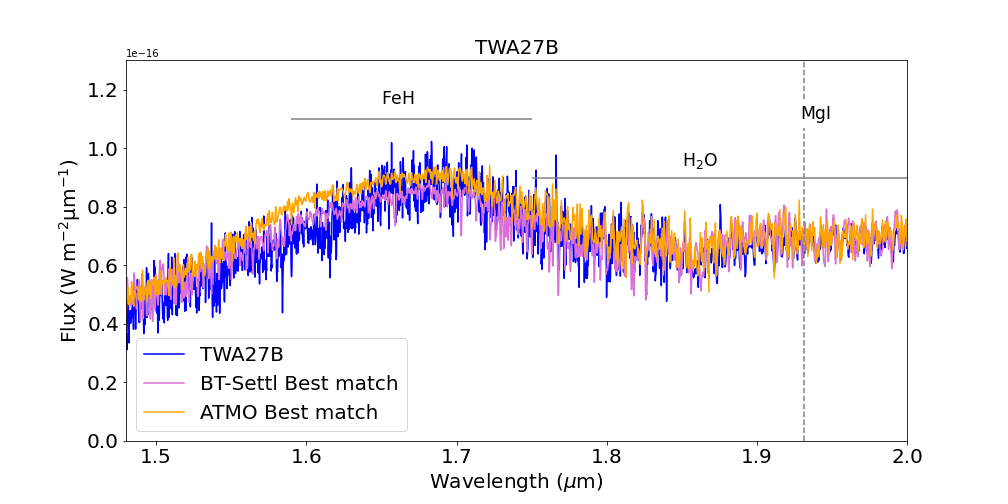
In the bottom panel of Fig. 2 we show the spectra of TWA 28, TWA 27A, and TWA 27B in the wavelength range between 1.65–2.0 m, with the expected atomic lines, and molecular bands as listed in Cushing et al. (2005). In TWA 28 and TWA 27A, the most prominent absorption lines are: the Mg I line at 1.931 m, and the Ca I lines at 1.986 and 1.993 m. Finally, we detect the band from 1.75–2.05 m.
For TWA 27B, the only clearly visible line is the Paschen- line at 1.875 m. The band from 1.75–2.05 m is also present.
5.1.4 2.00–2.39 m wavelength range
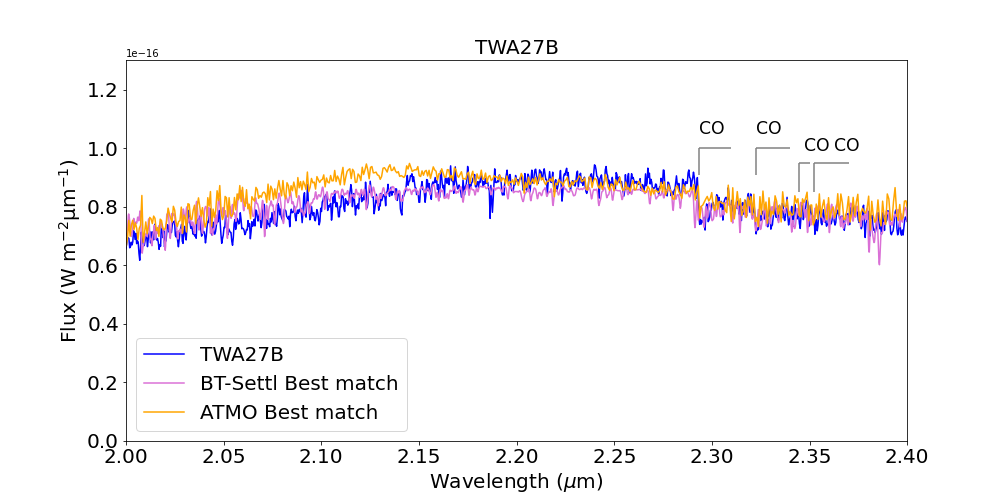
In the top panel of Fig. 3 we show the spectra of TWA 28, TWA 27A, and TWA 27B in the wavelength range between 2.0–2.39 m. In TWA 28 and TWA 27A, the most prominent absorption lines are the Na I lines at 2.206 and 2.208 m. No emission lines are detected for any of the targets in this wavelength range. Finally, we detect prominent CO-bands in TWA 28 and TWA 27A at 2.293, 2.322, 2.344, and 2.352 m, but also the CO bands at 2.293 and 2.322 m are visible in TWA 27B, although weaker than in the TWA 28 and TWA 27A spectra. This is to expect since TWA 27B is at the start of the L/T transition, where CO transforms in in the equilibrium reaction: , thus CO should start depleting from TWA 27B’s spectrum.
Nevertheless, if observe the comparison by Luhman et al. (2023) of TWA 27B with the spectrum of other young and intermediate age L6-L7 brown dwarfs (see their Fig. 5), namely CWISE J050626.96+073842.4 (Schneider et al. 2023, 23 Myr), PSO J318.5338–22.8603 (Liu et al. 2013, 23 Myr) and VHS 1256b (140 Myr, Dupuy et al. 2023), we notice that the shape of the band is different, in particular between 2.10 and 2.30 m, where the band stars to appear at 2.15 m for L/T transition brown dwarfs (Cushing et al., 2005). In the spectrum of TWA 27B, no hints of the appearance of the band are seen.
5.1.5 2.90–5.27 m wavelength range
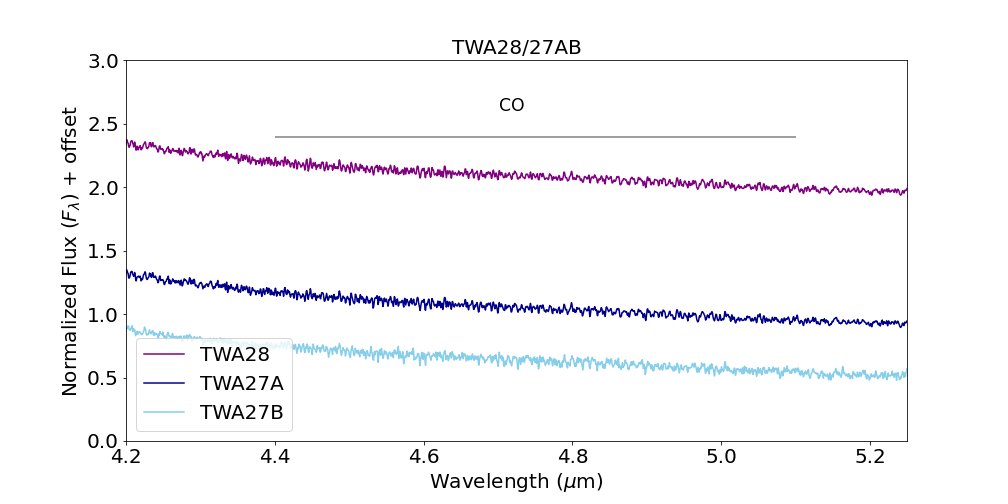
In Fig. 3 we show the spectra of TWA 28 (purple), TWA 27A (dark blue), and TWA 27B (light blue) in the wavelength range between 2.9–5.27 m. In this wavelength range, there are no deep atomic lines to highlight, but we do find a band from 2.5 to 3.1 m, and a CO-band from 4.4–5.1 m. Similarly as in the 2.00-2.39 m range, since TWA 27B is a L6 brown dwarf, we would expect to detect between 2.8 and 3.8 m as for VHS 1256b, and PSO-318, but this molecule is not present in TWA 27B spectrum as discussed in Luhman et al. (2023). Similarly, the CO molecule for this object is weaker than for VHS 1256b, as also noted in Luhman et al. (2023). Miles et al. (2023) also noticed that VHS 1256b has weaker between 2.8 and 3.8 m than field brown dwarfs. The fact that both the CO and band are weaker in TWA 27B might be due to its lower surface gravity, as certainly some CO weakening has been observed at 2.4 m for other young brown dwarfs (Bonnefoy et al., 2014; Manjavacas et al., 2014). Alternatively, Miles et al. (2023) suggests that non-equilibrium chemistry would also explain the weakening of the band, although that should also strengthen the CO feature (Mukherjee et al., 2022).
5.2 Emission Lines & Circumstellar Disks
Since our targets have been found to be accretors in previous works (Venuti et al., 2019), we searched for existing emission lines present in the NIRSpec spectrum further supporting this evidence. For TWA 27B, Luhman et al. (2023) showed the detection of emission of the , , and maybe lines, and the He I triplet at 1.083 m, which are typical accretion signatures of young stars (Natta et al., 2004). Luhman et al. (2023) and Marleau et al. (2024) measured the accretion luminosity using the Pa line luminosity to derive an accretion rate of = , which correlates with the accretion rates of young stars and brown dwarfs derived by Muzerolle et al. (2005) when extrapolating to the mass of TWA 27B. The weak accretion rate implies that formation is likely over (Marleau et al., 2024).
The presence of emission lines is not that evident for TWA 28 and TWA 27A in the NIRSpec spectra (see Fig. 2), even though both objects have been found to be accretors in previous works (Venuti et al., 2019; Ricci et al., 2017). The VLT/X-shooter spectra of TWA 28 and TWA 27A published by Venuti et al. (2019) also do not show emission lines in the near-infrared, but they do show emission lines in the ultraviolet and optical spectra, which allowed Venuti et al. (2019) to estimate their accretion rate. They estimated an accretion rate estimated for TWA 28 of , and for TWA 27A. The NIRSpec spectra of TWA 27A and TWA 28 show near-infrared color excess from 3 m to 5.27 m supporting the existence of a disk as reported previously (Schneider et al., 2012; Venuti et al., 2019; Luhman et al., 2023). This color excess will be evident in Section 6 when we compare with atmospheric models.
5.3 Spectral Indices
We use the surface gravity spectral indices presented by Allers & Liu (2013) to confirm the low surface gravity expected for TWA 28 and TWA 27A and b, given their membership to the TWA Hya association (10 Myr, Gizis 2002, Mamajek 2005, Weinberger et al. 2013). Allers & Liu (2013) spectral indices were designed to measure the depth of different spectral characteristics in the near-infrared spectra of M5–L7 brown dwarfs that reflect their surface gravities. Using brown dwarfs with well-determined ages from 2 Myr to 1 Gyr, they provided a range of values for each of their indices and spectral types that would determine the surface gravity category of brown dwarfs (see their Table 9). Those three categories are field (FLD-G, gravity score 0, log = 5.0-5.5), intermediate-gravity (INT-G, gravity score 1, log = 4.0-4.5), and very-low gravity (VL-G, gravity score 2, log 4.0).
We calculated the , , , , and -cont spectral indices presented in Allers & Liu (2013). The specific wavelength ranges that each of these indices span, and how the final index values are obtained are shown in Table 4 and Equation 1 in Allers & Liu (2013). The is correlated with surface gravity (McGovern et al., 2004), the index measures the pseudo equivalent widths of the K I doublet in the -band at 1.250 m. The VO band at 1.058 m disappears with the increment of surface gravity (Lodders, 2002). The -cont index measures the shape of the -band, which has been found to become more triangular with low surface gravity (Bowler et al., 2012). Lodieu et al. (2017) identified the -cont index as the most sensitive to surface gravity. In Fig. 4, we compared the values of these indices for TWA 28, TWA 27A and TWA 27B with those measured for other M4-L6 low-mass stars and brown dwarfs with some indication of age: young moving groups (YMG), (low surface gravity, log 4.0) and dwarfs (intermediate surface gravity, log = 4.0-4.5)(Allers et al., 2007; Bonnefoy et al., 2014), young companions (Allers et al., 2007), and field brown dwarfs (McLean et al., 2003; Cushing et al., 2005) with spectral types between M4 and L8. We also compared with members of different open clusters and associations, from Martín et al. (2017), namely: Persei (90 Myr), Upper Scorpious (5–10 Myr), Taurus (2 Myr), and Ophiucus (0.3 Myr). In addition, alkali lines have been identified as surface gravity indicators for brown dwarfs. For young brown dwarfs, the alkali lines have been observed to be weaker than for field brown dwarfs (Steele & Jameson, 1995; Martín et al., 1996; Gorlova et al., 2003; Cushing et al., 2005; Allers et al., 2007; Allers & Liu, 2013; Bonnefoy et al., 2014; Manjavacas et al., 2014). We measured the pseudo equivalent widths of the K I lines at 1.169, 1.177, 1.243 and 1.253 m, and the Na I doublet at 1.138 m (see Fig. 5), using the same wavelength ranges than in Allers & Liu (2013), their Table 7. Similarly, as we did with the spectral indices, we compared the values of the pseudo-equivalent widths with those of other brown dwarfs of different surface gravities from the literature. In Table 2 we show the value of the pseudo equivalent widths of the alkali lines for TWA 28, TWA 27A and TWA 27B, and in Table 3 we show the gravity scores for the three objects. As expected for the young age of the objects (10 Myr), we obtained that the majority of the gravity indices classified these objects as very-low surface gravity objects (VL-G).
| Name | NIR SpT | K I (1.169 m) | K I (1.177 m) | K I (1.243 m) | K I (1.253 m) | Na I (1.138 m) | GS a,b |
|---|---|---|---|---|---|---|---|
| TWA 28 | M9.0 | 0.150.02 | 0.270.03 | 0.460.02 | 0.160.01 | 0.660.03 | 22-22 / VL-G |
| TWA 27A | M9.0 | 0.160.01 | 0.210.03 | 0.330.02 | 0.160.01 | 0.550.02 | 22-12 / VL-G |
| TWA 27B | L6.0 | 0.140.07 | 0.770.06 | 0.700.08 | 0.270.04 | 0.380.11 | 21-22 / VL-G |
-
•
a: GS: Gravity scores calculated as in Allers & Liu (2013). b: Gravity scores are ordered according to the alkali line that they correspond to. The dash symbol indicates that none gravity score can be determined with that particular line.
| Name | SpT | -cont | G | ||||
|---|---|---|---|---|---|---|---|
| TWA 28 | M9.0 | 1.0390.001 | 1.0360.001 | 1.0240.001 | 1.0120.002 | 1.1020.002 | 2221 –/ VL-G |
| TWA 27A | M9.0 | 1.0300.001 | 1.0380.001 | 1.0240.002 | 1.0110.001 | 1.1000.002 | 2222 – / VL-G |
| TWA 27B | L6.0 | 1.0340.001 | 1.0430.001 | 1.0730.006 | 1.0680.001 | 1.0620.002 | 2–2– – / VL-G |
-
•
a: GS: Gravity scores calculated as in Allers & Liu (2013)


| Name | NIR SpT | Paschen | Paschen | Paschen | Paschen | He I |
| TWA 27B | L6.0 | -0.3500.028 | -0.4250.026 | -0.5040.047 | -0.7450.084 | -0.2960.099 |
6 Comparison with Atmospheric Models
We compare the spectra of TWA 28, TWA 27A and TWA 27B at its original resolution (R2700) to different set of atmospheric models to derive their effective temperatures, surface gravities, and other atmospheric properties like the radius and mass of the objects. For this purpose we use two types of models, the BT-Settl models (Allard et al., 2012), which include cloud implementation (Allard et al., 2003, 2012), and with the ATMO cloudless models (Tremblin et al., 2015, 2017). We used the software species111https://species.readthedocs.io/en/latest/index.html (Stolker et al., 2020) to fit the BT-Settl models to our NIRSpec spectra. We fit only the 0.97–2.40 m, since the three objects have circumstellar disks, which affect mostly the SED from 2.40 m to 5.30 m.
For the BT-Settl models (Allard et al., 2012) the cloud model is implemented in the PHOENIX atmosphere code (Allard et al., 2001). All relevant molecular absorbers are treated with line-by-line opacities in direct opacity sampling as in Allard et al. (2003). The BT-Settl models include disequilibrium chemistry for CO, , , , and . We use the most updated version of the BT-Settl models which are based on the CIFIST photospheric solar abundances (Caffau et al., 2011) to compare to TWA 28 and TWA 27A, and the previous version of the BT-Settl models to compare to TWA 27B, since it showed a better match with its spectrum.
The cloudless ATMO models (Tremblin et al., 2015, 2017) propose that fingering convection is responsible for this turbulent mixing and leads to the out-of-equilibrium abundances in the atmospheres of brown dwarfs. Fingering convection can be triggered in the atmospheres of brown dwarfs because of the gradient of mean molecular weight induced by the chemical transitions CO/ and at chemical equilibrium (Tremblin et al., 2017). Fingering convention reduces the temperature gradient reproducing the reddening of the spectra of young brown dwarfs (Tremblin et al., 2017).
In this Section, we compare the atmospheric parameters derived using both models for TWA 28 and TWA 27A and TWA 27B at a resolution of R2700. We use the software species to find the best matching synthetic spectra generated using the BT-Settl models. The toolkit species is designed to analyze spectral and photometric data of planetary and substellar atmospheres. It uses a Monte Carlo algorithm to sample the parameter space called PyMultiNest222http://johannesbuchner.github.io/PyMultiNest/index.html with 2000 live points. The toolkit species also derives the radius (R, in ), and mass (M, in ) using the trigonometric parallax provided (, mas), and the and log of the best matching synthetic spectrum. We derived the radius of the targets by using the dilution factor , which takes into account the flux dilution between the synthetic spectra generated at the outer boundary of the atmosphere and the flux-calibrated spectrum. R is the brown dwarf radius and d is the distance, calculated using the parallax. The mass is derived using the estimated surface gravity with the model (log g) using the expression: , where G is the gravitational constant, from which M can be obtained.
We double-check all the best matches obtained with species by matching the atmospheric grids to the spectra using a fitting method. Both methods provided consistent best matches for the three objects.
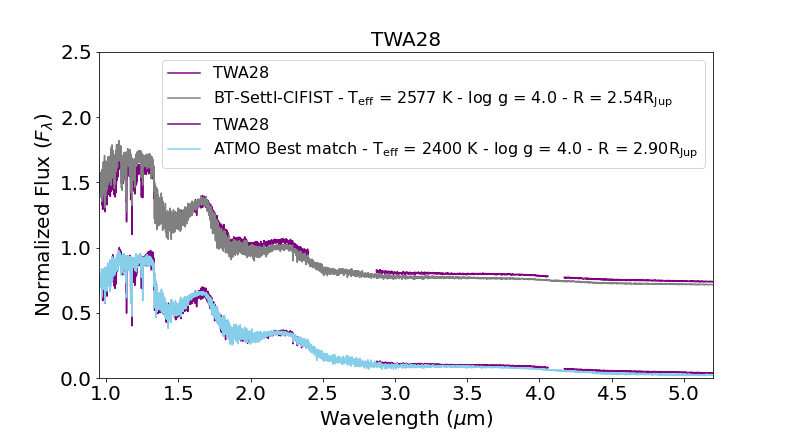
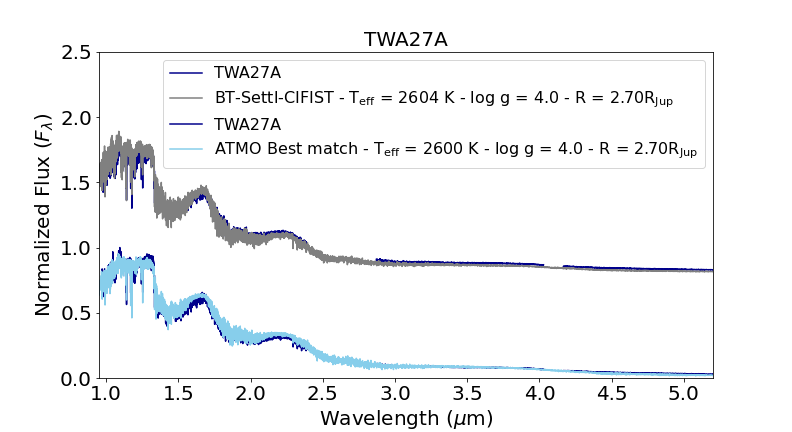
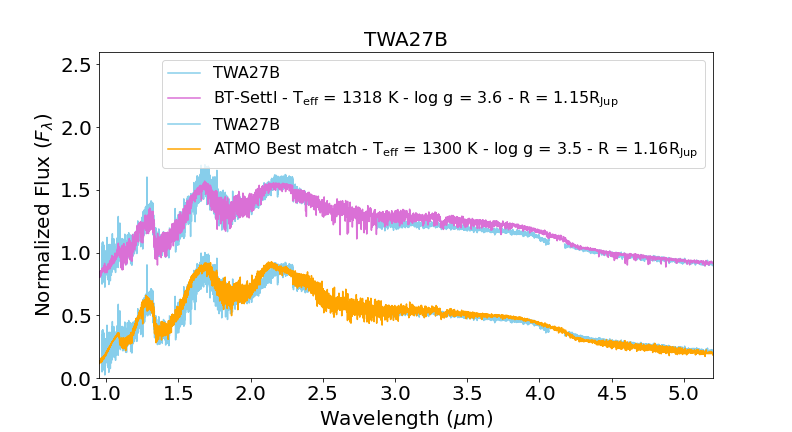
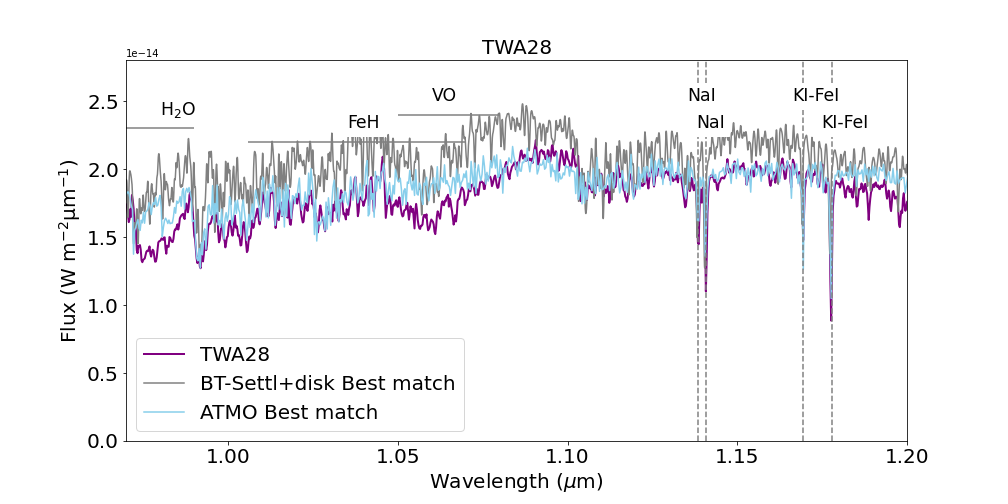
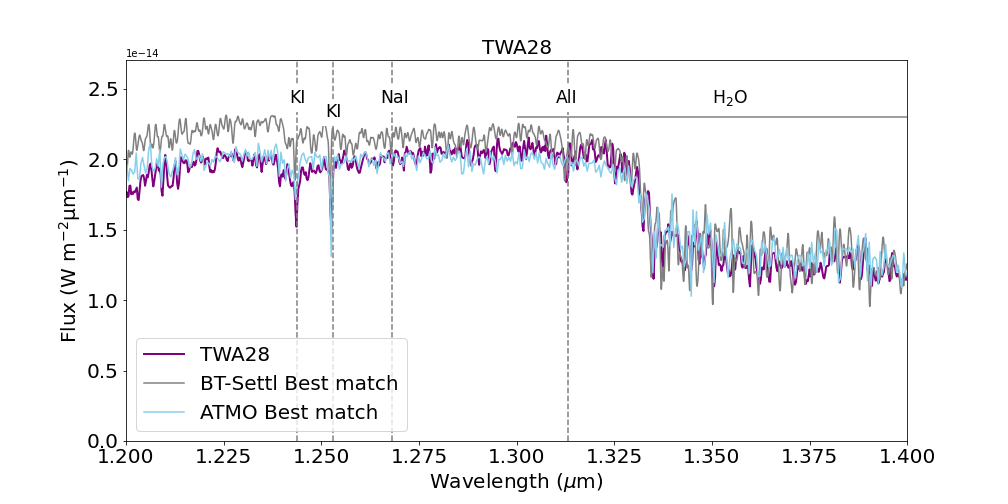
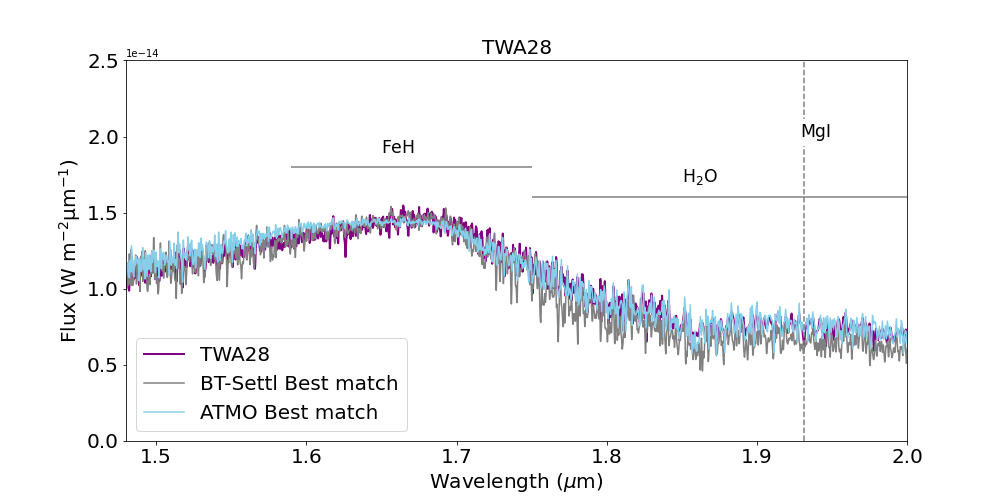
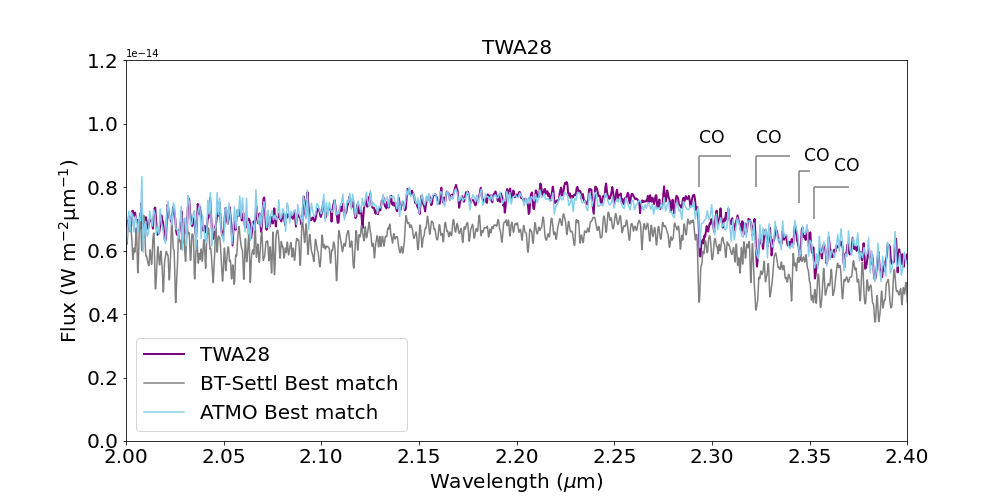
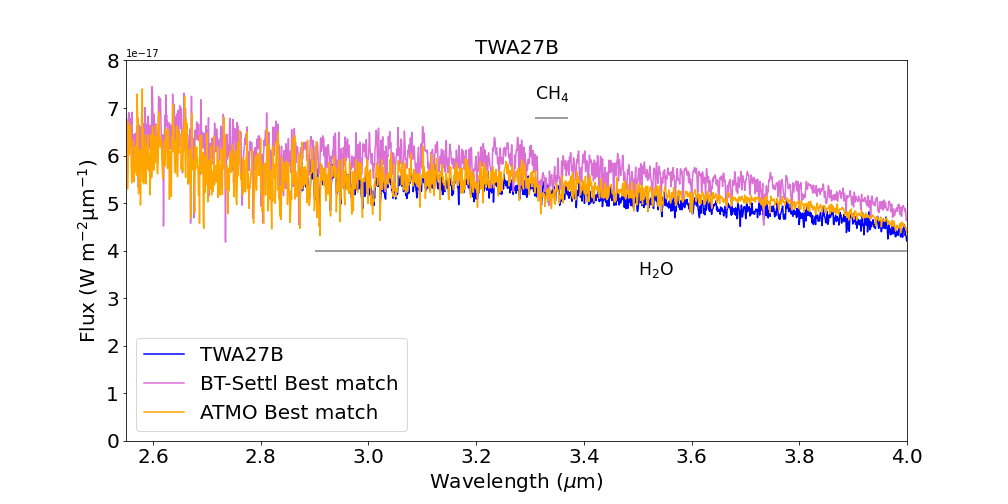
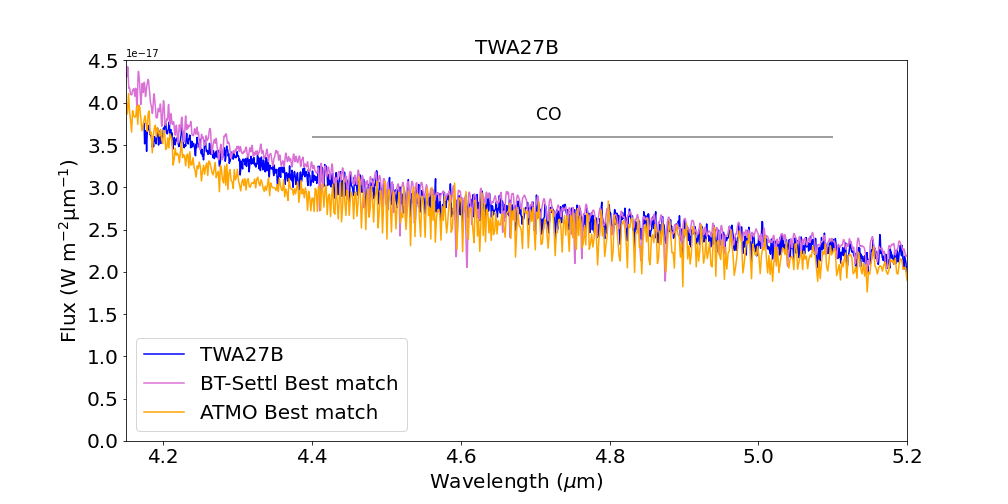
We will describe the divergences between both models and the spectra in the overall SED (see Figure 6), and also in the individual wavelength ranges which will allow us to describe in more detail smaller discrepancies. This comparison can be found in Figures 7 through 12. Note that the uncertainties derived from PyMultiNest are just statistical and derived from the propagation of the small error bars of our data through the Bayesian inversion, thus, the uncertainties of the derived parameters are likely underestimated. More conservative uncertainties for the effective temperature are 100 K, and 0.5 in log g, since that is the resolution of the grid. We derived the uncertainties in Table 5 using those uncertainties. Due to the uncertainty in log g, because of the width of the grid, the uncertainties in the mass might be likely overestimated.
6.1 TWA 28 Model Comparison
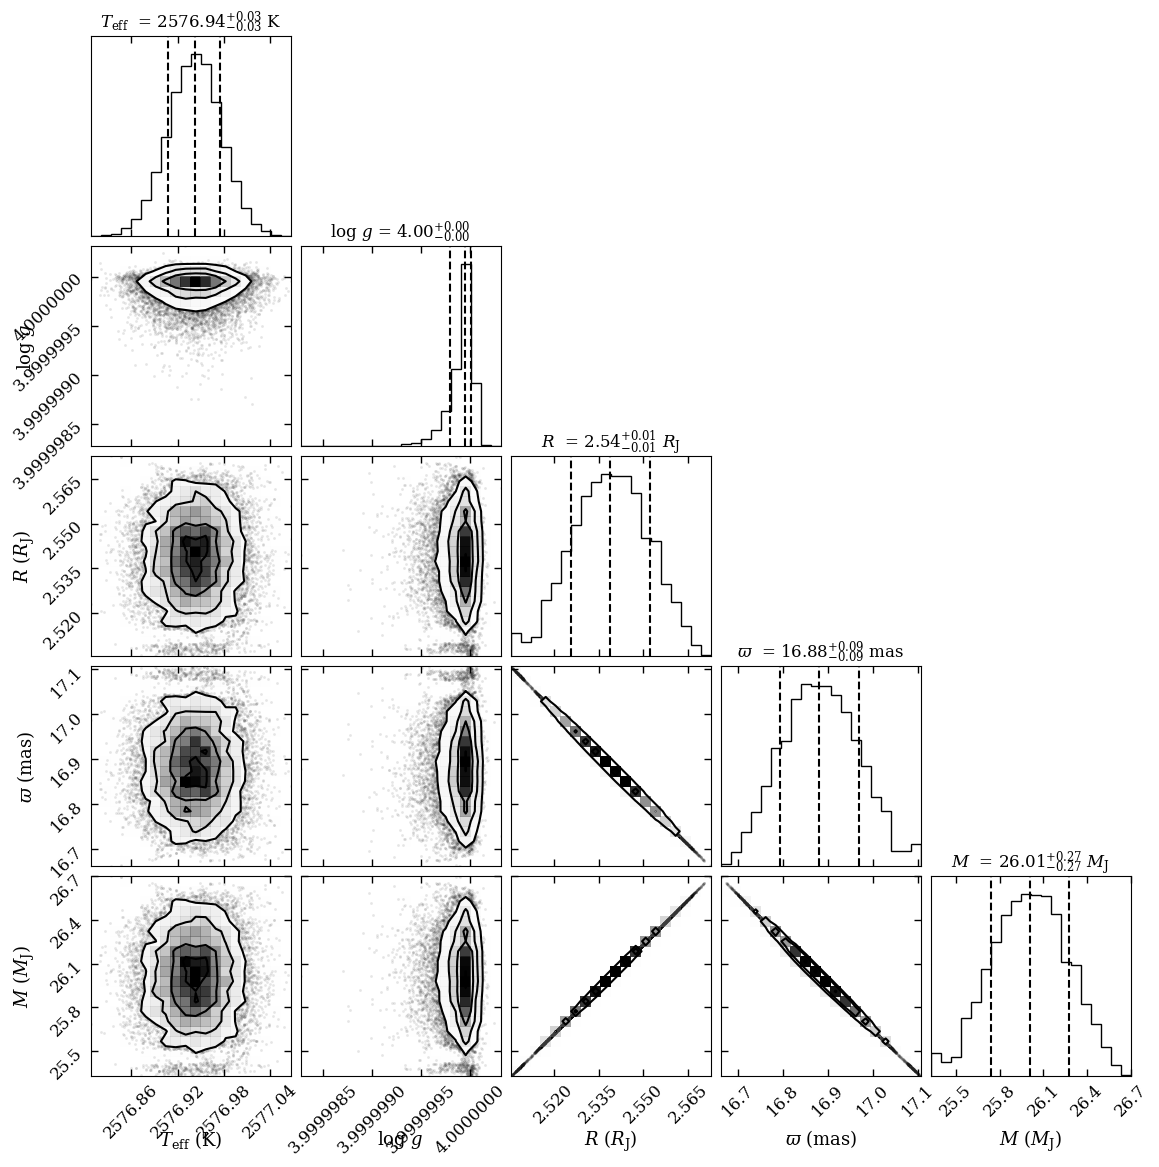
Using species, we find the best match to the TWA 28 JWST/NIRSpec spectrum using the BT-Settl CIFIST atmospheric models. The spectrum of TWA 28 is best reproduced using a model with effective temperature () of 2577 K, a surface gravity (log g) of 4.0, a radii (R) of 2.54 , and a mass for TWA 28 of 26.0 . In the Appendix, we also show the best-fit parameters derived by species in Figure 14.
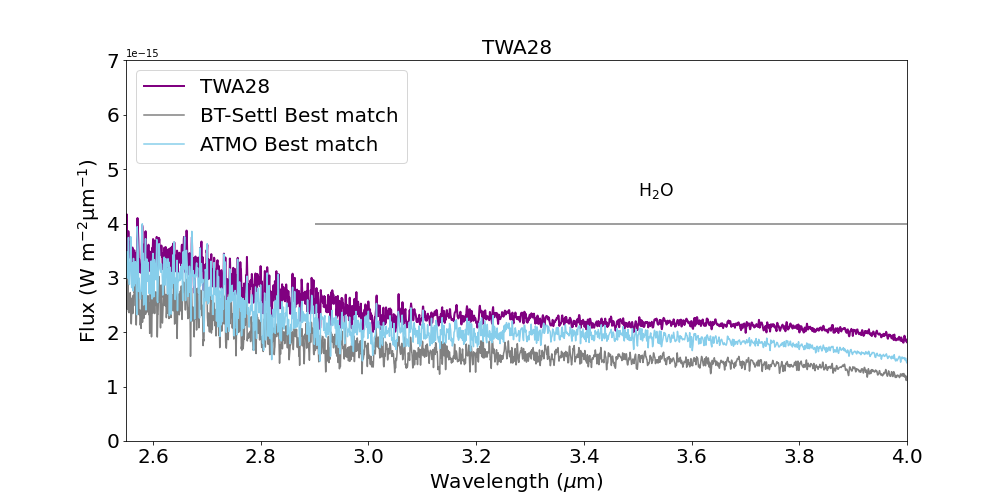
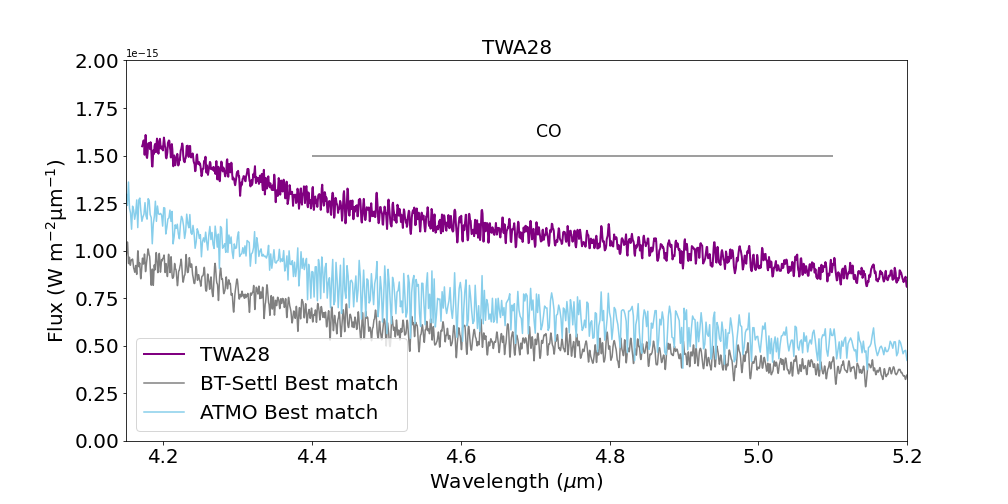
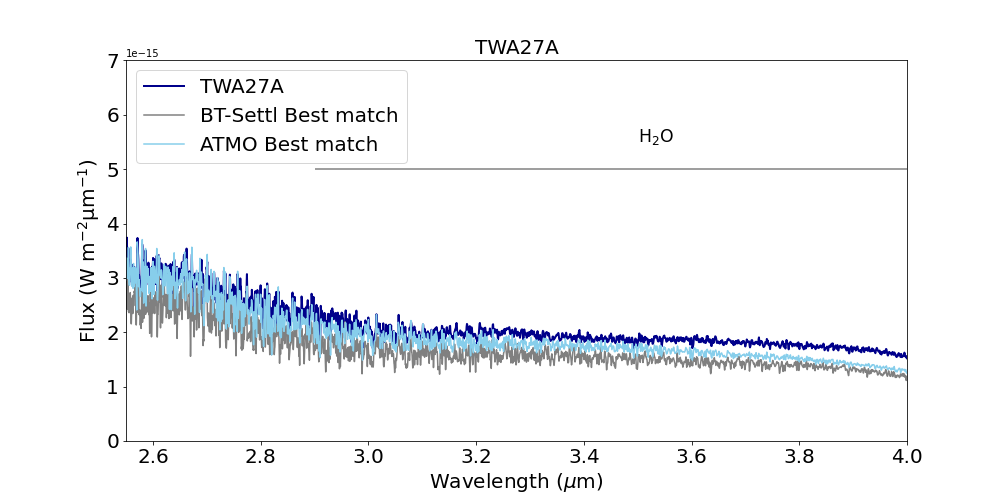
In the overall SED, the BT-Settl CIFIST models over-predict the flux in the 0.97–1.30 m wavelength range, but under-predict the flux in the 2.00–2.50 m range. After 2.5 m, the contribution to the Spectral Energy Distribution (SED) of TWA 28 starts to be affected by the contribution of the circumstellar disk, thus, the underpredicted flux observed on the redder part of the spectrum is to be expected (see Fig. 6).
The ATMO models provide a colder effective temperature of = 2400 K, but similar log g=4.0 and a sligher bigger radius of R = 0.3 or 2.90 , and a mass of 32.4 . The ATMO models provide a satisfactory fit to the 0.97–2.40 m wavelength range (see Fig. 6). Since no circumstellar disk is included in the fit, from 2.5 m on the fit starts to diverge as expected. A summary of the fundamental physical parameters derived for TWA 28 are summarized in Table 5.
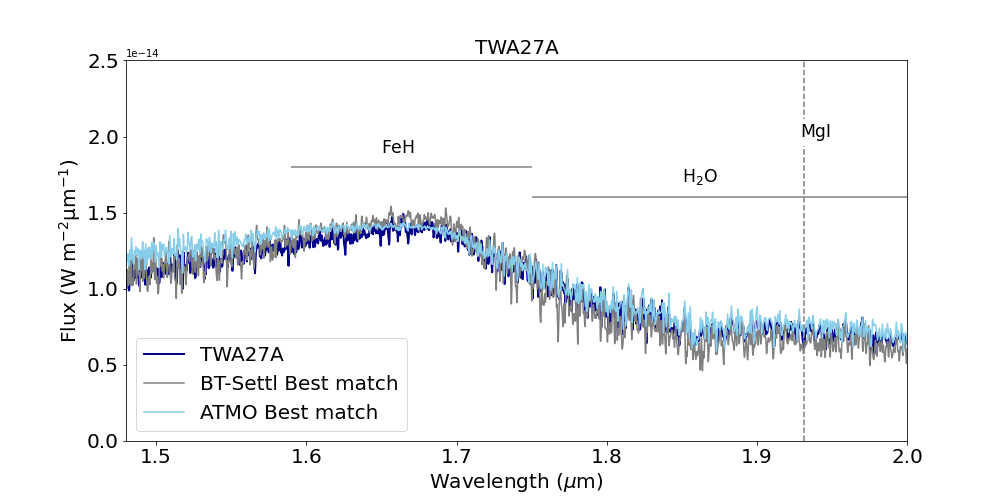
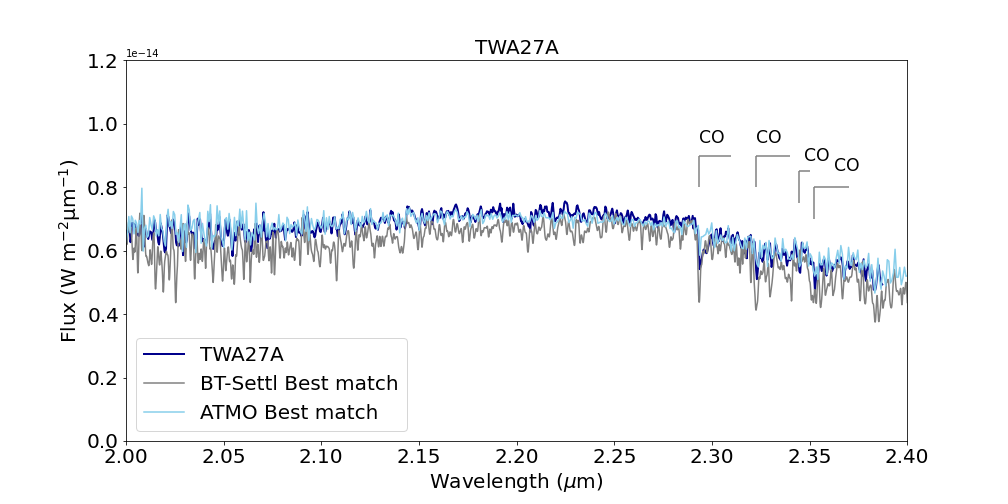
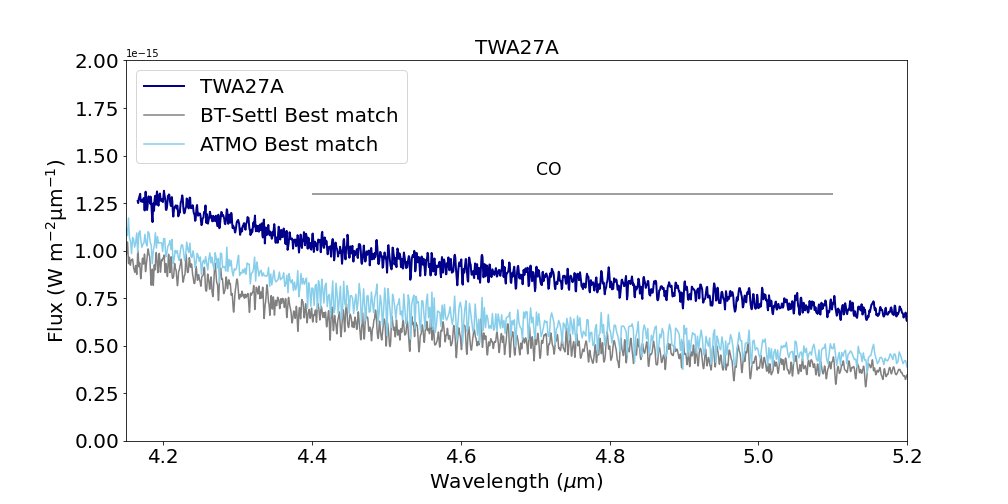
Comparing the individual wavelength ranges as shown in Fig. 7 and 8, we notice few characteristics that the models do not fully reproduce: in the 0.97-1.20 m range, neither of the models satisfactorily reproduce the water band at 0.98 m or the FeH or VO bands at 1.04 and 1.06 m, respectively. The Na I and K I alkali lines are not as deep in the models as in the NIRSpec spectrum. In the 1.20 to 1.40 m range, the K I alkali line at 1.243 m is too weak, while the K I line at 1.253 m is too strong in comparison with the NIRSpec spectrum. The wavelength range between 1.48 and 2.0 m is well reproduced by the BT-Settl CIFIST model, while the ATMO model over-predicts the flux in the 1.48-1.65 m region, not reproducing accurately the typical triangular shape of this band for young brown dwarfs. In the 2.00-2.40 m region, the BT-Settl CIFIST model does not reproduce exactly the CO bands between 2.30-2.40 m. In the 4.0-5.2 m region, we notice that the ATMO models predict deeper CO bands in comparison to the CO bands observed in the NIRSpec spectrum, and the prediction of the BT-Settl CIFIST models.
6.2 TWA 27A Model Comparison
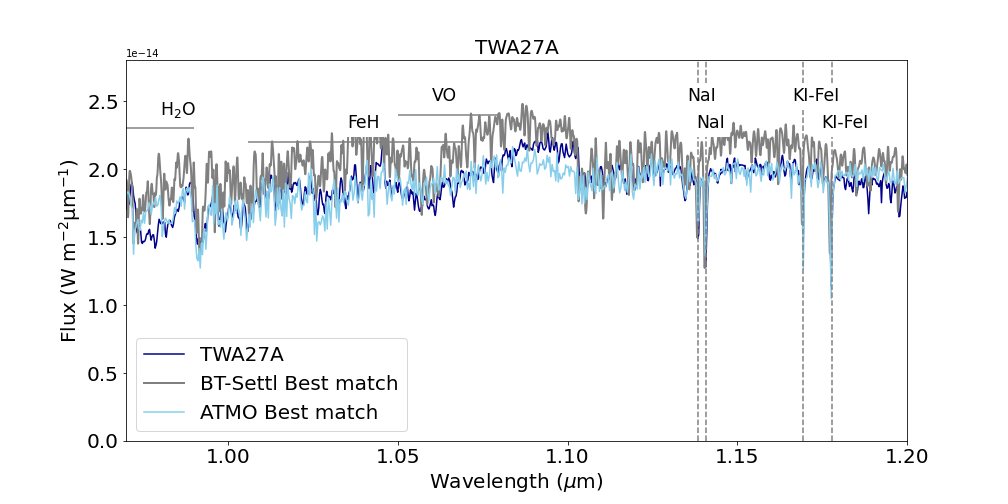
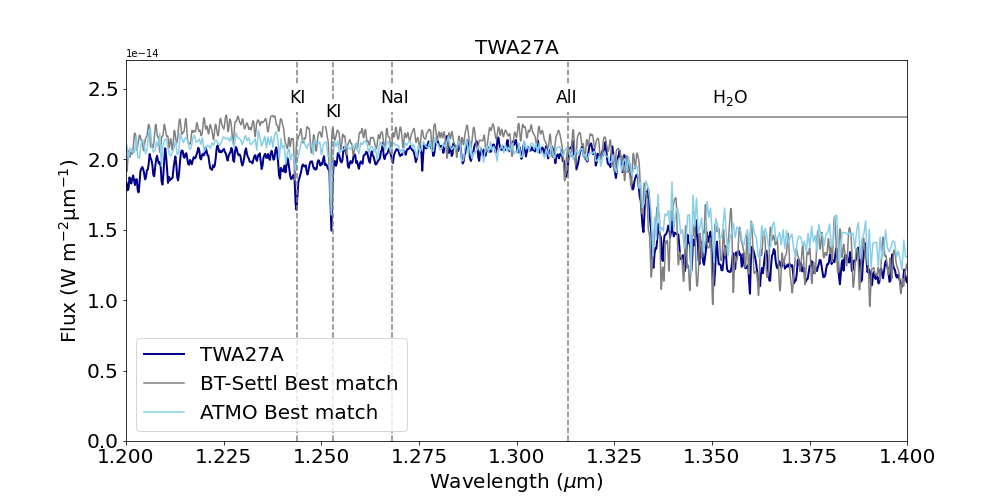
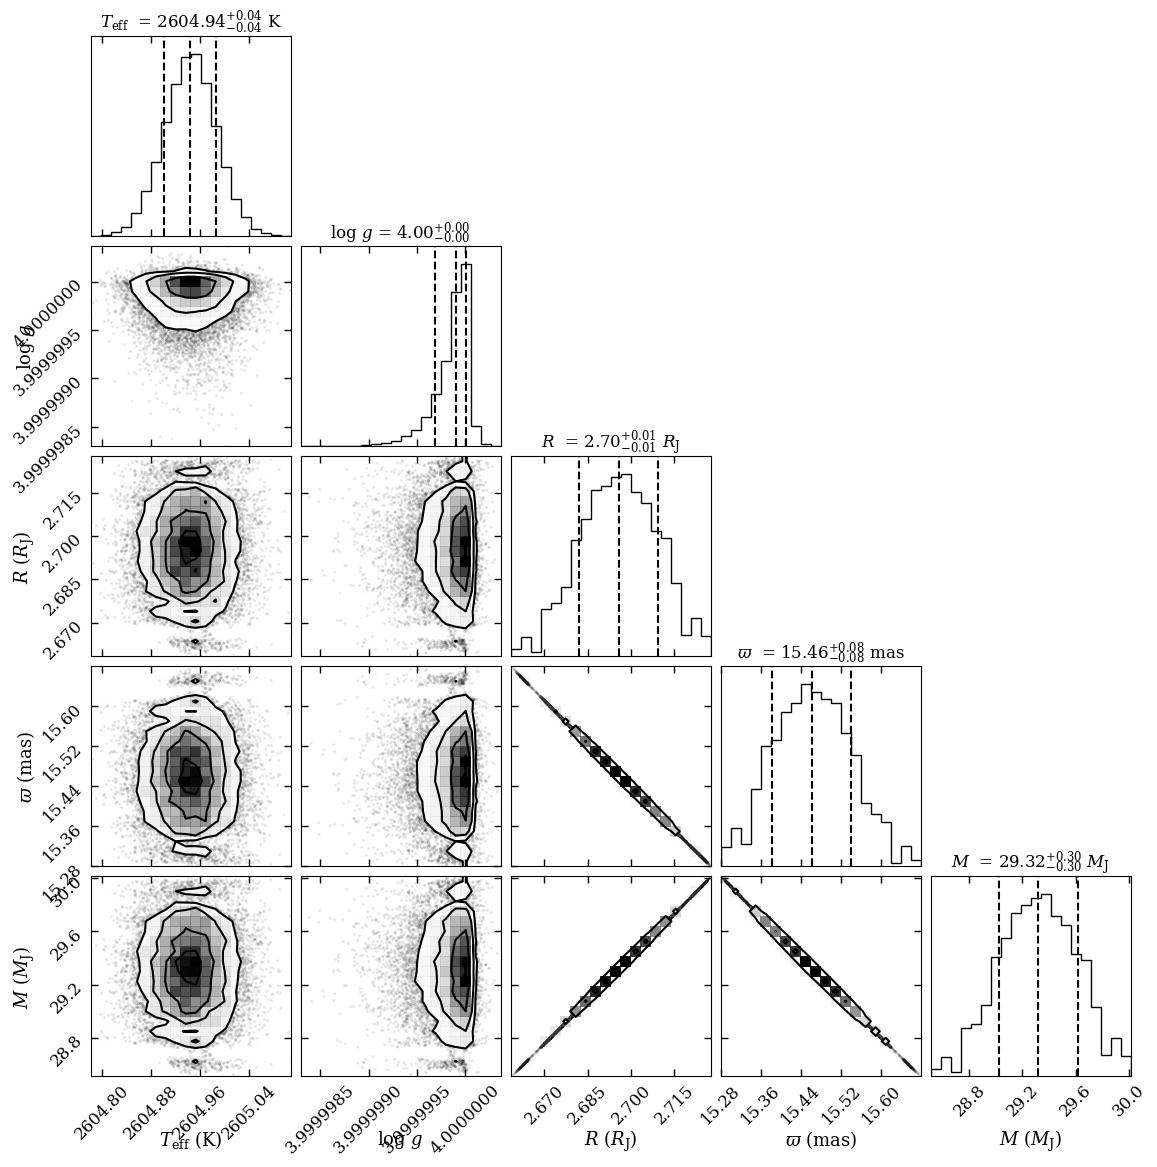
Similarly as for TWA 28, we use species to find the best match to the JWST/NIRSpec TWA 27A spectra using the BT-Settl CIFIST atmospheric models. We obtained an effective temperature of = 2605 K, a log g = 4.0, a radius of R = 2.70 and a mass of 29.3 . The BT-Settl CIFIST models over-predict the flux in the 0.97–1.30 m wavelength range, and under-predicts the flux in the 2.00–2.40 m. (see Fig. 6). Similarly to TWA 28, since no circumstellar disk is included in the fit, from 2.50 m on the fit starts to diverge (see Fig. 6. In the Appendix, we also show the best-fit parameters derived by species in Figure 15.
The ATMO models provide a similar effective temperature of = 2600 K, similar log g = 4.0 and a sligher bigger radius of R = 0.285 or 2.70 , and a mass of 28.1 . The ATMO models provide a satisfactory fit in the 0.97–2.40 m wavelength range, but does no reproduce the triangular shape of the 1.50-1.70 m wavelength range, characteristic of young brown dwarfs. Similarly to TWA 28, no circumstellar disk is included in the fit, and from 2.50 m on the fit starts to diverge (see Fig. 6). A summary of the fundamental physical parameters derived for TWA 27A are summarized in Table 5.
Comparing how the individual wavelength ranges are reproduced by both models (see Fig. 9 and 10) we notice that the BT-Settl CIFIST and ATMO models do not reproduce the depths for the Na I and K I alkali lines. In the 1.20-1.40 m range, the ATMO models over-predict the flux in the water band region between 1.33 and 1.4 m. As for TWA 28, the triangular shape of the 1.48-1.68 m region is not well-reproduced. The flux between 2.0 and 2.40 m is under-estimated by the BT-Settl CIFIST model, and beyond the 2.40 m, the SED is not well reproduced by the models due to the contribution of the disk as expected. In the 4.0-5.2 m region, we notice that the ATMO models predict deeper CO bands in comparison to the CO bands observed in the NIRSpec spectrum, and the prediction of the BT-Settl CIFIST models.
6.3 TWA 27B Model Comparison
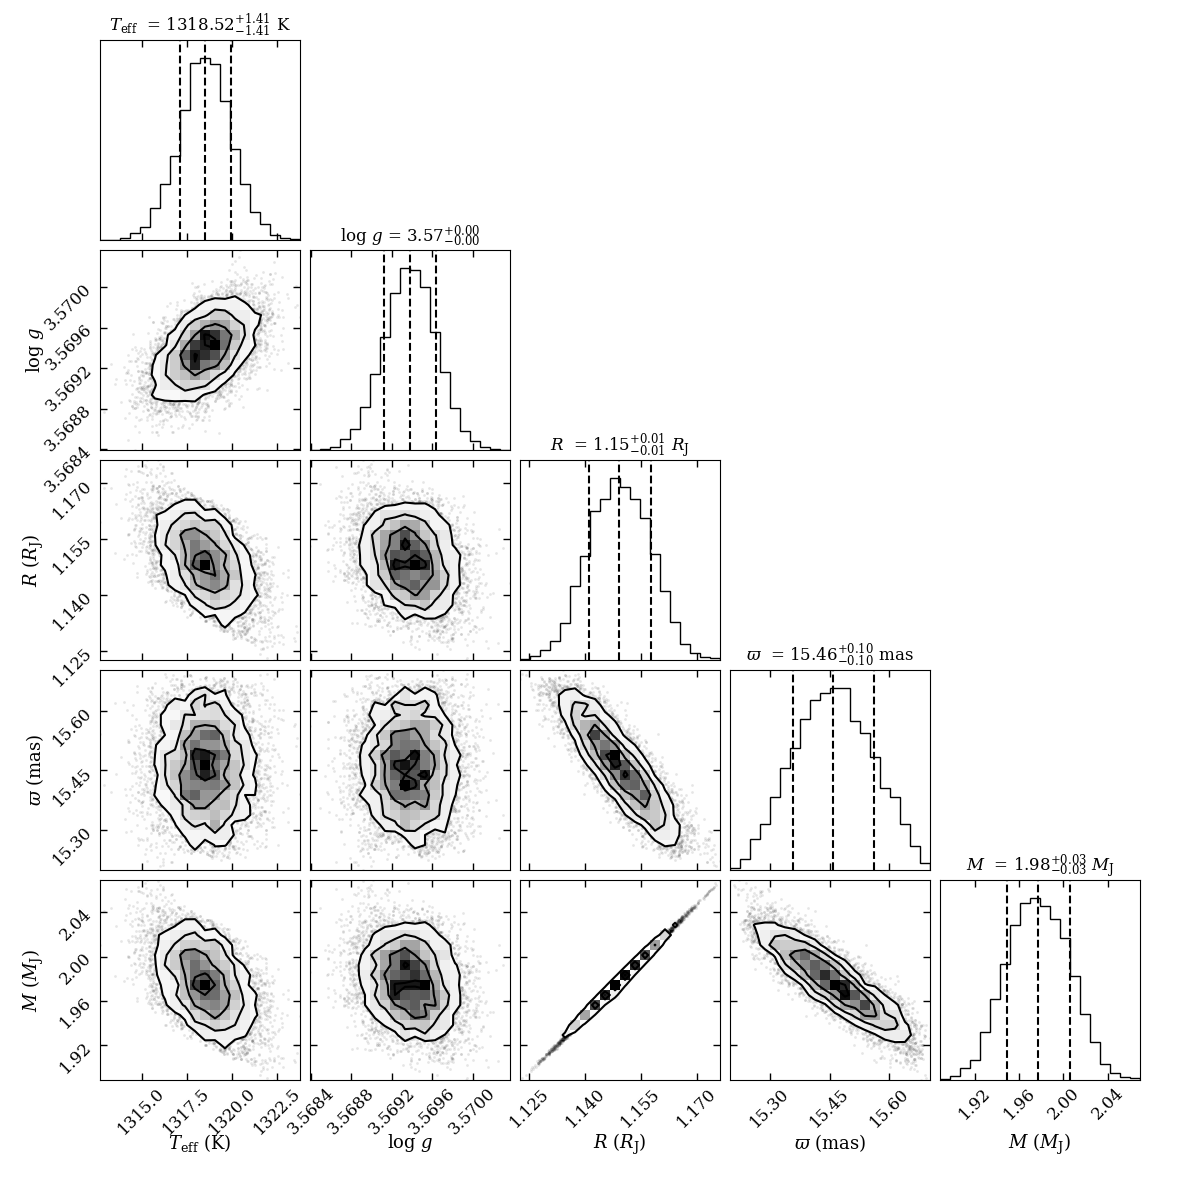
In the case of TWA 27B JWST/NIRSpec spectrum, we obtained the best match using the BT-Settl models to a = 1318 K, and log g = 3.6 model. The predicted radius for the object is R = 1.15 , which is likely under-estimated for the young age of TWA 27B. The predicted mass for the object is 1.98 , which is also under-estimated, if we compare it to other mass estimates from the literature (52 , e.g. Chauvin et al. 2005).
Luhman et al. (2023) compared the JWST/NIRSpec spectrum of TWA 27B to the ATMO models finding a =1300 K, log g = 3.5, = 1.03 (effective adiabatic index), = (diffusion coefficient), and [M/H] = 0.2 (metallicity), with a solar value of C/O. The model predicted a radius of 0.12 or 1.16 , and a mass of 1.6 , also under-estimated compared with the values reported in the literature. The predicted and log g are similar to the predicted by the BT-Settl models. The best matches are shown in Fig. 6. A summary of the fundamental physical parameters derived for TWA 27B are summarized in Table 5.
The spectrum of TWA 27B is noisier than the spectrum of TWA 28 and TWA 27A, thus, some spectral lines are not resolved, nonetheless, we can still compare how well both models reproduce the different molecular bands, and the shapes of the different wavelength ranges. In the range between 0.97 and 1.20 m, the ATMO model does not reproduce the range between 0.97 and 1.08 m, since none of the molecular bands are shown in the modeled spectrum, i.e. the water band at 0.98 m, the FeH band at 1.04 m and the VO band at 1.06 m. In the 1.20-1.40 m, the ATMO model over-predicts the flux between 1.225 and 1.275 m. Similarly as for TWA 28 and TWA 27A, ATMO does not properly reproduce the triangular shape of the spectrum between 1.50 and 1.7 m, and the continuum between 2.00 and 2.15 m. From 2.50 m, the BT-Settl model over-predicts the flux of TWA 27B. In the 2.58-4.00 m range, both models predict a band at 3.35 m, which is not observed for TWA 27B, in contrast with other older sources of similar spectral type, like VHS 1256b Miles et al. (2023), CWISE J050626.96+073842.4, and PSO J318.5338–287–22.860, as mentioned in Luhman et al. (2023). As for TWA 28 and TWA 27A, in the 4.0-5.2 m region, we also notice that the ATMO models predict deeper CO bands in comparison to the CO bands observed in the NIRSpec spectrum, and the prediction of the BT-Settl models.
| Name | (ATMO) | (BT) | log gb(ATMO) | log gb(BT) | R () (ATMO) | R ()(BT) | M () (ATMO) | M () (BT) |
|---|---|---|---|---|---|---|---|---|
| TWA 28 | 2400 K | 2577 K | 4.0 | 4.0 | 2.900.24 | 2.550.19 | ||
| TWA 27A | 2600 K | 2605 K | 4.0 | 4.0 | 2.700.21 | 2.700.20 | ||
| TWA 27B | 1318 K | 1300 K | 3.5 | 3.6 | 1.160.18 | 1.150.15 |
-
•
a: The uncertainty in = 100 K for both models. b: The uncertainty in log g is 0.5 for both models.
7 Discussion
7.1 Comparison between TWA 28 and TWA 27A
In this Section, we directly compare the properties of TWA 28 and TWA 27A. TWA 28 and TWA 27A have similar spectral types and surface gravities, nevertheless, in the analysis performed in this work, we did find several differences between them. TWA 27A was classified as a M8.0, and TWA 28 was classified as an M9.0 by Allers & Liu (2013) using R120 IRTF/SpeX spectra. In contrast, Venuti et al. (2019) classified both of them as M9.0 using VLT/XShooter UVB/VIS/NIR spectra (0.3-2.46 m), with a resolution R3200-5000. We adopted the latter spectral classification here since it is based on a broader wavelength range spectrum.
In Section 5, we described all the spectral atomic lines and molecular bands found in the spectra of the three objects. For TWA 28 and TWA 27A, we find in general the same wealth of spectral features, nevertheless, when measuring the equivalent widths of the most prominent ones, we did notice some differences. We measured the equivalent width of the K I and Na I alkali lines for all objects (Section 5.3), noticing that the equivalent width of the K I lines are not consistent for the K I line at 1.177 m (0.270.03 m for TWA 28 vs 0.210.03 m for TWA 27A) and at 1.243 m (0.460.02 m for TWA 28 vs 0.330.02 m for TWA 27A), and the equivalent width of the Na I line at 1.138 m is also not consistent (0.660.03 m for TWA 28 vs 0.550.03 m for TWA 27A) (see Table 2). Similarly, when we compared the gravity scores of both objects (see Table 3), we observed that the score that measures the is also not consistent (1.0390.001 m for TWA 28 vs 1.0300.001 m for TWA 27A). One of the possible explanations for the differences between these lines might be veiling, however no veiling was reported by Venuti et al. (2019) for TWA 28 and TWA 27A.
Both TWA 28 and TWA 27A are known accretors with an accretion mass of log = -12.24 and log = -11.35, respectively (Venuti et al., 2019), but no significant emission lines indicating disk accretion are present in their NIRSpec spectra, like for example the Pa- line at 1.094 m.
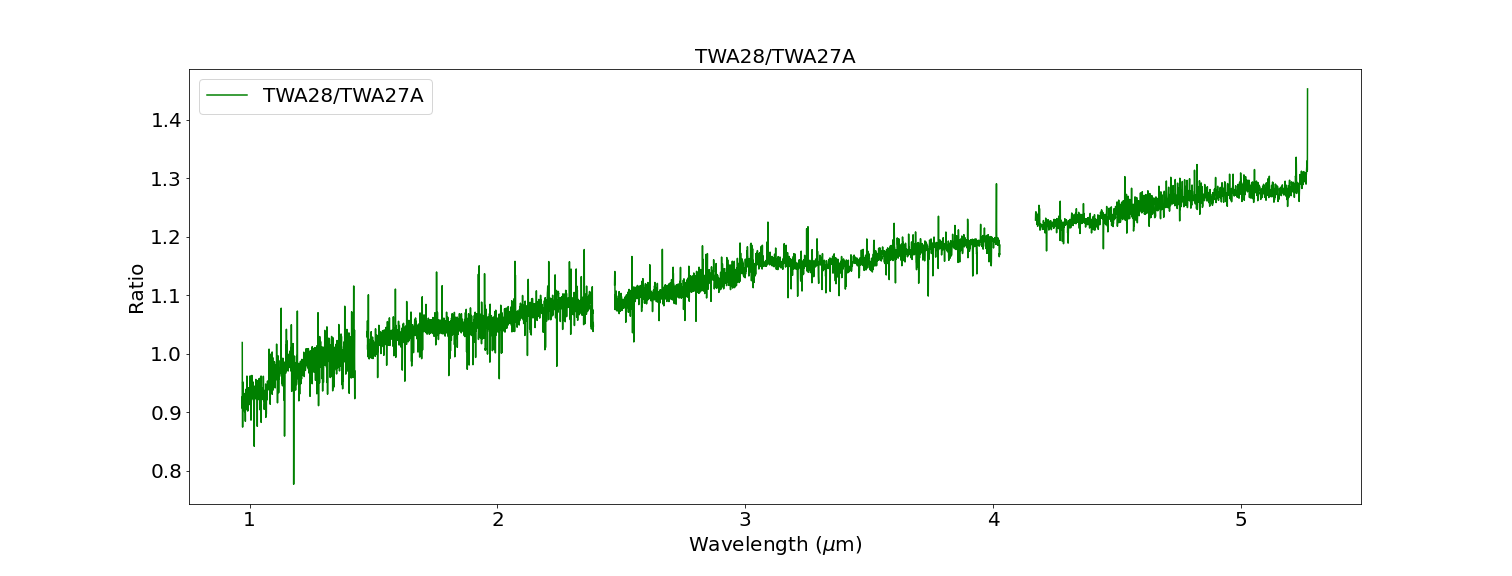
Ricci et al. (2017) used ALMA imaging to determine the size of the disk of TWA 27A and TWA 27B, and determined that the disk of TWA 27A is very compact, with a maximum radius of 10 au, with a mass of 0.1 , which is significantly less massive than other brown dwarfs disks ( = 2–6 , Ricci et al. 2012; Testi et al. 2016). Ricci et al. (2017) suggested that the small mass of TWA 27A’s disk could be naturally explained by the tidal truncation of the outer disk due to the gravity of TWA 27B. Although Lodato et al. (2005) suggested that TWA 27B might have formed in situ via gravitational fragmentation, both TWA 27A and TWA 27B follow the scaling relation between dust mass and stellar/substellar mass found for more massive brown dwarfs and pre-main sequence stars (i.e. Pascucci et al. 2016), suggesting that both objects might have formed from independent protostellar cores. The mass of the disk of TWA 28 and its extent has not been reported in the literature. In Fig. 13 we compare the spectra of both objects, and we provide the ratio of TWA 28 versus TWA 27A. TWA 28 shows more near-infrared excess from 2.00 m than TWA 27A, indicating that probably the TWA 28’s disk is more massive than TWA 27A’s disk.
In summary, even though TWA 28 and TWA 27A were expected to have very similar general properties, i.e. similar spectral type, surface gravity, and of course age, there are few differences, namely: the different equivalent widths for the K I lines at 1.177 m (0.270.03 m for TWA 28 vs 0.210.03 m for TWA 27A) and at 1.243 m (0.460.02 m for TWA 28 vs 0.330.02 m for TWA 27A), and for the Na I line at 1.138 m (0.660.03 m for TWA 28 vs 0.550.02 m for TWA 27A), and different gravity score (1.0390.001 m for TWA 28 vs 1.0300.001 m for TWA 27A). Slightly different accretion rates as measured by Venuti et al. (2019), and different infrared excess, probably due to the compact disk found in TWA 27A. Ricci et al. (2017) argues that the compact disk found in TWA 27A is likely due to the tidal truncation of TWA 27B.

7.2 Comparison with previous results
We compared the we obtained with the BT-Settl and ATMO models with the results obtained by Venuti et al. (2019) using the ROTFIT code (Frasca et al., 2017) for TWA 28 using optical and near-infrared X-shooter spectra. The ROTFIT code simultanteouly finds the spectral type and of the target searching into a library of standard spectra.
The reported by Venuti et al. (2019) ( = 2660 K) is closer to the reported by the BT-Settl models ( = 2577 K), while the log g we obtained (log g = 4.1) is consistent with Venuti et al. (2019). Sgro & Song (2021) also derived the fitting the optical, near-infrared and mid-infrared photometry of TWA 28 with an SED and a disk emission, finding a = 2360 K, a temperature of the disk’s dust of 290 K, and a radius of 0.048 au (or 100 ). The BT-Settl CIFIST models predict a mass for TWA 28 of 26.01 relatively close with the mass estimated by Venuti et al. (2019) of 20.92.
Similarly, for TWA 27A, we compared the we obtained with the BT-Settl CIFIST and ATMO models with the results obtained by Venuti et al. (2019) using the ROTFIT code (Frasca et al., 2017), and the they report is consistent with both temperatures derived with BT-Settl CIFIST and ATMO ( = 2640 K), while the log g they report is slightly smaller than the reported by both models (log g = 3.75). As for TWA 28, Sgro & Song (2021) derived the fitting the optical, near-infrared and mid-infrared photometry of TWA 27A with an SED and a disk emission, finding a = 2550 K, a temperature of the dust of 290 K, and a radius of 0.053 au (or 111 ). For TWA 27A, the BT-Settl CIFIST model predicts a mass of 29.3, higher than the 19.9 estimated by Venuti et al. (2019).
For TWA 27B, Allers & Liu (2013) provided a spectral type of L5 using Spex/IRTF spectrum of R120, in which no emission lines could be identified, unlike in the NIRSpec spectrum published in Luhman et al. (2023). Since TWA 27B is faint and only 0.”77 from its primary, constraints on the presence of a disk could not be made until Luhman et al. (2023) published the JWST/NIRSpec spectrum. Previous to this publication, using ALMA (Atacama Large Millimeter Array) Ricci et al. (2017) derived a 3 upper limit of 0.013 (1 ) on the mass of dust surrounding TWA 27B.
If we compare the estimated mass for TWA 27B with the estimation by Luhman et al. (2023) using evolutionary models (0.005 or 5.2 ). The latest is consistent with the mass measured by previous studies (Chauvin et al., 2005; Bowler, 2016). Thus, the BT-Settl CIFIST provides an underestimation of its mass (1.98). Finally, using also evolutionary models, Luhman et al. (2023) reported a of 1200 K which is lower than the temperature derived from both BT-Settl and ATMO models (1300 K).
Both ATMO and BT-Settl models predict the existence of band between 2.8 and 3.8 m (Luhman et al., 2023). For other young L6.0-L7.0 dwarfs, like for CWISE J050626.96+073842.4, PSO J318.5338–22.860 and VHS 1256b, this band is actually detected, but not in TWA 27B’s spectrum. This might be an indication of the L/T transition starting at later spectral types for very young brown dwarfs due to its low surface gravity. Further observations of other very young brown dwarfs in the 1.0-5.3 m wavelength range are needed for confirmation.
Finally, as for TWA 28 and TWA 27A, in the 4.0-5.2 m region, we also notice that the ATMO models predict deeper CO bands in comparison to the CO bands observed in the NIRSpec spectrum, and the prediction of the BT-Settl models. Luhman et al. (2023) already observed the weakness of the CO band at 4.8 m in the TWA 27B spectrum with respect to the ATMO model. Luhman et al. (2023) discussed that the inclusion of clouds in the model might weaken the band at 3.35 m and the CO band at 4.8 m. However, the BT-Settl cloudy models still predict the existence of the band at 3.35 m. The lack of bands in the spectrum of TWA 27B might suggest that the L/T transition of very young (10 Myr) brown dwarfs start at later spectral types than for older brown dwarfs. Further observations of other very young brown dwarfs in the 1.0-5.3 m wavelength range are needed for confirmation.
TWA 27B shows photometric variability with HST/WFC3 (Zhou et al., 2016) by with an amplitude detected a variability amplitude in the 1.36% in the F125W and 0.78% in the F160W filters, respectively, with a period of 10.7 hr, suggesting the existence of heterogeneous clouds in the atmosphere of TWA 27B. No rotational modulations have been reported for TWA 28 and TWA 27A potentially indicating the existence of clouds, but since both show signs of magnetic activity due to the presence of H- in their optical spectra (Venuti et al., 2019), it would be challenging to disentangle if the cause of the rotational modulations would be due to clouds or magnetic activity.
8 Conclusions
We present the 0.97–5.27 m JWST/NIRSpec medium-resolution spectra of TWA 28, TWA 27A and TWA 27B obtained as a part of the guaranteed time observation program 1270 (PI: S. Birkmann). In the following we summarize our main results:
-
1.
We identified the majority of the atomic lines present in the 0.97–5.27 m spectra for TWA 28, TWA 27A and TWA 27B. The most prominent atomic lines detected are the K I alkali lines at 1.169, 1.177, 1.243, and 1.253 m, and the Na I line at 1.138 m. We detected less prominent lines like the Fe I at 1.180 m, the Al I at 1.313 m, and the Mg I at 1.931 m, among others.
-
2.
We identified the majority of the molecular bands present in the 0.97–5.27 m spectra for TWA 28, TWA 27A and TWA 27B. The most prominent bands are water bands at 1.40, 1.85, and 2.80 m, the CO bands between 1.29 and 2.40 m, and the CO band at 4.8 m.
-
3.
We also detected emission lines indicative of accretion processes in TWA 27B (Paschen , , ), and He I in TWA 27B. Luhman et al. (2023) and Marleau et al. (2024) derived an accretion rate of = , which correlates with the expected accretion rate extrapolating the mass of TWA 27B. The weak accretion rate implies that formation is likely over (Marleau et al., 2024). TWA 28 and TWA 27A do not show significant emission lines in their NIRSpec spectra, but they are known accretors Venuti et al. (2019). TWA 28 and TWA 27A show near-infrared excess from 2.5 m on, supporting the existence of a cicumstellar disk around them as reported by Venuti et al. (2019).
-
4.
We measured the gravity scores as presented in Allers & Liu (2013) using the K I and Na I alkali lines, and some bands, like the FeH, the -band and the VO band. We concluded that all scores point to all three objects to have very low surface gravity, as expected for 10 Myr objects, such TWA 28, TWA 27A and TWA 27B.
-
5.
We compared the three objects to the cloudless ATMO and cloudy BT-Settl or BT-Settl CIFIST atmospheric models. We concluded that both models provide similar effective temperatures and surface gravities for TWA 27A and TWA 27B. For TWA 28, the BT-Settl CIFIST models find a 200 K warmer effective temperature than ATMO.
-
6.
The BT-Settl CIFIST models predict a mass for TWA 28 of 26.0 close the mass estimated by Venuti et al. (2019) of 20.9 . For TWA 27A, the BT-Settl CIFIST model predicts a mass of 29.3 , higher than the 19.9 estimated by Venuti et al. (2019). For TWA 27B, the BT-Settl models under-predict its mass (1.98 ), which has been estimated to be by previous works (Luhman et al., 2023; Chauvin et al., 2005; Bowler, 2016).
-
7.
The ATMO models overpredict the CO bands at 4.8 m for all three objects. Adding clouds to the model might decrease the depth of these bands, and might provide a more accurate estimation of those. The cloudly BT-Settl models provide a more accurate prediction of the depth of the band.
-
8.
For TWA 27B, both models predict the existence of bands at 2.15 m and at 3.35 m. Those are not present in the TWA 27B NIRSpec spectrum, but they were found in older, similar spectral type brown dwarfs, like PSO 318 and VHS 1256b (Luhman et al., 2023). The lack of bands in the spectrum of TWA 27B might suggest that the L/T transition of very young (10 Myr) brown dwarfs start at later spectral types than for older brown dwarfs. Further observations of other very young brown dwarfs in the 1.0-5.3 m wavelength range are needed for confirmation.
References
- Allard et al. (2001) Allard, F., Hauschildt, P. H., Alexander, D. R., Tamanai, A., & Schweitzer, A. 2001, ApJ, 556, 357, doi: 10.1086/321547
- Allard et al. (2012) Allard, F., Homeier, D., & Freytag, B. 2012, Royal Society of London Philosophical Transactions Series A, 370, 2765, doi: 10.1098/rsta.2011.0269
- Allard et al. (2003) Allard, N. F., Allard, F., Hauschildt, P. H., Kielkopf, J. F., & Machin, L. 2003, A&A, 411, L473, doi: 10.1051/0004-6361:20031299
- Allers & Liu (2007) Allers, K. N., & Liu, M. C. 2007, in Bulletin of the American Astronomical Society, Vol. 39, American Astronomical Society Meeting Abstracts, 103.15
- Allers & Liu (2013) Allers, K. N., & Liu, M. C. 2013, ApJ, 772, 79, doi: 10.1088/0004-637X/772/2/79
- Allers et al. (2007) Allers, K. N., Jaffe, D. T., Luhman, K. L., et al. 2007, ApJ, 657, 511, doi: 10.1086/510845
- Astropy Collaboration et al. (2013) Astropy Collaboration, Robitaille, T. P., Tollerud, E. J., et al. 2013, A&A, 558, A33, doi: 10.1051/0004-6361/201322068
- Astropy Collaboration et al. (2018) Astropy Collaboration, Price-Whelan, A. M., Sipőcz, B. M., et al. 2018, AJ, 156, 123, doi: 10.3847/1538-3881/aabc4f
- Astropy Collaboration et al. (2022) Astropy Collaboration, Price-Whelan, A. M., Lim, P. L., et al. 2022, ApJ, 935, 167, doi: 10.3847/1538-4357/ac7c74
- Baraffe et al. (2002) Baraffe, I., Chabrier, G., Allard, F., & Hauschildt, P. H. 2002, A&A, 382, 563, doi: 10.1051/0004-6361:20011638
- Barrado Y Navascués (2006) Barrado Y Navascués, D. 2006, A&A, 459, 511, doi: 10.1051/0004-6361:20065717
- Böker et al. (2022) Böker, T., Arribas, S., Lützgendorf, N., et al. 2022, A&A, 661, A82, doi: 10.1051/0004-6361/202142589
- Bonnefoy et al. (2014) Bonnefoy, M., Chauvin, G., Lagrange, A.-M., et al. 2014, A&A, 562, A127, doi: 10.1051/0004-6361/201118270
- Bowler (2016) Bowler, B. P. 2016, PASP, 128, 102001, doi: 10.1088/1538-3873/128/968/102001
- Bowler et al. (2012) Bowler, B. P., Liu, M. C., Shkolnik, E. L., et al. 2012, ApJ, 753, 142, doi: 10.1088/0004-637X/753/2/142
- Burrows et al. (2001) Burrows, A., Hubbard, W. B., Lunine, J. I., & Liebert, J. 2001, Reviews of Modern Physics, 73, 719, doi: 10.1103/RevModPhys.73.719
- Caffau et al. (2011) Caffau, E., Ludwig, H. G., Steffen, M., Freytag, B., & Bonifacio, P. 2011, Sol. Phys., 268, 255, doi: 10.1007/s11207-010-9541-4
- Chauvin et al. (2005) Chauvin, G., Lagrange, A. M., Dumas, C., et al. 2005, A&A, 438, L25, doi: 10.1051/0004-6361:200500116
- Cushing et al. (2005) Cushing, M. C., Rayner, J. T., & Vacca, W. D. 2005, ApJ, 623, 1115, doi: 10.1086/428040
- Ducourant et al. (2008) Ducourant, C., Teixeira, R., Chauvin, G., et al. 2008, A&A, 477, L1, doi: 10.1051/0004-6361:20078886
- Dupuy et al. (2023) Dupuy, T. J., Liu, M. C., Evans, E. L., et al. 2023, MNRAS, 519, 1688, doi: 10.1093/mnras/stac3557
- Faherty et al. (2016) Faherty, J. K., Riedel, A. R., Cruz, K. L., et al. 2016, ApJS, 225, 10, doi: 10.3847/0067-0049/225/1/10
- Frasca et al. (2017) Frasca, A., Biazzo, K., Alcalá, J. M., et al. 2017, A&A, 602, A33, doi: 10.1051/0004-6361/201630108
- Gaia Collaboration (2020) Gaia Collaboration. 2020, VizieR Online Data Catalog, I/350, doi: 10.26093/cds/vizier.1350
- Gardner et al. (2023) Gardner, J. P., Mather, J. C., Abbott, R., et al. 2023, arXiv e-prints, arXiv:2304.04869, doi: 10.48550/arXiv.2304.04869
- Gizis (2002) Gizis, J. E. 2002, ApJ, 575, 484, doi: 10.1086/341259
- Gorlova et al. (2003) Gorlova, N. I., Meyer, M. R., Rieke, G. H., & Liebert, J. 2003, ApJ, 593, 1074, doi: 10.1086/376730
- Jakobsen et al. (2022) Jakobsen, P., Ferruit, P., Alves de Oliveira, C., et al. 2022, A&A, 661, A80, doi: 10.1051/0004-6361/202142663
- Liu et al. (2013) Liu, M. C., Magnier, E. A., Deacon, N. R., et al. 2013, ApJ, 777, L20, doi: 10.1088/2041-8205/777/2/L20
- Lodato et al. (2005) Lodato, G., Delgado-Donate, E., & Clarke, C. J. 2005, MNRAS, 364, L91, doi: 10.1111/j.1745-3933.2005.00112.x
- Lodders (2002) Lodders, K. 2002, ApJ, 577, 974, doi: 10.1086/342241
- Lodieu et al. (2017) Lodieu, N., Zapatero Osorio, M. R., Bejar, V. J. S., & Pena Ramirez, K. 2017, ArXiv e-prints. https://arxiv.org/abs/1709.02139
- Luhman (2023) Luhman, K. L. 2023, AJ, 165, 269, doi: 10.3847/1538-3881/accf19
- Luhman et al. (2023) Luhman, K. L., Tremblin, P., Birkmann, S. M., et al. 2023, ApJ, 949, L36, doi: 10.3847/2041-8213/acd635
- Mamajek (2005) Mamajek, E. E. 2005, ApJ, 634, 1385, doi: 10.1086/468181
- Manjavacas et al. (2020) Manjavacas, E., Lodieu, N., Béjar, V. J. S., et al. 2020, MNRAS, 491, 5925, doi: 10.1093/mnras/stz3441
- Manjavacas et al. (2014) Manjavacas, E., Bonnefoy, M., Schlieder, J. E., et al. 2014, A&A, 564, A55, doi: 10.1051/0004-6361/201323016
- Manjavacas et al. (2019) Manjavacas, E., Apai, D., Zhou, Y., et al. 2019, AJ, 157, 101, doi: 10.3847/1538-3881/aaf88f
- Marleau et al. (2024) Marleau, G.-D., Aoyama, Y., Hashimoto, J., & Zhou, Y. 2024, arXiv e-prints, arXiv:2401.04763, doi: 10.48550/arXiv.2401.04763
- Martín et al. (2017) Martín, E. C., Mace, G. N., McLean, I. S., et al. 2017, ApJ, 838, 73, doi: 10.3847/1538-4357/aa6338
- Martín et al. (1996) Martín, E. L., Rebolo, R., & Zapatero-Osorio, M. R. 1996, ApJ, 469, 706, doi: 10.1086/177817
- McGovern et al. (2004) McGovern, M. R., Kirkpatrick, J. D., McLean, I. S., et al. 2004, ApJ, 600, 1020, doi: 10.1086/379849
- McLean et al. (2003) McLean, I. S., McGovern, M. R., Burgasser, A. J., et al. 2003, ApJ, 596, 561, doi: 10.1086/377636
- Miles et al. (2023) Miles, B. E., Biller, B. A., Patapis, P., et al. 2023, ApJ, 946, L6, doi: 10.3847/2041-8213/acb04a
- Mukherjee et al. (2022) Mukherjee, S., Fortney, J. J., Batalha, N. E., et al. 2022, ApJ, 938, 107, doi: 10.3847/1538-4357/ac8dfb
- Muzerolle et al. (2005) Muzerolle, J., Luhman, K. L., Briceño, C., Hartmann, L., & Calvet, N. 2005, ApJ, 625, 906, doi: 10.1086/429483
- Natta et al. (2004) Natta, A., Testi, L., Muzerolle, J., et al. 2004, A&A, 424, 603, doi: 10.1051/0004-6361:20040356
- Öberg et al. (2011) Öberg, K. I., Murray-Clay, R., & Bergin, E. A. 2011, ApJ, 743, L16, doi: 10.1088/2041-8205/743/1/L16
- Pascucci et al. (2016) Pascucci, I., Testi, L., Herczeg, G. J., et al. 2016, ApJ, 831, 125, doi: 10.3847/0004-637X/831/2/125
- Ricci et al. (2012) Ricci, L., Testi, L., Natta, A., Scholz, A., & de Gregorio-Monsalvo, I. 2012, ApJ, 761, L20, doi: 10.1088/2041-8205/761/2/L20
- Ricci et al. (2017) Ricci, L., Cazzoletti, P., Czekala, I., et al. 2017, AJ, 154, 24, doi: 10.3847/1538-3881/aa78a0
- Schneider et al. (2012) Schneider, A., Melis, C., & Song, I. 2012, ApJ, 754, 39, doi: 10.1088/0004-637X/754/1/39
- Schneider et al. (2023) Schneider, A. C., Burgasser, A. J., Bruursema, J., et al. 2023, ApJ, 943, L16, doi: 10.3847/2041-8213/acb0cd
- Sgro & Song (2021) Sgro, L. A., & Song, I. 2021, MNRAS, 508, 3084, doi: 10.1093/mnras/stab2400
- Steele & Jameson (1995) Steele, I. A., & Jameson, R. F. 1995, MNRAS, 272, 630, doi: 10.1093/mnras/272.3.630
- Stolker et al. (2020) Stolker, T., Quanz, S. P., Todorov, K. O., et al. 2020, A&A, 635, A182, doi: 10.1051/0004-6361/201937159
- Testi et al. (2016) Testi, L., Natta, A., Scholz, A., et al. 2016, A&A, 593, A111, doi: 10.1051/0004-6361/201628623
- Tremblin et al. (2015) Tremblin, P., Amundsen, D. S., Mourier, P., et al. 2015, ApJ, 804, L17, doi: 10.1088/2041-8205/804/1/L17
- Tremblin et al. (2017) Tremblin, P., Chabrier, G., Baraffe, I., et al. 2017, ApJ, 850, 46, doi: 10.3847/1538-4357/aa9214
- Venuti et al. (2019) Venuti, L., Stelzer, B., Alcalá, J. M., et al. 2019, A&A, 632, A46, doi: 10.1051/0004-6361/201935745
- Weinberger et al. (2013) Weinberger, A. J., Anglada-Escudé, G., & Boss, A. P. 2013, ApJ, 762, 118, doi: 10.1088/0004-637X/762/2/118
- Zhou et al. (2016) Zhou, Y., Apai, D., Schneider, G. H., Marley, M. S., & Showman, A. P. 2016, ApJ, 818, 176, doi: 10.3847/0004-637X/818/2/176