Coupling between magnetic and thermodynamic properties in Rh2Si2 ( = Dy, Ho)
Abstract
Single crystals of DyRh2Si2 and HoRh2Si2 were investigated by thermal expansion and magnetostriction. The different types of magnetic order can clearly be seen in these measurements, particularly the canting of the moments away from the crystallographic direction below about 12 K and the spin-flip for magnetic field applied along the direction. For HoRh2Si2, an additional transition just below is analyzed by means of the Grüneisen ratio and is likely caused by a change of the magnetic structure. Our results nicely corroborate findings from other magnetic and thermodynamic measurements on these materials and provide further evidence suggesting the formation of magnetic domains.
I Introduction
Materials crystallizing in the ThCr2Si2-type structure (space group ) exhibit a variety of interesting physical phenomena [1] including superconductivity [2, 3, 4]. More specifically, the discovery of superconductivity in some rare-earth compounds of this family [5, 6, 7, 8, 9] provided enormous insight into, and propelled, the field of heavy-fermion physics and beyond [8, 10, 11]. In particular, these compounds gave some valuable glue concerning the pivotal impact of magnetism on unconventional superconductivity and quantum criticality [12]. In consequence, it is vital to deepen our insight into the variety of magnetic properties and phenomena of these materials [13].
Even within the rare-earth 122 series the magnetic properties vary widely. Ce- and Yb-based materials often exhibit non-integer valencies of the rare-earth () and are discussed in terms of RKKY interaction (Ruderman-Kittel-Kasuya-Yosida, [14, 15, 16]) mediated via a polarization of the conduction electrons. This interaction can compete with the Kondo effect, an on-site screening of the 4 moments by the conduction electrons [3]. For stable, trivalent like Nd, Gd, Tb, Ho or Er, the RKKY interaction results in local moment antiferromagnetic (AFM) order, often with a simple propagation vector of Q = (001) and ferromagnetic ordering within the plane perpendicular to (001) [17, 18, 19, 20, 21, 22, 23, 24]. In many compounds the local moments align along the crystallographic direction, while for SmRh2Si2, GdRh2Si2 and GdIr2Si2 an orientation in the plane is reported [23, 24, 25] which, in case of GdRh2Si2, can even be temperature dependent [26]. Here it should be noted that in the -based compounds the spin-orbit coupling is generally larger compared to crystal field effects [27]. In addition, anisotropic exchange was discussed for TbRh2Si2 [28]. It should also be noted that -electrons of the transition elements (e.g. Rh, Ru) contribute very little to the total magnetic moment; the value of 0.002 for Rh in DyRh2Si2 is too small to be detected in neutron diffraction [17, 19]. In case of Gd, there can also be a small contribution from Gd 5 electrons, 0.28 in GdRh2Si2 [29].
Exceptions to the above-mentioned magnetic configuration are DyRh2Si2 and HoRh2Si2 where the magnetic moments were found to be canted away from the crystallographic axis by neutron diffraction [17, 19]. For both compounds, the magnetic properties and specific heat measurements were analyzed in terms of a mean field model [30, 31, 32, 33]. Yet, based on magnetic susceptibility and specific heat measurements a so-called component-separated magnetic transition, stemming from multiple interactions, was suggested for HoRh2Si2 [34], in analogy to the tetragonal compound TbCoGa5 [35]. To gain further insight, measurements of thermodynamic properties are called for, in particular such that allow to provide information along different crystallographic directions of the sample. Therefore, we conducted measurements of thermal expansion and magnetostriction on single crystalline DyRh2Si2 and HoRh2Si2. To allow for comparison to data from literature, magnetic susceptibility was also measured on the very same samples.
II Experimental
The single crystals of DyRh2Si2 and HoRh2Si2 used in this study were grown from In flux employing a modified Bridgman technique; details of the growth procedure were provided in Ref. [36]. X-ray diffraction on powdered single crystals was conducted (using copper Kα radiation in a Bruker D8 diffractometer) to confirm the crystallographic structure and quality of the samples. The crystallographic orientation of the single crystals was determined by Laue diffraction. The samples typically grew in a platelet-like shape with the crystallographic direction (the long axis of the tetragonal unit cell) along the thin sample dimension. In most cases, the other sample edges were parallel to the 110 crystallographic directions.
The thermal expansion and magnetostriction measurements were performed using a dilatometer cell as described in Ref. [Küchler et al. [2017], ]. The measurements were conducted in a Physical Property Measurement System (PPMS) by Quantum Design, Inc. with maximum magnetic field of 9 T applied parallel to the sample dilatation direction investigated. Here, special attention was paid to minimize electrical noise []. Whenever possible, identical samples were used for measurements along different crystallographic directions. However, in some cases samples were chosen according to their specific shape in order to optimize the dilatometer signal for the crystallographic direction to be measured and to assist sample mounting. Typical sample dimensions were 1–2 mm in the plane and up to 0.6 mm along the direction. Data of the thermal expansion were taken upon warming the sample (if not stated otherwise) and repeated at least once for comparison. Between cycles of magnetostriction measurements (i.e. measurements at constant temperature) the sample was warmed up to at least 80 K, i.e. into the paramagnetic state well above the Néel temperatures 55 K for DyRh2Si2 and 29 K for HoRh2Si2. We note that different samples gave somewhat different results for the thermal expansion and magnetostriction, particularly in the temperature range around and for small magnetic fields, respectively, as discussed below. The observed temperatures and magnetic fields of the transitions, however, reproduced very well.
Measurements of the magnetic dc susceptibility were conducted in a Magnetic Property Measurement System (MPMS3 by Quantum Design, Inc.) using the same samples as for the thermal expansion and magnetostriction measurements. For these measurements, a magnetic field of 25 Oe (corrected for the remnant field of the superconducting magnet as determined by a Pd reference) was applied. The PPMS, equipped with a calorimeter that utilizes a quasi-adiabatic thermal relaxation technique, was also used for measurements of the heat capacitance. For the investigation of possible first-order transitions, we used a single-slope analysis of the measured heat pulses, as described in Ref. [las03].
III Results
III.1 HoRh2Si2
The results of dc susceptibility measurements for HoRh2Si2 along different crystallographic directions are presented in Fig. 1(a). The Néel temperature of K is clearly observed when measured along the (001) direction. Additional small humps can be recognized upon zoom into the low-temperature data, red data in Fig. 1(b), at 27.3 K and 11.7 K (the latter can also be seen in the -plot, inset of Fig. 1(a)). Along the (100) and (110) direction, peaks sharply at 11.9 K, i.e. at the temperature of the small hump in along (001), while small kinks are seen at . Only upon taking the derivatives d/d, these small kinks separate into two features at 27.3 K and 29.0 K as shown for the (100) direction in Fig. 1(b), blue data and right scale. All -data nicely follow a Curie-Weiss law in the paramagnetic regime as is obvious from plots of in the inset of Fig. 1(a). The fits yield effective moments of which is slightly larger than the expected value of for Ho3+ (where is the Bohr magneton). This may be attributed to the small magnetic field applied during the susceptibility measurements and the resulting impact of the remnant field. The obtained Weiss temperatures are
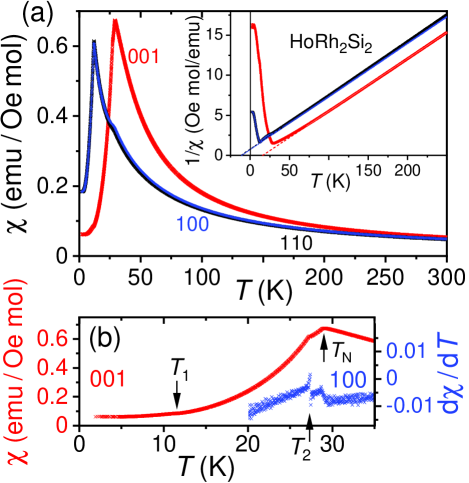
16 K along the direction, indicative of dominating ferromagnetic interactions, and K within the plane (dominating antiferromagnetic interactions). All results are in good agreement with reported ones [17, fel83, jaw02, 34, shi12, 36, usa23] and confirm the magnetic properties as outlined in the introduction. In addition, the observation of two transitions near along all measured directions indicates high sample quality.
The magnetic field () dependence of magnetization measured at K and with applied along different crystallographic directions is presented in Fig. 2. Even for (001) the expected saturation magnetic moment of Ho3+, , is not observed for 9 T. However, the two-step magnetization increase by about 4 per step agrees well with the reported canting of the magnetic moments away from the crystallographic direction by at 4.2 K [17]. The two-step magnetization increase itself is a consequence of the propagation vector and a
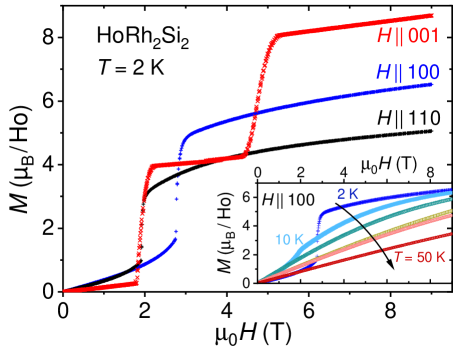
change in magnetic configuration with increasing from an AFM ++ state at 1.8 T to +++, and finally a tilted, field-polarized ++++ state beyond 5 T [17, shi12].
For (100), the basal plane component of the magnetic moments within the different magnetic domains is initially rotated toward the field direction, and then flips to the (100) direction parallel to near 2.8 T. This is suggested by the magnetization value of approximately 4.9 at fields just beyond the flip which is only slightly larger than the expected value for a canting angle of . At 10 K, this canting angle is markedly smaller and hence, a considerably smaller magnetization value is observed beyond the flip (see inset of Fig. 2). For , i.e. without canting, such a flip of the magnetization is neither expected nor observed. The magnetization behaviour for (110) is qualitatively very similar to the observations for (100); the smaller magnetization values for large fields, however, indicates the (110) direction to be magnetically harder compared to the (100) direction. We note that our -behavior for in-plane applied fields differs from the reported one [shi12].
Large magnetostriction is commonly observed in rare earth-containing compounds due to their orbital magnetism. Within a quadrupole approximation, the 4 electron densities of Ho3+ and Dy3+ retain an oblate shape [27]. In Fig. 3, the magnetostriction L0 [where L = L(0)] and its coefficient (1/L at 1.8 K is presented for (100). These data are in excellent concert with the -data of Fig. 2. We observe a large increase of L upon rotation of the in-plane component of magnetization, while the flip at 2.8 T results in a sudden drop of L. As expected from this scenario, there is only very little length change for fields above 3 T. The discrepancy between the magnetostriction measured during up-sweep (red lines in
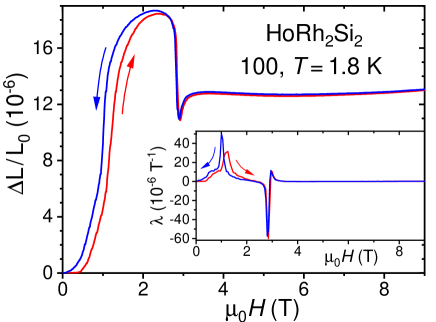
Fig. 3) and down-sweep (blue) is in line with a scenario involving different magnetic domains in this tetragonal material.
Figure 4 exhibits the relative length changes and the uniaxial thermal expansion coefficients for HoRh2Si2. Here, the index denotes measurements along the different crystallographic directions (100), (110) and (001). Clearly, strong maxima in are observed at 11.8 K for all directions, a temperature which agrees well with the feature observed in . Additional peaks are observed for all directions upon approaching . Importantly, equal-area constructions for yield temperatures of the jumps of 27.6 K for the (100) and (110) directions, and 27.5 K for (001), i.e. very close to . In contrast, only tiny variations of are present at , see respective arrow in Fig. 4(b). We note that magnetization measurements along (001) only showed a small cusp at 27.3 K [shi12] while the magnetic specific heat peaked dramatically at this temperature (cf. discussion below and [34]), the latter very similar to our thermal expansion results. Clearly, our thermal expansion measurements are less sensitive to the onset of magnetic order at and point to a mechanism operating at which is different from the antiferromagnetic ordering at . Moreover, at the jump occurs in opposite directions: and expand by about (obtained from equal-area constructions around the jumps) but HoRh2Si2 contracts along by and hence, the volume shrinks upon warming the sample through . This anisotropic thermal expansion is in line with the reported increase of the ratio upon cooling from room temperature to 4.2 K [17]. There is, however, no indication for any discontinuous change in the lattice constants as, e.g., observed for some ThCr2Si2-type phosphides [huh97].
We note that our repeated measurements of thermal expansion (also on different samples) all agree qualitatively, but vary quantitatively for the (001) direction, particularly within the range . We speculate that domain formation may play a role in generating such quantitative
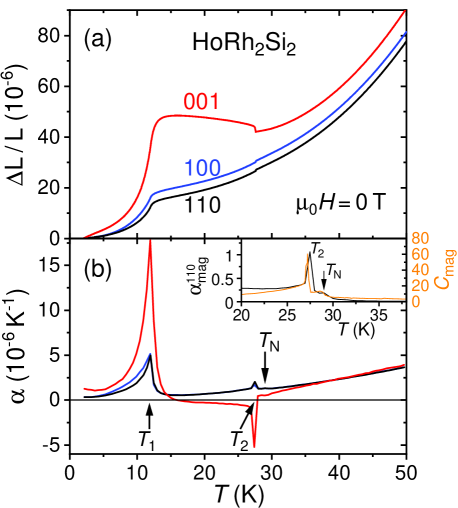
differences. This is supported by the fact that the transition temperatures and themselves agree nicely for all measurements conducted.
Given this unusual behavior of the thermal expansion, we performed measurements of the specific heat on HoRh2Si2. Figure 5(a) presents the data up to 70 K albeit measurements were conducted within 3 K 200 K. As the main result and in support of our thermal expansion measurements, the largest peaks in of HoRh2Si2 are observed at 11.6 K and 27.2 K , while only a much less-pronounced shoulder is seen at [sek87]. At lowest , a Sommerfeld coefficient of 10.5 mJ molK-2 is estimated from Fig. 5(b), a value close to the one (9.6 mJ molK-2) obtained for trivalent Eu in isostructural EuCo2Si2 [sei19]. A temperature dependence of is consistent with spin-wave excitations in an antiferromagnet [las08]. Nuclear contributions of Ho (with nuclear spin ) to are expected to be negligibly small at the temperatures of interest here [kum16, sto20] while phonon contribution only add minimally to the -dependence of . In order to evaluate the magnetic contribution to the total specific heat of HoRh2Si2, the isostructural
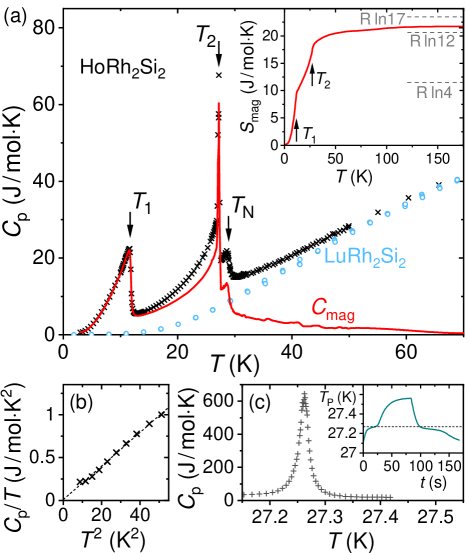
compound LuRh2Si2 was taken as a non-magnetic reference [fer07]. However, the mass per formula unit of LuRh2Si2 exceeds the one of HoRh2Si2 by approximately 2.4%. Hence, for a more accurate estimate of the phonon contribution in HoRh2Si2, of LuRh2Si2 was rescaled to account for its heavier atomic mass, as outlined in [tar03, sto20]. The so-determined of HoRh2Si2 is shown by a red line in Fig. 5(a), and an estimate of the resulting magnetic entropy is presented in the inset. Note that even at highest the magnetic entropy reaches only about 88% of the expected value of R for Ho3+, an observation which complicates an assessment of the associated multiplet states. Nonetheless, one may speculate from that two doublets or one doublet and two singlets are involved below . In fact, if we use the crystalline electric field (CEF) parameters as provided in [usa23] we find a quasi-quartet ground state made up of one doublet and two singlets within an energy range of less than 0.5 K. We note that Ho3+ is a non-Kramers ion with 4 doublets and 9 singlets in tetragonal symmetry [wal84]; a non-magnetic singlet ground state is not evident. From the nice -dependence of ungapped antiferromagnetic spin waves are expected; hence, the proposed quasi-quartet ground state can be rationalized. Further, few of the singlets may reside high up in energy which may explain the fact that the observed magnetization at 9 T is distinctly smaller than the expected saturation magnetization (see discussion above and Fig. 2) as well as the ’’missing‘‘ entropy R. We note that also in case of HoIr2Si2 a saturation value of R was reported [kli18] suggesting a common origin for finding a reduced at high temperatures in both compounds.
Having both and at hand, the Grüneisen ratio can be evaluated. For a single, dominating contribution to the entropy with characteristic energy scale , the Grüneisen ratio is expected to be independent of temperature [gru08, geg16, dre20]. Experimentally, this can be verified by analyzing the ratio [kli06]. In our case, we focus on the magnetic contributions to and . In order to estimate the phonon contribution to we make use of this contribution to as described above and scale it to . After subtraction, the resulting magnetic part is presented for the direction (110) in the inset to Fig. 4(b) along with [from Fig. 5(a)] within 20 K 38 K for direct comparison. Clearly, the two quantities scale reasonably well with mol/J. Similarly good agreement is found for the (100) direction with mol/J, while for (001) the agreement is not quite as nice. All this may indicate a common magnetic origin of the transitions at and . The transition at appears to be separate because of the much larger values of compared to while the opposite holds for . Because of the extremely sharp peaks of and at we find the population (or depopulation) of CEF levels as the cause of this transition unlikely. Rather, we speculate that a change of the magnetic structure takes place at . The above described simple AFM structure with was established for K [17]. This leaves the possibility of a different magnetic structure within . In fact, Ho itself displays several magnetic structures, including a helical one [koe66]. An incommensurate magnetic structure for was suggested in [34], yet without showing data. In addition, a change from an incommensurate ordering vector just below to a commensurate one at lower was reported for HoMn2O5 [bla05] and HoSbTe [plo22], a similar sequence was observed for HoNi2B2C [gol94]. Therefore, a change of the magnetic structure at is certainly possible but awaits confirmation, e.g. by neutron scattering.
Beyond that, one may consider the impact of the magnetoelastic coupling on the structure of HoRh2Si2. For instance, in some tetragonal rare-earth nickel borocarbides a magnetostriction-induced orthorhombic lattice distortion was observed [det97, kre01, tof18]. Here, the lattice distortion (expressed as the relative difference of the orthorhombic lattice parameters and ) was reported to be proportional to the squared ordered magnetic moment around [kre01]. In case of HoRh2Si2, one may then speculate that the increase of the ordered magnetic moment upon cooling through may also, via magnetoelastic coupling, induce a structural phase transition at . Indeed, detailed measurements of according to the recipe outlined in Ref. [las03] exhibit a very sharp peak at , Fig. 5(c). In addition, the measurement platform temperature arrested close to due to the sample‘s latent heat [las03], inset to Fig. 5(c). Both observations clearly indicate a first order transition taking place at supporting the aforementioned scenario. However, high-resolution structural investigations in this -range are called for to substantiate such a speculation [sek87].
III.2 DyRh2Si2
A detailed description of the magnetic properties and the specific heat of our DyRh2Si2 single crystals has been provided very recently [33] and hence, we will focus here on the thermal expansion and magnetostrictive measurements.
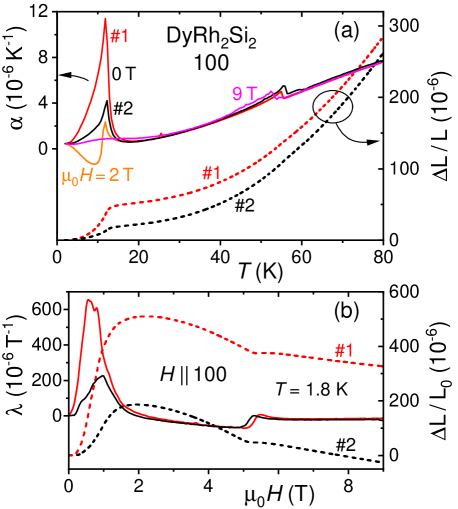
Single crystals DyRh2Si2 exhibit a preferred natural growth edge along the crystallographic direction [36]. Therefore, a suitable sample for measurements of thermal expansion along the (100) direction needed to be searched for. Some results for two different runs are presented in Fig. 6(a). Between these runs (denoted as #1 and #2) the single crystal was mounted afresh inside our measurement cell. As can clearly be seen, the two runs yielded quantitatively different results albeit the transitions were always observed at very similar temperatures (or magnetic fields) and agree well with the results from other measurements (see below). The same holds for additional runs as well as measurements along the (110) and (001) crystallographic directions (not shown here). This indicates that our measurements are genuine. As in case of HoRh2Si2, we may speculate that domain effects play a role in these differences but other influences cannot be ruled out at present. We therefore restrict ourself to a discussion of the transition temperatures (and transition fields in case of magnetostriction) in the following.
The magnetic behavior of DyRh2Si2 is qualitatively similar to the one observed for HoRh2Si2: The susceptibility exhibits a sharp peak at 55 K if measured along (001), while peaks at 12 K for (100) and (110) [33]. For both compounds, the magnetic moments align along the -direction below [fel83, 19] but tilt away from for . For DyRh2Si2, Weiss temperatures of K and 36.5 K were reported [33], in line with its larger compared to the Ho-compound. Also, about twice as large magnetic fields (4.0 T and 8.2 T, [33]) are required for
the step-like magnetization behavior in DyRh2Si2 with , which is otherwise very similar to the one shown in Fig. 2. There is no indication for any other transition in DyRh2Si2, i.e., there appears to be no counterpart to seen in HoRh2Si2.
Included in Fig. 6 are examples of results for obtained at applied magnetic fields, here 2 T and 9 T. For the latter, is reduced to 53 K, while the transition at is largely suppressed to a faint, broad crossover. At such high in-plane fields, the magnetic moments rotated toward the field direction regardless of the presence/absence of any tilting away from the direction due to the CEF.
An example of a thermal expansion measurement along the (110) direction is presented in Fig. 7(a) which is, not surprisingly, very similar to the (100) direction. The results of our measurements for are summarized in the low temperature–magnetic field phase diagram Fig. 7(b). All blue portions were taken from [33]. Obviously, the thermal expansion (stars) and magnetostriction (diamonds) results agree nicely with these reported data. As mentioned earlier, results obtained on different samples (marked by red and green color) also agree well and hence, the quantitative differences discussed above are not caused by sample dependencies. Note that the temperature range of this phase diagram is well within the antiferromagnetic order, . As mentioned, below
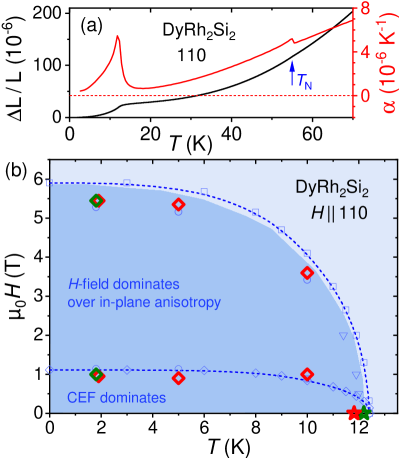
12 K, the magnetic moments start to tilt away from the crystallographic direction. Moreover, the (small) magnetocrystalline anisotropy within the basal plane gives rise to an additional feature in the phase diagram depending on whether the CEF-derived anisotropy or the applied magnetic field dominate energetically. In consequence, one may expect a crossover, rather than a transition, which would explain the broad feature at 1.5 T observed in for [similar to the data shown in Fig. 6(b) for ].
An example of magnetostriction measurements with at several temperatures is shown in Fig. 8(a). At 60 K, i.e. for , only a very small and featureless field dependence of L0 is seen. In consequence, we can safely assume that the step-like features observed in L0 are linked to the antiferromagnetic spin alignment. Plotting all the transitions observed in the magnetostriction measurements in a – phase diagram results in Fig. 8(b). Here, our data are overlayed onto the respective phase diagram as published in [33] (red data points, shading and labels). The excellent agreement in Fig. 8(b) indicates that the two jumps observed in magnetostriction, Fig. 8(a), are related to two consecutive spin-flip transitions from a ++ state (marked AFM I) to +++ (AFM II) beyond about 4 T, and finally a field-polarized ++++ state (FP).
Our thermal expansion measurements [stars in Fig. 8(b)] conducted at different constant fields reveal the presence of another transition which
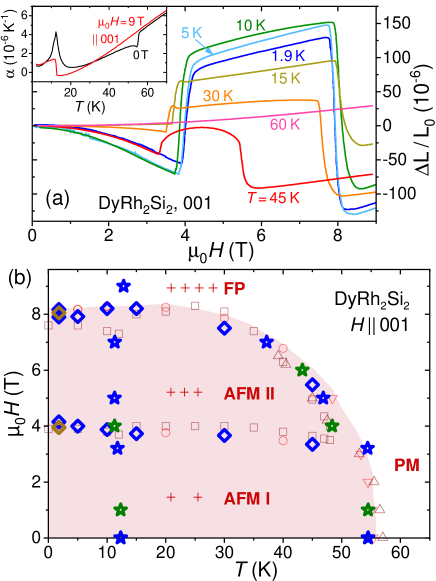
was not included in the earlier phase diagram [33]. As it is observed at 12 K, it is likely related to , i.e. the temperature at which the magnetic moments tilt away from the crystallographic direction. This tilting is a consequence of the strong anisotropy (i.e. large related CEF parameters [33, 31, 32]) along the direction and hence, it is not surprising to find this transition to be nearly independent of , and even in the field-polarized state at 9 T (the maximum field of our PPMS). Interestingly, despite the almost twice as high of DyRh2Si2 compared to HoRh2Si2, the temperatures are nearly the same (12 K and 11.7 K, respectively). Moreover, the tilting angle of at 4.2 K in DyRh2Si2 [31] is similar to the one in HoRh2Si2. The observation of a clear jump in at 12 K for , but only a broad hump for , Fig. 6(a), may again be related to the formation of magnetic domains, but possibly also to the (already mentioned) oblate shape of the 4 electron density [27].
IV Conclusion
The compounds DyRh2Si2 and HoRh2Si2 share sizeable effects in thermal expansion. In fact, they both exhibit a canting of the magnetic moments away from the crystallographic direction upon cooling to temperatures below about 12 K which are reflected in positive peaks of for all main crystallographic directions. We attribute these similarities to similar CEF effects experienced by the rare earths in both compounds as well as to similar 4 electron densities of the Dy3+ and Ho3+ ion. The latter may also serve as an explanation for the observed opposite changes in depending on whether it is measured parallel or perpendicular to the direction of the tetragonal lattice, Figs. 4, 6(a) and inset of 8(a). Unfortunately, a quantitative analysis beyond this qualitative comparison has proven difficult due to differences in the magnitude of both and for differently mounted samples, particularly in the case of DyRh2Si2. We attribute these differences to magnetic domain effects in these samples. This assumption is supported by the fact that in all measurements of and highly consistent transition temperatures or transition fields, respectively, were observed.
One difference between the two compounds is the appearance of a second transition temperature close to, but distinct from, in HoRh2Si2. This transition is seen in numerous properties: , and . Neutron diffraction measurements indicated a strong change of intensity of the magnetic 100 reflection at (271) K [17]. This observation may point to a change in the magnetic structure of HoRh2Si2 at , an assessment in line with an analysis of the magnetic Grüneisen ratio.
V Acknowledgments
KK and CK acknowledge funding by the Deutsche Forschungsgemeinschaft (DFG, German Research Foundation) via SFB/TRR 288 (422213477, Project No. A03).
References
- Hoffmann and Zheng [1985] R. Hoffmann and C. Zheng, J. Phys. Chem. 89, 4175 (1985).
- Si et al. [2016] Q. Si, R. Yu, and E. Abrahams, Nature Rev. Mater. 1, 16017 (2016).
- Steglich and Wirth [2016] F. Steglich and S. Wirth, Rep. Prog. Phys. 79, 084502 (2016).
- Shatruk [2019] M. Shatruk, J. Solid State Chem. 272, 198 (2019).
- Steglich et al. [1979] F. Steglich, J. Aarts, C. D. Bredl, W. Lieke, D. Meschede, W. Franz, and H. Schäfer, Phys. Rev. Lett. 43, 1892 (1979).
- Palstra et al. [1985] T. T. M. Palstra, A. A. Menovsky, J. van den Berg, A. J. Dirkmaat, P. H. Kes, G. J. Nieuwenhuys, and J. A. Mydosh, Phys. Rev. Lett. 55, 2727 (1985).
- Movshovich et al. [1996] R. Movshovich, T. Graf, D. Mandrus, J. D. Thompson, J. L. Smith, and Z. Fisk, Phys. Rev. B 53, 8241 (1996).
- Mathur et al. [1998] N. D. Mathur, F. M. Grosche, S. R. Julian, I. R. Walker, D. M. Freye, R. K. W. Haselwimmer, and G. G. Lonzarich, Nature 394, 39 (1998).
- Schuberth et al. [2016] E. Schuberth, M. Tippmann, L. Steinke, S. Lausberg, A. Steppke, M. Brando, C. Krellner, C. Geibel, R. Yu, Q. Si, and F. Steglich, Science 351, 485 (2016).
- Yuan et al. [2003] H. Q. Yuan, F. M. Grosche, M. Deppe, C. Geibel, G. Sparn, and F. Steglich, Science 302, 2104 (2003).
- Broun [2008] D. M. Broun, Nature Phys. 4, 170 (2008).
- Keimer et al. [2015] B. Keimer, S. A. Kivelson, M. R. Norman, S. Uchida, and J. Zaanen, Nature 518, 179 (2015).
- Lai et al. [2022] Y. Lai, J. Y. Chan, and R. E. Baumbach, Sci. Adv. 8, eabp8264 (2022).
- Ruderman and Kittel [1954] M. A. Ruderman and C. Kittel, Phys. Rev. 96, 99 (1954).
- Kasuya [1956] T. Kasuya, Prog. Theor. Phys. 16, 45 (1956).
- Yosida [1957] K. Yosida, Phys. Rev. 106, 893 (1957).
- S̀laski et al. [1983] M. S̀laski, J. Leciejewicz, and A. Szytuła, J. Magn. Magn. Mater. 39, 268 (1983).
- Felner and Nowik [1984] I. Felner and I. Nowik, J. Phys. Chem. Solids 45, 419 (1984).
- Melamud et al. [1984] M. Melamud, H. Pinto, I. Felner, and H. Shaked, J. Appl. Phys. 55, 2034 (1984).
- Szytuła et al. [1984] A. Szytuła, M. S̀laski, H. Ptasiewicz-Ba̧k, J. Leciejewicz, and A. Zygmunt, Solid State Commun. 52, 395 (1984).
- Melamud et al. [1998] M. Melamud, M. Kuznietz, H. Pinto, E. Caspi, and H. Shaked, J. Magn. Soc. Jpn. 22, 63 (1998).
- Hossain et al. [2009] Z. Hossain, A. K. Rajarajan, V. K. Anand, C. Geibel, and S. M. Yusuf, J. Magn. Magn. Mater. 321, 213 (2009).
- Kliemt et al. [2017] K. Kliemt, M. Hofmann-Kliemt, K. Kummer, F. Yakhou-Harris, C. Krellner, and C. Geibel, Phys. Rev. B 95, 134403 (2017).
- Sichelschmidt et al. [2018] J. Sichelschmidt, K. Kliemt, M. Hofmann-Kliemt, and C. Krellner, Phys. Rev. B 97, 214424 (2018).
- Kliemt et al. [2019] K. Kliemt, J. Banda, C. Geibel, M. Brando, and C. Krellner, Mater. Res. Express 6, 126104 (2019).
- Windsor et al. [2020] Y. W. Windsor, A. Ernst, K. Kummer, K. Kliemt, C. Schüßler-Langeheine, N. Pontius, U. Staub, E. V. Chulkov, C. Krellner, D. V. Vyalikh, and L. Rettig, Commun. Phys. 3, 139 (2020).
- Rinehart and Long [2011] J. D. Rinehart and J. R. Long, Chem. Sci. 2, 2078 (2011).
- Chevalier et al. [1985] B. Chevalier, J. Etourneau, J. E. Greedan, J. M. D. Coey, and A. Maarouf, J. Less-Common Metals 111, 171 (1985).
- Czjzej et al. [1989] G. Czjzej, V. Oestereich, H. Schmidt, K. Ła̧tka, and K. Tomala, J. Magn. Magn. Mater. 79, 42 (1989).
- Takano et al. [1987] Y. Takano, K. Ohhata, and K. Sekizawa, J. Magn. Magn. Mater. 66, 187 (1987).
- Tomala et al. [1989] K. Tomala, J. P. Sanchez, and R. Kmieć, J. Phys.: Condens. Matter 1, 9232 (1989).
- Takano et al. [1992] Y. Takano, H. Takigami, K. Kanno, and K. Sekizawa, J. Magn. Magn. Mater. 104-107, 1367 (1992).
- Kliemt et al. [2023] K. Kliemt, M. Ocker, S. Krebber, S. Schulz, D. V. Vyalikh, C. Krellner, and D. Y. Usachov, Phys. Rev. B 107, 224424 (2023).
- Shigeoka et al. [2011] T. Shigeoka, T. Fujiwara, K. Munakata, K. Matsubayashi, and Y. Uwatoko, J. Phys.: Conf. Series 273, 012127 (2011).
- Sanada et al. [2009] N. Sanada, R. Watanuki, K. Suzuki, M. Akatsu, and T. Sakakibara, J. Phys. Soc. Jpn. 78, 073709 (2009).
- Kliemt et al. [2020] K. Kliemt, M. Peters, F. Feldmann, A. Kraiker, D.-M. Tran, S. Rongstock, J. Hellwig, S. Witt, M. Bolte, and C. Krellner, Cryst. Res. Technol. 55, 1900116 (2020).
- Küchler et al. [2017] R. Küchler, A. Wörl, P. Gegenwart, M. Berben, B. Bryant, and S. Wiedmann, Rev. Sci. Instrum. 88, 083903 (2017).