Mutant fate in spatially structured populations on graphs: connecting models to experiments
Abstract
In nature, most microbial populations have complex spatial structures that can affect their evolution. Evolutionary graph theory predicts that some spatial structures modelled by placing individuals on the nodes of a graph affect the probability that a mutant will fix. Evolution experiments are beginning to explicitly address the impact of graph structures on mutant fixation. However, the assumptions of evolutionary graph theory differ from the conditions of modern evolution experiments, making the comparison between theory and experiment challenging. Here, we aim to bridge this gap. We use our new model of spatially structured populations with well-mixed demes at the nodes of a graph, which allows asymmetric migrations, can handle large populations, and explicitly models serial passage events with migrations, thus closely mimicking experimental conditions. We analyze recent experiments in this light. We suggest useful parameter regimes for future experiments, and we make quantitative predictions for these experiments. In particular, we propose experiments to directly test our recent prediction that the star graph with asymmetric migrations suppresses natural selection and can accelerate mutant fixation or extinction, compared to a well-mixed population.
Author Summary
Predicting how mutations spread through a population and eventually take over is important for understanding evolution. Complex spatial structures are ubiquitous in natural microbial populations, and can impact the fate of mutants. Theoretical models have been developed to describe this effect. They predict that some spatial structures have mutant fixation probabilities that differ from those of well-mixed populations. Experiments are beginning to probe these effects in the laboratory. However, there is a disconnect between models and experiments, because they consider different conditions. In this work, we connect them through a new model that closely matches experimental conditions. We analyze recent experiments and propose new ones that should allow testing the effects of complex population spatial structures on mutant fate.
Introduction
Most natural microbial populations possess complex spatial structures. For example, pathogens evolve within each host and are transmitted between hosts during epidemics [1], an important fraction of bacteria and archaea live in biofilms [2], the gut microbiota occupies different habitats within the gut [3] and evolves there [4, 5], and the soil microbiota exhibits complex spatial patterns correlated with environmental factors [6]. In this light, it is important to understand the impact of the spatial structure of populations on their evolution.
In population genetics theory, populations divided into multiple well-mixed demes (i.e. subpopulations) connected by migrations have long been studied [7, 8]. Most models assume that migrations are symmetric enough to maintain the overall mutant fraction. Under this hypothesis, the fixation probability of a mutant is not impacted by spatial structure [9, 10], unless deme extinctions occur [11]. Note however that several studies determining the effective population sizes of structured populations considered more general migration patterns [12, 13, 14, 15], but their focus was mainly on neutral evolution [11, 13, 14]. Evolutionary graph theory allows to model more complex spatial structures [16, 17]. It assumes that each individual is located on a node of a graph, and that birth and death events occur according to a specific update rule which ensures that exactly one individual sits on each node at all times. Evolutionary graph theory shows that some spatial structures can impact mutant fixation probability [16]. Different update rules yield different evolutionary outcomes [18, 19]. For instance, the star graph can amplify or suppress natural selection depending on the update rule [20, 18, 21]. More general models inspired by evolutionary graph theory assume that a well-mixed deme with constant size sits on each node of a graph, and use similar update rules as models with single individuals on nodes [22, 23, 24, 25, 26]. In these models, migration is either always coupled to birth and death events [22, 23, 24, 25, 26], or independent from them but constrained to be symmetric [26].
Modern evolution experiments [27, 28, 29, 30, 31, 32, 33, 34, 35] allow to investigate evolution in the lab. In particular, some experiments have investigated the impact of spatial structure on evolution, implementing spatial structure through transfers between well-mixed cultures [30, 31, 32, 34, 35]. A recent seminal study explicitly considered different graph structures, including the star graph [34]. In this exciting context, there is a strong disconnect between theoretical predictions and experiments. Experiments allow for complex structures and asymmetric migrations [34], thus going beyond traditional population genetics models [7, 8, 9, 10]. Evolutionary graph theory assumes that the size of each deme is strictly constant (generally set to one, or to a fixed number in generalizations). This is not the case in experiments, which generally employ batch culture with serial passages (also called serial transfers), alternating phases of growth and bottlenecks [27, 28, 29, 30, 31, 32, 33, 34, 35]. Furthermore, these experiments do not have update rules or strict couplings between birth, death and migration events, in contrast to evolutionary graph theory.
We recently developed a new model of spatially structured populations on graphs, which explicitly models serial passages with migrations, allows asymmetric migrations, and can handle large population sizes [36]. This makes it ideal to model current experiments, such as those performed in [34], and to make quantitative predictions for future experiments. Formally, our model is close to a structured Wright-Fisher model, thus bridging classical population genetics models [7, 8, 9, 10, 11] and evolutionary graph theory [16, 18, 19].
Here, we use our model to simulate and analyze the seminal experiments performed in [34] on the impact of complex spatial population structures on mutant fate. We find that in the conditions of this experiment, mutant fixation is systematic, and features intermediate plateaus corresponding to gradual mutant spread if migrations are relatively rare. We further show that the time evolution of mutant fraction is well-described by a simple deterministic model. We conclude that no amplification or suppression of selection can be observed in this parameter regime. Next, we use our model to make quantitative suggestions for future experiments on the effect of spatial structure on mutant fate. We propose specific parameter regimes that should allow to observe suppression of selection and acceleration of fixation or extinction dynamics in the star compared to a well-mixed population. We make detailed and experimentally testable predictions in this parameter regime.
Results
Modeling evolution experiments in spatially structured populations with serial passage
Key ingredients and steps of the model.
In our recent paper [36], we developed a model describing the evolution of spatially structured populations composed of well-mixed subpopulations or demes, each placed on a node of a graph. This model explicitly takes into account the serial passage protocol commonly used in modern evolution experiments [27, 28, 29, 30, 31, 32, 33, 34, 35]. In particular, such a protocol was used in the recent study [34] to investigate the impact of different spatial structures on the fate of beneficial mutants. In “Model and methods”, we describe our model step by step and we relate it to the experiments of [34] (see also [36] for model details). Our model is illustrated in the top panel of Fig. 1, and the spatial structures we consider here are presented in the bottom panel of Fig. 1.
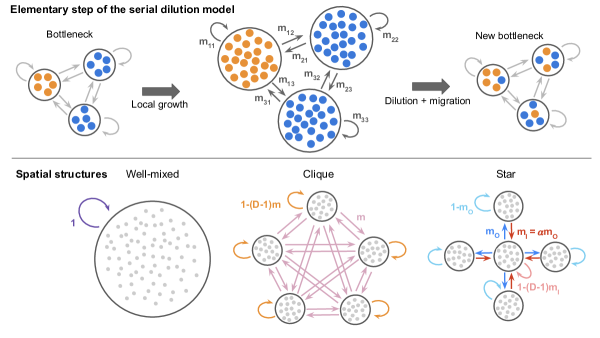
Briefly, we consider well-mixed demes, all with a bottleneck size that fluctuates around a value , set by the serial passage protocol. In this spatial structure, two types of individuals are in competition: wild-types, and beneficial mutants that have a relative fitness advantage over wild-types.
Starting from a bottleneck, demes first undergo a phase of local exponential growth for a fixed time . This time essentially represents the time between two successive serial passage events. As we do not take into account the possible slowdown of growth due to entry in stationary phase, in fact represents the time of exponential growth that would correspond to the actual growth between two successive serial passage events. It is during the growth phase that the fitness advantage of mutants matters: their growth rate is times larger than that of wild-types. As a result, in demes where mutants were present at the bottleneck, the fraction of mutants increases during the growth phase. This variation of mutant fraction only depends on the product of and , which we will thus refer to as the effective selection coefficient (see “Model and methods”).
Then, serial passage with spatial structure is performed through simultaneous dilution and migration events. Specifically, it is modeled as binomial samplings of wild-types and mutants from and to each deme, performed according to migration probabilities set along each edge of the graph representing the spatial structure. This serial passage step leads to a new bottleneck state in the spatially structured population. In this new bottleneck state, each deme again has a size around , and is composed of individuals that originate from this deme and from others, according to the chosen migration probabilities. Note that our model incorporates fluctuations of bottleneck size and composition, consistently with experiments.
Link to other models, and summary of previous results.
Many traditional population genetics models assume that migrations are symmetric enough to preserve the overall mutant fraction in the population [7, 9, 10], a condition known as conservative migration [37]. In our framework, assuming that average bottleneck size is the same for each deme, i.e. for any deme , and neglecting deme size variations, the conservative migration condition reads for all possible sets of mutant fractions after growth. It leads to for all . This corresponds to circulation graphs, where each deme has equal total incoming and outgoing migration flows. Note that the same conclusion holds assuming that for all instead of for all . Our model allows us to consider more complex spatial structures, in the form of graphs that are not circulations. In other words, it allows us to consider asymmetric migrations that do not necessarily preserve overall mutant fraction. Furthermore, our model enables us to treat any connected graph with migration probabilities along its edges. It generalizes over evolutionary graph theory [16] and its extensions to nodes comprising multiple individuals [22, 23, 24, 25, 26], which assume specific update rules that exactly preserve population size.
We previously showed that our model recovers the predictions of evolutionary graph theory regarding amplification or suppression of selection in the star graph, in the limit of rare migrations and for specific migration asymmetries matching those implicitly imposed by update rules [38, 36]. Furthermore, for circulation graphs, we showed that our model recovers Maruyama’s theorem [9, 10] of population genetics and generalizes the circulation theorem [16] of evolutionary graph theory, both for rare migrations [38] and for frequent migrations in the branching process regime [36].
Analysis of the experiments performed in [34]
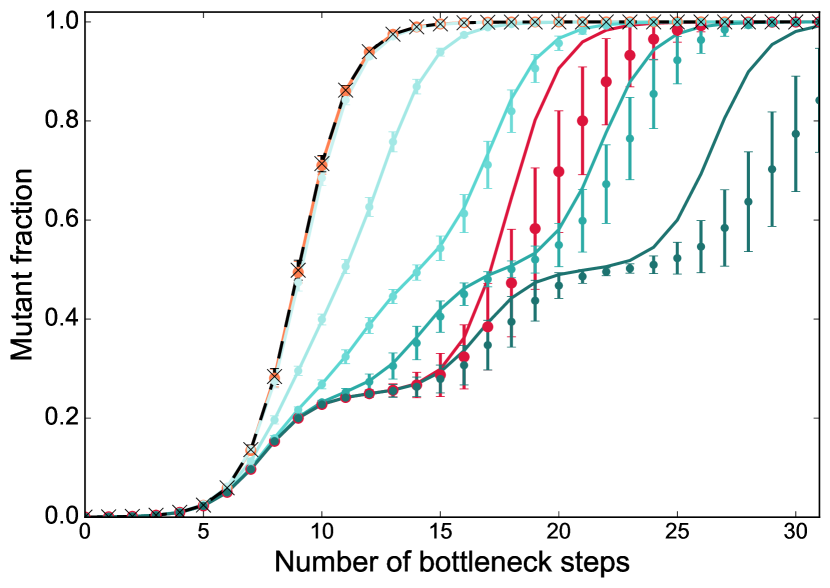
What does our model predict for the experiments performed in [34], in particular for their long-term outcome? To address this question, we perform numerical simulations of our model with parameters corresponding to the experiments of [34], see “Model and methods” for details of these parameter choices. In particular, there are demes, each with average bottleneck size , one of them is initialized with mutants out of individuals, the selective advantage of mutants is and the growth time is . Importantly, with such a large effective selective advantage and such a large initial number of mutants, mutant fixation would be certain both in an isolated deme and in a well-mixed population with individuals, as shown by the fixation probability in Eq. 2 of “Model and methods”.
Systematic mutant fixation with intermediate plateaus.
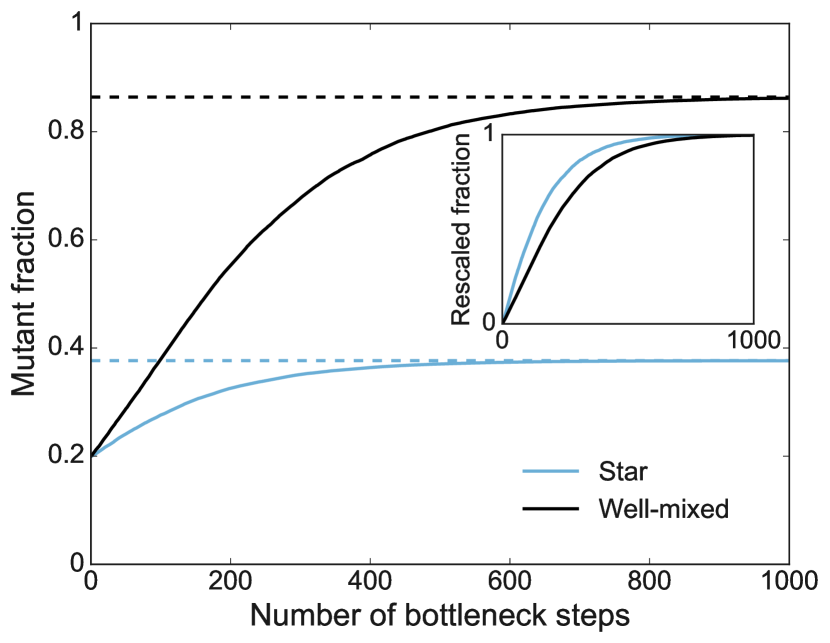
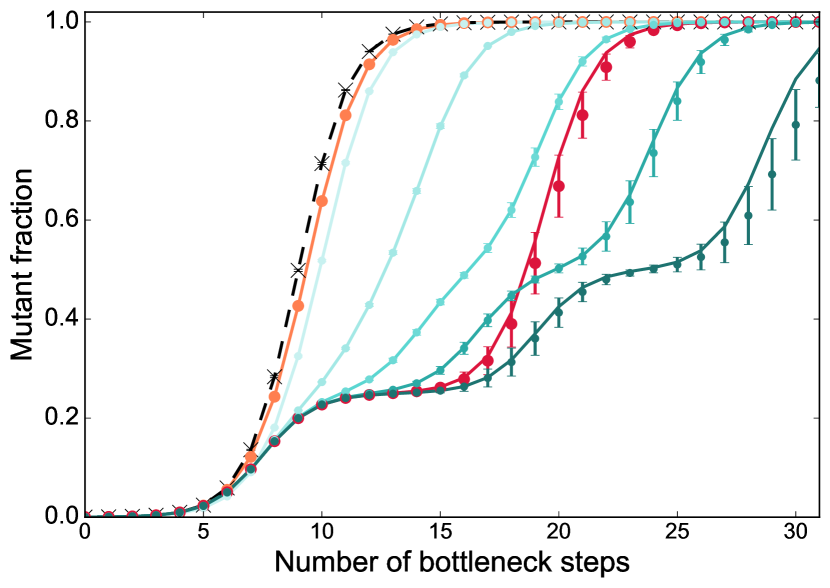
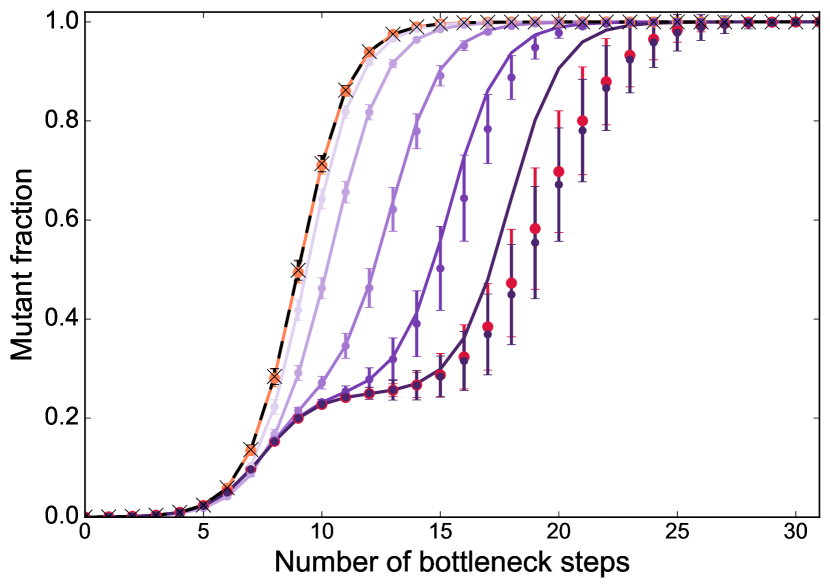
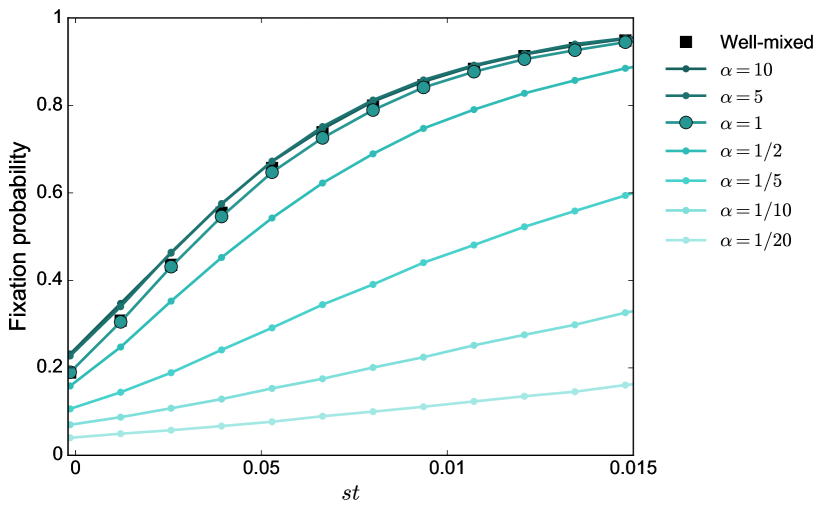
Fig. 2 shows our simulation results for the time evolution of the mutant fraction in the clique, and in the star with migration asymmetry set to (see Fig. 1, bottom panel). We observe that in all cases, fixation is reached. This is due to the large effective selective advantage and the large initial number of mutants.
Furthermore, Fig. 2 shows that, if migrations are frequent, the time evolution of mutant fraction in a structured population is extremely similar to that in a well-mixed population with size . This holds both in the clique and in the star. For less frequent migrations, fixation becomes slower, because it takes time for mutants to migrate from their initial demes to other ones. For the rarest migrations considered, we observe intermediate plateaus of mutant fraction, which correspond to successive fixation events in each deme. This is qualitatively reminiscent of the rare migration regime [38, 36], where fixation occurs sequentially. Note however that our theoretical definition of the rare migration regime is more stringent, as it requires that any migration (even of a single cell) is rare during fixation [38, 36]. Both for the clique and for the star, a first plateau with mutant fraction 0.25 is reached, corresponding to one deme out of four having fixed the mutant, while others are still wild-type. We checked that this deme is the one where mutants started. This is consistent with the experimental observations in [34]. After this first step, trajectories differ for the clique and for the star, if the mutants starts from a leaf of the star (which is the case in [34]). Indeed, in the clique, mutants can migrate to any other deme from the one where mutants started. Meanwhile, in the star, if mutants started in a leaf, they first spread to the center before being able to spread to other leaves, which leads to a second plateau. Thus, in the star, we observe no second plateau if mutants start in the center, while a second plateau exists at mutant fraction 0.5 if mutants start in a leaf, see Fig. 2. When choosing uniformly at random the deme where mutants start, we thus obtain a plateau around mutant fraction . Note that in [34], only the first plateau was observed because experiments were then stopped.
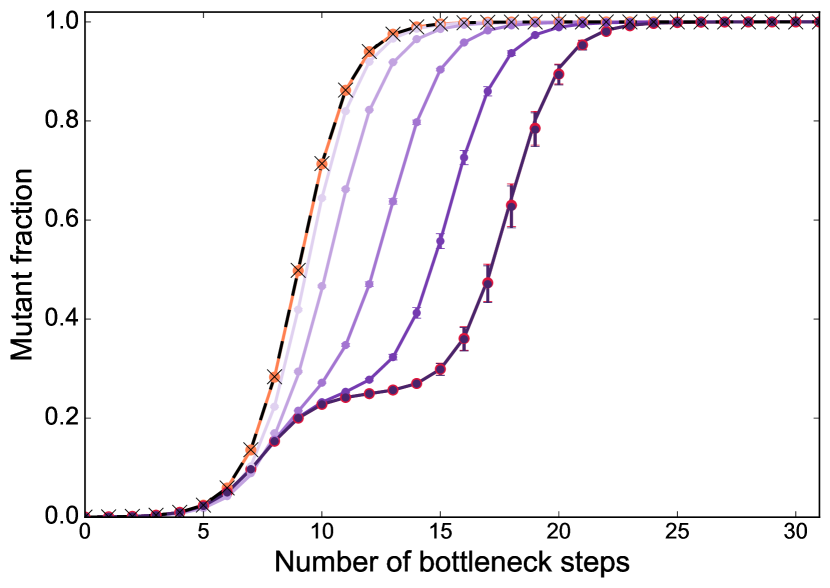
Quasi-deterministic behavior.
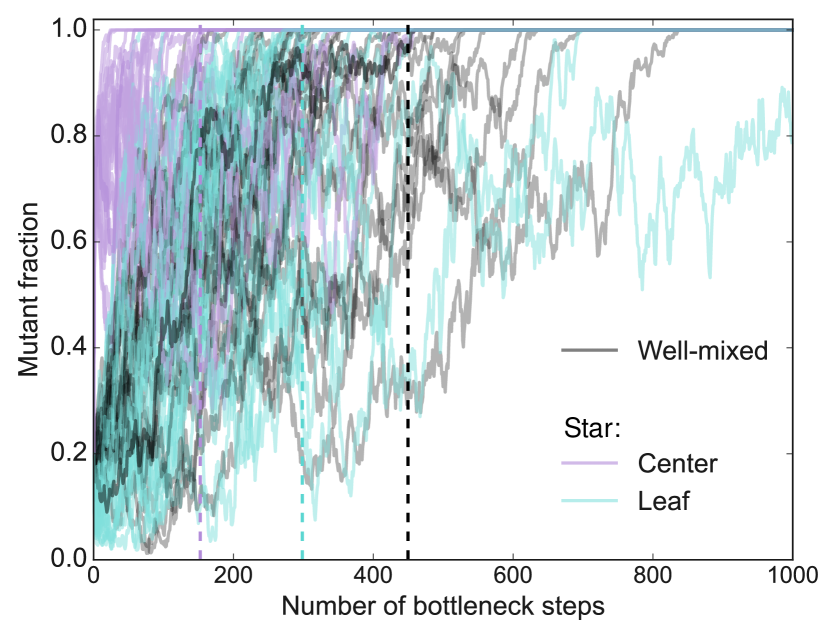
An important observation in Fig. 2 is that there is little variability between trajectories. Indeed, standard deviations are small . Accordingly, examining individual trajectories confirms that they are rather similar, see Fig. S1. Thus motivated, we proposed a simple deterministic model for the time evolution of mutant fraction (see “Model and methods”). Fig. 2 shows a good overall agreement between the predictions of this deterministic model and the average of stochastic simulations. Thus, in the regime considered in [34], the main features of the growth of mutant fraction are well-captured by a simple deterministic model. Figs. 2 and S1 also show that the variability across trajectories becomes larger when migrations are rarer, as the stochasticity of individual migration events starts to matter. The largest variability is observed at the last step of mutant spread starting from a leaf in the star (Fig. S1, right panel), when the randomness of relatively rare migrations compounds over two steps of deme invasion. A slight discrepancy between deterministic predictions and the average of stochastic simulations is visible at this last step, when stochasticity becomes more important (see Fig. 2).
Since fixation is certain and the time evolution of mutant fraction is essentially deterministic in the parameter regime considered in [34], we do not predict amplification or suppression of natural selection for these parameters. Whatever the spatial structure, fixation probability is extremely close to one. Furthermore, Fig. 2 shows that fixation is slower in the clique and in the star than in the well-mixed population. Here, spatial structure slows down mutant fixation, all the more that migrations are rare. We do not find that the mutant fraction increases faster in the star starting from a leaf than in the clique with similar migration probabilities. This is at variance with the observations of [34] for the rarest migrations considered, suggesting that other effects were at play in these experiments. Note however that a faster increase of mutant fraction in the star than in the clique can be observed from the first plateau for mutants starting from the center if , where is the migration probability between two demes in the clique (see Fig. S2). Indeed, this allows them to spread faster from their initial deme than in the clique. This would also be the case for mutants starting from a leaf if .
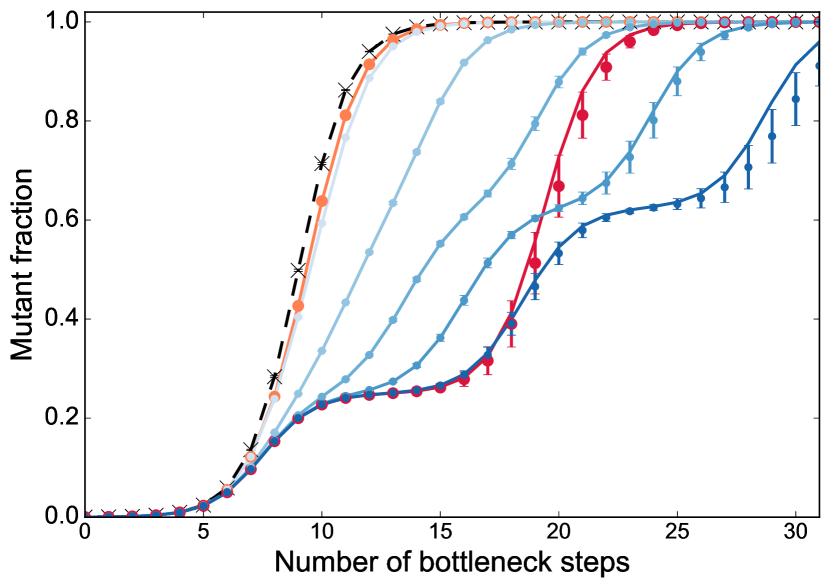
The results in Fig. 2 correspond to . Ref. [34] explored the impact of various migration asymmetries and also considered smaller bottleneck deme sizes . For completeness, we show our results for and in Fig. S2, and for and in Fig. S3. They are qualitatively similar to those of Fig. 2, but stochasticity becomes more important for the smaller population size .
Suggestions for experiments on the effect of spatial structure on mutant fate
Goals and relevant regimes.
How to best choose experimental conditions to investigate the impact of spatial structure on mutant fate? Our model allows us to directly address this question. It is of particular interest to design experiments that may evidence amplification or suppression of natural selection by spatial structure. These effects are defined by comparing the probability of mutation fixation in a spatially structured population to those observed in the well-mixed case. Amplification (resp. suppression) means that beneficial mutations are more likely (resp. less likely) to fix in the structured population than in the well-mixed one, and vice-versa for deleterious mutations.
To observe these effects, it is best to choose parameter regimes where fixation probabilities in well-mixed populations are intermediate. With beneficial mutants, this requires starting with few mutants, so that extinction can occur due to stochastic fluctuations. Alternatively, one can consider small effective selective advantages, even with larger initial numbers of mutants – neutral mutants have a fixation probability equal to their initial fraction. These conditions can be checked in the fixation probability in Eq. 2 of “Model and methods”: if the product of the initial number of mutants and of the effective mutant fitness advantage is large, the fixation probability becomes close to one. Thus, to have an intermediate fixation probability, this product needs to be small. Starting with small but controlled initial numbers of mutants (ideally, one single mutant) is experimentally difficult and results in frequent mutant loss. For simplicity, we propose experiments starting from one fully mutant deme, but with small mutant fitness advantages. However, small fitness differences entail that trajectories will feature strong fluctuations, and that fixation or extinction will take a long time (this would also be a concern starting with few mutants). For experiments not to be overly long, we suggest using small bottleneck sizes. Small populations also have the advantage that de novo mutations are rarer than in large populations, allowing to observe the dynamics of preexisting mutant lineages without interference for a longer time.
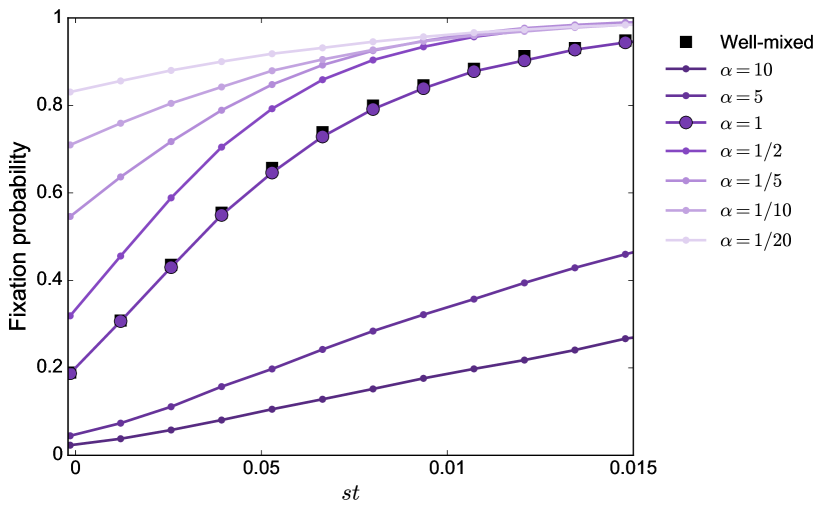
The star with asymmetric migrations suppresses selection and can accelerate fixation and extinction.
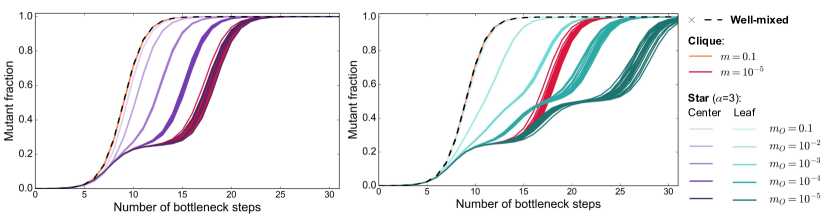
Let us thus investigate fixation probabilities and fixation times in the star in this regime of parameters. We choose as the average deme bottleneck size, and we take demes. Note that increasing increases the difference between the star and the clique, but large would make experiments more technically involved, and was considered in [34]. Note also that bottleneck sizes are often much larger in evolution experiments, but populations with bottleneck sizes of 5000 were considered in [30]. We also choose migration probabilities that are not too small to avoid slowing down fixation too much. In practice, we take . Fig. 3, top panel, shows the fixation probability versus the effective fitness advantage in the star, starting from one fully mutant deme, for different migration asymmetries . We compare with results for the clique and the well-mixed population. We find that beneficial mutants are less likely to fix in the star than in the well-mixed population or in the clique: the star suppresses natural selection for , consistently with our previous results in the branching process regime [36]. However, here, they extend beyond this regime. Note that for , the star behaves very similarly to a well-mixed population. The star is then a circulation [16], and this is consistent with our results for such graphs [36]. Note also that the predictions of evolutionary graph theory, including the amplifier behavior of the star for some migration asymmetries matching the Birth-death update rules, are recovered in the rare migration regime [38, 36]. However, this regime is problematic for experiments because mutant spread is then very slow, so we do not consider it here. We further observe that suppression of selection is stronger if is smaller.
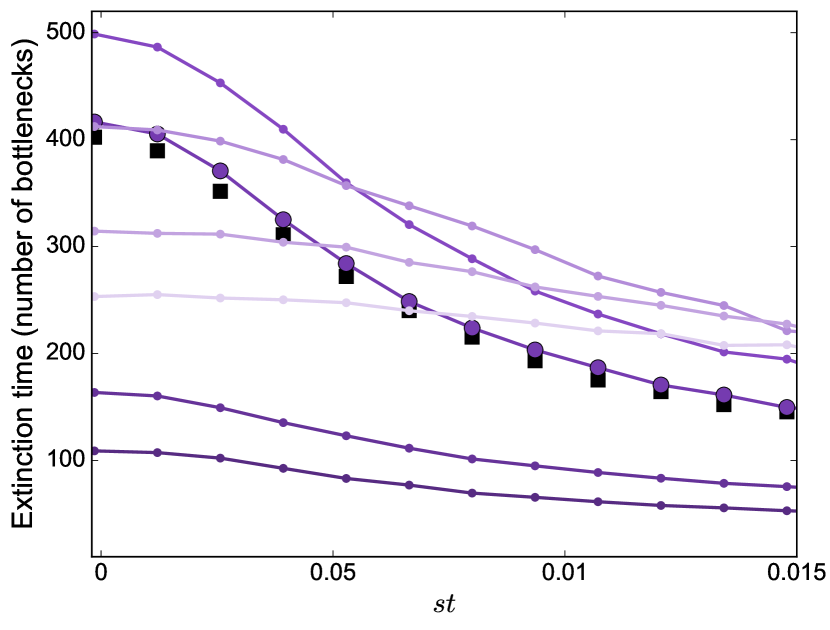
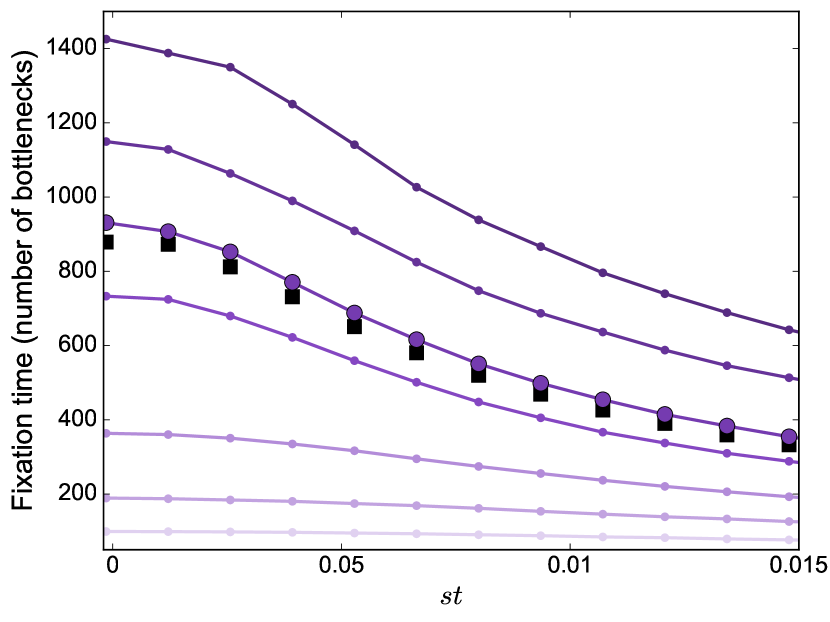
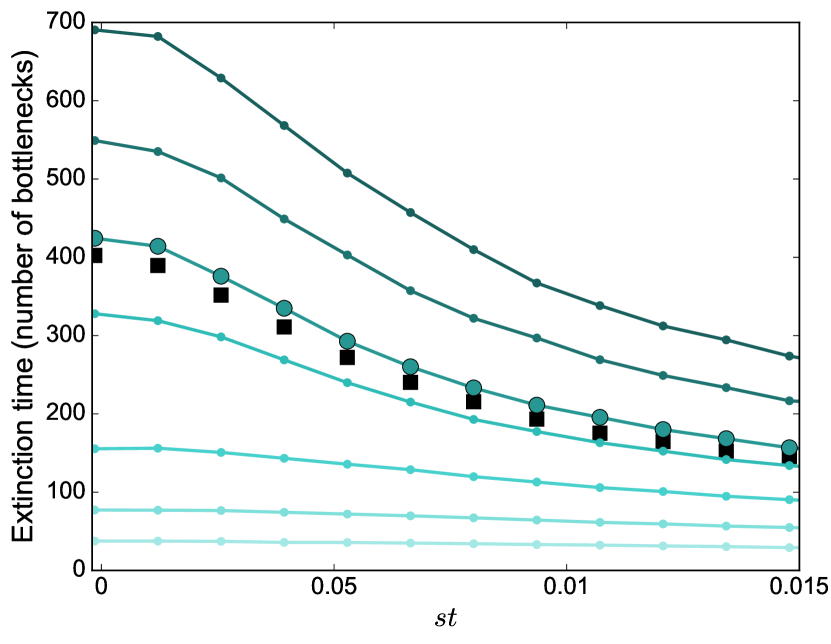
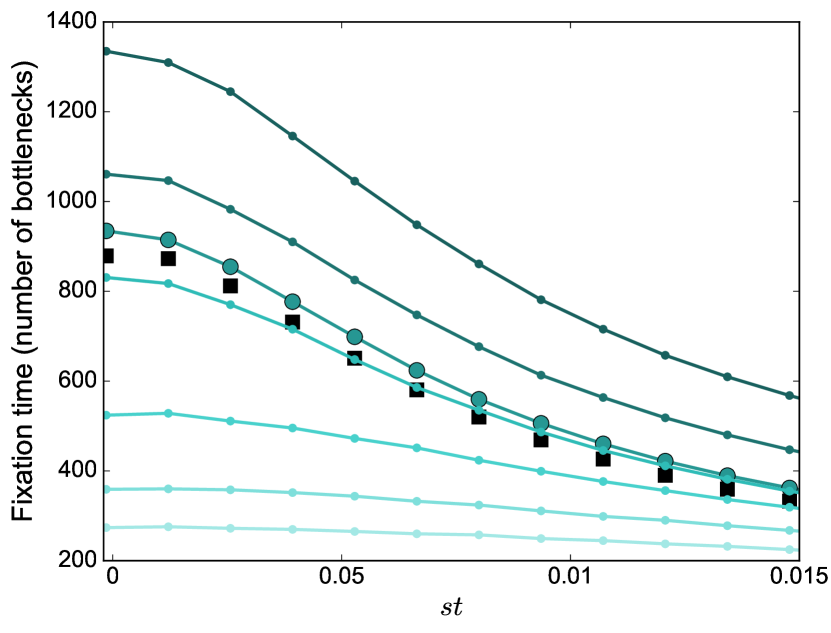
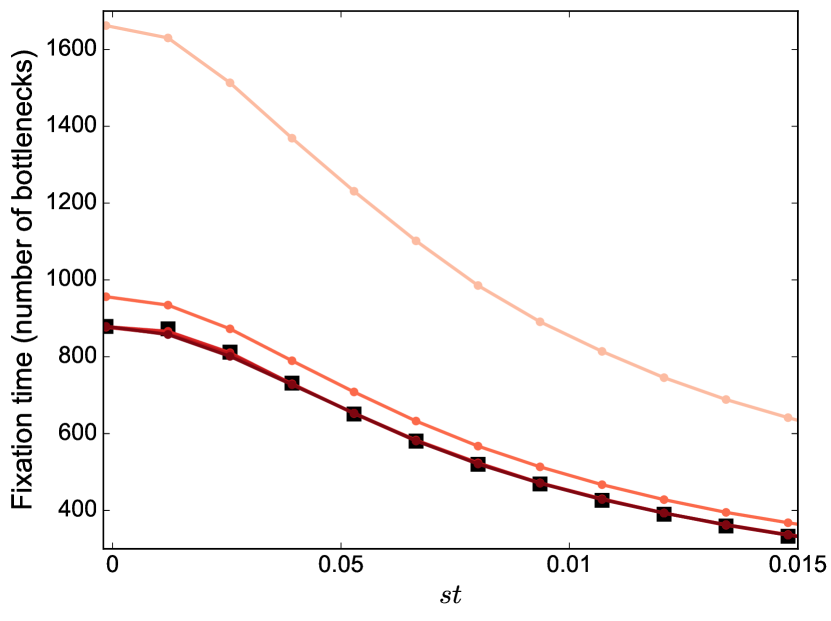
Fig. 3, bottom panels, shows the extinction time and fixation time versus the effective fitness advantage . We observe that both extinction and fixation are slower in the star than in the well-mixed population for large values of , and faster for small values of . Because here we varied at constant by setting , large means small , which slows down mutant spread. The acceleration observed for smaller and larger migration probabilities is consistent with our previous results in the branching process regime [36]. Note however that this effect was not predicted by evolutionary graph theory.
Based on Fig. 3, the best choice to observe a strong effect of spatial structure on mutant fate is to take small values of . This also has the advantage of minimizing experimental duration, which nevertheless remains large – on the order of a few hundreds of bottleneck steps to see fixation or extinction.
The results shown in Fig. 3 are based on considering an initial mutant deme chosen uniformly at random. We also report results obtained when starting from a mutant center, see Fig. S4, or a mutant leaf, see Fig. S5. In particular, for small , the fixation probability starting from a mutant center is larger than in a well-mixed population, while the opposite holds when starting from a mutant leaf. Experiments contrasting these two cases would be interesting.
We emphasize that our predictions of suppression of selection and of acceleration of extinction and of fixation are really associated to the spatial structure of the star, and more precisely, to the asymmetry of migrations represented by . Indeed, in the clique, no such effect is observed, see Fig. S6. Note that the clique is a circulation graph (as well as the star with ), and has a fixation probability which is very close to that of the well-mixed population. In fact, in the branching process regime, we showed that all circulations have the same fixation probability as the well-mixed population [36].
Detailed predictions for example parameters.
Let us predict what could be observed in experiments in this regime of parameters. For this, we consider the star with the same parameters as above (, , and , entailing ). We set the effective fitness advantage of the mutants to , which exhibits both strong suppression and strong acceleration, see Fig. 3. Fixation probabilities are the following in the star: starting from a mutant center, starting from a mutant leaf, and starting from a uniformly chosen mutant deme. For comparison, the probability of fixation is in the clique, as well as in the well-mixed population. These fixation probabilities reveal a substantial suppression of selection in the star (starting from a uniformly chosen mutant deme). Recall that these values were estimated from 100,000 replicate numerical simulations (see Fig. 3). Importantly, the suppression effect should be detectable by performing at least 16 experimental replicates for each spatial structure. Indeed, the 95% confidence intervals for the fixation probabilities in the star and in the well-mixed population, estimated using the Wilson binomial proportion confidence interval [39, 40], should then become disjoint (see Methods for details).
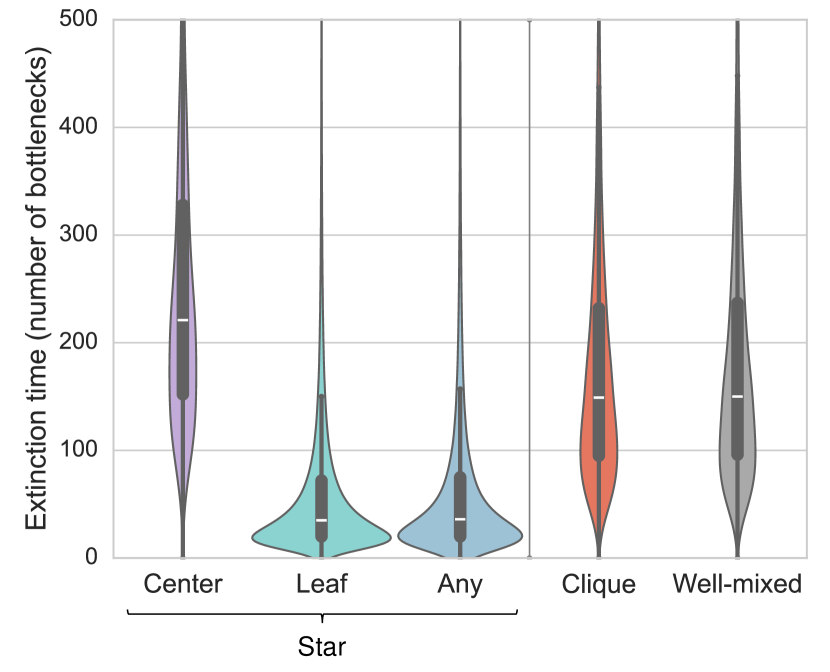
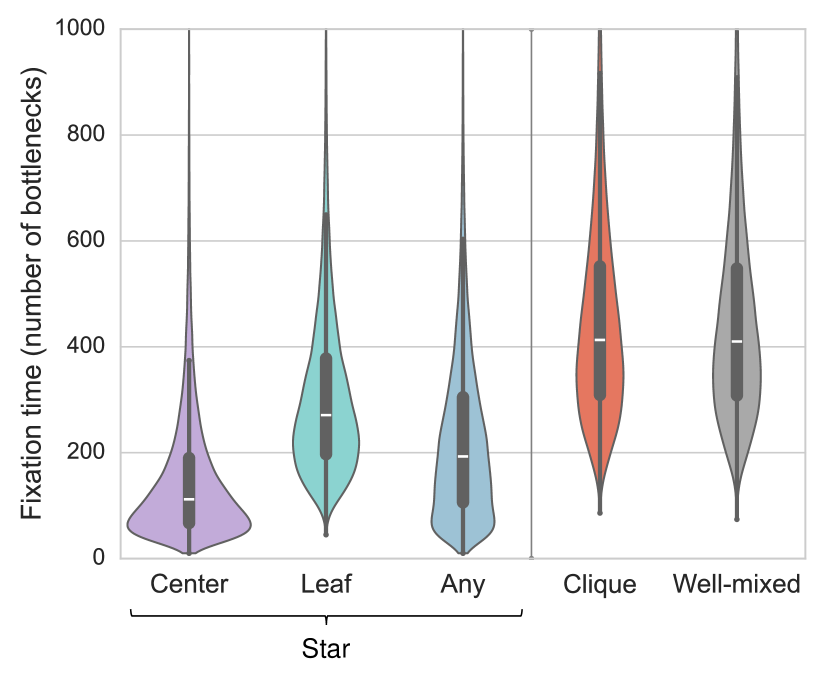
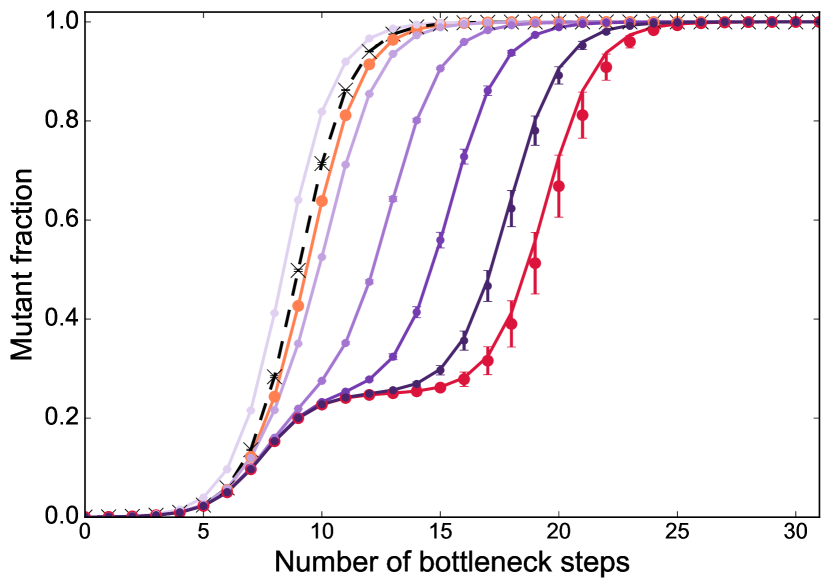
Fixation and extinction times can be measured in the same experiments as fixation probabilities, by counting how many serial passage steps are needed to get to fixation or extinction in each trajectory. An important point is that trajectories exhibit substantial variability in this regime of parameters. Fig. 4 reports the distributions of fixation and extinction times in the star, in the clique and in the well-mixed population. Starting from the leaf or from a uniformly chosen mutant deme, the star accelerates the dynamics of extinction and of fixation. Conversely, starting from a mutant center makes extinction slower, because of the large outgoing migration probability . All extinction and fixation times are of the order of some hundreds of bottleneck steps at most. The acceleration of fixation starting from a mutant center in the star, compared to the well-mixed case, should be detectable by performing 9 experimental replicates in each case. Indeed, the 95% confidence intervals on the mean fixation times become disjoint for about 7 trajectories leading to fixation in each case (see Methods for details), and about 9 trajectories should be needed to have 7 of them leading to fixation in these cases.
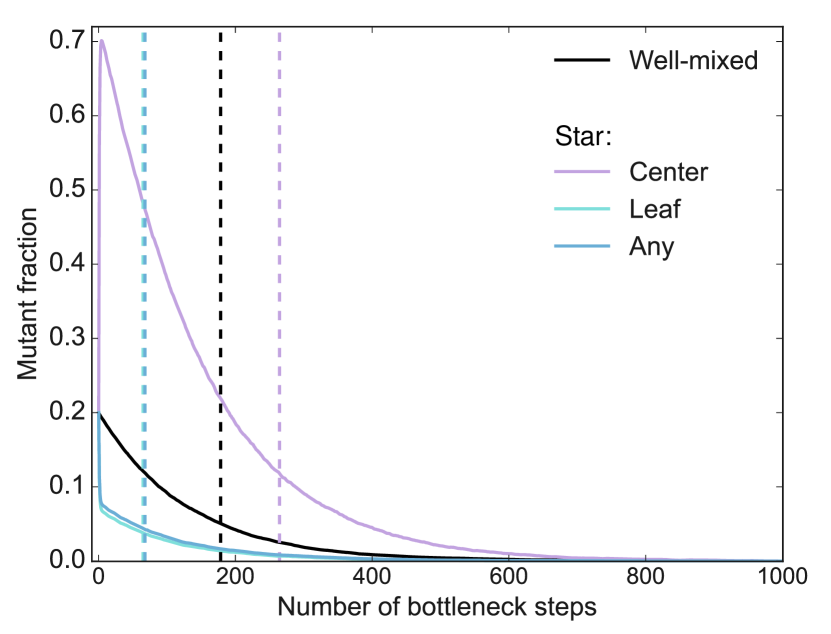
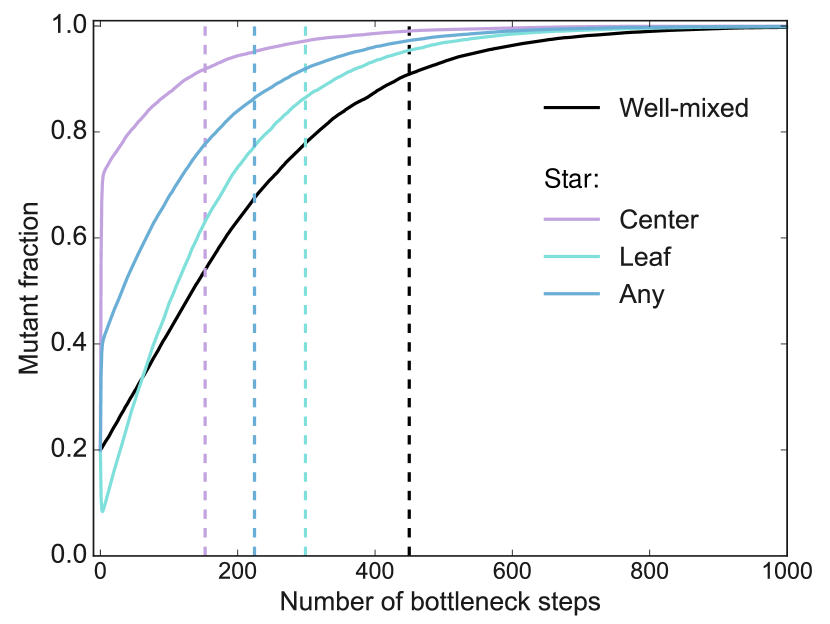
In addition to the probability of fixation and to the extinction and fixation times, evolution experiments in spatially structured populations also give access to the time evolution of mutant fraction before extinction or fixation happens. In Fig. 5, we show the theoretical prediction for these trajectories. We first show the average of extinction and fixation trajectories (top panels), and the average of all trajectories (bottom left panel). We observe that for the star starting from a fully mutant deme, the first bottleneck step yields a large variation of mutant fraction in both fixation and extinction trajectories, and that the average evolution is then smoother. The comparison of extinction (resp. fixation) trajectories is in line with the comparison of average extinction (resp. fixation) times. For instance, fixation is accelerated starting from a fully mutant deme in the star compared to the well-mixed case. However, comparing overall average trajectories (including those leading to extinction and to fixation, see Fig. 5, bottom left panel) is more complex, since they converge toward intermediate mutant fractions corresponding to fixation probabilities. Thus, the acceleration effect is not easy to see from such average trajectories, unless the fractions are rescaled as in the inset. In the regime considered here, fluctuations are important, as seen in individual fixation trajectories (see Fig. 5, bottom right panel). This entails that a sufficient number of replicates is needed to observe the acceleration effect (see our discussion above regarding extinction and fixation times).
Since these experiments focus on the spread of a preexisting mutant strain, we need to ensure that there are few de novo mutants. Here, with , if as in [34] (which, for , yields ), the number of cell division events per growth phase is about in each deme. With a total mutation rate of per genome and per bacterial replication [41, 42, 43], this yields about 10 de novo mutation events per growth phase in each deme, which is not negligible. Spontaneous mutations generally have small fitness effects and are weakly deleterious to neutral [43], meaning that most of them they will be lost due to selection and drift. Nevertheless, to decrease the number of de novo mutations during the experiment, an interesting possibility is to choose shorter growth times . Keeping , but taking instead of (and taking ) reduces the number of de novo mutation events to about 1 per growth phase in each deme. Note that reducing also reduces the total experiment duration: should correspond to performing about 10 serial passages per day instead of one, meaning that 1000 bottlenecks (the longest useful duration here) can be realized in 100 days. While performing frequent serial passages can be a challenge with manual methods, it could be achieved e.g. using a robot [30]. As a whole, if maintained for 1000 bottlenecks, our proposed experiment comprises division events with and division events with . This is much smaller than in each experiment performed in [34], where and yields about divisions per deme and per growth phase, which gives more than division events total during an experiment. If the selective advantage of the mutant of focus is ensured by antibiotic resistance as in [34], spontaneous mutations conferring resistance may perturb the proposed experiments. Assuming that 100 possible single mutations increase resistance [44] yields a total mutation rate to resistance on the order of per bacterial division, meaning that resistance mutations should remain rare in our proposed experiments.
Discussion
Here, we used our recent model of spatially structured populations on graphs with serial passages [36] to quantitatively analyze recent evolution experiments and to propose future ones. We do not predict amplification or suppression of selection with the parameters used in [34]. We suggest using smaller bottleneck sizes and effective mutant fitness advantages, and starting from fully mutant demes, in the design of future experiments investigating possible amplification or suppression of natural selection by spatial structure. In this regime, we predict that the star with asymmetric migrations suppresses natural selection and can accelerate mutant fixation and extinction.
Our predictions in the regime we deem most promising for future experiments were obtained from numerical simulations. The key points, namely suppression of selection and acceleration of fixation and extinction for the star with small , are consistent with our analytical predictions in the branching process regime [36]. Note however that the conditions considered here are not in the branching process regime, most prominently because we start from one fully mutant deme. This shows the robustness of these trends. Recall that in evolutionary graph theory, the star can amplify or suppress natural selection depending on the update rule [16, 20, 18, 21]. We previously showed that with a deme on each node, the star amplifies selection for rare migrations and small fitness advantages, if incoming migrations to the center are stronger than outgoing ones [38], but even then, it becomes a suppressor of selection for more frequent migrations [36]. However, the rare migration regime is problematic for experiments because it requires reproducibly handling very small numbers of cells (most migration-dilution events would involve zero exchange in this regime). In addition, it gives very slow dynamics, thus demanding extremely long experiments. This is why we advocate for a focus on evidencing suppression of selection. Note that we predict suppression when mutants are started in a uniformly chosen deme (which is the usual condition in which suppression or amplification are defined). However, we also predict that starting from a mutant center in the star with small yields larger fixation probabilities for beneficial mutants than in the well-mixed population. Thus, experimental studies aiming to evidence increased fixation of beneficial mutants could focus on this specific case.
The experiments we proposed require precise serial passage with small bottlenecks on relatively long timescales. Another potential difficulty is the focus on mutants with relatively small advantages. However, we expect that they can be realistically achieved, e.g. using robots for serial passage [30]. With the parameters we propose, the number of experimental replicates needed to see a significant effect remains modest, and de novo mutants are not a strong concern. Beyond the specific experiments we suggested, our model can be simulated to predict experimental results for mutant fate in spatially structured populations on graphs undergoing serial passage. It thus connects models to experiments in a quantitative way.
Our model could be extended to include additional possible ingredients of experiments. Here, we considered exponential growth, but depending on experimental conditions, it might be necessary to take into account resource limitation and entry to stationary phase. If considering antibiotic resistant mutants, it could be relevant to model the mode of action, e.g. to distinguish bacteriostatic and bactericial actions. While birth and death can be lumped into an effective growth rate in exponential growth, this might matter with more complex growth models. Besides, here, we assumed that selection is essentially soft, as the total size of demes after growth does not directly affect their contributions to the next bottleneck state, which is determined by mutant fraction [45]. Some experimental protocols might be closer to the hard selection case. While this point often does not modify key conclusions [46, 11], it might be impactful e.g. for cooperative mutants exhibiting frequency-dependent selection [47, 48, 49, 50].
From a theoretical point of view, our numerical simulations show that the main conclusions obtained in the branching process regime [36], notably the pervasive suppression of selection associated to frequent asymmetric migrations, hold beyond it. This calls for further analytical study of our model of spatially structured populations. In particular, it will be interesting to develop a diffusion approximation [51, 52, 53] for our model of spatially structured populations, as was done for structured Wright-Fisher models [54, 55]. This would also open the way to develop exact simulation algorithms [56, 57].
Here, our focus has been on the fate of mutants that are introduced at the beginning of experiments, i.e. of preexisting mutants. It would be interesting both theoretically and experimentally to consider longer evolutionary trajectories [58], and to include de novo mutants, which may appear at any time during the growth phase [59, 60, 61, 62, 63, 64]. Further extensions include addressing environmental gradients [65, 66, 67, 68], changing environments [69, 70, 71, 72, 73, 74, 75], possible deme extinctions [11], cooperative interactions [76, 77, 78], and connecting to models of expanding populations [79, 80].
Model and methods
Model
We model a spatially structured population as a connected graph with nodes, each one comprising a well-mixed deme. Our model was first presented in [36], but we explain it here for the sake of completeness, and we explicitly make the link with the experiments performed in [34]. Migration probabilities are defined between any pair of demes , including the case which describes individuals that stay in the same deme. We consider two types of individuals: wild-types and mutants. They differ by their exponential growth rates, which are respectively for wild-types (taken as reference) and for mutants. Thus, is the relative fitness advantage of mutants compared to wild-types. The dynamics of this spatially structured population, modeling serial passage with migrations, comprises successive growth and sampling phases. Migrations are implemented during the sampling phases. In the batch culture experiments in structured populations of [34], each deme corresponds to a well that can contain wild-type and mutant bacteria. The latter are resistant to the antibiotic ciprofloxacin, which is present in the culture medium. This is the origin of the fitness advantage of mutants compared to wild-types.
As depicted in the top panel of Fig. 1, starting from a bottleneck, an elementary step of the dynamics includes two successive phases detailed below, that result in a new bottleneck. We perform stochastic simulations of this model.
Growth phase.
First, a phase of local exponential growth happens in each deme during a fixed amount of time . Let us denote by the number of mutants and by the number of wild-types initially present in deme . At the end of the growth phase, these numbers become and , and the total size of the population in deme is . During the growth phase, the fraction of mutants changes from , with , to . Importantly, the impact of the selective advantage of mutants is encoded by the product of relative selective advantage and growth time . We thus call the effective fitness advantage.
This phase corresponds to starting with fresh culture medium containing bacteria, and letting them grow.
Dilution and migration phase.
Then, a phase that simultaneously incorporates dilution and migration is carried out by performing independent samplings. The number of mutants (respectively wild-types) sent from a deme to a deme is sampled from a binomial distribution with trials, and a probability of success (respectively ). Each deme will thus receive an average number of individuals, which gives its new bottleneck state. For simplicity, we generally assume that for all , , meaning that each deme has the same average bottleneck size . This process amounts to drawing approximately bacteria from the total bacteria present in deme , and using them to form the new bottleneck state of deme . Note however that for consistency with [34], we performed the simulations and the calculations of Figs. 2 and S3 assuming instead that , meaning that each deme contributes to the next bottleneck by the same average amount (see [36] for details).
Experimentally, in [34], structured populations were transferred and placed in fresh culture medium right after dispersal among subpopulations.
Parameter choices matching the experiments performed in [34]
In [34], structured populations of demes, each growing in a well of a multi-well plate, are considered. Their bottleneck sizes are colony-forming units in each well . Cultures undergo daily transfer, and grow to a final size of colony-forming units. The duration of exponential growth that should be taken in our model to match these experiments satisfies (considering wild-types), yielding .
The competitive advantage of mutants in the experimental conditions of [34] is reported to be about 20%. This competitive advantage was measured via head-to-head competition starting with equal abundances of mutants and wild-types. This corresponds to measuring [81]
| (1) |
Thus, in these experiments.
Migration probabilities in [34] range from 0.001% to 30%, i.e. from to 0.3. For the star, different asymmetries are considered, namely (referred to as “OUTIN” or “amplifier” in [34]), (“balanced amplifier” in [34]) and (“INOUT” in [34]). The clique is also considered, and referred to as “well-mixed” in [34]. Note that for completeness, we also consider the well-mixed population with no deme structure and the same total bottleneck population size as the star and the clique. This case was not realized in [34]. In the case of the star, the exact way incoming migrations to the center were implemented was by constructing a mix from all three leaves, diluting it and putting it in the center together with some diluted bacteria from the center and with fresh culture medium and antibiotic. Outgoing migrations were implemented by diluting bacteria from the center and putting them in each leaf together with some diluted bacteria from that leaf and with fresh culture medium and antibiotic. We further note that with the exact migration schemes used in [34], the star with does not strictly satisfy or (but the clique satisfies ). Meanwhile, the star with satisfies , and the star with satisfies . However, we showed in [36] that choosing one or the other of these conventions does not qualitatively change how the star impacts mutant fixation. We checked that it is also the case here, in our reproductions of the setup of [34]. For simplicity, we only report results obtained assuming here.
Note that our model is substantially closer to the conditions of the experiments of [34] than the model presented there. Indeed, the latter considers specific spatial structure with density-dependent growth within demes. It also takes much smaller demes than in actual experiments, and starts with only one mutant while experiments are started with substantial numbers of mutants. The main results of the model in [34] are obtained without explicit modeling of serial passage, although this aspect is accounted for in a variant of the model.
Fixation probability in a well-mixed population undergoing serial passage
In our growth and dilution model, the probability of fixation starting from an initial number of mutants at a bottleneck in a well-mixed population with bottleneck size reads [36]
| (2) |
This result is obtained in the diffusion approximation, assuming and . Our serial dilution model in general, and this formula in particular, exhibit a strong formal similarity with the Wright-Fisher model [52]. The effective fitness advantage in our model plays the part of the fitness advantage in the Wright-Fisher model. Note that with the parameter values matching [34], we are not in the regime where . However, the diffusion approximation is often reasonable even beyond this regime [82].
Deterministic model
In addition to our complete stochastic model described above, we propose a deterministic model based on a recurrence relation. This model will be valid when fluctuations in the mutant fractions in each deme can be neglected. This holds in the regime of large populations, large initial numbers of mutants and large migration probabilities. At a given bottleneck , let us denote by the mutant fraction in each deme with . Neglecting fluctuations, the mutant fraction in deme at the next bottleneck can be expressed as:
| (3) |
where denotes the mutant fraction in deme after the growth phase. The mutant fraction in each deme at each bottleneck can be obtained by iterating Eq. 3, starting from the appropriate initial conditions.
Number of experimental replicates needed for the effect of spatial structure to be significant
Fixation probabilities.
We compute the Wilson confidence interval [39] for the fixation probability , estimated as the proportion of experiments where mutants fix in the population. The bounds of the Wilson confidence interval on the estimated binomial proportion are
| (4) |
where is the appropriate quantile from the standard normal distribution and is the number of experimental replicates performed. Using Eq. 4, and using our precise estimates of from numerical simulations instead of the experimental estimates , we find that for the parameters considered, replicates are sufficient to detect a significant difference between the fixation probability in the star starting from a uniformly chosen mutant deme compared to a well-mixed population. Here, significant difference is understood in the stringent sense of non-overlapping confidence intervals, at a confidence level (in this case, for a two-sided interval). Note that, compared to the Wald confidence interval for binomial proportions, the Wilson confidence interval has a better average coverage [40], in particular when is somewhat close to 0 or 1.
Fixation times.
The bounds of the confidence intervals for the experimentally estimated average fixation times are computed as:
| (5) |
where is the experimental estimate of the standard error of the fixation time, and is the appropriate quantile from a -distribution with degrees of freedom. Here, we use the average values and standard errors of fixation times obtained from simulations and corresponding to the distributions depicted in Fig. 4 instead of experimental estimates: for the star, starting from the center, we use and , and for the well-mixed population, we use and . Using these values, we find that for the parameters considered, experimental replicates are sufficient to detect a significant difference between the average fixation time in the star starting from a mutant center and the one of a well-mixed population. Here, significant difference is understood as non-overlapping confidence intervals, at a confidence level ( for a two-sided interval). Note that the same calculation can be used for extinction times.
Code availability statement
Python code for our numerical simulations is freely available at https://github.com/Bitbol-Lab/Structured_pop.
Acknowledgments
A.-F. B. thanks Loïc Marrec for helpful discussions. This project has received funding from the European Research Council (ERC) under the European Union’s Horizon 2020 research and innovation programme (grant agreement No. 851173, to A.-F. B.).
Supplementary figures


References
- [1] F. Bertels, C. Leemann, K. J. Metzner, and R. R. Regoes. Parallel Evolution of HIV-1 in a Long-Term Experiment. Mol Biol Evol, 36(11):2400–2414, Nov 2019.
- [2] H. C. Flemming and S. Wuertz. Bacteria and archaea on Earth and their abundance in biofilms. Nat Rev Microbiol, 17(4):247–260, Apr 2019.
- [3] G. P. Donaldson, S. M. Lee, and S. K. Mazmanian. Gut biogeography of the bacterial microbiota. Nat Rev Microbiol, 14(1):20–32, Jan 2016.
- [4] N. R. Garud, B. H. Good, O. Hallatschek, and K. S. Pollard. Evolutionary dynamics of bacteria in the gut microbiome within and across hosts. PLoS Biol, 17(1):e3000102, Jan 2019.
- [5] N. Frazão, A. Konrad, M. Amicone, E. Seixas, D. Güleresi, M. Lässig, and I. Gordo. Two modes of evolution shape bacterial strain diversity in the mammalian gut for thousands of generations. Nat Commun, 13(1):5604, Sep 2022.
- [6] H. K. Mod, A. Buri, E. Yashiro, N. Guex, L. Malard, E. Pinto-Figueroa, M. Pagni, H. Niculita-Hirzel, J. R. van der Meer, and A. Guisan. Predicting spatial patterns of soil bacteria under current and future environmental conditions. ISME J, 15(9):2547–2560, Sep 2021.
- [7] S. Wright. Evolution in Mendelian populations. Genetics, 16(2):97–159, 1931.
- [8] M. Kimura and G. H. Weiss. The Stepping Stone Model of Population Structure and the Decrease of Genetic Correlation with Distance. Genetics, 49(4):561–576, Apr 1964.
- [9] T. Maruyama. On the fixation probability of mutant genes in a subdivided population. Genetics Research, 15(2):221–225, 1970.
- [10] T. Maruyama. A simple proof that certain quantities are independent of the geographical structure of population. Theoretical Population Biology, 5(2):148–154, 1974.
- [11] N. Barton. The probability of fixation of a favoured allele in a subdivided population. Genet. Res., 62:149–157, 1993.
- [12] T. Nagylaki. The strong-migration limit in geographically structured populations. J Math Biol, 9(2):101–114, Apr 1980.
- [13] M. C. Whitlock and N. H. Barton. The effective size of a subdivided population. Genetics, 146(1):427–441, May 1997.
- [14] M. Nordborg and S. M. Krone. Separation of time scales and convergence to the coalescent in structured populations. In Modern Developments in Theoretical Population Genetics: The Legacy of Gustave Malécot, page 194–232. Oxford University Press, Oxford, 2002.
- [15] P. Sjödin, I. Kaj, S. Krone, M. Lascoux, and M. Nordborg. On the meaning and existence of an effective population size. Genetics, 169(2):1061–1070, Feb 2005.
- [16] E. Lieberman, C. Hauert, and M. A. Nowak. Evolutionary dynamics on graphs. Nature, 433(7023):312–316, 2005.
- [17] T. Antal, S. Redner, and V. Sood. Evolutionary dynamics on degree-heterogeneous graphs. Phys Rev Lett, 96(18):188104, May 2006.
- [18] L. Hindersin and A. Traulsen. Most undirected random graphs are amplifiers of selection for birth-death dynamics, but suppressors of selection for death-birth dynamics. PLOS Computational Biology, 11(11):1–14, 11 2015.
- [19] J. Tkadlec, A. Pavlogiannis, K. Chatterjee, and M. A. Nowak. Limits on amplifiers of natural selection under death-birth updating. PLoS computational biology, 16(1):e1007494, 2020.
- [20] K. Kaveh, N. L. Komarova, and M. Kohandel. The duality of spatial death-birth and birth-death processes and limitations of the isothermal theorem. Royal Society Open Science, 2(4):140465, 2015.
- [21] K. Pattni, M. Broom, J. Rychtář, and L. J. Silvers. Evolutionary graph theory revisited: when is an evolutionary process equivalent to the Moran process? Proceedings of the Royal Society A: Mathematical, Physical and Engineering Sciences, 471(2182):20150334, 2015.
- [22] B. Houchmandzadeh and M. Vallade. The fixation probability of a beneficial mutation in a geographically structured population. New Journal of Physics, 13(7):073020, Jul 2011.
- [23] B. Houchmandzadeh and M. Vallade. Exact results for fixation probability of bithermal evolutionary graphs. Biosystems, 112(1):49–54, Apr 2013.
- [24] G. W. Constable and A. J. McKane. Population genetics on islands connected by an arbitrary network: an analytic approach. J Theor Biol, 358:149–165, Oct 2014.
- [25] S. Yagoobi and A. Traulsen. Fixation probabilities in network structured meta-populations. Scientific Reports, 11(1):17979, 2021.
- [26] S. Yagoobi, N. Sharma, and A. Traulsen. Categorizing update mechanisms for graph-structured metapopulations. J R Soc Interface, 20(200):20220769, Mar 2023.
- [27] R. E. Lenski, M. R. Rose, S. C. Simpson, and Tadler S. C. Long-term experimental evolution in Escherichia coli. I. adaptation and divergence during 2,000 generations. Am. Nat., 138(6):1315–1341, 1991.
- [28] F. E. Santiago and R. E. Lenski. Evolution experiments with microorganisms: the dynamics and genetic bases of adaptation. Nature Reviews Genetics, 4(6):457–469, 2003.
- [29] B. H. Good, M. J. McDonald, J. E. Barrick, R. E. Lenski, and M. M. Desai. The dynamics of molecular evolution over 60,000 generations. Nature, 551(7678):45–50, 2017.
- [30] S. Kryazhimskiy, D. P. Rice, and M. M. Desai. Population subdivision and adaptation in asexual populations of Saccharomyces cerevisiae. Evolution, 66(6):1931–1941, Jun 2012.
- [31] J. R. Nahum, P. Godfrey-Smith, B. N. Harding, J. H. Marcus, J. Carlson-Stevermer, and B. Kerr. A tortoise-hare pattern seen in adapting structured and unstructured populations suggests a rugged fitness landscape in bacteria. Proc Natl Acad Sci U S A, 112(24):7530–7535, Jun 2015.
- [32] M. T. France and L. J. Forney. The Relationship between Spatial Structure and the Maintenance of Diversity in Microbial Populations. Am Nat, 193(4):503–513, 04 2019.
- [33] P. Chen and R. Kassen. The evolution and fate of diversity under hard and soft selection. Proc Biol Sci, 287(1934):20201111, Sep 2020.
- [34] P. P. Chakraborty, L. R. Nemzer, and R. Kassen. Experimental evidence that metapopulation structure can accelerate adaptive evolution. Evol Lett, 7:447–456, 2023.
- [35] J. Kreger, D. Brown, N. L. Komarova, D. Wodarz, and J. Pritchard. The role of migration in mutant dynamics in fragmented populations. J Evol Biol, 36(2):444–460, Feb 2023.
- [36] A. Abbara and A.-F. Bitbol. Frequent asymmetric migrations suppress natural selection in spatially structured populations. PNAS Nexus, 2(11):pgad392, 2023.
- [37] R. A. Blythe and A. J. McKane. Stochastic models of evolution in genetics, ecology and linguistics. Journal of Statistical Mechanics: Theory and Experiment, 2007(07):P07018, Jul 2007.
- [38] L. Marrec, I. Lamberti, and A.-F. Bitbol. Toward a universal model for spatially structured populations. Phys Rev Lett, 127(21):218102, 2021.
- [39] E. B. Wilson. Probable inference, the law of succession, and statistical inference. J Am Stat Assoc, 22(158):209–212, 1927.
- [40] L. D. Brown, T. T. Cai, and A. DasGupta. Interval estimation for a binomial proportion. Stat Sci, 16(2):101–133, 2001.
- [41] H. Lee, E. Popodi, H. Tang, and P. L. Foster. Rate and molecular spectrum of spontaneous mutations in the bacterium Escherichia coli as determined by whole-genome sequencing. Proc Natl Acad Sci U S A, 109(41):E2774–2783, Oct 2012.
- [42] W. Sung, M. S. Ackerman, S. F. Miller, T. G. Doak, and M. Lynch. Drift-barrier hypothesis and mutation-rate evolution. Proc Natl Acad Sci U S A, 109(45):18488–18492, Nov 2012.
- [43] L. Robert, J. Ollion, J. Robert, X. Song, I. Matic, and M. Elez. Mutation dynamics and fitness effects followed in single cells. Science, 359(6381):1283–1286, Mar 2018.
- [44] K. J. Card, M. D. Thomas, J. L. Graves, J. E. Barrick, and R. E. Lenski. Genomic evolution of antibiotic resistance is contingent on genetic background following a long-term experiment with Escherichia coli. Proc Natl Acad Sci U S A, 118(5), Feb 2021.
- [45] B. Wallace. Hard and soft selection revisited. Evolution, 29(3):465–473, Sep 1975.
- [46] S. Rouhani and N. H. Barton. Group selection and the ‘shifting balance’. Genetical Research, 61:127–135, 1993.
- [47] J. S. Chuang, O. Rivoire, and S. Leibler. Simpson’s paradox in a synthetic microbial system. science, 323(5911):272–275, 2009.
- [48] A. Melbinger, J. Cremer, and E. Frey. Evolutionary game theory in growing populations. Phys Rev Lett, 105(17):178101, Oct 2010.
- [49] J. Cremer, A. Melbinger, and E. Frey. Growth dynamics and the evolution of cooperation in microbial populations. Sci Rep, 2:281, 2012.
- [50] J. Cremer, A. Melbinger, K. Wienand, T. Henriquez, H. Jung, and E. Frey. Cooperation in Microbial Populations: Theory and Experimental Model Systems. J Mol Biol, 431(23):4599–4644, Nov 2019.
- [51] M. Kimura. Diffusion models in population genetics. Journal of Applied Probability, 1(2):177–232, 1964.
- [52] W. J. Ewens. Mathematical Population Genetics. Springer-Verlag, 1979.
- [53] E. Aurell, M. Ekeberg, and T. Koski. On a multilocus Wright-Fisher model with mutation and a Svirezhev-Shahshahani gradient-like selection dynamics. arXiv preprint arXiv:1906.00716, 2019.
- [54] S. Lessard. An exact sampling formula for the Wright-Fisher model and a solution to a conjecture about the finite-island model. Genetics, 177:1249–54, 11 2007.
- [55] C. Burden and R. Griffiths. Stationary distribution of a 2-island 2-allele Wright-Fisher diffusion model with slow mutation and migration rates. Theoretical Population Biology, 124, 02 2018.
- [56] P. A. Jenkins and D. Spanò. Exact simulation of the Wright-Fisher diffusion. The Annals of Applied Probability, 27(3):1478–1509, 2017.
- [57] C. García-Pareja, H. Hult, and T. Koski. Exact simulation of coupled Wright–Fisher diffusions. Advances in Applied Probability, 53(4):923–950, 2021.
- [58] N. Sharma and A. Traulsen. Suppressors of fixation can increase average fitness beyond amplifiers of selection. Proc Natl Acad Sci U S A, 119(37):e2205424119, Sep 2022.
- [59] L. M. Wahl, P. J. Gerrish, and I. Saika-Voivod. Evaluating the impact of population bottlenecks in experimental evolution. Genetics, 162(2):961–971, Oct 2002.
- [60] L. M. Wahl and P. J. Gerrish. The probability that beneficial mutations are lost in populations with periodic bottlenecks. Evolution, 55(12):2606–2610, Dec 2001.
- [61] J.S. LeClair and L. M. Wahl. The Impact of Population Bottlenecks on Microbial Adaptation. J Stat Phys, 172:114–125, 2018.
- [62] J. Lin, M. Manhart, and A. Amir. Evolution of Microbial Growth Traits Under Serial Dilution. Genetics, 215(3):767–777, Jul 2020.
- [63] O. Freitas, L. M. Wahl, and P. R. A. Campos. Robustness and predictability of evolution in bottlenecked populations. Phys Rev E, 103(4-1):042415, Apr 2021.
- [64] J. Gamblin, S. Gandon, F. Blanquart, and A. Lambert. Bottlenecks can constrain and channel evolutionary paths. Genetics, 224(2), May 2023.
- [65] Q. Zhang, G. Lambert, D. Liao, H. Kim, K. Robin, C. K. Tung, N. Pourmand, and R. H. Austin. Acceleration of emergence of bacterial antibiotic resistance in connected microenvironments. Science, 333(6050):1764–1767, Sep 2011.
- [66] P. Greulich, B. Waclaw, and R. J. Allen. Mutational pathway determines whether drug gradients accelerate evolution of drug-resistant cells. Phys Rev Lett, 109(8):088101, Aug 2012.
- [67] R. Hermsen, J. B. Deris, and T. Hwa. On the rapidity of antibiotic resistance evolution facilitated by a concentration gradient. Proc Natl Acad Sci U S A, 109(27):10775–10780, Jul 2012.
- [68] M. Baym, T. D. Lieberman, E. D. Kelsic, R. Chait, R. Gross, I. Yelin, and R. Kishony. Spatiotemporal microbial evolution on antibiotic landscapes. Science, 353(6304):1147–1151, Sep 2016.
- [69] V. Mustonen and M. Lässig. Molecular evolution under fitness fluctuations. Phys Rev Lett, 100(10):108101, Mar 2008.
- [70] P. Ashcroft, P. M. Altrock, and T. Galla. Fixation in finite populations evolving in fluctuating environments. J R Soc Interface, 11(100):20140663, Nov 2014.
- [71] P. G. Hufton, Y. T. Lin, T. Galla, and A. J. McKane. Intrinsic noise in systems with switching environments. Phys Rev E, 93(5):052119, May 2016.
- [72] P. G. Hufton, Y. T. Lin, and T. Galla. Model reduction methods for population dynamics with fast-switching environments: Reduced master equations, stochastic differential equations, and applications. Phys Rev E, 99(3-1):032122, Mar 2019.
- [73] L. Marrec and A.-F. Bitbol. Adapt or Perish: Evolutionary Rescue in a Gradually Deteriorating Environment. Genetics, 216(2):573–583, Oct 2020.
- [74] L. Marrec and A.-F. Bitbol. Resist or perish: Fate of a microbial population subjected to a periodic presence of antimicrobial. PLoS Comput Biol, 16(4):e1007798, Apr 2020.
- [75] L. Marrec and C. Bank. Evolutionary rescue in a fluctuating environment: periodic versus quasi-periodic environmental changes. Proc. R. Soc. B., 290:20230770, 2023.
- [76] H. Ohtsuki and M. A. Nowak. Evolutionary games on cycles. Proceedings of the Royal Society B: Biological Sciences, 273(1598):2249–2256, 2006.
- [77] S. Gokhale, A. Conwill, T. Ranjan, and J. Gore. Migration alters oscillatory dynamics and promotes survival in connected bacterial populations. Nat Commun, 9(1):5273, Dec 2018.
- [78] A. Moawad, A. Abbara, and A.-F. Bitbol. Evolution of cooperation in deme-structured populations on graphs. Phys Rev E, 2024.
- [79] O. Hallatschek, P. Hersen, S. Ramanathan, and D. R. Nelson. Genetic drift at expanding frontiers promotes gene segregation. Proc. Natl. Acad. Sci. USA, 104:19926–19930, 2007.
- [80] O. Hallatschek and D. R. Nelson. Gene surfing in expanding populations. Theor Popul Biol, 73(1):158–170, Feb 2008.
- [81] M. J. Wiser and R. E. Lenski. A comparison of methods to measure fitness in Escherichia coli. PLoS One, 10(5):e0126210, 2015.
- [82] C. Bräutigam and M. Smerlak. Diffusion approximations in population genetics and the rate of Muller’s ratchet. J Theor Biol, 550:111236, Oct 2022.