Identifying Student Profiles within Online Judge systems using Explainable Artificial Intelligence
Abstract
Online Judge (OJ) systems are typically considered within programming-related courses as they yield fast and objective assessments of the code developed by the students. Such an evaluation generally provides a single decision based on a rubric, most commonly whether the submission successfully accomplished the assignment. Nevertheless, since in an educational context such information may be deemed insufficient, it would be beneficial for both the student and the instructor to receive additional feedback about the overall development of the task. This work aims to tackle this limitation by considering the further exploitation of the information gathered by the OJ and automatically inferring feedback for both the student and the instructor. More precisely, we consider the use of learning-based schemes—particularly, Multi-Instance Learning and classical Machine Learning formulations—to model student behaviour. Besides, Explainable Artificial Intelligence is contemplated to provide human-understandable feedback. The proposal has been evaluated considering a case of study comprising 2,500 submissions from roughly 90 different students from a programming-related course in a Computer Science degree. The results obtained validate the proposal: the model is capable of significantly predicting the user outcome (either passing or failing the assignment) solely based on the behavioural pattern inferred by the submissions provided to the OJ. Moreover, the proposal is able to identify prone-to-fail student groups and profiles as well as other relevant information, which eventually serves as feedback to both the student and the instructor.
Index Terms:
Student profile identification, Online Judge systems, Multi-Instance Learning, eXplainable Artificial Intelligence, Machine LearningI Introduction
Originally coined by [1], the term Online Judge (OJ) denotes those systems devised for the automated evaluation and grading of programming assignments, which usually take the form of online evaluation services capable of collecting source codes, compiling them, assessing their results, and computing scores based on different criteria [2]. These automated tools have been particularly considered in two precise, yet related, scenarios [3]: (i) programming contests and competitions, and (ii) educational contexts in academic degrees. This work focuses on the latter scenario, in particular, on programming courses from Computer Science studies in higher education institutions.
OJ systems are successful in the education field because they overcome the main issues associated with the manual evaluation of assignments [4]: in opposition to human grading, which is deemed as a tedious and error-prone task, these tools provide immediate corrections of the submissions regardless of the number of participants. Moreover, the competitive learning framework that these schemes entail proves to benefit the success of the learning process [5].
Despite their clear advantages, OJ systems do not provide the student nor the instructor with any feedback from the actual submission apart from whether the provided code successfully accomplished the assignment [6]. However, the information gathered by the OJ system may be further exploited to enrich the educational process by automatically extracting additional insights such as student habits or patterns of behaviour related to the success (or failure) of the task. In this regard, one may resort to the so-called Educational Data Mining (EDM), a discipline meant to infer descriptive patterns and predictions from educational settings [7]. Within this discipline, Machine Learning (ML) is reported as one of the main enabling technologies due to its power and flexibility. Some success cases can be found in the work by [8], devoted to assessing the performance of the instructor; the approach by [9], aimed at predicting student grades at an early stage; or the work by [10], focused on detecting inconsistencies in peer-review assignments. In this work, we apply EDM to automatically provide feedback about the assignments, both to the student and the instructor, in the context of OJ systems for programming courses.
When an OJ is used for grading a programming assignment, there is usually a time slot in which students can perform as many submissions as they want. The final grade of a student in the activity is typically computed from the best submission. During that time slot, data usually exploited in EDM, such as grades obtained in previous activities or course attendance [9], may not be available. Moreover, other data used to predict student performance, such as socioeconomic background or academic success in other courses [11], may not be usable from an ethical point of view due to the potential biases it would introduce.
In spite of the lack of available data, it would still be desirable to be able to detect at-risk students before the assignment deadline. Thus, aided by the use of meta-information gathered from the submission process—e.g., the number of code submission attempts or the date of the first submission—we devised an EDM approach with two types of outcomes: (i) the success probability of a new student, and (ii) the identification of different student profiles to provide feedback to both the instructor and the student thyself. Note that such pieces of information may be used not only to prevent inadequate student attitudes by providing the appropriate observations about the development of the task but also to properly adjust the difficulty of the different assignments, among other possible corrective actions towards the success of the course.
Since the set of code submissions made by a student somehow characterises the student profile to be estimated, the problem may be modelled as a Multi-Instance Learning (MIL) task [12]. This learning framework introduces the concept of bag, i.e., a set with an indeterminate number of instances that is assigned a single label [13]. MIL has been successfully considered in the EDM literature [14], as in the work by [15], which compares MIL against ML for predicting the student performance. In our case, each of these bags gathers the different code submissions made by each student, being labelled as either positive or negative depending on whether the student eventually passed the assessment by the OJ system.
Nevertheless, the fact that both ML and MIL strategies generally work in a black box manner hinders their application in this feedback-oriented context [16]. In this regard, the field of Explainable Artificial Intelligence (XAI) is gradually gaining attention to tackle such limitation by devising methodologies that allow humans to understand and interpret the decisions taken by a computational model [17]. However, while XAI has been largely studied in the ML field, this has not been the case in the MIL one [18].
Considering all the above, this work presents a method to identify student profiles in educational OJ systems with the aim of providing feedback to both the students and the instructors about the development of the task. More precisely, the proposal exclusively relies on the meta-information extracted from these OJ systems and considers a MIL framework to automatically infer these profiles together with XAI methods to provide interpretability about the estimated behaviours. In order to apply XAI to MIL problem, a novel policy for mapping the MIL representation to an ML one is proposed for the particular task at hand. The proposed methodology has been evaluated in a case of study comprising three academic years of a programming-related course with more than 2,500 submissions of two different assignments. For this, more than 20 learning-based strategies comprising ML, MIL, and MIL-to-ML mapping methods have been assessed and compared to prove the validity of the proposal. The results obtained show that the proposal adequately models the user profile of the students while it also provides a remarkably precise estimator of their chances to succeed or fail in the posed task solely based on the meta-information of the OJ.
The rest of the work is organised as follows: Section II reviews the related literature to contextualise the work; Section III presents the proposed methodology; Section IV introduces the case of study examined; Section V details the experimental set-up considered; Section VI shows and discusses the results obtained; Section VII summarises the insights obtained in the work; and finally, Section VIII concludes the work and outlines future research line to address.
II Related Work
This section reviews the literature related to the proposed approach for assessing the performance of the students when considering OJ systems in programming courses. In this regard, we first revise the historical usage of OJ systems in educational environments and afterwards we briefly report the most relevant approaches for predicting student performance in the aforementioned context.
II-A OJ systems
The work by [19], who was the first to propose that academic computing assignments could be automatically graded, is considered the main precursor of current OJ systems. Nevertheless, their first formal definition was introduced by [1] who described them as a computer system that automatically grades programming assignments and provides some type of feedback to the students.
Regarding their practical use, the scientific literature comprises a large number of OJ proposals related, to a great extent, to academic institutions and educational environments. Some examples of such systems comprise the work by [20] with the Javaluador method for tasks in the Java programming language (it is described later in this paper), the URI system by the Universidade Regional Integrada for developing and improving general coding skills [21], the Peking University Online Judge (POJ) by [22] tailored to C++ courses, the CourseMaker one by the University of Nottingham for general programming tasks [23], the Youxue Online Judge (YOJ) [24] also for improving coding skills inspired on exercises from different programming contests, and the Sphere Online Judge (SPOJ) devised for E-Learning frameworks [25], among others.
Besides their use for educational purposes, OJ systems are also commonly considered in the context of coding competitions for solving algorithmic problems. Examples of such cases are the one used in the International Collegiate Programming Contest [26] or the UVa one considered in the Olympiads in Informatics [27].
II-B Estimating student performance
The identification of struggling students in early course stages is deemed as a remarkably important topic in the education field as it suggests the instructor to provide additional resources to address the problem. In this sense, a large number of studies have assessed the influence of both extrinsic and intrinsic factors on the commented difficulties.
In relation to the extrinsic aspects, most of the existing literature resorts to the analysis of the socioeconomic position of the student or the marks obtained in previous courses [11]. The reader is referred to the manuscript by [28] for a thorough revision of these factors as it is out of the scope of this work.
Regarding the intrinsic aspects—using information about the outcomes of the assignments carried out within a course—, the related literature comprises a large number of approaches since they typically yield considerably accurate predictions. Some representative examples include: the work by [29], which addresses this task in generic online learning platforms; that by [30] on preventive failure detection in the context of the Moodle platform; the case of [31] that estimates this information relying on information gathered from clicker tests in peer-based instruction environments; and the approach by [9], who use course attendance as a predictor of academic outcome for the academic year.
Focusing on the case of programming courses, it may be checked that the most basic, yet successful, approaches rely on hand-crafted heuristics neglecting the use of OJ systems. For instance, Error Quotient [32] together with its refined version Repeated Error Density [33] perform this assessment by resorting to the syntax errors that occur during the compilation stage. The Watwin Scoring Algorithm [34] works in a similar way, but penalises students based on the time required to fix each type of error compared to that of their peers. [35] devised a scoring mechanism that takes into account more complex interactions, such as debugging or modifying syntactically correct code. A last example is the one by [36] that identifies at-risk students by means of a linear regression approach based on compilation errors and other indicators.
While the previous approaches are useful for addressing beginner-level programming courses, when tackling cases in which students are more familiar with this discipline, they become limited. In this context in which syntactic-level errors are less common than semantic ones, most approaches rely on the use of OJ systems and ML-based analysis techniques. Examples in the literature include the work by [37] that proposes the use of a supervised classifier to predict final grades based on activity data, that of [38] that studies the correlation between the different features from data related to the assignments of the students and the final grades with linear models, [39] that addresses the problem as an exploratory factor analysis task, or the work by [40] that combined data from an OJ with static information about the students—demographic information or academic marks obtained before enrolling in the course, among others—to predict their performance before each intermediate exam and, accordingly, suggest corrective actions with those who are likely to underperform. Note that, while successful, the main drawback of these proposals is the lack of interpretability of the derived models.
This work frames in the latter case of OJ systems for assessing coding tasks in programming courses. More precisely, our approach aims to predict the performance of the students out of the meta-information gathered from the submissions to the OJ for providing the corresponding feedback to both instructors and students. For that, we resort to both ML and MIL techniques for inferring these student profiles with the particular novelty of considering XAI approaches so that this feedback may be deemed interpretable. The next section thoroughly details the proposals.
III Proposed methodology
This work poses the following research questions related to the prediction of student performance and feedback generation in the context of OJ assignments:
Research Question 1 (RQ1):
When should students start making submissions to the OJ system?
Research Question 2 (RQ2):
How many submissions are reasonable for the success of the assignment?
Research Question 3 (RQ3):
Which would be the risk groups?
Research Question 4 (RQ4):
Are there any pieces of advice for the students to adequately address the assignments?
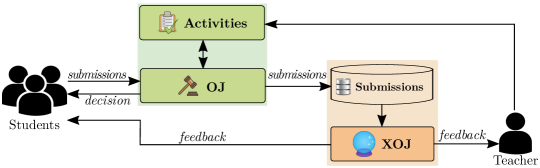
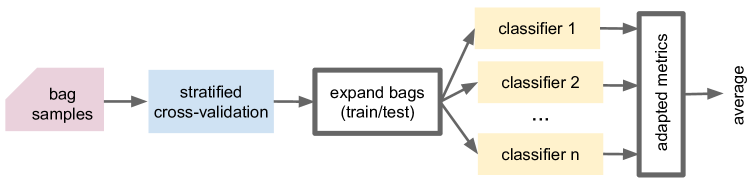
Figure 1 graphically shows the scheme proposed to quantitatively address these questions, which comprises the following steps:
-
1.
The teacher defines the different assignments to be solved by the students and configures the OJ system accordingly.
-
2.
The students address the posed task and submit their implementations.
-
3.
The OJ evaluates these submissions and provides the students a correction mark exclusively based on the evaluation of the submitted programming codes.
-
4.
Concurrently, these submissions are processed by an additional module—XOJ in the scheme—that provides feedback to both the teacher—who may adapt the difficulty of the task—and the students—who may accordingly adjust their commitment to the task. Note that this element represents the core element of the work as it is meant to model the user behaviour considering a supervised learning framework.
We consider two learning-based schemes within a supervised framework for the XOJ: (i) a first one based on an MIL methodology that considers the introduced bag-of-instances concept to model the different submissions made by the students; and (ii) a second one that proposes an adaptation of the former case to standard ML algorithms and thus enables the use of XAI techniques so that human-understandable feedback may be derived out of the learning-based model.
The rest of the section further develops the concept of MIL frameworks, introduces the need for adapting these schemes to an ML-oriented task by means of the procedure proposed in the work, and finally presents the XAI scheme devised for answering the research questions posed as well as providing interpretable feedback to the users of the system.
III-A Multi-Instance Learning (MIL)
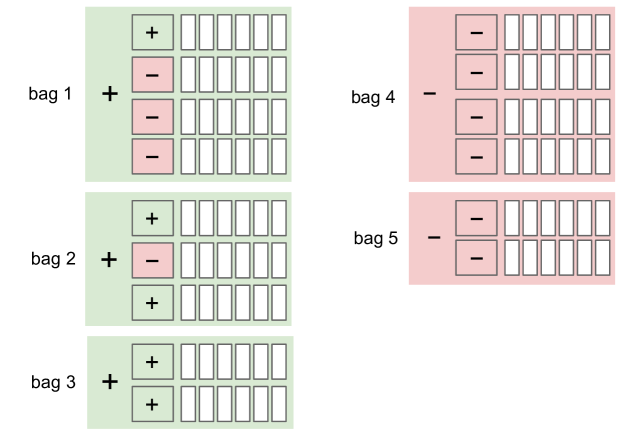
MIL represents a specific branch of supervised learning within the wider area of ML specifically devised to deal with incomplete knowledge of labels in corpora. This framework works on the basis of bags of elements, i.e., collections of instances that, as a group, represent a certain element. In this regard, bags are labelled on a binary basis—either positive or negative—and the learning goal is to predict the class of unseen bags. For a more in-depth introduction to the topic, the reader is referred to the work by [41].
During the training stage, these bags are assigned a class based on those of the individual instances within: a bag is labelled as positive if there is, at least, one positive instance in it, while it is considered negative if all instances are negative. Figure 2 exemplifies this principle.
This MIL paradigm naturally fits the scenario posed in the work since each student may be modelled as a bag where the individual instances within represent the different submissions delivered to the OJ. In line with previous works (e.g., [15, 42]), each bag is labelled as either positive or negative depending on whether the student succeeded in the assignment.
As mentioned previously, MIL frameworks generally work as black boxes, i.e., a human user can neither know nor interpret the motivation of the model to perform a certain prediction. Hence, since explainability and interpretability represent a major concern in the more general ML field, the related literature comprises a large number of XAI works for learning-based schemes [18]. Nevertheless, these techniques are not suitable for MIL scenarios, being then necessary to previously adapt them to a general ML case.
To perform such an adaptation we pose the following procedure: during the training stage, since all instances within an MIL bag are somehow represented by the class of the bag itself, we associate the individual instances after this general label and dismiss this MIL-based grouping; during the inference stage, every single instance is evaluated individually and the overall label is estimated by integrating these predictions. For this latter merging policy, this work proposes selecting the label with the maximum confidence score among the different learning-based models. It must be highlighted that initial experimentation also contemplated other statistical descriptors, being the commented maximum operator the one depicting the best overall performance.
III-B Explainable Artificial Intelligence for model interpretation
XAI techniques are typically divided into two different families [43]: (i) transparency methods, which represent the ones that directly convey the workings of the model; and (ii) post-hoc explanations, which attempt to provide justifications about the reason why the model arrived at its predictions. This work frames on the latter case since, oppositely to transparency-based approaches, they avoid the need for individually adapting each learning-based model considered for the particular task at hand.
Within this post-hoc framework, the two most common approaches rely on either performing permutations on the values of each predictor (independent variable) to assess their influence on the predictions (dependent variable); or creating an alternative and simple-to-explain linear model that mimics the behaviour of the one at issue [18].
We choose the latter family of approaches, as it generally achieves the most accurate results. More precisely, we resort to the so-called Shapley Additive Explanations (SHAP) introduced by [44], as it represents one of the most commonly considered techniques for XAI in the literature [45]. SHAP is based on the concept of Shapley values, a well-known technique in the cooperative game theory field devised to measure the individual contribution of a player to the game [46]. The gist behind SHAP relies on calculating the Shapley values for each feature or predictor of the individual sample to be interpreted, representing each of these scores the impact on the prediction generated by the feature to which it is associated.
On a practical basis, Fig. 3 conceptually shows the implemented pipeline for obtaining an interpretable prediction (feedback to be provided) for a query element (individual submission by a certain student) based on the SHAP method. Note that this process corresponds to the XOJ block depicted in the general scheme of the proposal (Fig. 1) and matches that of a typical posthoc-oriented XAI framework.
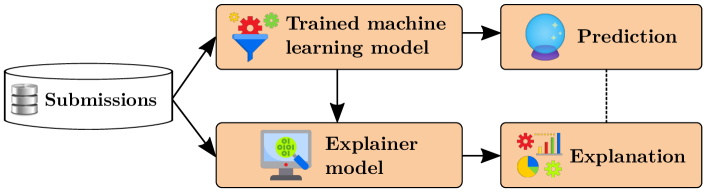
As shown in the scheme, a particular submission of a student—input data—is provided to the learning-based model; the prediction, along with the initial data, are then processed by the SHAP module that computes the corresponding Shapley values; the prediction, together with these values, are used for providing the corresponding feedback to both the student and the instructor.
IV Case of study
The case of study relates to the Programming Challenges course of the senior year of the Degree in Computer Science at the University of Alicante. The evaluation in this course relies in two three-week-long assignments, denoted as A1 and A2 in this manuscript. Note that the delivery periods are extended to compensate for the bank holidays that exist within the lapses of time stipulated for the different assignments. These two assignments deal with optimisation strategies for algorithms and data structures and, more precisely, with the use of dynamic programming—assignment A1—and branch-and-bound—assignment A2—techniques [47]. The detailed description of these tasks is provided in Appendix B.
These assignments are developed autonomously by the students with a weekly supervision of the instructor during the lecturing sessions, in which specific aspects or doubts related to the tasks are discussed. Throughout the process, the students submit their implementations to an OJ that informs about the correctness of the submitted code. This OJ is the so-called Javaluador [20], which was already introduced in Section II-A and is thoroughly described in Section IV-A due to its relevance in this work.
The data used in this case of study was collected from all the actively developing the commented course—approximately, 80% of the people enrolled in it—during three academic years (2019-2020, 2020-2021, and 2021-2022), being 2020-2021 a representative example of a remote-oriented scenario due to the COVID-19 pandemic situation. Table I presents a description of this collection in terms of the number of students, amount of submissions to the OJ, and success rate.
Year Assignment Students Attempts Average submissions per student Attempts until success (omits task failures) Total Success Failure Total Success Failure Success Failure 2019-20 A1 21 13 8 317 7.9% 92.1% 13 18 12.3 A2 18 11 7 316 7.6% 92.4% 24 8 22.2 2020-21 A1 37 31 6 626 43.3% 56.7% 17 15 8.7 A2 33 27 6 452 25.4% 74.6% 14 14 9.2 2021-22 A1 28 25 3 411 13.9% 86.1% 15 11 13.6 A2 24 21 3 431 16.7% 83.3% 17 27 13.9
IV-A Online Judge: Javaluador
The Javaluador OJ system [20] comprises a collection of over 55 open-ended optimisation problems specially designed to be addressed with dynamic programming or branch-and-bound techniques. As suggested by its name, this OJ assesses tasks implemented in the Java programming language.
The students enrolled in the course may use this bank of problems to practise and complement the theoretical contents explained during the lecture sessions since Javaluador is entirely available throughout the academic year with no time restrictions. Note that this statement does not apply to the aforementioned A1 and A2 evaluation assignments since the system restricts the submissions of these two tasks to their respective evaluation periods.
Javaluador evaluates the efficiency and correctness of the submitted programs. For this purpose, it imposes two restrictions: (i) the provided implementation must not exceed a time limit in solving the entire battery of tests designed for the problem, which is fixed to 10 seconds; and (ii) each test must not exceed a certain amount of memory, which is set to 100 MB.
Once the system has assessed the submission, the OJ provides the student with a decision about the success of the task in one of a set of 6 possibilities:111The reader is referred to Fig. 1 in which the OJ provides a decision to the student solely based on the correctness of the provided code. (i) success if the submission passed all tests considering the aforementioned time and memory constraints; (ii) test error if only a subset of the tests were successfully passed; (iii) compilation error if the program did not compile correctly—the actual error is also provided to the student—; (iv) time error if the time limit was exceeded; (v) memory error when the execution memory was exceeded; and (vi) function error when the student included functions or libraries discouraged from their use due to security and/or educational reasons.
IV-A1 Variables
In order to provide feedback about the general performance of the student within the actual assignment, our proposed XOJ makes use of the set of variables defined next. Note that these variables must be available while the student is developing the assignment. Hence, they must not refer to the overall correction of the assignment—they may include, however, the correctness of the current submission—but instead they contain information that can be provided by the OJ.
-
•
Days to deadline: Number of remaining days from the current submission until the deadline of the assignment. This variable measures the closeness to the deadline date to find out whether the student has delivered early, has had several submission periods over the duration of the problem, or has delivered very close to the end date. This descriptor is a real value in which the integer and decimal parts respectively represent the complete and the portion of the remaining days to the deadline.
-
•
First submission – days to deadline: This descriptor, which follows the same format as the Days to deadline variable, represents the number of remaining days to the deadline when the student submitted the first attempt of the assignment. Note that this value is set when a student performs the first submission to an assignment and remains constant for the subsequent submissions.
-
•
Submissions to date: Number of previous submissions made so far including the current one. This variable somehow relates to the insistence of the student in solving the tasks or, if already done, the willingness to refine them.
-
•
Submission days to date: Number of different days on which a certain student has submitted different attempts to solve the assignment.
-
•
Assignment: It represents whether the submission relates to assignment 1 (A1)—corresponding to the dynamic programming task—or to assignment 2 (A2)—corresponding to the branch-and-bound approach.
-
•
Success: It represents whether the submission belongs to a student that passed or failed the assignment.
It must be noted that, due to the different ranges in which these variables may span, a standard normalisation process is applied to avoid any possible biases in the learning-based schemes.
V Experimental setup
This section details the experimental arrangement considered in the work in terms of evaluation metrics, validation policies, and learning-based schemes. Regarding software tools, we have performed this analysis using a variety of open-source tools: Python was used as the base programming language as well as the libraries scikit-learn (v0.24.0), xgboost (v0.90), and catboost (0.24.0) to implement ML algorithms, MIL (v1.05) to implement Multi-Instance Learning approaches, and SHAP (v0.37) [48] to analyse XAI-ML aspects.
V-A Metrics
To assess the goodness of the proposal, we consider the Area Under the Receiver Operating Characteristics Curve, which is denoted as AUC in the work. This metric, which is typically considered in both classification and regression tasks involving threshold settings, penalises larger differences between the real and the predicted value [49]. Mathematically, AUC is defined as:
| (1) |
where denote the -sized spaces that respectively represent the set of prototypes labelled with 0 (failure) or 1 (success), represents the estimator obtained by the considered ML or MIL method, and denotes an indicator function that returns 1 if the condition in the argument is fulfilled and 0 otherwise. Note that the size of the vector matches the number of features used by the model, i.e., descriptors (see Section IV-A1 for the detailed description of these elements).
A commonly considered procedure to avoid biased results in the evaluation of schemes involving learning-based methods is the so-called stratified cross-validation [50]. This strategy divides the available data into a fixed number of partitions—usually denoted as folds—and uses all sets except one to train the learning-based method and the remaining set to evaluate its performance. This process is repeated as many times as the established number of folds, which results in that all data has been used both for training and evaluation. Eventually, the overall performance of the scheme is computed as the average of the individual scores obtained in the different folds.
In the particular context of this work, it must be noted that, when performing the partitioning process, all elements within a bag must always be part of the same partition. While this point may be obvious in MIL representations, when considering ML strategies in which the concept of bag disappears, all elements that were formerly part of the same bag must also be in the same partition. Otherwise, we would induce some bias in the training and evaluation of the models. Figure 4 graphically shows these ideas.
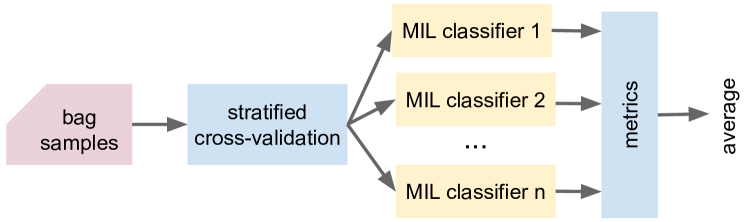
Finally, in this work, we resort to a value of 10 folds for this cross-validation approach as it represents a typical value in the related literature.
V-B Learning algorithms compared
To validate our proposal, we have considered a representative collection of learning-based methods from both the MIL and ML families of techniques. We now present the different algorithms studied, which are also summarised in Table II together with the parameters used in the experimentation.
Regarding MIL methods, we have assessed the following approaches:
-
•
Axis Parallel Rectangle (APR) [51]: Iterative discrimination algorithm that finds an axis-parallel hyper-rectangle in the feature space to represent the target concept, i.e., all the instances from positive bags.
- •
-
•
Diverse Density (DD) [54]: Method that seeks to find a concept point in the feature space close to, at least, one instance from every positive bag.
-
•
Expectation-Maximisation Diverse Density (EM-DD) [55]: Extension of the DD strategy considering an Expectation-Maximisation method.
-
•
Multiple-Instance Learning via Embedded Instance Selection (MILES) [56]: Approach that maps each bag into a feature space defined by the instances in the training bags via an instance similarity measure.
-
•
Deep Attention MIL [57]: Strategy that estimates the contribution of each instance to the overall bag label by framing the problem as learning a Bernoulli distribution in which their probabilities are parameterised by both neural networks and attention mechanisms.
In addition to this, we have also assessed the use of preprocessing techniques from the literature known as bag representations that allow tackling MIL-based tasks with binary ML classification algorithms by mapping these bag representations into instance-based feature vectors. The representative set of techniques considered comprises the introduced MILES method [56], the so-called Discriminative approach [58] and the use of basic statistical methods based on the mean aggregation of the individual instances within the bags.
Finally, we have also studied the use of standard ML methods in the proposed task. Note that, since these techniques are not directly applicable to MIL-oriented problems, we resort to the policy proposed in Section III-A that performs an MIL-to-ML adaptation. In these terms, we consider the following collection of ML algorithms:
-
•
Naive Bayes (NB) [59]: Classifier based on the Maximum A Posteriori criterion which assumes that the different features in the instances are statistically independent.
-
•
Logistic regression (LogReg) [60]: Binary classifier based on the linear combination of the predictors.
-
•
-Nearest Neighbours (NN) [53]: Non-parametric method that considers a certain dissimilarity metric for classification.
-
•
Decision Tree (DT) [61]: Classifier based on the principle of information gain that produces a tree-like model to perform the process.
-
•
Random Forest (RF) [62]: Ensemble method based on the construction of multiple DT whose individual predictions are combined based on a specific criterion, most commonly the mode of the individually estimated classes.
-
•
Adaptive Boosting (AdaBoost) [63]: Meta-classifier based on the combination of a different number of classifiers. Oppositely to RF, the individual methods are not required to be based on a certain type of classifier. In addition to this, we also consider the eXtreme Gradient Boosting (XGBoost) [64], Categorical Boosting (CatBoost) [65], and Light Gradient Boosting Machine (LGBM) [66] methods as they are based on the same principle of RF and are deemed as considerably competitive in the related literature.
-
•
Support Vector Machine (SVM) [67]: Binary classifier based on the estimation of a hyper-plane to split the two categories involved in the problem.
-
•
Multilayer Perceptron (MLP) [68]: Classifier based on a feedforward artificial neural network comprising multiple layers of perceptrons.
Type Algorithm Identifier Parameters evaluated MIL Axis Parallel Rectangle [51] APR thresh.=0.5, =0.05, step=1 Citation-NN [52] references=1; citations=3 Expectation-maximization with Diverse Density [55] EM-DD scale=1, epochs=10, thresh.=0.5 MIL via Embedded Instance Selection [56] MILES , Deep Attention MIL [57] gated=False, thresh.=0.4 ML Naive Bayes [59] NB Laplace smoothing = 1.0 Logistic regression [60] LogReg Stopping criteria tolerance = 1e-4 -Nearest Neighbours [53] NN k={1, 3, 5, 7, 9, 11} Decision tree [61] DT Split criteria = Gini impurity Random Forest [62] RaF est.={50, 100, 200, 300, 400, 500} eXtreme Gradient Boosting [64] XGBoost booster=gbtree, , max depth=6 Categorical Boosting [65] CatBoost Additive smooth = 1, iterations = 5 Light Gradient Boosting Machine [66] LGBM booster=DT, num. leaves = 31 Adaptive Boosting [63] AdaBoost estimators=50 Support vector machine [67] SVM kernel={linear, radial} Multilayer Perceptron [68] MLP 1 hidden layer with 100 neurons Bag repr. Mean + RaF est.={50, 100, 200, 300, 400, 500} Mean + LogReg Stopping criteria tolerance = 1e-4 Mean + SVM kernel={linear, radial} MILES + SVM kernel={linear, radial} Discriminative [58] + SVM kernel={linear, radial}
VI Results
This section presents the results obtained with the methodology proposed in Section III considering the case of study described in Section IV. More precisely, the different learning-based methods are initially compared in terms of the reported classification figures; after that, the capabilities of the XAI scheme proposed are examined, both in relation to the feedback provided as well as the recognition rate achieved; finally, a cohort study is performed to further provide insights about the capabilities of the proposal.
VI-A Classification results
Figure 5 shows the results obtained for the student performance prediction task—either success or failure—in terms of the AUC metric for the classification schemes and the experimental setup considered. For reference purposes, we include a Baseline case in which the prediction method always outputs the majority class in the corpus. In all cases, these values represent the average of the 10 folds in the cross-validation scheme, being the detailed figures obtained in each fold of the cross-validation assessment strategy available in Appendix A.
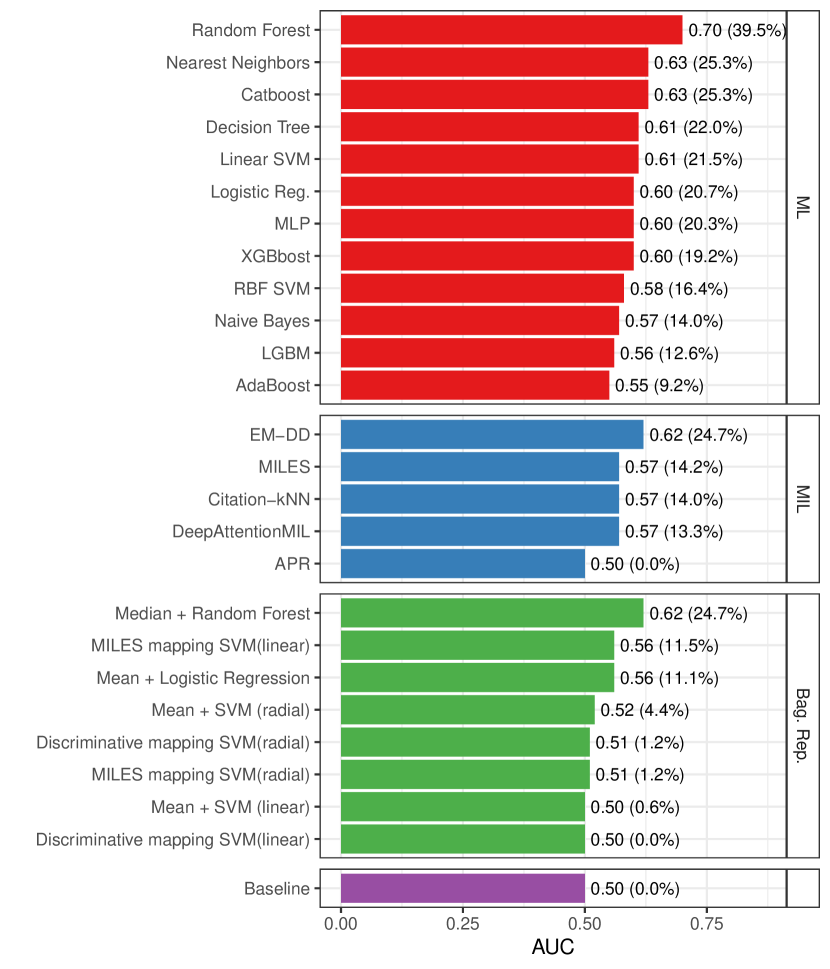
A first remark that may be observed is that most of the elements in the different families outperform the baseline considered. Attending to the relative improvements, the baseline is enhanced up to 39.5%, which means an improvement of 0.20 in absolute points.
Focusing on the ML family, it may be checked that all configurations within this group improve the baseline in a range between 9.2% and 39.5% of relative improvement. Note that the RF strategy yields the best overall result as it achieves a 0.70 of AUC score.
Regarding the MIL family, most approaches within this family also improve the base case in a range between 13.3% and 24.7% of relative boost. The sole exception to this is the APR which ties in performance with the baseline. On this note, the EM-DD yields the best classification rate with a 0.62 of AUC score.
In relation to the bag representations, most of the schemes also improve the base case of selecting the majority class. However, five out of the eight evaluated models show a marginal, or even null, increase in the performance—relative improvement between 0% and 4.4%. Within this group, the Median+Random Forest strategy obtains the best classification rate as it yields a 0.62 in the AUC score (relative improvement of 24.7%).
Attending to this, the RF scheme with the proposed MIL-to-ML mapping proves to be the best performing strategy of the different schemes and methods evaluated.
VI-A1 Significance tests
To further extend the previous analysis and provide a solid set of conclusions, we now perform a statistical evaluation of the results obtained. For that, we resort to the Wilcoxon signed-rank test [69] and carry out a pairwise comparison of the different classifiers in terms of the performance considering the individual AUC figures for each fold and classifier. Figure 6 graphically provides the results obtained when considering the statistical significance levels of 90% and 95%, respectively depicted in yellow and green colours.
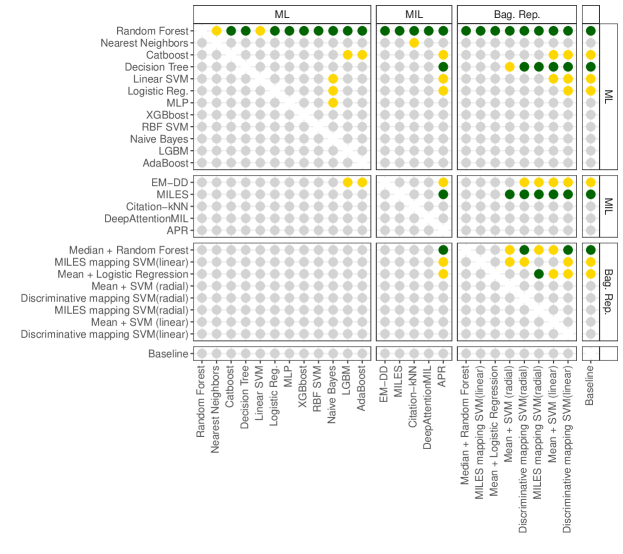
Attending to these results, a first remark to point out is that, out of each family of methods considered, only a subset of them statistically outperform the baseline considered. In general, these methods are the ones with a remarkable performance improvement in the respective families: RF, Catboost, DT, Linear SVM, and LogReg from the ML case; EM-DD and MILES from the MIL scenario; and Median + Random Forest, MILES + Linear SVM, and Mean + Logistic Regression from the bag representation. A particular exception to this assertion is the case of NN from the ML family that, despite achieving a remarkable enhancement, there is no evidence of statistical improvement, most likely due to inconsistent behaviours in the different folds. This claim about the inconsistency of NN may be checked in Appendix A, in which the values of the different folds are provided.
In general terms, the RF method from the ML family stands as the most competitive scheme among the ones assessed since it statistically outperforms the rest of techniques. Note that this improvement is observed with a confidence value of 95% in all scenarios except for two cases in which this score is lowered to 90%: the NN and the Linear SVM, also from the ML family of approaches. Due to this, we consider this RF method as the learning-based scheme for our proposal throughout the rest of the experimentation.
VI-B XAI results
The previous comparison posed the RF classifier as that which achieved the most significant and consistent improvement against both the baseline and the rest of alternatives. However, as aforementioned, the results provided by this scheme are not directly interpretable by a human, at least in a straightforward manner.222Note that, while tree-based classifiers are generally deemed as interpretable, when used as part of ensemble schemes—such as forest structures—this explainability characteristic is hindered.
In this regard, we now perform the XAI analysis from our proposal (cf. Section III) to state the influence in the outcome of the prediction method of each of the variables posed in Section IV-A1. For that, we consider the SHAP method introduced in Section III-B that estimates the impact of each independent variable on the success of the problem in terms of the Shapley values. Figure 7 shows the results of this study.
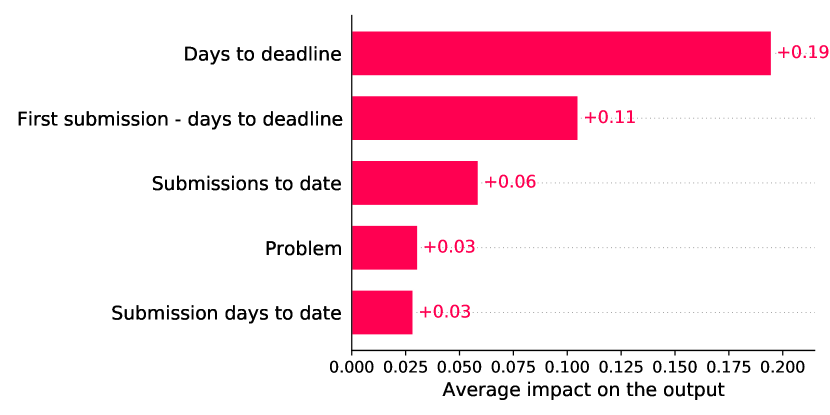
As it may be checked, the Days to deadline and First submission – days to deadline stand out as the most relevant variables as they retrieve the highest Shapley values—roughly, their scores double those of the rest of the parameters. The Submissions to date and Submission days to date variables also depict some influence on the result, while the Problem one has a marginal impact on the performance.
To further understand the influence of these variables, we now present an additional analysis of these variables. In this regard, Fig. 8 graphically shows the individual scores obtained by the different variables in an isolated manner—assuming complete statistical independence among them—for each of the submissions in the case of study.
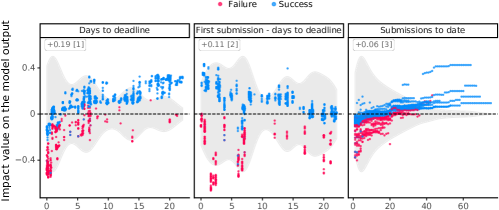
Attending to these graphs, it may be observed that when tasks are submitted close to the deadline—Days to deadline in the left graph—the system considers them as negative (vertical axis), which remarkably matches the ground-truth labels provided. Regarding the First submission – days to deadline variable—middle graph—, there is no clear trend that relates the value to the success of the task since the results show cases of both students with early submissions who eventually fail and vice versa. Finally, the Submissions to date—right graph—indicates that students submitting more than 40 attempts generally succeed in adequately solving the task. Note that this case does make sense as it corresponds to students who regularly use the system to develop the assignment.
VI-C Cohort study
The presented results in the previous sections draw general conclusions related to the relevance of the predictive variables in the output. Hence, to further extract additional insights about the reach of our proposal, this section develops a Cohort analysis of the scheme. More precisely, we consider the individual submissions by the students and divide them into different groups with related values of the variables—namely cohorts—to study their particular behaviour in the overall success of the task. Note that this grouping strategy is expected to provide some commonalities among the different student profiles based on the latent information of the submissions delivered.
In order to automatically obtain these cohorts, we resort to one of the ML approaches previously introduced: the Decision Tree (DT) model. Based on a defined information-gain criterion, this technique derives a set of interpretable rules that partitions the feature space of the collection of data at hand with the goal of maximising the classification rate. In this regard, we resort to the Gini impurity criterion to iteratively divide the initial set of samples into subsets until a maximum is reached—user parameter—as it constitutes one of the most common criteria used in DT (see Table II). Figure 9 shows the average impact of predictors when fixing a maximum of 4 cohorts. It must be highlighted that this parameter was selected as it represents a trade-off between a general view—selecting a single group—and a totally particular view—choosing as many cohorts as individuals in the population.
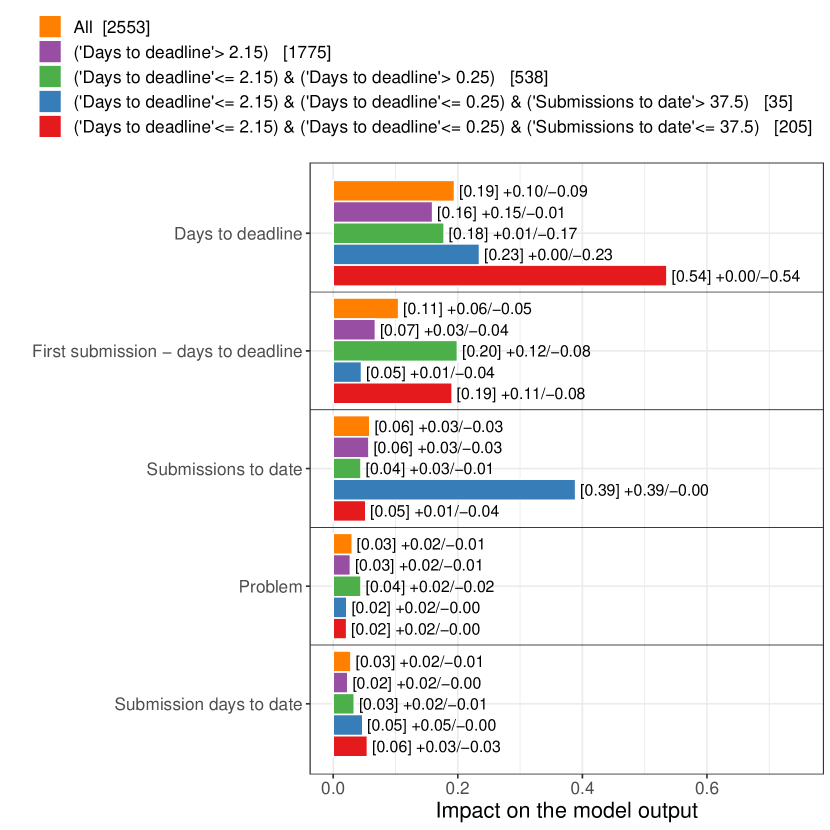
Attending to the results obtained, the ‘Days to deadline’2.15 group—namely Cohort A for its posterior analysis—proves to be mainly influenced by the Days to deadline variable as it depicts the highest impact—score of —among all the descriptors.
Regarding the ‘Days to deadline’=2.15 & ‘Days to deadline’0.25 group—denoted as Cohort B for the latter analysis—, it may be noted that it is mainly influenced by the Days to deadline and Submissions to date variables. These two descriptors respectively depict impact scores and whereas the rest of them achieve very low influence values (i.e., figures lower than ).
In the case of the ‘Days to deadline’=2.15 & ‘Days to deadline’=0.25 & ‘Submissions to date’37.5 group—namely Cohort C—it may be observed that it is highly influenced by the Submissions to date variable, mostly in positive terms—score of —with no remarkable influence from the rest of the features.
When examining the last cohort posed—‘Days to deadline’=2.15 & ‘Days to deadline’=0.25 & ‘Submissions to date’=37.5, denoted as Cohort D—, it may be observed a score of on the Days to deadline variable, hence depicting a clear impact on this cohort. While this group is also influenced by the First submission – days to deadline variable, its overall impact is not as sharp as in the former case.
In addition to the individual analysis of the cohort scores obtained, we now examine the statistical significance of these results. For that, we consider the Wilcoxon Rank-Sum Test [69] to compare the dependent variable—the performance of the scheme—against the influence score depicted by each cohort. In this case, the results considering a significance value of prove that the only significant influence is the one described for Cohort D—significance value of —while the results for Cohort B—significance of —and Cohort C—significance of —do not show any statistical differences among the distributions.
VII Discussion
Having presented the results of the different experiments posed and their corresponding analyses, this section provides a general summary and overall discussion of the main insights obtained together with the devised answers to the Research Question formulated.
As presented, the proposed methodology aims to identify student profiles—mainly, those likely to fail the proposed assignments—in the context of a programming-related course using OJ systems for the autonomous correction of the tasks. After gathering a collection of representative data comprising different tasks and academic years for this case of study, we proposed a set of hand-crafted descriptors by computing basic statistics directly retrievable from the OJ, such as the number of submissions, days to deadline, or assignment considered. Based on that, we studied different approximations to automatically model the user behaviour:
-
•
As a first approach, due to its reported success in EDM tasks, we have considered the use of MIL techniques for performing such an approximation. This case achieved a maximum score of 0.62 in the AUC figure of merit used in the work.
-
•
Methods based on the so-called bag representations achieved the same maximum success rate of 0.62 in terms of the AUC metric.
-
•
Finally, by performing the proposed method for adapting MIL representations to classic ML frameworks, we were able to boost this classification rate up to a value of 0.70 in the AUC figure of merit, which statistically outperforms all other schemes considered.
After obtaining the optimal classification strategy, we considered the use of XAI to obtain an interpretable model capable of relating the aforementioned descriptors with the actual outcome of the model. In this regard, factors such as the Number of days from the current submission to the deadline of the assignment or the Time lapse from the first submission to the deadline of the assignment proved to be highly influential while others such as the Task identifier marginally affected the outcome of the model. This point suggests that the actual success of the tasks mainly relates to the individual aspects of the student—e.g., attitude and work compromise—rather than to the inherent difficulty of the assignment.
Finally, a Cohort analysis was performed to further study the success of the assignment in relation to the descriptors considered when subdividing the initial population into groups of similar characteristics. This assessment provided some insights about prone-to-fail submissions—and eventually the students themselves—that could be tackled or, at least, warned in advance to avoid such an issue.
With all above, we may now provide the respective answers to the four Research Questions posed in Section III:
-
•
RQ1: When should students start making submissions to the OJ system?
To answer this particular question we resort to Fig. 8 that relates the impact of each submission with respect to the output variable of the model. In this regard, it may be observed that when the submissions are made up to 7 days before the deadline—variable Days to deadline—the results are mostly positive. -
•
RQ2: How many submissions are reasonable for the success of the assignment?
This second point may be also addressed by resorting to Fig. 8. In this case, attending to the number of submitted attempts to the current date—variable Submissions to date—it may be observed that the impact is mostly positive when this descriptor is above 40. -
•
RQ3: Which would be the risk groups?
To adequately solve this question and identify the risk groups we resort to the Cohort study presented in Section VI-C. In that analysis, one of the particular cohort criteria obtained reported a statistically significant influence on the outcome of the task. This group is the one represented by the condition ‘Days to deadline’ 2.15 & ‘Days to deadline’=0.25 & Submissions to date’=37.5, which stands for students who depict a scarce amount of submitted codes in a date close to the deadline of the assignment. As reported in the aforementioned section, elements within this cohort generally lead to not passing the assignment, being hence a clear risk group that should be considered by the instructor of the course. -
•
RQ4: Are there any pieces of advice for the students to adequately address the assignments?
In contrast to the previous questions, to answer this point we require a general vision of the different analyses performed in the work. As commented, students delivering the submissions earlier than a week—Days to deadline indicator—who accumulate more than 40 submissions—variable Submissions to date—typically lead to positive outcomes, disregarding the particular assignment addressed—Problem descriptor in Fig. 7. Hence, the student is recommended to start working on the assignment as soon as possible, not to desist even if a relatively large number of submissions are incorrect, and not to discourage due to the difficulty of the task.
VIII Conclusions and future work
Online Judge (OJ) systems have been largely considered in the context of programming-related courses as they provide fast and objective assessments of the code developed and submitted by the students. Despite their clear advantages, OJ systems do not generally provide the student nor the instructor with any feedback from the actual submission besides whether the provided code successfully accomplished the assignment. While this limitation is acceptable up to some extent, it would be useful for these systems to retrieve additional pieces of information that could eventually lead to the identification of student habits, patterns of behaviour, or profiles related to the success (or failure) of the task, among others. Note that, while such types of insights are deemed as key points in the educational field, the process is not currently addressable by existing OJ-based methodologies.
This work aims to tackle this limitation by resorting to the Educational Data Mining (EDM) field. For that, the proposal considers the use of learning-based schemes from the EDM area—more precisely, Multi-Instance Labelling (MIL) and classical Machine Learning (ML) formulations—to model the student behaviour based on the code submissions provided. In addition, since these frameworks do not generally provide a human-understandable feedback—which is the expected output of the method—, we propose the use of Explainable Artificial Intelligence (XAI) to obtain such interpretable feedback.
This methodology has been evaluated considering a case of study with data gathered from a programming-related course in a Computer Science degree. This collection comprises the different submissions to an OJ system of two different assignments during three academic years, comprising more than 2,500 submissions from roughly 90 different students, which represents all pupils developing the commented course and approximately, 80% of the people enrolled in it. The results obtained validate the proposal: in terms of statistical significance, the model is capable of adequately predicting the user outcome (either passing or failing the assignment) solely based on the behavioural pattern inferred by the submissions provided. Moreover, the proposal is able to identify prone-to-fail student groups, being hence possible to provide feedback to both the student and the instructor.
Future work considers the further validation of the model, both increasing the amount of data of the case of study as well as considering other alternative courses that also resort to OJ evaluation methods. In addition, we will consider the possibility of exploring the use of human factor characteristics drawn from, for instance, personality, self-efficacy, and motivation tests to boost the prediction accuracy of the system.
Acknowledgments
We would like to thank the students who participated in our study. This work has been partially funded by the “Programa Redes-I3CE de investigacion en docencia universitaria del Instituto de Ciencias de la Educacion (REDES-I3CE-2020-5069)” of the University of Alicante. The third author is supported by grant APOSTD/2020/256 from “Programa I+D+i de la Generalitat Valenciana”.
References
- [1] A. Kurnia, A. Lim, and B. Cheang, “Online judge,” Computers & Education, vol. 36, no. 4, pp. 299–315, 2001.
- [2] S. Wasik, M. Antczak, J. Badura, A. Laskowski, and T. Sternal, “A survey on online judge systems and their applications,” ACM Computing Surveys (CSUR), vol. 51, no. 1, pp. 1–34, 2018.
- [3] R. Yera and L. Martínez, “A recommendation approach for programming online judges supported by data preprocessing techniques,” Applied Intelligence, vol. 47, no. 2, pp. 277–290, 2017.
- [4] B. Cheang, A. Kurnia, A. Lim, and W.-C. Oon, “On automated grading of programming assignments in an academic institution,” Computers & Education, vol. 41, no. 2, pp. 121–131, 2003.
- [5] L. M. Regueras, E. Verdu, M. F. Munoz, M. A. Perez, J. P. de Castro, and M. J. Verdu, “Effects of competitive e-learning tools on higher education students: A case study,” IEEE Transactions on Education, vol. 52, no. 2, pp. 279–285, 2009.
- [6] A. Mani, D. Venkataramani, J. Petit Silvestre, and S. Roura Ferret, “Better feedback for educational online judges,” in Proceedings of the 6th International Conference on Computer Supported Education, Volume 2: Barcelona, Spain, 1-3 April, 2014. SciTePress, 2014, pp. 176–183.
- [7] R. Asif, A. Merceron, S. A. Ali, and N. G. Haider, “Analyzing undergraduate students’ performance using educational data mining,” Computers & Education, vol. 113, pp. 177–194, 2017.
- [8] X. Zhang and Y. Kang, “Examining and predicting teacher professional development by machine learning methods,” in International Conference on Neural Computing for Advanced Applications. Springer, 2021, pp. 255–269.
- [9] C. C. Gray and D. Perkins, “Utilizing early engagement and machine learning to predict student outcomes,” Computers & Education, vol. 131, pp. 22–32, 2019.
- [10] J. R. Rico-Juan, A.-J. Gallego, and J. Calvo-Zaragoza, “Automatic detection of inconsistencies between numerical scores and textual feedback in peer-assessment processes with machine learning,” Computers & Education, vol. 140, p. 103609, 2019.
- [11] S. Alturki, N. Alturki, and H. Stuckenschmidt, “Using educational data mining to predict students’ academic performance for applying early interventions,” Journal of Information Technology Education: Innovations in Practice, vol. 20, no. 1, pp. 121–137, 2021.
- [12] J. Foulds and E. Frank, “A review of multi-instance learning assumptions,” The knowledge engineering review, vol. 25, no. 1, pp. 1–25, 2010.
- [13] M.-L. Zhang, “Generalized multi-instance learning: Problems, algorithms and data sets,” in 2009 WRI Global Congress on Intelligent Systems, vol. 3. IEEE, 2009, pp. 539–543.
- [14] S. Anupama Kumar and M. N. Vijayalakshmi, Efficiency of Multi-instance Learning in Educational Data Mining. Singapore: Springer, 2018, pp. 47–64.
- [15] A. Zafra, C. Romero, and S. Ventura, “Multi-instance learning versus singleinstance learning for predicting the student’s performance,” Handbook of Educational Data Mining, pp. 187–200, 2010.
- [16] T. Komárek, J. Brabec, and P. Somol, “Explainable multiple instance learning with instance selection randomized trees,” in Joint European Conference on Machine Learning and Knowledge Discovery in Databases. Springer, 2021, pp. 715–730.
- [17] N. Burkart and M. F. Huber, “A survey on the explainability of supervised machine learning,” Journal of Artificial Intelligence Research, vol. 70, pp. 245–317, 2021.
- [18] A. B. Arrieta, N. Díaz-Rodríguez, J. Del Ser, A. Bennetot, S. Tabik, A. Barbado, S. García, S. Gil-López, D. Molina, R. Benjamins et al., “Explainable Artificial Intelligence (XAI): Concepts, taxonomies, opportunities and challenges toward responsible AI,” Information Fusion, vol. 58, pp. 82–115, 2020.
- [19] J. B. Hext and J. W. Winings, “An automatic grading scheme for simple programming exercises,” Commun. ACM, vol. 12, no. 5, p. 272–275, May 1969.
- [20] R. C. Carrasco, J. R. Rico-Juan, and M. Á. Varó, “Aprendizaje de algoritmia mediante desafíos de programación,” in XVI Jornadas de Enseñanza Universitaria de la Informática. Universidade de Santiago de Compostela. Escola Técnica Superior d’Enxeñaría, 2010, pp. 519–522.
- [21] J. L. Bez, N. A. Tonin, and P. R. Rodegheri, “Uri online judge academic: A tool for algorithms and programming classes,” in 2014 9th International Conference on Computer Science Education, 2014, pp. 149–152.
- [22] L. Wen-xin and G. Wei, “Peking university oneline judge and its applications,” Journal of Changchun Post and Telecommunication Institute, vol. 2, 2005.
- [23] C. A. Higgins, G. Gray, P. Symeonidis, and A. Tsintsifas, “Automated assessment and experiences of teaching programming,” J. Educ. Resour. Comput., vol. 5, no. 3, p. 5–es, Sep. 2005.
- [24] H. Sun, B. Li, and M. Jiao, “Yoj: An online judge system designed for programming courses,” in 2014 9th International Conference on Computer Science Education, 2014, pp. 812–816.
- [25] A. Kosowski, M. Małafiejski, and T. Noiński, “Application of an online judge & contester system in academic tuition,” in Advances in Web Based Learning – ICWL 2007, H. Leung, F. Li, R. Lau, and Q. Li, Eds. Berlin, Heidelberg: Springer Berlin Heidelberg, 2008, pp. 343–354.
- [26] R. H. de Boer and C. P. de Campos, “A retrospective overview of international collegiate programming contest data,” Data in Brief, vol. 25, p. 104382, 2019.
- [27] M. A. Revilla, S. Manzoor, and R. Liu, “Competitive learning in informatics: The UVa online judge experience,” Olympiads in Informatics, vol. 2, no. 10, pp. 131–148, 2008.
- [28] S. Alturki, I. Hulpuș, and H. Stuckenschmidt, “Predicting academic outcomes: A survey from 2007 till 2018,” Technology, Knowledge and Learning, pp. 1–33, 2020.
- [29] M. Adnan, A. Habib, J. Ashraf, S. Mussadiq, A. A. Raza, M. Abid, M. Bashir, and S. U. Khan, “Predicting at-risk students at different percentages of course length for early intervention using machine learning models,” IEEE Access, vol. 9, pp. 7519–7539, 2021.
- [30] B. Cabral and Á. Figueira, “On the development of a model to prevent failures, built from interactions with moodle,” in Advances in Web-Based Learning – ICWL 2019, M. A. Herzog, Z. Kubincová, P. Han, and M. Temperini, Eds. Cham: Springer International Publishing, 2019, pp. 352–356.
- [31] S. N. Liao, D. Zingaro, K. Thai, C. Alvarado, W. G. Griswold, and L. Porter, “A robust machine learning technique to predict low-performing students,” ACM Trans. Comput. Educ., vol. 19, no. 3, Jan. 2019.
- [32] M. C. Jadud, “Methods and tools for exploring novice compilation behaviour,” in Proceedings of the Second International Workshop on Computing Education Research, ser. ICER ’06. New York, NY, USA: Association for Computing Machinery, 2006, p. 73–84.
- [33] B. A. Becker, “A new metric to quantify repeated compiler errors for novice programmers,” in Proceedings of the 2016 ACM Conference on Innovation and Technology in Computer Science Education, ser. ITiCSE ’16. New York, NY, USA: Association for Computing Machinery, 2016, p. 296–301.
- [34] C. Watson, F. W. Li, and J. L. Godwin, “Predicting performance in an introductory programming course by logging and analyzing student programming behavior,” in 2013 IEEE 13th International Conference on Advanced Learning Technologies, 2013, pp. 319–323.
- [35] A. S. Carter, C. D. Hundhausen, and O. Adesope, “The normalized programming state model: Predicting student performance in computing courses based on programming behavior,” in Proceedings of the Eleventh Annual International Conference on International Computing Education Research, ser. ICER ’15. New York, NY, USA: Association for Computing Machinery, 2015, p. 141–150.
- [36] E. S. Tabanao, M. M. T. Rodrigo, and M. C. Jadud, “Predicting at-risk novice Java programmers through the analysis of online protocols,” in Proceedings of the Seventh International Workshop on Computing Education Research, ser. ICER ’11. New York, NY, USA: Association for Computing Machinery, 2011, p. 85–92.
- [37] K. Castro-Wunsch, A. Ahadi, and A. Petersen, “Evaluating neural networks as a method for identifying students in need of assistance,” in Proceedings of the 2017 ACM SIGCSE Technical Symposium on Computer Science Education, ser. SIGCSE ’17. New York, NY, USA: Association for Computing Machinery, 2017, p. 111–116.
- [38] F. D. Pereira, A. Toda, E. H. T. Oliveira, A. I. Cristea, S. Isotani, D. Laranjeira, A. Almeida, and J. Mendonça, “Can we use gamification to predict students’ performance? a case study supported by an online judge,” in Intelligent Tutoring Systems, V. Kumar and C. Troussas, Eds. Cham: Springer International Publishing, 2020, pp. 259–269.
- [39] B. Xu, S. Yan, X. Jiang, and S. Feng, “SCFH: A Student Analysis Model to Identify Students’ Programming Levels in Online Judge Systems,” Symmetry, vol. 12, no. 4, 2020.
- [40] D. Azcona, I.-H. Hsiao, and A. F. Smeaton, “Detecting students-at-risk in computer programming classes with learning analytics from students’ digital footprints,” User Modeling and User-Adapted Interaction, vol. 29, no. 4, pp. 759–788, 2019.
- [41] J. Amores, “Multiple instance classification: Review, taxonomy and comparative study,” Artificial intelligence, vol. 201, pp. 81–105, 2013.
- [42] A. Zafra and S. Ventura, “Multi-instance genetic programming for predicting student performance in web based educational environments,” Applied Soft Computing, vol. 12, no. 8, pp. 2693–2706, 2012.
- [43] E. M. Kenny, C. Ford, M. Quinn, and M. T. Keane, “Explaining black-box classifiers using post-hoc explanations-by-example: The effect of explanations and error-rates in xai user studies,” Artificial Intelligence, vol. 294, p. 103459, 2021.
- [44] S. M. Lundberg and S.-I. Lee, “A unified approach to interpreting model predictions,” in Advances in Neural Information Processing Systems, 2017, pp. 4765–4774.
- [45] D. Fryer, I. Strümke, and H. Nguyen, “Shapley values for feature selection: The good, the bad, and the axioms,” IEEE Access, vol. 9, pp. 144 352–144 360, 2021.
- [46] A. E. Roth, The Shapley value: essays in honor of Lloyd S. Shapley. Cambridge University Press, 1988.
- [47] N. Wirth, Algorithms & data structures. Prentice-Hall, Inc., 1985.
- [48] S. Lundberg, “Shap (shapley additive explanations),” https://github.com/slundberg/shap, 2019.
- [49] R. O. Duda, P. E. Hart, and D. G. Stork, Pattern Classification, 2nd ed. Wiley, 2001.
- [50] T. M. Mitchell, Machine Learning. New York: McGraw-Hill, 1997.
- [51] T. G. Dietterich, R. H. Lathrop, and T. Lozano-Pérez, “Solving the multiple instance problem with axis-parallel rectangles,” Artificial intelligence, vol. 89, no. 1-2, pp. 31–71, 1997.
- [52] J. Wang and J.-D. Zucker, “Solving multiple-instance problem: A lazy learning approach,” in Proceedings of the International Conference on Machine Learning. Morgan Kaufmann, 2000, pp. 1119–1126.
- [53] T. M. Cover and P. E. Hart, “Nearest neighbor pattern classification,” Information Theory, IEEE Transactions on, vol. 13, no. 1, pp. 21–27, 1967.
- [54] O. Maron and T. Lozano-Pérez, “A framework for multiple-instance learning,” Advances in neural information processing systems, pp. 570–576, 1998.
- [55] Q. Zhang and S. A. Goldman, “EM-DD: An improved multiple-instance learning technique,” in Advances in neural information processing systems, 2001, pp. 1073–1080.
- [56] Y. Chen, J. Bi, and J. Z. Wang, “MILES: Multiple-instance learning via embedded instance selection,” IEEE Transactions on Pattern Analysis and Machine Intelligence, vol. 28, no. 12, pp. 1931–1947, 2006.
- [57] M. Ilse, J. Tomczak, and M. Welling, “Attention-based deep multiple instance learning,” in International Conference on Machine Learning (ICML). PMLR, 2018, pp. 2127–2136.
- [58] J. Wu, S. Pan, X. Zhu, C. Zhang, and X. Wu, “Multi-instance learning with discriminative bag mapping,” IEEE Transactions on Knowledge and Data Engineering, vol. 30, no. 6, pp. 1065–1080, 2018.
- [59] G. I. Webb, Naïve Bayes. Boston, MA: Springer US, 2010, pp. 713–714.
- [60] S. Menard, Applied logistic regression analysis. Sage, 2002, vol. 106.
- [61] L. Breiman, Classification and regression trees. Routledge, 2017.
- [62] ——, “Random forests,” Machine learning, vol. 45, no. 1, pp. 5–32, 2001.
- [63] Y. Freund and R. E. Schapire, “A decision-theoretic generalization of on-line learning and an application to boosting,” Journal of computer and system sciences, vol. 55, no. 1, pp. 119–139, 1997.
- [64] T. Chen and C. Guestrin, “XGBoost: A Scalable Tree Boosting System,” CoRR, vol. abs/1603.02754, 2016.
- [65] A. V. Dorogush, V. Ershov, and A. Gulin, “Catboost: gradient boosting with categorical features support,” arXiv preprint arXiv:1810.11363, 2018.
- [66] G. Ke, Q. Meng, T. Finley, T. Wang, W. Chen, W. Ma, Q. Ye, and T.-Y. Liu, “Lightgbm: A highly efficient gradient boosting decision tree,” Advances in neural information processing systems, vol. 30, pp. 3146–3154, 2017.
- [67] C. Cortes and V. Vapnik, “Support-vector networks,” Machine Learnning, vol. 20, no. 3, pp. 273–297, Sep. 1995.
- [68] G. E. Hinton, “Connectionist learning procedures,” in Machine Learning, Volume III. Elsevier, 1990, pp. 555–610.
- [69] F. Wilcoxon, “Individual comparisons by ranking methods,” Biometrics bulletin, vol. 1, no. 6, pp. 80–83, 1945.
![[Uncaptioned image]](/html/2402.03948/assets/figures/foto_jrr.jpg) |
Juan Ramón Rico-Juan is a Doctor in Computer Science Engineering (2001). Regarding his experience as a researcher, his main interest is related to pattern recognition and machine learning (learning with structured data, editing distances, selection and generation of prototypes, deep neural networks, etc.) in which I have participated in 8 national projects that have resulted in 28 publications in high impact journals (JCR) and 17 in international conferences. |
![[Uncaptioned image]](/html/2402.03948/assets/figures/photo_vmsc.jpg) |
Víctor M. Sánchez-Cartagena obtained his PhD in Computer Science in 2015. Since 2020, he has been an Assistant Professor at the Department of Software and Computing Systems at Universitat d’Alacant, Spain. His main fields of research are deep learning and machine translation with an emphasis on low-resource languages and hybrid approaches that combine multiple systems and/or sources of information. He is the author of more than 10 indexed publications, which include top conferences for natural language processing. |
![[Uncaptioned image]](/html/2402.03948/assets/figures/photo_jjvm.png) |
Jose J. Valero-Mas obtained the M.Sc. in Telecommunications Engineering from the University Miguel Hernández of Elche in 2012, the M.Sc. in Sound and Music Computing from the Universitat Pompeu Fabra in 2013, and the Ph.D. in Computer Science from the University of Alicante in 2017. He is currently a postdoctoral researcher with a grant from the Valencian Government at the Department of Software and Computing Systems of the University of Alicante, Spain. His research interests include Pattern Recognition, Machine Learning, Music Information Retrieval, and Signal Processing for which he has co-authored more than 30 works within international journals, conference communications, and book chapters. |
![[Uncaptioned image]](/html/2402.03948/assets/figures/photo_ajg.jpg) |
Antonio Javier Gallego is an associate professor in the Department of Software and Computing Systems at the University of Alicante, Spain. He received B.Sc. & M.Sc. degrees in Computer Science from the University of Alicante in 2004, and a PhD in Computer Science and Artificial Intelligence from the same university in 2012. He has been a researcher on 15 research projects funded by both the Spanish Government and private companies. He has authored more than 60 works published in international journals, conferences and books. His research interests include Deep Learning, Pattern Recognition, Computer Vision, and Remote Sensing. |