"Life" of dust originating from the irregular satellites of Jupiter
Abstract
The irregular satellites of Jupiter produce dust particles through the impact of interplanetary micrometeoroids. In this paper, the dynamics of these particles is studied by both high-accuracy numerical simulation and analytical theory, in order to learn their transport, final fate and spatial distribution. The perturbation forces that are considered in our dynamical model include the solar radiation pressure, solar gravity, Poynting-Robertson drag, Jovian oblateness and the Galilean satellites’ gravity. The trajectories of different size particles are simulated until they hit Jupiter, the Galilean satellites or escape from the Jovian system. The average dynamical lifetimes of dust with different grain sizes are calculated, and the final fate of dust particles is reported and analyzed. The steady-state spatial number density of particles is estimated by integrating the trajectories of dust particles over their initial size distribution, and compared to the previous work. The impact sites of dust on Callisto’s surface are recorded and provide an important clue for the study of the hemisphere asymmetry of Callisto. Besides, the mass accretion rate, cross-sectional area influx and mass influx density of dust on Callisto are calculated. A ring outside the orbit of Callisto dominated by dust between 2 and 25 m from Jupiter’s irregular satellites is suggested, with the average normal geometric optical depth on the order of and the configuration of the ring ansae similar to Jupiter’s gossamer rings.
keywords:
celestial mechanics – meteorites, meteors, meteoroids – planets and satellites: rings.1 Introduction
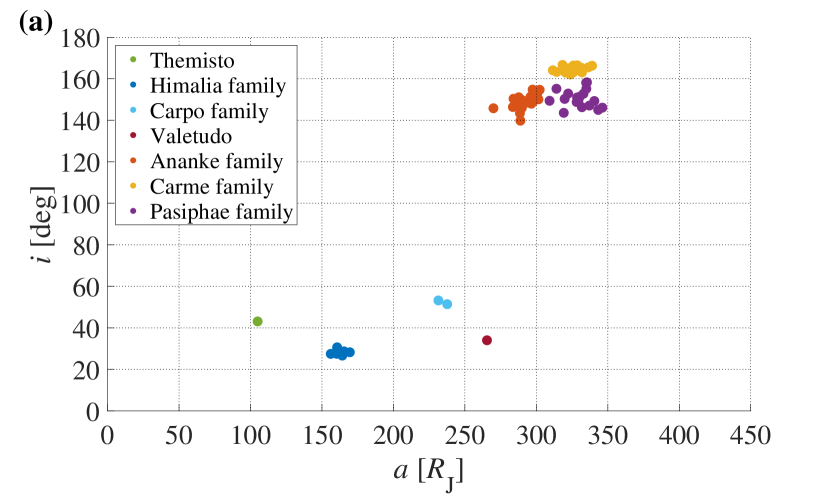
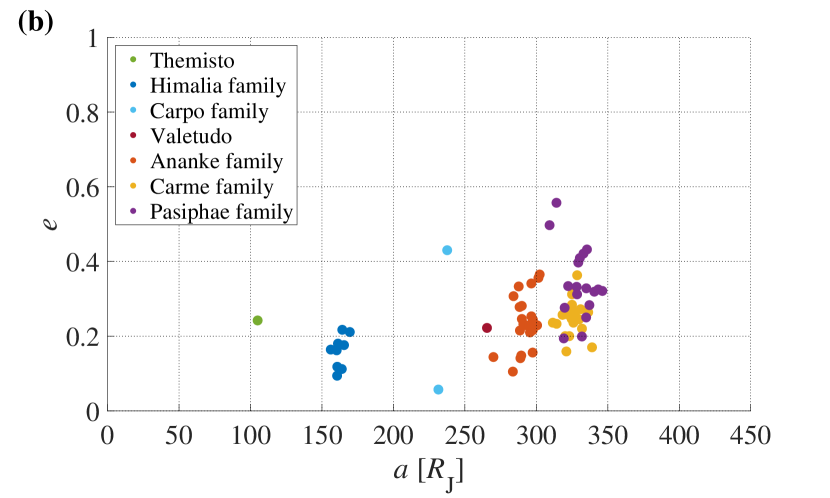
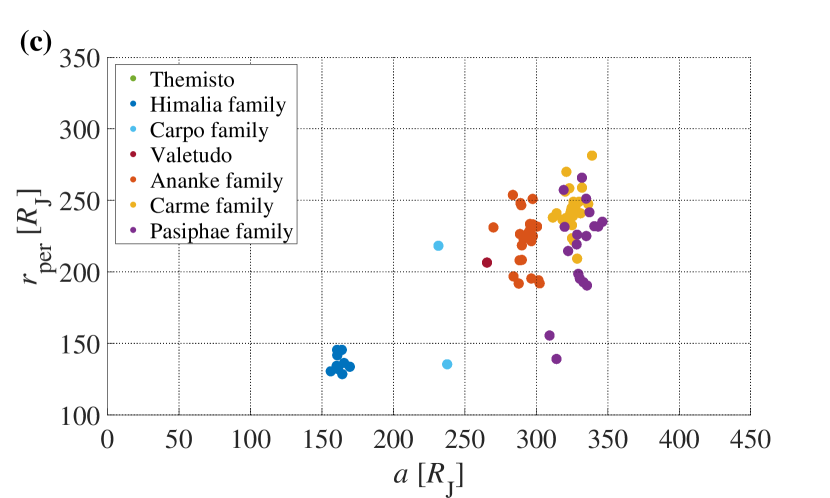
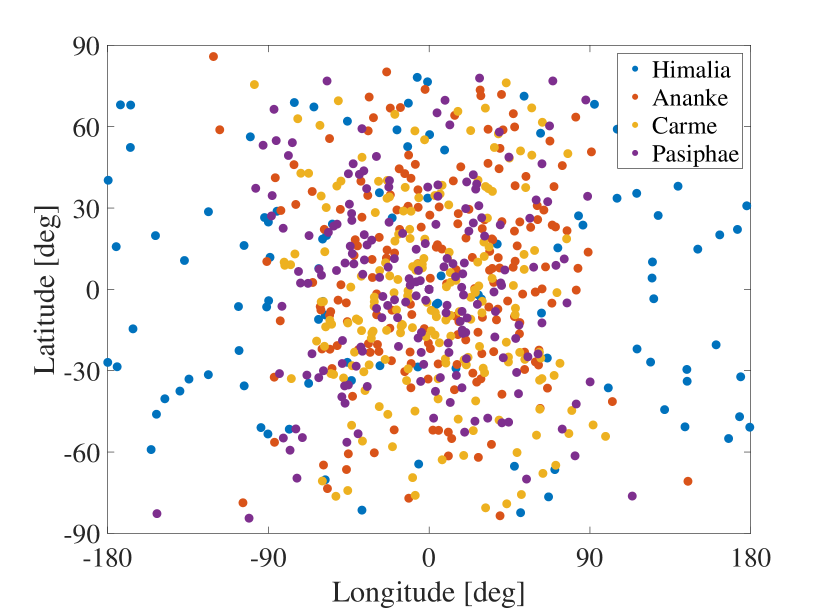
Jupiter has a lot of small irregular satellites located far from the central planet and generally with large inclinations and eccentricities (see Fig. 1). As other airless celestial bodies in the universe, these moons are constantly bombarded by high-speed interplanetary micrometeoroids to generate a large amount of dust, which has complicated dynamical evolution under the effect of various perturbation forces. Data obtained by the Galileo dust detector system (DDS) indicates that dust originating from the irregular satellites travels in the outer region of Jupiter (50-300 Jovian radii, Krivov et al., 2002), and the recent reanalysis of the DDS data suggests that particles from the irregular moons may also contribute to the dust in the territories of Galilean satellites Soja et al. (2015).
However, there are not many studies on the dynamics of dust ejected from Jupiter’s irregular satellites. To compare with the DDS data, Krivov et al. (2002) analyzed the motion of dust particles by a simplified analytical model with numerical simulations over less than a million years, which mainly considered the influence induced by solar radiation pressure and solar gravity. The long-term numerical integration of irregular satellite debris was applied by Bottke et al. (2013) to explore their accretion on the Galilean moons. Less attention was paid to the fate of small dust particles and their spatial distribution. Besides, the recent observed “Phoebe” ring Verbiscer et al. (2009), which is thought to be formed by the dust released from the Saturn’s irregular moon Phoebe, enlightens us to seek whether Jupiter has a similar ring structure.
In this paper, the dynamical evolution of dust particles with 12 different grain sizes between 1 and 500 m originating from four groups of Jupiter’s irregular satellites is simulated with high-accuracy numerical integrations. The average dynamical lifetimes of different size particles are calculated and analyzed theoretically. The final fate of dust from different satellite families is investigated by analyzing the distribution of orbital elements of dust. The trajectories of dust grains with different sizes are integrated over their initial size distribution to estimate the steady-state number density of dust in the Jovian system. The impact sites of dust particles on Callisto’s surface are recorded, and the mass accretion rate, cross-sectional area influx and mass influx density of dust on Callisto are calculated. The normal and edge-on geometric optical depths of the ring outside the orbit of Callisto are estimated, and the contributions of dust from different satellite families to the ring are evaluated.
This paper is organized as follows. The production rate and initial size distribution of dust from Jupiter’s irregular satellites are derived in Section 2. The dynamical model and simulation procedure are described in Section 3. In Section 4, the numerical simulation results, including the average dynamical lifetimes, the final fate of dust, the spatial number density, the impact sites and the accretion of dust on Callisto’s surface, and the geometric optical depth, are presented and analyzed. Finally, the summary of our work is given in Section 5.
2 Depart from irregular satellites
2.1 Production rate
The impact-ejection process, one of the major source of the circumplanetary dust, has been well-studied. We use the formula derived by Krivov et al. (2003) to estimate the production rate of dust ejected from the surfaces of Jupiter’s irregular satellites, which reads
| (1) |
Here is the mass flux of the impactor, is the ejecta yield which depends on the composition of the target’s surface and projectile’s speed and mass, and is the cross-sectional area of the target bodies suffered to impact.
When taking into account the effect of the gravitational focusing by Jupiter, the mass flux of the interplanetary micrometeoroids and its corresponding average velocity in the Jupiter system read Spahn et al. (2006)
|
|
(2) |
| (3) |
Here is the distance of the target moon relative to Jupiter, which is taken as the moon’s semimajor axis approximately, and are the mass flux and the average velocity of the interplanetary dust particles at the heliocentric distance of Jupiter without considering the gravitational focusing by Jupiter, respectively, the values of which are adopted from Poppe (2016). The variable is the gravitational constant, and is the mass of Jupiter. It is obvious from Equations (2-3) that the effect of the gravitational focusing by Jupiter is stronger at a closer distance to Jupiter.
The ejecta yield is calculated by the empirical formula Koschny & Grün (2001a, b)
|
|
(4) |
Here the surfaces of the satellites are assumed to be mixtures of silicate and ice, and are the densities of silicate and ice, respectively, and is the typical mass of the impactor (Krivov et al., 2003). The variable is the fraction of silicate in the satellite’s surface material, the value of which can be estimated by the formula Koschny & Grün (2001a, b)
| (5) |
where is the density of the target moon.
The values of , , , , , , and of four main families, which are named of their respective largest moons, i.e. Himalia, Ananke, Carme and Pasiphae, are calculated and listed in Table 1. It is seen that the mass production rate of dust from the prograde Himalia family is much greater than those of the three retrograde families, which is due to the stronger gravitational focusing effect by Jupiter on interplanetary particles in the Himalia region and the larger of the Himalia group.
| Satellite family | Type of orbit | |||||||
|---|---|---|---|---|---|---|---|---|
| Himalia | prograde | 160.3 | 1.63 | 7.55E10 | 5.98 | 2.61E-16 | 8.72E1 | 1.70E-3 |
| Ananke | retrograde | 297.6 | 1.30 | 6.22E9 | 5.06 | 1.87E-16 | 1.14E2 | 1.33E-4 |
| Carme | retrograde | 327.4 | 1.63 | 9.85E9 | 4.95 | 1.79E-16 | 5.47E1 | 9.65E-5 |
| Pasiphae | retrograde | 330.4 | 1.70 | 1.56E10 | 4.94 | 1.78E-16 | 4.90E1 | 1.36E-4 |
2.2 Initial size distribution
The initial size distribution of ejected particles is assumed to follow a power law,
| (6) |
where is the number of dust particles that are ejected per unit time in the size range of [, ], is the normalization constant, and is the exponent adopted from Horányi et al. (2015), which was obtained from the in-situ measurements in the lunar dust environment. By normalizing the distribution to the production rate
| (7) |
we can get
| (8) |
Here , are the maximal and minimal radii of ejected particles, and is the dust’s bulk density which is assumed to be the same as that of the parent moon (see Table 1).
3 dynamical simulation
3.1 The equation of dust’s motion
The escape velocities of Jupiter’s irregular satellites are very low due to their small sizes. Even for the largest irregular moon Himalia, the escape velocity is only about . Therefore, almost all of the ejecta can escape from Jupiter’s irregular satellites.
After leaving the parent bodies, dust is subject to various forces. Solar radiation pressure is important for small particles Burns et al. (1979), and solar gravity is also a significant perturbation since the irregular satellites are far from the Jupiter Hamilton & Krivov (1996). Poynting-Robertson drag (PR drag) leads dust to migrate toward the central planet slowly Burns et al. (1979). The Jovian oblateness and gravitational perturbations from the outer Galilean satellites also need to be considered. In this work, the motion of dust particles for 12 grain sizes in the range of m is simulated in the Jovian equatorial inertial frame (JIF). The -axis of JIF points to the ascending node of Jupiter’s orbit, the -axis is along the spin axis of Jupiter, and the -axis is defined by right-hand rule. The equation of dust particle’s motion in JIF is expressed as
| (9) |
where is the radius vector of the grain, the solar flux at Jupiter’s distance, the cross-section of particle, the dust’s mass, the solar radiation pressure coefficient calculated by Mie calculation (Burns et al., 1979), the radius vector of the Sun, the speed of light, and the unit vector from the Sun to the dust. The variable is the mass of the Sun, the Jupiter’s zonal harmonic of degree 2, the second-degree Legendre function, the colatitude in the Jupiter-centered body-fixed frame, and the mass of Galilean satellite.
The term of Jupiter’s gravity is omitted in our simulation, because (-) is about two orders of magnitude lower than (-) (Durante et al., 2020) and the Jovian irregular satellites are far away from Jupiter (> 100 as shown in Fig. 1). Besides, only the gravitational perturbations from the outer Galilean satellites Callisto and Ganymede are included during numerical integration in order to save the computing resources. This simplification is reasonable since most of the dust particles are eliminated by these two moons once dust get close to their territories Bottke et al. (2013); Haghighipour & Jewitt (2008).
3.2 Simulation setting
The escape velocities of Jupiter’s irregular satellites are much smaller than their orbital velocities because of their small sizes (e.g. escape velocity vs. orbital velocity for Jupiter’s largest irregular satellite Himalia). Besides, the ejection velocity of impact-generated ejecta approximately follows a power law distribution (Housen & Holsapple, 2011), which means that the proportion of ejecta with speeds much higher than the escape velocity of the parent moon is very small. Thus, it is expected that the initial orbital elements of most ejected particles are approximately equal to those of the parent satellites at one individual osculating orbital position of the satellites.
It should also be noted that the semimajor axes , eccentricities and inclinations of Jupiter’s irregular satellites evolve and vary greatly over one thousand years Brozović & Jacobson (2017). In order to include this effect, 200 particles for each grain size are simulated, with different initial orbital elements, where the initial , , and are randomly distributed within their respective variation ranges of the corresponding parent satellite families (see Table 2). Ten different values of both initial argument of pericenter and initial longitude of ascending node are taken uniformly in the range of , because both and are precessing with time. The initial true anomalies of ejecta are also randomly chosen within . Based on our selection of initial orbital elements, the distributions of both initial orbital velocities and initial spatial positions of dust around Jupiter cover broad ranges.
Trajectories of dust particles with broad ranges of initial orbital velocities and initial spatial positions are simulated by using a well-tested code (see Liu et al., 2016; Liu & Schmidt, 2018, 2021) to integrate the equation of motion shown in Section 3.1. The orbits of dust grains are integrated until they hit a sink (impact Galilean moons, Jupiter or escape from the Jovian system).
| Himalia | Ananke | Carme | Pasiphae | |
|---|---|---|---|---|
| 155-175 | 270-310 | 305-345 | 310-350 | |
| 0.1-0.3 | 0-0.5 | 0.1-0.45 | 0.1-0.7 | |
| 25-30 | 140-155 | 160-170 | 140-160 |
Note that for large particles (m), the PR drag is multiplied by a factor related to the grain size in the numerical integration in order to speed up the simulation, which reads
| (10) |
Here is the acceleration due to the PR drag, and is the grain-size-dependent enhancement factor. The similar method was used in the studies of Jupiter’s gossamer rings Burns et al. (1999) and Saturn’s Phoebe ring Hamilton et al. (2015).
4 simulation results
4.1 Average dynamical lifetimes of particles
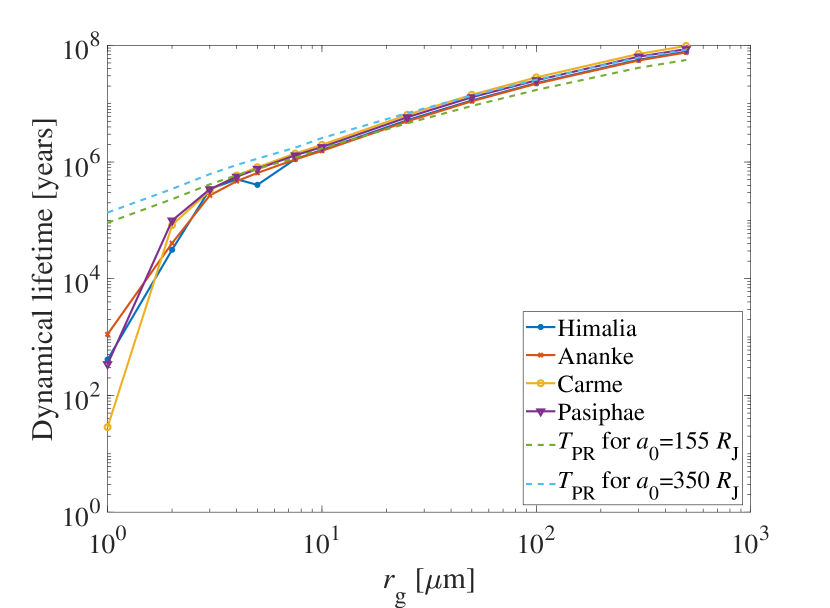
The average dynamical lifetimes of dust with different sizes (Fig. 2) are easily obtained from our numerical simulations. The dynamical lifetimes of 1 m grains are short, which are on the order of 100 to 1000 years. As the grain size increases, its lifetime gets longer. The growth rate of dynamical lifetimes between 1 and 3 m is faster, but slower for dust larger than 3 m. Large particles (m) can survive in space over a million years.
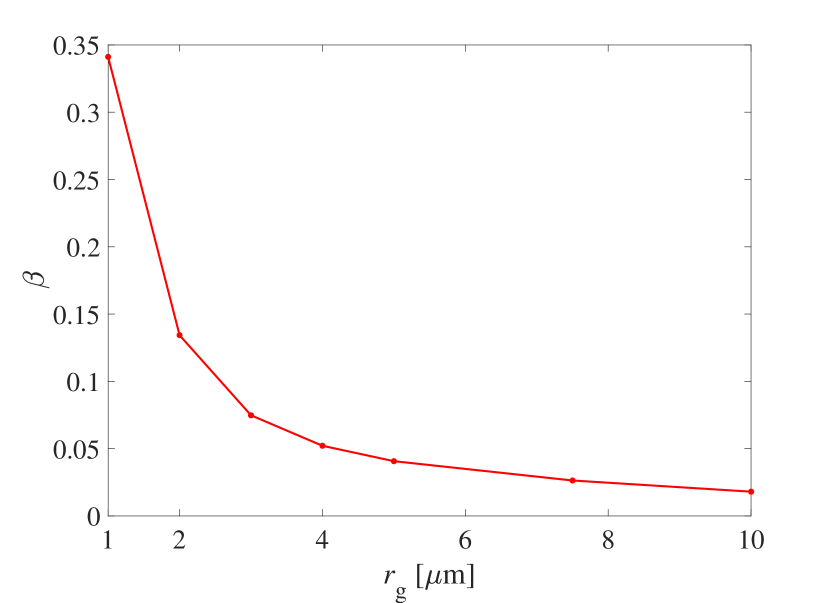
The effect of solar radiation pressure is strong for dust smaller than a few micrometers. The ratio of solar radiation pressure to solar gravity reads Burns et al. (1979)
| (11) |
where is the solar flux at one (astronomical unit). As shown in Fig. 3, the value of is largest at 1 m and decreases as the grain size increases, where the rate of decay is faster between 1 and 3 m and slower for dust larger than 3 m. The larger value of implies the stronger influence of solar radiation pressure, which causes a larger amplitude of the eccentricity oscillation Hamilton & Krivov (1996). Therefore, 1 m particles are quickly removed by striking into Jupiter or escaping from the Jovian system due to their extremely large eccentricities, and thus have a short dynamical lifetime. As the solar radiation pressure diminishes, the dust’s lifetime increases.
The dynamical lifetime of dust larger than a few micrometers is approximately equal to the inward migration time of dust from irregular moons to the regions of Galilean satellites due to the PR drag, which can be estimated by Burns et al. (1979); Krivov et al. (2002)
| (12) |
Here is the initial semimajor axis of dust particles around Jupiter, and is the outer boundary of the influence zone of Callisto, which is about according to Haghighipour & Jewitt (2008). The variable is the exponential decay time Burns et al. (1979),
| (13) |
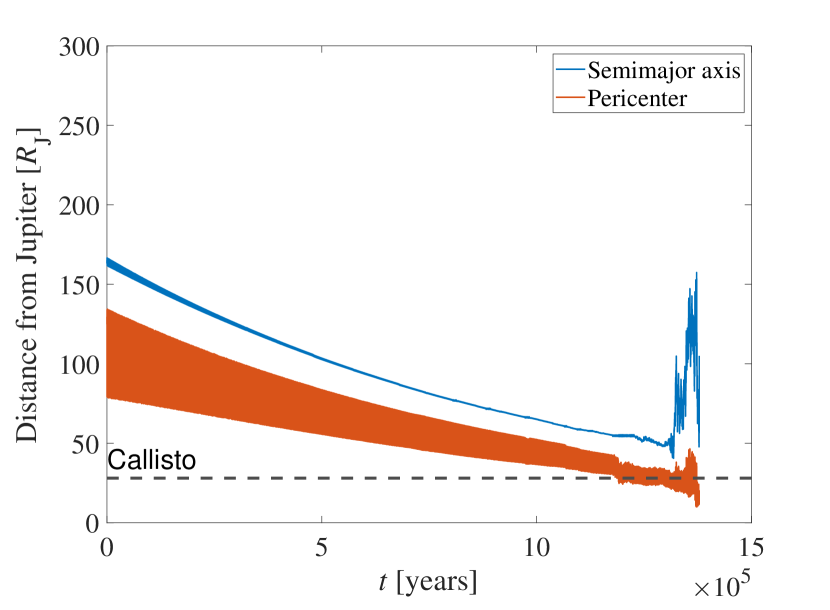
where is the heliocentric distance of dust particles in AU. The analytical estimations of for dust with the smallest () and the largest () initial semimajor axes used in our numerical simulations (see Table 2) are overplotted in Fig. 2 for comparison. Obviously, the analytical results estimated by Equation (12) for particles larger than m are basically consistent with the average dynamical lifetimes calculated from numerical simulations; while for particles smaller than m, Equation (12) cannot give satisfactory estimations of lifetimes because these small particles are subjected to stronger solar radiation pressure. Fig. 4 shows a typical evolution of semimajor axis and pericenter of a 10 m particle. The semimajor axis decays slowly due to the PR drag. After dust’s pericenter reachs the regions of Galilean satellites, the orbit of the grain becomes unstable under the gravitational perturbations of Galilean satellites and quickly hits a sink.
4.2 Dust’s final fate
Although the average dynamical lifetimes of dust particles ejected from four irregular satellite groups are close to each other, the final fates of grains, which are summarized in Tables 3-6, are fairly different.
| Escape | Hit Jupiter | Hit Io | Hit Europa | Hit Ganymede | Hit Callisto | |
|---|---|---|---|---|---|---|
| 1 | 0.125 | 0.87 | 0.005 | 0 | 0 | 0 |
| 2 | 0.355 | 0.365 | 0.025 | 0.145 | 0.025 | 0.085 |
| 3 | 0.26 | 0.015 | 0.015 | 0.125 | 0.14 | 0.445 |
| 4 | 0.24 | 0.06 | 0.01 | 0.075 | 0.12 | 0.495 |
| 5 | 0.385 | 0.145 | 0.005 | 0.045 | 0.07 | 0.35 |
| 7.5 | 0.115 | 0.095 | 0.01 | 0.14 | 0.2 | 0.44 |
| 10 | 0.125 | 0.045 | 0.005 | 0.095 | 0.235 | 0.495 |
| 25 | 0.155 | 0.045 | 0.005 | 0.105 | 0.13 | 0.56 |
| 50 | 0.205 | 0.025 | 0 | 0.095 | 0.2 | 0.475 |
| 100 | 0.165 | 0.03 | 0.01 | 0.135 | 0.175 | 0.485 |
| 300 | 0.17 | 0.025 | 0.01 | 0.11 | 0.235 | 0.45 |
| 500 | 0.12 | 0.045 | 0 | 0.055 | 0.18 | 0.6 |
| Escape | Hit Jupiter | Hit Io | Hit Europa | Hit Ganymede | Hit Callisto | |
|---|---|---|---|---|---|---|
| 1 | 0.9 | 0.085 | 0 | 0.005 | 0.01 | 0 |
| 2 | 0.31 | 0.445 | 0 | 0 | 0.115 | 0.13 |
| 3 | 0.05 | 0.095 | 0 | 0 | 0.22 | 0.635 |
| 4 | 0 | 0.02 | 0.005 | 0 | 0.115 | 0.86 |
| 5 | 0.005 | 0.005 | 0 | 0 | 0.065 | 0.925 |
| 7.5 | 0 | 0 | 0 | 0 | 0.035 | 0.965 |
| 10 | 0 | 0 | 0 | 0 | 0.045 | 0.955 |
| 25 | 0 | 0 | 0 | 0 | 0.01 | 0.99 |
| 50 | 0 | 0 | 0 | 0 | 0.01 | 0.99 |
| 100 | 0 | 0 | 0 | 0 | 0.005 | 0.995 |
| 300 | 0 | 0 | 0 | 0 | 0.015 | 0.985 |
| 500 | 0 | 0 | 0 | 0 | 0.005 | 0.995 |
| Escape | Hit Jupiter | Hit Io | Hit Europa | Hit Ganymede | Hit Callisto | |
|---|---|---|---|---|---|---|
| 1 | 0.805 | 0.195 | 0 | 0 | 0 | 0 |
| 2 | 0.34 | 0.175 | 0 | 0.01 | 0.2 | 0.275 |
| 3 | 0.2 | 0 | 0 | 0 | 0.045 | 0.755 |
| 4 | 0.08 | 0.005 | 0 | 0 | 0.015 | 0.9 |
| 5 | 0.03 | 0 | 0 | 0 | 0.01 | 0.96 |
| 7.5 | 0 | 0.005 | 0 | 0 | 0 | 0.995 |
| 10 | 0.01 | 0.01 | 0 | 0 | 0 | 0.98 |
| 25 | 0.01 | 0.005 | 0 | 0 | 0.005 | 0.98 |
| 50 | 0.015 | 0 | 0 | 0 | 0 | 0.985 |
| 100 | 0 | 0 | 0 | 0 | 0.01 | 0.99 |
| 300 | 0.005 | 0 | 0 | 0 | 0.005 | 0.99 |
| 500 | 0.005 | 0 | 0 | 0 | 0.005 | 0.99 |
| Escape | Hit Jupiter | Hit Io | Hit Europa | Hit Ganymede | Hit Callisto | |
|---|---|---|---|---|---|---|
| 1 | 0.785 | 0.215 | 0 | 0 | 0 | 0 |
| 2 | 0.45 | 0.105 | 0 | 0. | 0.16 | 0.285 |
| 3 | 0.22 | 0.045 | 0 | 0 | 0.125 | 0.61 |
| 4 | 0.155 | 0.035 | 0 | 0 | 0.065 | 0.745 |
| 5 | 0.11 | 0.015 | 0 | 0 | 0.025 | 0.85 |
| 7.5 | 0.08 | 0.01 | 0 | 0 | 0.04 | 0.87 |
| 10 | 0.08 | 0.015 | 0 | 0 | 0.03 | 0.875 |
| 25 | 0.08 | 0.01 | 0 | 0 | 0.005 | 0.905 |
| 50 | 0.085 | 0 | 0 | 0 | 0.005 | 0.91 |
| 100 | 0.09 | 0.015 | 0 | 0 | 0.015 | 0.88 |
| 300 | 0.07 | 0.005 | 0 | 0 | 0.01 | 0.915 |
| 500 | 0.09 | 0.02 | 0 | 0 | 0.01 | 0.88 |
As analyzed in Section 4.1, 1 m particles are strongly affected by solar radiation pressure and quickly hit the planet or escape from the Jovian system. Generally, when particles are small (m), the fractions of dust particles that impact Jupiter and flee the Jovian system decrease as the grain size increases, because the effect of solar radiation pressure decreases. For particles from the Carme and Ananke groups, these fractions drop to almost zero as the grain size increases to 5 m; while for large particles (m) from the Pasiphae and the Himalia families, the sums of the two fractions are approximately 10 and 20, respectively, regardless of the grain size.
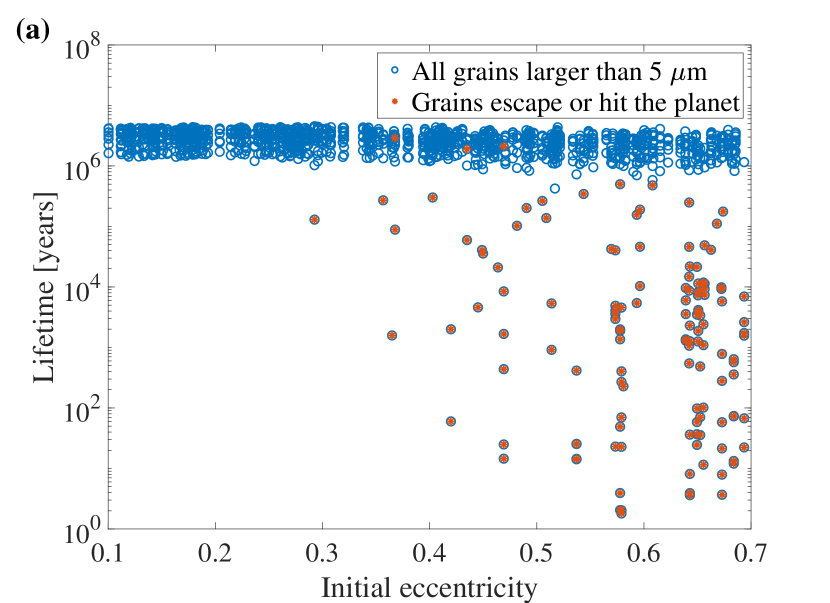
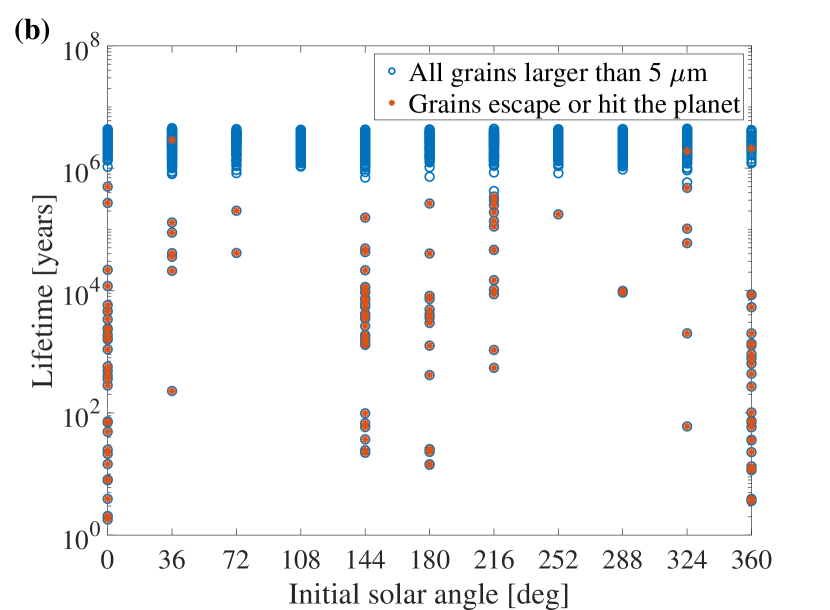
For large particles (m) from the Pasiphae family, the relations between the dynamical lifetimes of dust and their initial eccentricities and solar angles , are shown in Fig. 5, where is approximately the angle between the radius vectors from Jupiter to the Sun and to the pericenter of dust (Hamilton, 1993). Most of the particles that escape from the Jovian system or impact Jupiter are short-lived, with large initial eccentricities and initial solar angles close to or . This can be understood through the conserved integral of the dust’s motion derived by Hamilton & Krivov (1996). For large particles from the Pasiphae group, solar gravity is the dominant perturbation, and thus the integral of motion, known as the “Hamiltonian”, is written as
| (14) |
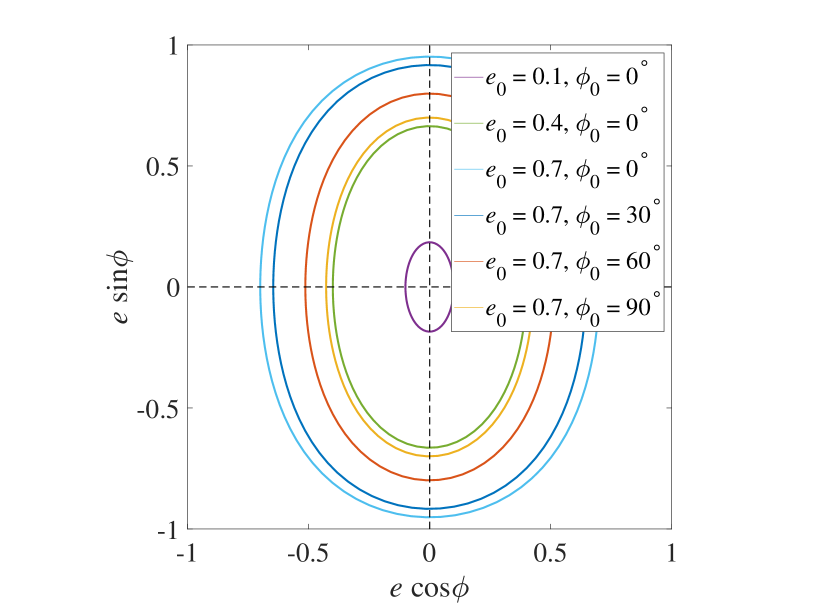
where is the parameter describes the strength of solar gravity. Based on the conserved “Hamiltonian”, the subsequent evolution of the solar angle and eccentricity for any given initial value can be followed analytically, as shown in Fig. 6. The orbit of dust with large initial eccentricity and initial solar angle near or gets the largest eccentricity close to 1 under the perturbation of solar gravity, which results in the escape from the Jupiter system or collision with the Jupiter.
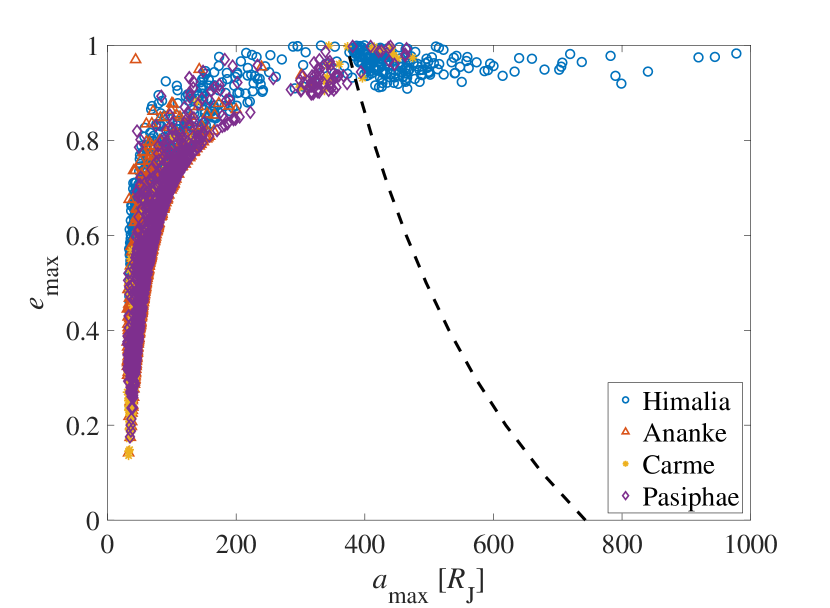
Unlike the dust from the retrograde Pasiphae family, the reason for large particles from the prograde Himalia group to hit the planet or be expelled is the gravitational perturbations induced by Galilean satellites rather than their initial orbital elements. Fig. 7 shows the maximum semimajor axes and eccentricities of all the large particles (m) from four satellite families after their pericenters reach the regions of Galilean satellites. Compared to the retrograde satellite ejecta, dust grains from the prograde Himalia group are much more easily excited into extremely eccentric and remote orbit by encounter with the Galilean moons, which leads to escape from the Jovian system or impact Jupiter. This difference between the stabilities of retrograde and prograde satellite ejecta was also shown in the results of Bottke et al. (2013) and Haghighipour & Jewitt (2008).
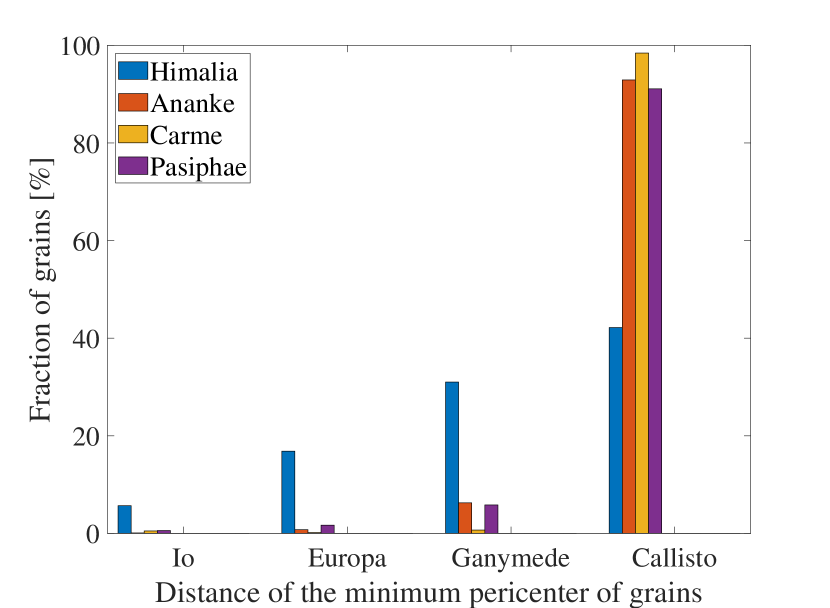
The collision probabilities with the four Galilean satellites for dust from the prograde and retrograde satellite families also vary significantly. Dust from the retrograde families of satellites is hard to hit Io and Europa regardless of the grain size, where the fractions are only 0.005 and 0.015 for particles hitting these two moons in our numerical simulations, respectively. In general, most of the retrograde satellite ejecta collide with Callisto ( for particles larger than a few micrometers), and the survivors that bypass Callisto are mainly swept up by Ganymede. For dust from the prograde Himalia family, the opportunities to hit the four Galilean moons are about 1, 10, 20 and 50, respectively. Here the different collision probabilities of dust from the prograde and retrograde irregular moons with the Galilean satellites are investigated by analyzing the minimum pericenters of dust particles after they reach the territories of Galilean moons, because the collision is only possible when the particle’s orbital pericenter is smaller than the moon’s semimajor axis. As shown in Fig. 8, more than 90 of the initial retrograde dust’s minimum pericenters can only reach the distance between Callisto and Ganymede, and very a few particles can get inside the orbits of Io and Europa (0.5 and 1, respectively); while for grains from the prograde Himalia family, the fractions of the minimum pericenters located at four intervals are 5, 16, 31 and 42. In fact, this is still the consequence of the stability distinction induced by the gravitational perturbations of Galilean satellites, which implies the different mechanism for dust striking the Galilean moons, i.e., dust particles from the prograde satellites hit the Galilean moons by getting into unstable orbit, while dust particles from the retrograde moons are slowly drifting by PR drag. Based on our result, the gravitational perturbations of Io and Europa which are neglected in our simulation have an influence on the evolution of only a small fractions of dust from the prograde Himalia family.
4.3 Number density in the Jovian system
Integrating the trajectories of dust particles over their initial size distribution, the steady-state number density of dust ejected from Jupiter’s irregular moons can be estimated as follows. The Circum-Jovian region is first divided into a cylindrical grid system with each grid cell indexed by , and . Then the points in the dust’s trajectory, which are stored at equidistant time step , are used to count the number of times that the dust particles with grain size pass the grid cell (), which is expressed as . The readers are referred to Liu et al. (2016) for more details about the gridding and storage method. After some algebra, the estimation of number density of dust in the grid cell reads
|
|
(15) |
where is the volume of the grid cell, and is the number of simulated particles for each size. The result based on Equation (15) is presented in a rotating frame () that keeps the -axis pointing to the Sun, in order to observe the number density distribution relative to the Sun. The -axis of the frame is normal to the Jovian orbital plane, and the -axis is completed by right-hand rule.
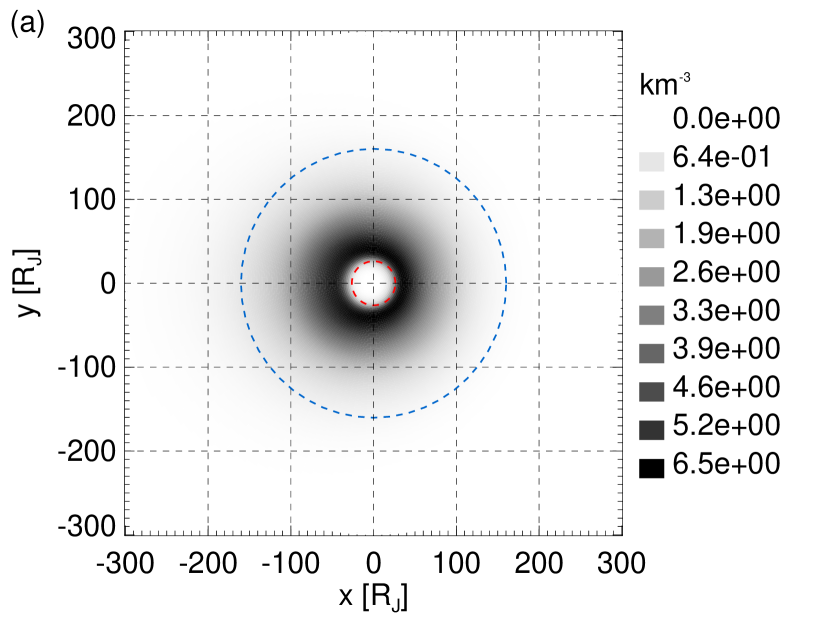
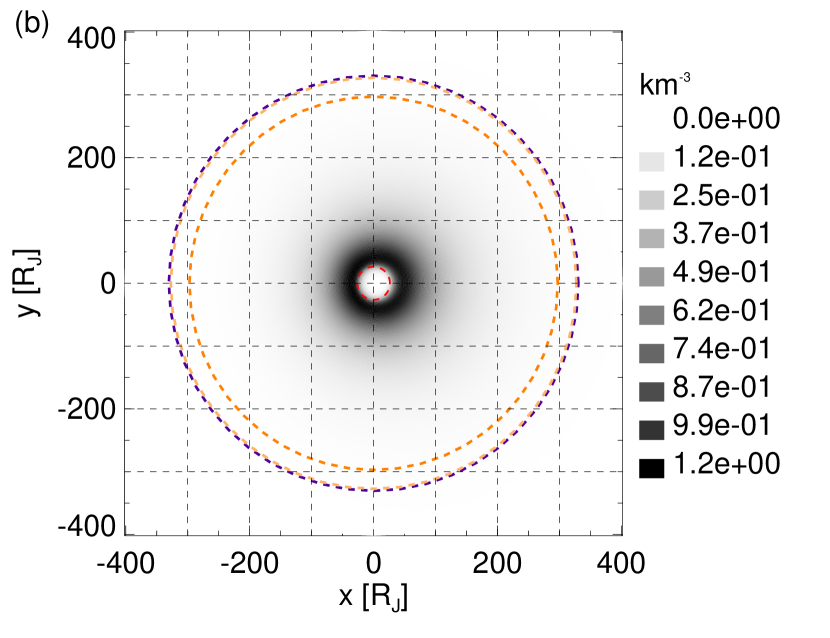
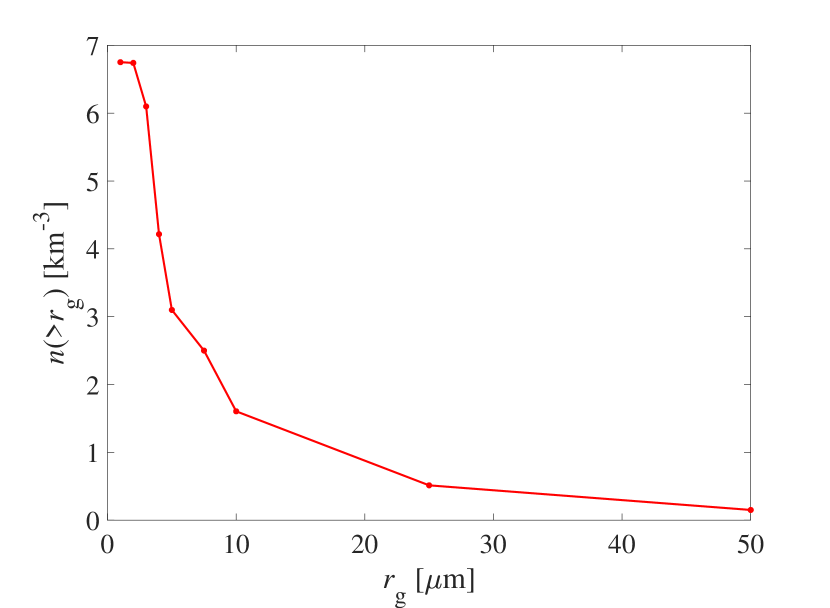
As shown in Fig. 9, dust particles from irregular satellites form a torus in the radial range of about , with inner edge close to Callisto’s orbit due to the sweeping effect of Galilean satellites. The average number density of this torus is calculated (averaged over the radial range of , the vertical range of , and the azimuthal angle range of []), which is about (see Table 7). The distribution of prograde satellite ejecta is shifted away from the Sun, while it is offset toward the Sun for dust from the retrograde satellites (see Fig. 9). The reason for this difference is explained as follows. As shown in Fig. 10, the cumulative number density of the torus shows a rapid decrease between 2 and 25 m, which indicates the predominance of particles in this size range. According to the same analytical theory applied in Section 4.2, dust particles from the prograde Himalia family in the range of m get the largest eccentricity when the solar angle equals to zero under the effect of solar radiation pressure and solar gravity; while for initial retrograde particles, the orbits become most eccentric when the solar angle is between and Hamilton & Krivov (1996). As a consequence, prograde and retrograde satellite ejecta show different distribution trends relative to the Sun.
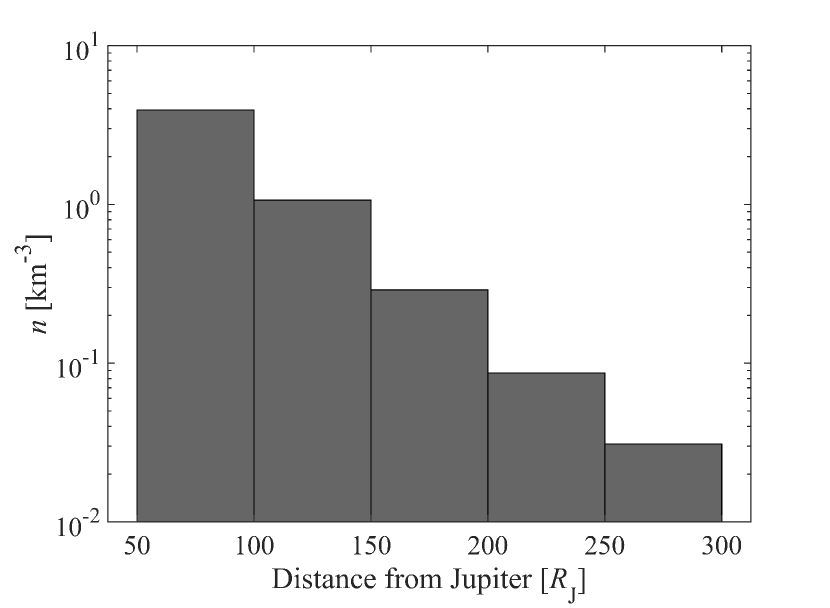
The average number density of dust from Jupiter’s irregular satellites derived from our numerical simulation (Fig. 11) is lower than the number density in the outer region of the Jovian system estimated by Krivov et al. (2002) based on the data obtained by the Dust Detection System (DDS) onboard the Galileo spacecraft. The result by Krivov et al. (2002) has a nearly flat number density profile between 50 and 300 , which is about a level of . Our result shows that the number density between 50 and 100 is about , and decreases as the distance from Jupiter increases. In fact, a declining radial profile of number density of dust from Jupiter’s irregular satellites is reasonable since the inward migration caused by PR drag decelerates as the dust moves close to the planet, which means that dust particles spend longer time in the region closer to Jupiter. The difference in the number density profile may indicates that dust particles from other source bodies also contribute to the number density in the outer region of the Jovian system, or may simply attribute to the uncertainties of our modelling or the processing of the DDS data, or both.
4.4 Impact sites and accretion of dust on Callisto’s surface
To further investigate the connection between the irregular satellites and the properties of the surfaces of Galilean satellites, the impact sites of dust are also recorded in our numerical simulations.
The orbits of the Galilean satellites are precessing during the numerical integration. Given that the Galilean satellites are tidally locked, a satellite-centered frame () that keeps the -axis pointing to the planet is used for calculating the impact sites of dust. The -axis of the frame is along the spin axis of the satellite, and the -axis is completed by right-hand rule and points to the direction of the moon’s motion. The longitudes and the latitudes of the impact sites of dust are recorded in the frame. Considering that most of the dust grains are cleared by Callisto in our simulation (see Section 4.2) and that the characteristics of the surfaces of other three Galilean moons are strongly affected by other factors, including the more active geological activity Lopes (2014); Jia et al. (2018); Ligier et al. (2019) and the more complicated environment Bagenal & Dols (2020); Paranicas et al. (2009); Ligier et al. (2019), only the impact sites of dust on Callisto’s surface are reported here. As shown in Fig. 12, the impact sites of dust ejected from the retrograde families of satellites are concentrated on the longitude between and , i.e., the leading hemisphere of Callisto; while dust from the prograde Himalia group are nearly uniformly distributed on the whole surface of Callisto. This difference of distribution comes from the different collision mechanisms between the dust from retrograde and prograde satellites (see Section 4.2).
Previous studies have shown that the leading hemisphere of Callisto is darker than its trailing hemisphere Bagenal et al. (2007), and the compositions of these two hemispheres are different Hibbitts et al. (2000); Cartwright et al. (2020). But the research about the composition of Jupiter’s irregular satellites’ surface is limited Brown & Rhoden (2014); Bhatt et al. (2017); Grav & Holman (2004); Grav et al. (2015), especially the retrograde moons, that we cannot directly assert from our result that the leading-trailing asymmetry of Callisto’s surface is contributed by dust from the irregular satellites. Nevertheless, our result provides an important clue to the study of the hemispherical asymmetry of Callisto.
The number of particles from Jupiter’s irregular satellites captured by Callisto per unit time reads (Kortenkamp & Dermott, 1998)
| (16) |
Here is the effective capture cross-section of Callisto, is the number density of particles near Callisto, and is the relative speed between dust and Callisto.
The effective capture cross-section of Callisto is calculated by considering the effect of gravitational focusing by the moon, which was given by Öpik (1951)
| (17) |
where and are the radius and escape velocity of Callisto, respectively.
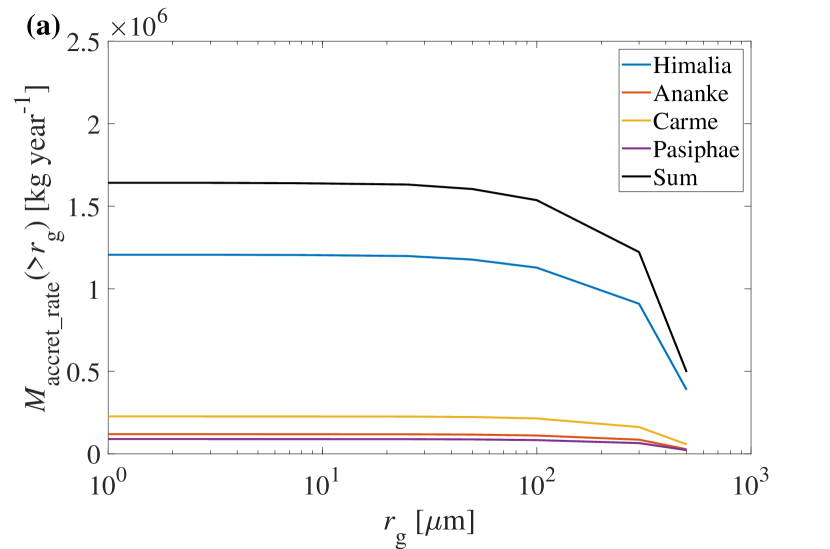
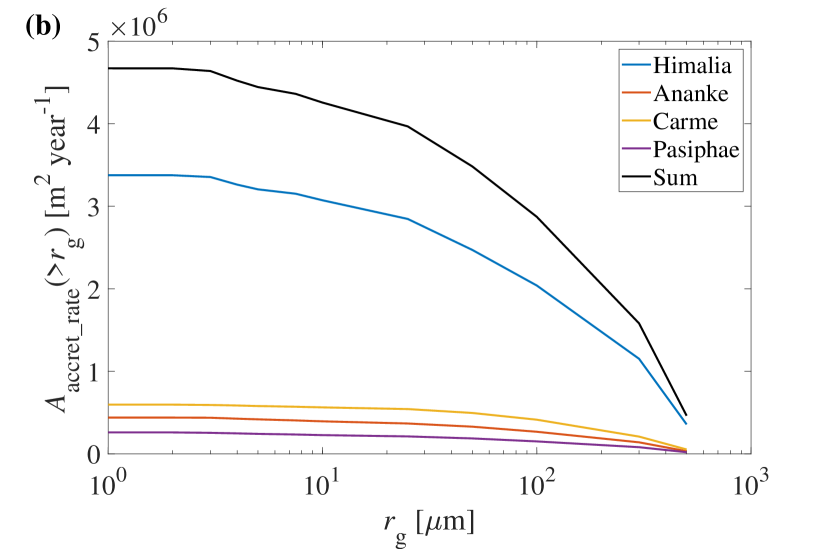
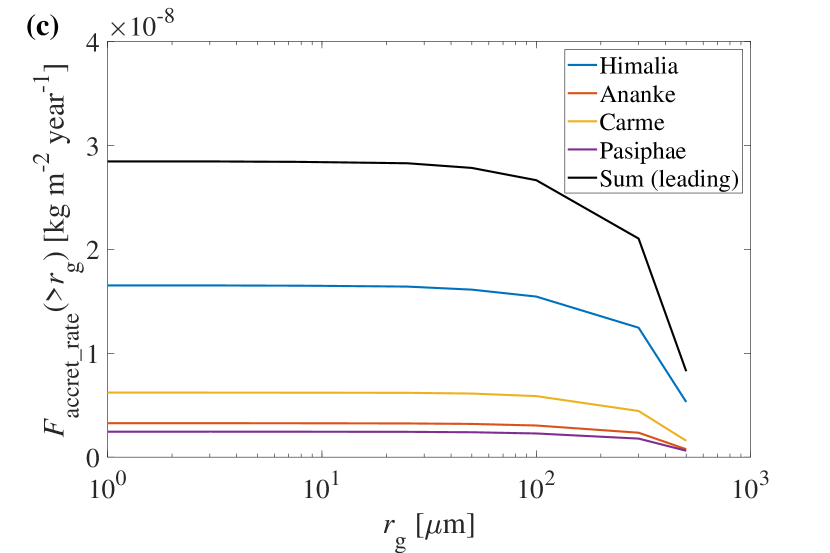
Considering the contributions from dust particles of all grain sizes, the mass accretion rate and the cross-sectional area influx of dust particles on Callisto are calculated by
| (18) |
| (19) |
Besides, the mass influx density that quantifies the mass of dust accreted by Callisto per unit surface area and per unit time is roughly estimated. For dust particles from the prograde Himalia family, because these particles are nearly uniformly distributed on the whole surface of Callisto; while for dust particles from the three retrograde families, because these particles are only distributed on the leading hemisphere of Callisto (see Figure 12).
The cumulative distributions of the mass accretion rate , cross-sectional area influx and mass influx density of dust from Jupiter’s irregular satellites on Callisto are shown in Fig. 13. The total and on Callisto are about and , respectively. On the leading hemisphere of Callisto, is about , and on the trailing hemisphere of Callisto, it is about . It can be easily seen that the values of , and of dust from the prograde Himalia family on Callisto are much higher than those from the three retrograde families of satellites. For each irregular satellite family, large dust particles contribute more to , and . Especially, for and , particles larger than m are dominant.
4.5 If there is a ring?
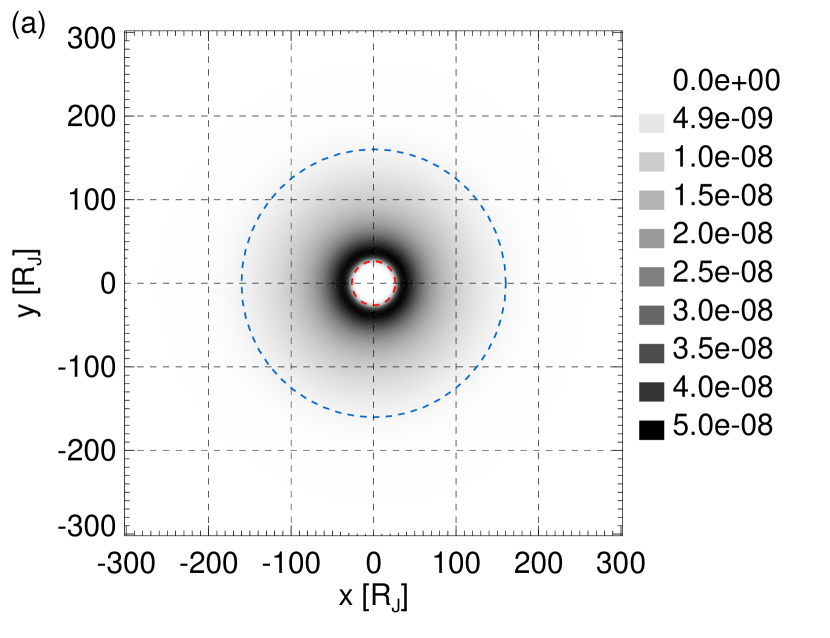
The geometric optical depth of the torus outside the orbit of Callisto formed by the grains from irregular satellites is obtained by dividing the total cross-sectional area of all particles that are present in the grid by the surface area of the cell in the line-of-sight, which reads
|
|
(20) |
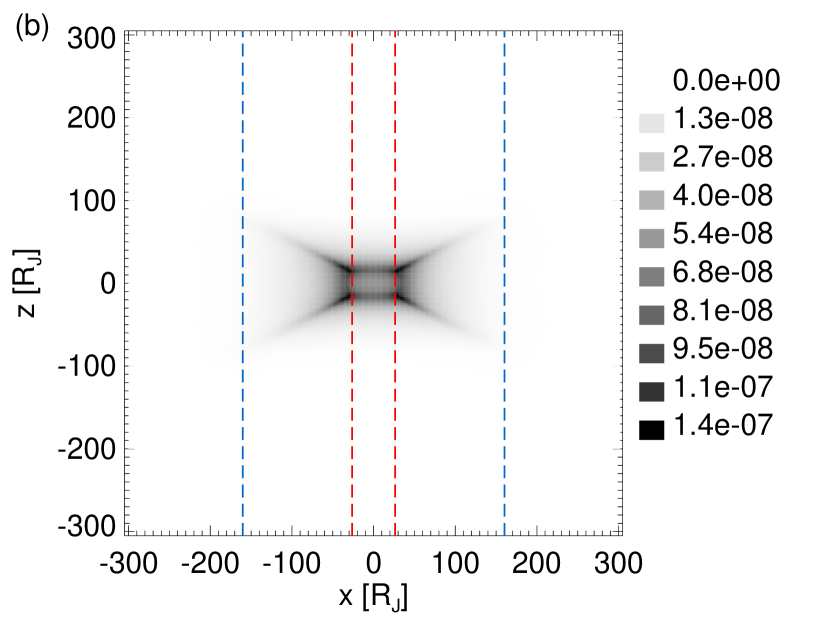
The simulation results of the geometric optical depth are also shown in (Fig. 14). The normal geometric optical depth of the torus decreases as the distance from Jupiter increases, the average value of which over the brightest region is about (Table 7). When viewed toward the positive direction of the -axis, the average edge-on geometric optical depth in the region of is about (Table 7), which is comparable with Phoebe ring’s edge-on optical depth Verbiscer et al. (2009). The upper and lower edges of ring ansae are the brightest in the edge-on view, which is similar to Jupiter’s gossamer rings Burns et al. (1999); Showalter et al. (2008).
This ring outside Callisto’s orbit formed by the dust from Jupiter’s irregular satellites is probably observable. Because its geometric optical depth is on the order of observable magnitude, and its radial profile of number density is similar to that of the observed Phoebe ring Tamayo et al. (2016), which also declines from the outermost regular moon Iapetus to the irregular satellites region.
The contributions of dust from different irregular satellite families to the ring are calculated (see Table 7). It is found that dust particles from the prograde Himalia family are dominant in the ring, and their contributions to the ring (including the ring’s average number density, normal and edge-on geometric optical depths) are about one order of magnitude higher than the sum of those of the three retrograte satellite families.
| Himalia | Ananke | Carme | Pasiphae | Sum | |
|---|---|---|---|---|---|
| 5.7E0 | 4.1E-1 | 2.7E-1 | 4.2E-1 | 6.8E0 | |
| 4.0E-8 | 2.3E-9 | 1.5E-9 | 1.6E-9 | 4.5E-8 | |
| 5.6E-8 | 3.5E-9 | 2.9E-9 | 2.8E-9 | 6.5E-8 |
5 Summary
In this paper, we analyze the "life" of dust particles ejected from the irregular satellites of Jupiter by the impact of interplanetary micrometeoroids, including their birth, dynamical evolution, sink, and steady-state spatial distribution. The production rates of dust from four satellite families are calculated, and the initial size distribution of dust is obtained. The high-accuracy numerical integration of the dynamical equation of dust is performed. The trajectories of dust, with 12 grain sizes in the range m and 200 different initial orbits for each size, are simulated until they hit a sink (impact the Galilean satellites, Jupiter or escape from the Jovian system). By integrating the trajectories of dust over their initial size distribution, the spatial number density and the geometric optical depth are estimated. Combined with the analytical theory, our results are summarized as follows,
(1) The mass production rate of Jupiter’s prograde irregular satellite family, the Himalia family, is higher than those of the retrograde families, because of the stronger effect of gravitational focusing by Jupiter on the impactor in the Himalia region and the larger cross-section suffered to impact of the Himalia family.
(2) The average dynamical lifetimes of small particles rely on the strengths of solar radiation pressure and solar gravity. Especially, particles smaller than 2 m have a short life because of the strong influence induced by solar radiation pressure. For dust larger than a few micrometers, its dynamical lifetime is approximately equal to the inward migration time due to the PR drag.
(3) The orbital eccentricities of large dust particles (m) from the Pasiphae family with initial eccentricities larger than 0.4 and initial solar angles close to or get close to 1 under the perturbation of solar gravity, which leads to collide with Jupiter or escape from the Jovian system.
(4) As the dust migrates to the regions of Galilean satellites, dust particles from the prograde Himalia family become more unstable than that from the retrograde groups due to the gravitational perturbations of Galilean satellites. As a result, there are still approximately 20 initial prograde particles that impact Jupiter or escape from the Jovian system when the grain size is large, and the opportunities to hit the four Galilean moons for dust particles from the prograde satellites are about 1, 10, 20 and 50 respectively; while almost all of dust particles from the retrograde satellites collide with Callisto.
(5) The steady-state number density of dust from Jupiter’s irregular satellites in the Jovian system is estimated. Dust particles originating from Jupiter’s irregular moons gather into a torus outside the orbit of Callisto. The average number density of the torus is about . The appearance of torus is shifted away from the Sun for particles from the prograde irregular moons; while it is offset toward the Sun for retrograde satellite ejecta.
(6) The impact sites of dust from the prograde family (Himalia family) are nearly uniformly distributed on the whole surface of Callisto; while those of dust from the three retrograde families (Ananke, Carme, and Pasiphae families) are centered on the leading hemisphere of Callisto. The distribution of the impact sites of dust from retrograde irregular satellites provides an important clue for understanding the leading-trailing asymmetry of Callisto’s surface.
(7) The mass accretion rate, cross-sectional area influx and mass influx density of dust from Jupiter’s irregular satellites on Callisto are estimated. The total mass accretion rate of dust on Callisto is about , and the total cross-sectional area influx on Callisto is about . The total mass influx density are about and on Callisto’s leading hemisphere and trailing hemisphere, respectively. Compared to Jupiter’s retrograde families, dust particles from the prograde Himalia family contribute more to the total values of the mass accretion rate, cross-sectional area influx and mass influx density on Callisto. For each irregular satellite family, large dust particles contribute more to the mass accretion rate, cross-sectional area influx and mass influx density on Callisto.
(8) There is probably an observable ring outside Callisto’s orbit which consists of the dust ejected from Jupiter’s irregular satellites. The ring is brightest in the radial range of about and dominated by dust particles in the size range of m. The average normal geometric optical depth of the ring is about , and the average edge-on geometric optical depth is about . The upper and lower edges of ring ansae are the brightest in the edge-on view, which is similar to that of the Jupiter’s gossamer rings. Dust particles from the prograde Himalia family are dominant in the ring, and their contributions to the ring (including the ring’s average number density, normal and edge-on geometric optical depths) are much larger than the sum of those of the three retrograte satellite families.
Acknowledgements
This work was supported by the National Natural Science Foundation of China (No. 12002397, 12311530055, and 62388101), the National Key R&D Program of China (No. 2020YFC2201202 and 2020YFC2201101), and by the Shenzhen Science and Technology Program (Grant No. ZDSYS20210623091808026).
Data Availability
The basic data of this work will be shared on reasonable request to the corresponding author.
References
- Archinal et al. (2018) Archinal B., et al., 2018, Celestial Mechanics and Dynamical Astronomy, 130, 1
- Bagenal & Dols (2020) Bagenal F., Dols V., 2020, Journal of Geophysical Research: Space Physics, 125, e2019JA027485
- Bagenal et al. (2007) Bagenal F., Dowling T. E., McKinnon W. B., 2007, Jupiter: the planet, satellites and magnetosphere. Cambridge University Press
- Bhatt et al. (2017) Bhatt M., Reddy V., Schindler K., Cloutis E., Bhardwaj A., Corre L., Mann P., 2017, Astronomy & Astrophysics, 608, A67
- Bottke et al. (2013) Bottke W. F., Vokrouhlickỳ D., Nesvornỳ D., Moore J. M., 2013, Icarus, 223, 775
- Brown & Rhoden (2014) Brown M., Rhoden A., 2014, The Astrophysical Journal Letters, 793, L44
- Brozović & Jacobson (2017) Brozović M., Jacobson R. A., 2017, The Astronomical Journal, 153, 147
- Burns et al. (1979) Burns J. A., Lamy P. L., Soter S., 1979, Icarus, 40, 1
- Burns et al. (1999) Burns J. A., Showalter M. R., Hamilton D. P., Nicholson P. D., Pater I. d., Ockert-Bell M. E., Thomas P. C., 1999, Science, 284, 1146
- Carry (2012) Carry B., 2012, Planetary and Space Science, 73, 98
- Cartwright et al. (2020) Cartwright R. J., Nordheim T. A., Cruikshank D. P., Hand K. P., Roser J. E., Grundy W. M., Beddingfield C. B., Emery J. P., 2020, The Astrophysical Journal Letters, 902, L38
- Durante et al. (2020) Durante D., et al., 2020, Geophysical Research Letters, 47, e2019GL086572
- Emelyanov (2005) Emelyanov N. V., 2005, Astronomy & Astrophysics, 438, L33
- Grav & Holman (2004) Grav T., Holman M. J., 2004, The Astrophysical Journal, 605, L141
- Grav et al. (2015) Grav T., Bauer J. M., Mainzer A. K., Masiero J. R., Nugent C. R., Cutri R. M., Sonnett S., Kramer E., 2015, The Astrophysical Journal, 809, 3
- Haghighipour & Jewitt (2008) Haghighipour N., Jewitt D., 2008, The Astronomical Journal, 136, 909
- Hamilton (1993) Hamilton D. P., 1993, Icarus, 101, 244
- Hamilton & Krivov (1996) Hamilton D. P., Krivov A. V., 1996, Icarus, 123, 503
- Hamilton et al. (2015) Hamilton D. P., Skrutskie M. F., Verbiscer A. J., Masci F. J., 2015, Nature, 522, 185
- Hibbitts et al. (2000) Hibbitts C., McCord T., Hansen G., 2000, Journal of Geophysical Research: Planets, 105, 22541
- Horányi et al. (2015) Horányi M., Szalay J., Kempf S., Schmidt J., Grün E., Srama R., Sternovsky Z., 2015, Nature, 522, 324
- Housen & Holsapple (2011) Housen K. R., Holsapple K. A., 2011, Icarus, 211, 856
- Jia et al. (2018) Jia X., Kivelson M. G., Khurana K. K., Kurth W. S., 2018, Nature Astronomy, 2, 459
- Kortenkamp & Dermott (1998) Kortenkamp S. J., Dermott S. F., 1998, Icarus, 135, 469
- Koschny & Grün (2001a) Koschny D., Grün E., 2001a, Icarus, 154, 391
- Koschny & Grün (2001b) Koschny D., Grün E., 2001b, Icarus, 154, 402
- Krivov et al. (2002) Krivov A. V., Wardinski I., Spahn F., Krüger H., Grün E., 2002, Icarus, 157, 436
- Krivov et al. (2003) Krivov A. V., Sremčević M., Spahn F., Dikarev V. V., Kholshevnikov K. V., 2003, Planetary and Space Science, 51, 251
- Ligier et al. (2019) Ligier N., Paranicas C., Carter J., Poulet F., Calvin W., Nordheim T., Snodgrass C., Ferellec L., 2019, Icarus, 333, 496
- Liu & Schmidt (2018) Liu X., Schmidt J., 2018, Astronomy & Astrophysics, 609, A57
- Liu & Schmidt (2021) Liu X., Schmidt J., 2021, Monthly Notices of the Royal Astronomical Society, 500, 2979
- Liu et al. (2016) Liu X., Sachse M., Spahn F., Schmidt J., 2016, Journal of Geophysical Research: Planets, 121, 1141
- Lopes (2014) Lopes R. M., 2014, in , Encyclopedia of the solar system. Elsevier, pp 779–792
- Öpik (1951) Öpik E. J., 1951, in Proceedings of the Royal Irish Academy. Section A: Mathematical and Physical Sciences. pp 165–199
- Paranicas et al. (2009) Paranicas C., Cooper J., Garrett H., Johnson R., Sturner S., 2009, Europa, pp 529–544
- Poppe (2016) Poppe A. R., 2016, Icarus, 264, 369
- Showalter et al. (2008) Showalter M. R., de Pater I., Verbanac G., Hamilton D. P., Burns J. A., 2008, Icarus, 195, 361
- Soja et al. (2015) Soja R., Hamilton D., Altobelli N., 2015, Planetary and Space Science, 109, 76
- Spahn et al. (2006) Spahn F., et al., 2006, Planetary and Space Science, 54, 1024
- Tamayo et al. (2016) Tamayo D., Markham S. R., Hedman M. M., Burns J. A., Hamilton D. P., 2016, Icarus, 275, 117
- Verbiscer et al. (2009) Verbiscer A. J., Skrutskie M. F., Hamilton D. P., 2009, Nature, 461, 1098
- Vernazza et al. (2021) Vernazza P., et al., 2021, Astronomy & Astrophysics, 654, A56